Embed Size (px)
Citation preview

Critical Review 2014 Discussion:
Public Health and Components of Particulate Matter: The Changing Assessment of Black
Carbon
John G. WatsonDesert Research Institute, Reno, NV, USA
Presented at
Air & Waste Management AssociationAnnual Conference and Exhibition
Long Beach, CA
June 25, 2014

Objectives
• Note strengths and deficiencies of review
• Clarify BC formation and measurement processes
• Highlight some other useful reviews of the topic
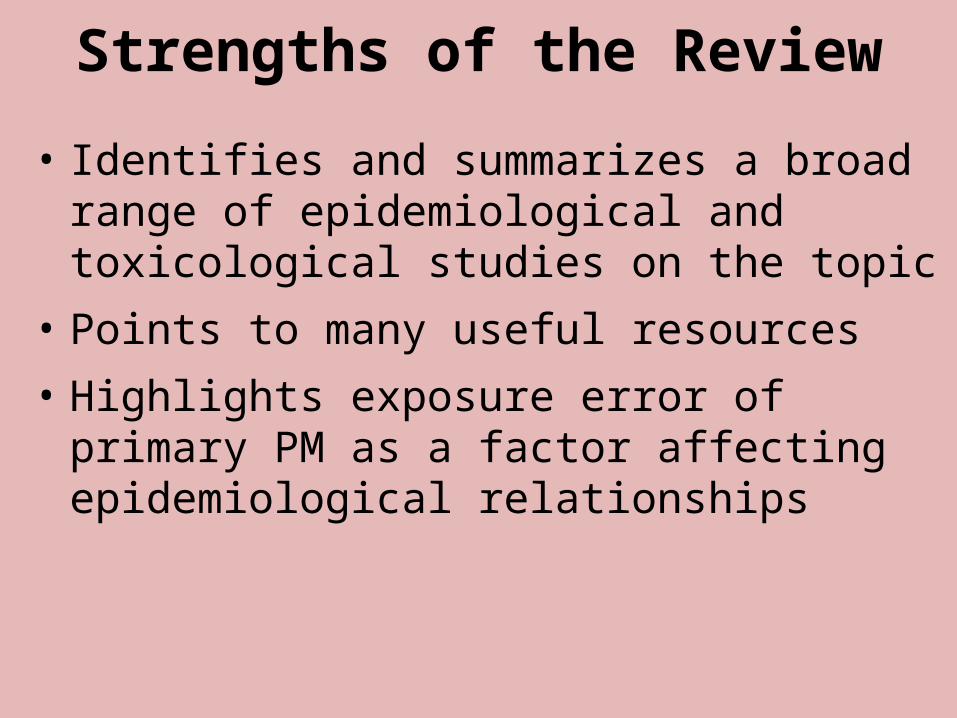
Strengths of the Review
• Identifies and summarizes a broad range of epidemiological and toxicological studies on the topic
• Points to many useful resources
• Highlights exposure error of primary PM as a factor affecting epidemiological relationships

Review Limitations• Previously published reviews are not evaluated and used as
a starting point. Much of the CR has already been published
• Overemphasizes BC in diesel engine exhaust. Solid fuel burning seems added as an afterthought
• Insufficient explanation and critical evaluation of uncertainties related to measurements, methodologies, and health end-points.
• Too much “so and so did this or that”, not enough “this study agrees or disagrees with that study because…”
• Although “BC and associated pollutants” is often said, a true multipollutant perspective is lacking
• EC and BC measurement method limitations and comparability, and their potential effects on health studies, are not addressed
• Didn’t answer the “so what?” question

Pure elemental carbon probably isn’t that harmful, and it isn’t always black
Diamond Graphite

Pure graphite is never found in the atmosphere. Soot derives from incomplete combustion with other pollutants. Soot is always a
combination of organic and elemental carbon, plus other contaminants.
Akhter et al., 1985, App. Spec.

Even some of the cleanest combustion processes have some soot emissions
(Courtesy of Doug Lawson, DOE National Renewable Energy Laboratory ww.cleanairinfo.com/slcf/agenda.htm)
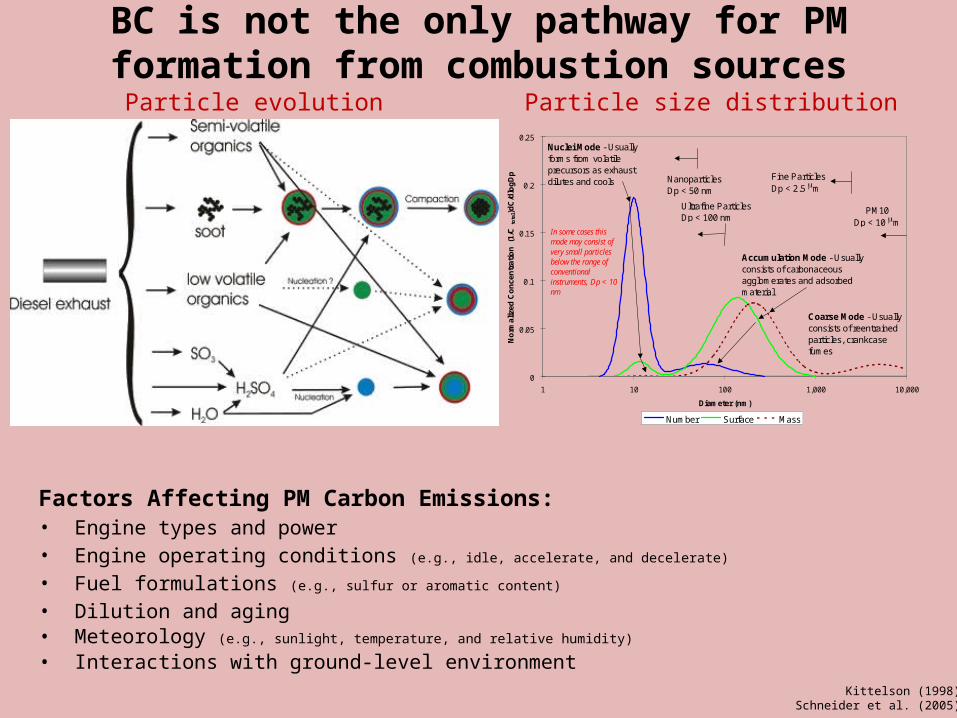
BC is not the only pathway for PM formation from combustion sources
Kittelson (1998)Schneider et al. (2005)
Factors Affecting PM Carbon Emissions: • Engine types and power• Engine operating conditions (e.g., idle, accelerate, and decelerate)
• Fuel formulations (e.g., sulfur or aromatic content)
• Dilution and aging• Meteorology (e.g., sunlight, temperature, and relative humidity)
• Interactions with ground-level environment
0
0.05
0.1
0.15
0.2
0.25
1 10 100 1,000 10,000
Diameter (nm)
No
rmal
ized
Co
nce
ntr
atio
n (
1/C
tota
l)dC
/dlo
gD
p
Number Surface Mass
Fine ParticlesDp < 2.5 m
Ultrafine ParticlesDp < 100 nm
NanoparticlesDp < 50 nm
Nuclei Mode - Usually forms from volatile precursors as exhaust dilutes and cools
Accumulation Mode - Usually consists of carbonaceous agglomerates and adsorbed material
Coarse Mode - Usually consists of reentrained particles, crankcase fumes
PM10Dp < 10 m
In some cases this mode may consist of very small particles below the range of conventional instruments, Dp < 10 nm
Particle evolution Particle size distribution

Biomass burningDust
Acetylene soot
Diesel soot
PALAS arc generator soot
Not all light absorbing carbon is black, nor are all light absorbers made of carbon

Instruments Operating principle Observables Avg time
Dual wavelength Aethalometer (370, 880 nm)
Filter-based light attenuation Light absorption (Mm-1) or BC (μg/m3)
5 min
Seven color Aethalometer (370, 450, 571, 615, 660, 880, and 950 nm)
Filter-based light attenuation Light absorption (Mm-1) or BC (μg/m3)
5 min
Particle Soot Absorption Photometer (PSAP; 467, 530,and 660 nm)
Filter-based light attenuation Light absorption (Mm-1) or BC (μg/m3)
5 min
Multi Angle Absorption Photometer (MAAP; 670 nm)
Filter-based light attenuation with compensating light scattering effects
Light absorption (Mm-1) or BC (μg/m3)
5 min
DMT Photoacoustic (405, 532, and 781 nm)
Light absorption of particles in air based on heating and cooling that creates a sound wave
Light absorption (Mm-1) or BC (μg/m3)
5 min
Sunset carbon analyzer (660 nm)
Thermal/optical transmittance (TOT; NISOH 5040 protocol)
EC and OC (μg/m3) and optical BC (µg/m3)
1-24 hour
R&P 5400 carbon analyzer Thermal OC/EC at 275 C and 750 C
EC and OC (μg/m3) 1 hour
PAS 2000 PAH monitor Photoionization Particle bound PAH (fA) 5 min
DRI carbon analyzer (633 nm)
Thermal/optical reflectance (TOR; IMPROVE_A protocol)
EC and OC (μg/m3) 1-24 hr
BC is inferred from light absorption measurements, while EC is determined by thermal measurements with some optical corrections
(Light absorbing carbon is wavelength dependent)
Chow et al. (2009)

Light absorption to BC conversion factors are derived from comparisons with EC measurements
0
20
40
60
80
100
120
140
100 200 300 400 500 600 700 800 900 1000
Lig
ht
Ab
sorp
tio
n E
ffic
ien
cy
(m2
g-1
)
Wavelength (nm)
Smoldering Biomass
Diesel Exhaust
Flaming Biomass
(EC absorption efficiency varies by source and wavelength)
OC/EC split λ

BC (light absorption) and EC are highly correlated, but the relationship depends on sampling, analysis, and particle
properties (size, shape, and composition)
Teflon membrane filter samples from Denver
Quartz fiber filter samples from Denver
Chow et al., 2011, JAWMA

BC correlates with most other pollutants, and not only for nearby engine exhaust
Fresno winter 2002-2003
Fresno summer 2003-2004
Watson et al, 2006, JAWMA
BC

The BC content of diesel exhaust is highly variable, and it is decreasing as newer technology penetrates the fleet
23050 LVOnRDIE
23075 LVOnRDIEs
3518 PHDIES
322062.5
322072.5
3913 NWHDc
n/a HDD
n/a MDD
3912 NWLDCPC
321042.5
n/a PEN_C
23051 LVOffRDIE
100 80 60 40 20 0 20 40 60 80 100
On-Road - Diesel (Winter)
On-Road - Diesel (Summer)
On-Road - Heavy-Duty Diesel
On-Road - Heavy-Duty Diesel
On-Road - Heavy-Duty Diesel
On-Road - Heavy-Duty Diesel (Winter)
On-Road - Heavy-Duty Diesel
On-Road - Medium-Duty Diesel
On-Road - Light-Duty Diesel (Winter)
On-Road - Light-Duty Diesel
Off-Road - Diesel
Off-Road - Diesel
OC and EC Percentage (%)
OC EC
Chow et al., 2011, Atmos. Environ.

PM2.5 OC and EC abundances are even more variable for biomass burning
3766 MZFFIREC
423202.5
4366 BVBURN
22073 LTRWCC
3770 MZRWCC
423032.5
423302.5
22071 LTFIREPL
3235 WRWCBC3
3921 NWFGPDa
22072 LTWOODST
421022.5
3236 WSTOVEC2
22069 LTRWSC
22070 LTRWHC
422022.5
422012.5
221032.5
4704
100 80 60 40 20 0 20 40 60 80 100
Forest FireOpen BurnOpen Burn
RWC - AllRWC - AllRWC - AllRWC - All
RWC - FireplacesRWC - FireplacesRWC - Fireplaces
RWC - WoodstovesRWC - WoodstovesRWC - Woodstoves
RWC - SoftwoodsRWC- HardwoodsRWC- HardwoodsRWC - Softwoods
IWCIWC
OC and EC Percentage (%)
OC EC
IWC: Industrial Wood Combustion; RWC: Residential Wood CombustionChow et al., 2011

The OC fraction of combustion products is complex and is not completely removed at lower temperatures. There are still
many OC compounds at T>140 and 280 ºC
Grabowsky et al., 2011, Anal. Bioanal. Chem.,.
Two-dimensional time temperature REMPI/TOF-MS-spectra of PM loaded filter from engine emissions using gasoline (left) and diesel (10% biodiesel) (right). Can be extended to the study of aged emissions
Gasoline exhaust Diesel/biodiesel exhaust

EC constitutes ~5% to 10% of PM2.5 and is correlated with PM2.5
Site EC/PM2.5 (%)PM2.5
(ug/m3) OC (ug/m3) EC (ug/m3)Atlanta 9.8 14.3 3.2 1.3Baltimore 7.2 12.7 2.0 0.8Birmingham 9.1 14.3 3.2 1.3Detroit 8.0 13.2 2.5 0.8Fresno 6.5 13.4 3.0 0.9Houston 5.7 10.6 1.8 0.6New York 13.7 11.7 2.0 1.4Phoenix 8.8 9.7 2.4 0.9Puget Sound 11.3 7.1 2.2 0.8Rubidoux 10.3 17.0 3.0 1.5Washington DC 8.8 14.3 2.5 1.1
“…reducing a unit of BC might prolong life by more 4 to 9 times than reducing a unit of PM2.5”
So why go after the rest of PM2.5?

PM2.5, EC, and OC levels are decreasing at U.S. monitors. Is BC really such a big deal for health?
Annual average concen-
trations at Washington
DC IMPROVE
site

Residential solid fuel combustion exposure is not just an issue in other countries. Many intermountain western communities still experience high exposures. Fresh
(residential) and aged (wildfire) smoke may have different compositions and effects
Wintertime evening spatial distribution of brown carbon in Sparks, NV, shows a relatively small footprint of effects in a low-income neighborhood heating with solid fuels ng/m3

Most sources have multiple emissions of reactive substances, and co-benefits can be derived for non-health effects by emission reductions
Cao et al., 2013, AAQR.

General shortcomings of air quality and health studies
• Dominated by populations, pollutant mixtures, and sources in major cities (LA, Boston, New York, Atlanta)
• Need new methods to address synergistic effects of multiple pollutant mixtures (gas and particle) that are often correlated, but with varying temporal/spatial patterns
• Lack of information on intermittent and poorly inventoried sources (non-road engines, high emitters, fugitive dust, wildfires, solid fuel burning, trans-ocean transport)
• Slow evolution of air quality networks from compliance to multiple purposes (e.g. exposure, forecast, and health)

Additional (uncited) review articles

Memorable quote
• p. 638, par. 5. “…if an air pollution monitor is <1.5 km from the residence of the mother, associations are often found with traffic emissions such as CO, but if the monitor is further from the home, such associations are rare.”