Embed Size (px)
Citation preview

Critical Point and Vapor Pressure Measurements for Seven Compounds by a LowResidence Time Flow Method†
David M. VonNiederhausern,* Grant M. Wilson, and Neil F. Giles
Wiltec Research Company, Inc., 488 South 500 West, Provo, Utah 84601
Critical temperature, critical pressure, and vapor pressure measurements have been performed on seven compoundsby a flow method with ultralow residence times. These compounds along with their Chemical Abstract ServicesRegistry numbers are as follows: 2-phenylethanol (60-12-8), 1-tert-butoxy-2-propanol (57018-52-7), 2-propene-1-ol (107-18-6), 1-dodecanethiol (112-55-0), thioanisole (100-68-5), naphthalene (91-20-3), and triacontane (638-68-6). While accurate vapor pressure data are included for triacontane, this compound proved too unstable todirectly determine the critical constants using this apparatus. Accurate vapor pressures, critical temperatures, andcritical pressures are included for the other compounds.
Introduction
This work is part of an ongoing investigation of the criticalproperties for compounds selected for industrial interest in 1998by sponsors of Project 851 of the Design Institute for PhysicalProperty Data (DIPPR) of the American Institute of ChemicalEngineers (AIChE). This paper reports experimental measure-ments of the critical properties and vapor pressures for sixcompounds studied in a flow apparatus with ultralow residencetimes. These six compounds are 2 phenylethanol (CASRN60-12-8), 1-tert-butoxy-2-propanol (CASRN 57018-52-7),2-propene-1-ol (CASRN 107-18-6), 1-dodecanethiol (CASRN112-55-0), thioanisole (CASRN 100-68-5), and naphthalene(CASRN 91-20-3). Accurate vapor pressures are also reportedfor triacontane (CASRN 638-68-6), but this compound provedtoo unstable to measure the critical constants using thisapparatus.
Experimental Section
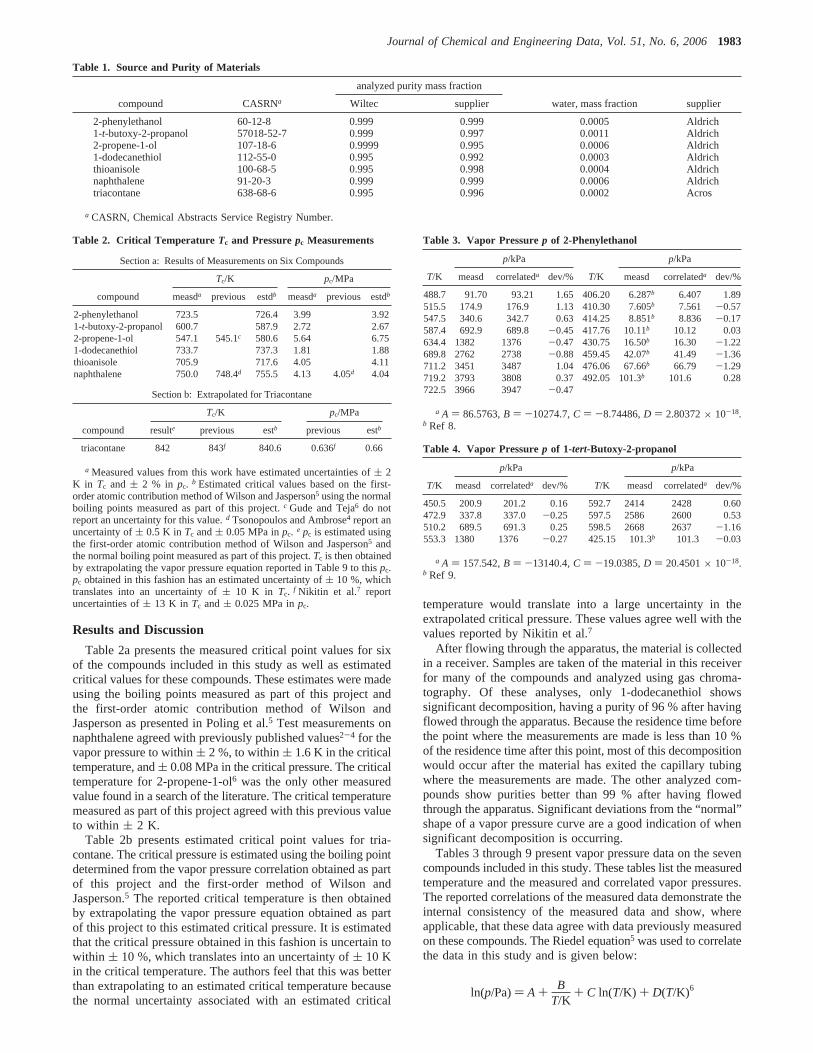
The flow apparatus and procedures used for these measure-ments have been described previously.1 In brief, the fluid to betested flows at constant pressure through a capillary tubecontaining a thermocouple. As the temperature of the fluidincreases, it goes through a phase change. Below the criticalpressure, this material boils at “constant” temperature. Abovethe critical pressure, this change in state does not occurisothermally. This process produces temperature scans similarto the sample scans shown in Figure 1. This plot shows that,below the critical pressure, the temperature scan is flatter andshows a distinct break as the fluid goes from two phases to asingle vapor phase. The scan above the critical point does notshow this behavior. The reported critical point is between thelowest scan above the critical point and the highest scan belowthe critical point.
For naphthalene and triacontane, which melt above roomtemperature, a 700 cm3 displacement coil charged with the solid
compound was placed between the pump and the capillarytubing in the salt bath. This coil was placed in a constant-temperature bath controlled above the melting point of thecompound to be tested. Vegetable oil was then charged to thepump and used to displace the test fluid. Temperatures weremeasured on the ITS-90. Temperature and pressure measurementdevices were calibrated to within( 0.1 K and ( 0.7 kPa,respectively.
Table 1 reports measured purities and water content for thecompounds studied in this work. The purities were measuredat Wiltec using gas chromatography. The water analyses wereperformed using Karl Fischer titration. Care was taken topurchase the compounds at high purity. Water and dis-solved gases were removed by distilling off a small amount ofmaterial under vacuum, but no further attempts were made topurify the chemicals. These analyses were performed on thematerial after the distillation step. The supplier and ChemicalAbstract Services Registry Number (CASRN) of each chemicalare also listed.
† This contribution will be part of a special print edition containing papersreporting experimental results from the various projects of the DesignInstitute for Physical Properties of the American Institute of ChemicalEngineers.* Corresponding author. E-mail: [email protected].
Figure 1. Sample temperature scans for 2-phenylethanol. Temperature scanat O, 3793 kPa;0, 3966 kPa;2, 4013 kPa.- -, no vaporization; ---, fullvaporization;s, T ) T(bath).
1982 J. Chem. Eng. Data2006,51, 1982-1985
10.1021/je060088h CCC: $33.50 © 2006 American Chemical SocietyPublished on Web 06/21/2006
Results and Discussion
Table 2a presents the measured critical point values for sixof the compounds included in this study as well as estimatedcritical values for these compounds. These estimates were madeusing the boiling points measured as part of this project andthe first-order atomic contribution method of Wilson andJasperson as presented in Poling et al.5 Test measurements onnaphthalene agreed with previously published values2-4 for thevapor pressure to within( 2 %, to within( 1.6 K in the criticaltemperature, and( 0.08 MPa in the critical pressure. The criticaltemperature for 2-propene-1-ol6 was the only other measuredvalue found in a search of the literature. The critical temperaturemeasured as part of this project agreed with this previous valueto within ( 2 K.
Table 2b presents estimated critical point values for tria-contane. The critical pressure is estimated using the boiling pointdetermined from the vapor pressure correlation obtained as partof this project and the first-order method of Wilson andJasperson.5 The reported critical temperature is then obtainedby extrapolating the vapor pressure equation obtained as partof this project to this estimated critical pressure. It is estimatedthat the critical pressure obtained in this fashion is uncertain towithin ( 10 %, which translates into an uncertainty of( 10 Kin the critical temperature. The authors feel that this was betterthan extrapolating to an estimated critical temperature becausethe normal uncertainty associated with an estimated critical
temperature would translate into a large uncertainty in theextrapolated critical pressure. These values agree well with thevalues reported by Nikitin et al.7
After flowing through the apparatus, the material is collectedin a receiver. Samples are taken of the material in this receiverfor many of the compounds and analyzed using gas chroma-tography. Of these analyses, only 1-dodecanethiol showssignificant decomposition, having a purity of 96 % after havingflowed through the apparatus. Because the residence time beforethe point where the measurements are made is less than 10 %of the residence time after this point, most of this decompositionwould occur after the material has exited the capillary tubingwhere the measurements are made. The other analyzed com-pounds show purities better than 99 % after having flowedthrough the apparatus. Significant deviations from the “normal”shape of a vapor pressure curve are a good indication of whensignificant decomposition is occurring.
Tables 3 through 9 present vapor pressure data on the sevencompounds included in this study. These tables list the measuredtemperature and the measured and correlated vapor pressures.The reported correlations of the measured data demonstrate theinternal consistency of the measured data and show, whereapplicable, that these data agree with data previously measuredon these compounds. The Riedel equation5 was used to correlatethe data in this study and is given below:
Table 1. Source and Purity of Materials
analyzed purity mass fraction
compound CASRNa Wiltec supplier water, mass fraction supplier
2-phenylethanol 60-12-8 0.999 0.999 0.0005 Aldrich1-t-butoxy-2-propanol 57018-52-7 0.999 0.997 0.0011 Aldrich2-propene-1-ol 107-18-6 0.9999 0.995 0.0006 Aldrich1-dodecanethiol 112-55-0 0.995 0.992 0.0003 Aldrichthioanisole 100-68-5 0.995 0.998 0.0004 Aldrichnaphthalene 91-20-3 0.999 0.999 0.0006 Aldrichtriacontane 638-68-6 0.995 0.996 0.0002 Acros
a CASRN, Chemical Abstracts Service Registry Number.
Table 2. Critical Temperature Tc and Pressurepc Measurements
Section a: Results of Measurements on Six Compounds
Tc/K pc/MPa
compound measda previous estdb measda previous estdb
2-phenylethanol 723.5 726.4 3.99 3.921-t-butoxy-2-propanol 600.7 587.9 2.72 2.672-propene-1-ol 547.1 545.1c 580.6 5.64 6.751-dodecanethiol 733.7 737.3 1.81 1.88thioanisole 705.9 717.6 4.05 4.11naphthalene 750.0 748.4d 755.5 4.13 4.05d 4.04
Section b: Extrapolated for Triacontane
Tc/K pc/MPa
compound resulte previous estb previous estb
triacontane 842 843f 840.6 0.636f 0.66
a Measured values from this work have estimated uncertainties of( 2K in Tc and ( 2 % in pc. b Estimated critical values based on the first-order atomic contribution method of Wilson and Jasperson5 using the normalboiling points measured as part of this project.c Gude and Teja6 do notreport an uncertainty for this value.d Tsonopoulos and Ambrose4 report anuncertainty of( 0.5 K in Tc and( 0.05 MPa inpc. e pc is estimated usingthe first-order atomic contribution method of Wilson and Jasperson5 andthe normal boiling point measured as part of this project.Tc is then obtainedby extrapolating the vapor pressure equation reported in Table 9 to thispc.pc obtained in this fashion has an estimated uncertainty of( 10 %, whichtranslates into an uncertainty of( 10 K in Tc. f Nikitin et al.7 reportuncertainties of( 13 K in Tc and( 0.025 MPa inpc.
Table 3. Vapor Pressurep of 2-Phenylethanol
p/kPa p/kPa
T/K measd correlateda dev/% T/K measd correlateda dev/%
488.7 91.70 93.21 1.65 406.20 6.287b 6.407 1.89515.5 174.9 176.9 1.13 410.30 7.605b 7.561 -0.57547.5 340.6 342.7 0.63 414.25 8.851b 8.836 -0.17587.4 692.9 689.8 -0.45 417.76 10.11b 10.12 0.03634.4 1382 1376 -0.47 430.75 16.50b 16.30 -1.22689.8 2762 2738 -0.88 459.45 42.07b 41.49 -1.36711.2 3451 3487 1.04 476.06 67.66b 66.79 -1.29719.2 3793 3808 0.37 492.05 101.3b 101.6 0.28722.5 3966 3947 -0.47
a A ) 86.5763,B ) -10274.7,C ) -8.74486,D ) 2.80372× 10-18.b Ref 8.
Table 4. Vapor Pressurep of 1-tert-Butoxy-2-propanol
p/kPa p/kPa
T/K measd correlateda dev/% T/K measd correlateda dev/%
450.5 200.9 201.2 0.16 592.7 2414 2428 0.60472.9 337.8 337.0 -0.25 597.5 2586 2600 0.53510.2 689.5 691.3 0.25 598.5 2668 2637 -1.16553.3 1380 1376 -0.27 425.15 101.3b 101.3 -0.03
a A ) 157.542,B ) -13140.4,C ) -19.0385,D ) 20.4501× 10-18.b Ref 9.
ln(p/Pa)) A + BT/K
+ C ln(T/K) + D(T/K)6
Journal of Chemical and Engineering Data, Vol. 51, No. 6, 20061983
where A, B, C, and D are parameters. The values for theseparameters obtained from a least-squares regression are givenat the bottom of each table. The vapor pressures measured aspart of this project have an estimated uncertainty of( 2 %. Inthe case of 2-propene-1-ol, the lowest point from Stull11 wasnot used in the correlation. Using this point causedD to be lessthan zero, which should not occur.
Table 10 presents the normal boiling point for each of thecompounds included in this study. These values were obtainedusing the reported correlations given at the bottom of Tables 3through 9. Measured boiling points reported by other researcherslisted in Tables 3 through 9 are also listed. For 2-propene-1-ol,the data measured for this project only extend down to about750 kPa. The normal boiling point reported for this compounddepends strongly on which literature vapor pressures onechooses to include in the correlation. For 1-tert-butoxy-2-propanol, the data measured for this project extend down toabout 200 kPa. The normal boiling point of Evans and Edlund9
is in good agreement with the data measured here. For the othercompounds, the data measured for this project extended to near
the normal boiling point. The other normal boiling pointsreported in Table 10 agree well with measured values from theliterature. Measured values forTb were not found in a searchof the literature for 1-dodecanethiol and triacontane.
Conclusions
Accurate vapor pressures have been measured on sevencompounds of industrial significance, and reliable critical pointvalues have been measured for six of these seven compounds.The critical point values of triacontane were not obtained usingthis apparatus because this compound proved too unstable. Usingthe measured vapor pressure data, reasonable estimates for thecritical temperature and pressure of triacontane are obtained andreported. These data are useful in many engineering applicationsand in evaluating the applicability of current predictive tech-niques. They will also be useful in developing better correlationsfor estimating critical temperatures and pressures.
Table 5. Vapor Pressurep of 2-Propene-1-ol
p/kPa p/kPa
T/K measd correlateda dev/% T/K measd correlateda dev/%
438.1 759.8 757.4 -0.32 370.23 101.3b 100.2 -1.07465.2 1383 1394 0.81 253.15 0.1333c 0.1274 -4.42498.5 2595 2638 1.65 273.35 0.6666d 0.6441 -3.38531.5 4482 4496 0.31 283.65 1.333d 1.332 -0.07545.4 5516 5491 -0.44 294.85 2.666d 2.751 3.19546.5 5599 5576 -0.41 306.55 5.333d 5.504 3.21294.15 3.040b 2.634 -13.34 313.45 7.999d 8.058 0.73298.15 3.746b 3.367 -10.13 323.15 13.33d 13.34 0.07303.15 4.840b 4.528 -6.44 337.65 26.66d 26.64 -0.09308.15 6.279b 6.023 -4.08 353.35 53.33d 52.30 -1.93313.15 8.159b 7.929 -2.83 369.75 101.3d 98.50 -2.78
a A ) 60.7871,B ) -6911.46,C ) -5.17491,D ) 0.54729× 10-18.b Ref 10 (not used in correlation).c Ref 11 (not used in correlation).d Ref11 (used in correlation).
Table 6. Vapor Pressurep of 1-Dodecanethiol
p/kPa p/kPa
T/K measd correlateda dev/% T/K measd correlateda dev/%
544.5 89.98 89.86 -0.13 688.6 1039 1031 -0.76577.8 178.6 179.2 0.33 712.4 1384 1395 0.84614.7 348.2 347.2 -0.28 729.8 1726 1723 -0.18659.9 694.3 696.6 0.34
a A ) 76.3584,B ) -10406.0,C ) -7.28412,D ) 1.87142× 10⁻¹⁸.
Table 7. Vapor Pressurep of Thioanisole
p/kPa p/kPa
T/K measd correlateda dev/% T/K measd correlateda dev/%
463.7 90.87 92.05 1.30 403.878 15.74b 15.73 -0.05492.1 177.3 178.5 0.64 407.306 17.73b 17.71 -0.11526.3 354.1 354.2 0.02 410.756 19.92b 19.89 -0.12566.1 696.4 696.8 0.06 417.664 25.01b 24.95 -0.22613.6 1383 1376 -0.49 424.627 31.16b 31.08 -0.26671.1 2765 2764 -0.01 431.637 38.55b 38.43 -0.29691.7 3454 3470 0.45 438.698 47.36b 47.22 -0.30699.9 3799 3790 -0.25 445.808 57.80b 57.64 -0.29704.3 3964 3971 0.18 452.971 70.11b 69.93 -0.26390.296 9.582b 9.613 0.33 460.186 84.53b 84.34 -0.22393.680 10.88b 10.91 0.23 467.456 101.3b 101.2 -0.16397.062 12.33b 12.35 0.11 474.772 120.8b 120.7 -0.11400.471 13.95b 13.96 0.04
a A ) 63.8474,B ) -7971.93,C ) -5.74171,D ) 2.59201× 10-18.b Ref 12.
Table 8. Vapor Pressurep of Naphthalene
p/kPa p/kPa
T/K measd correlateda dev/% T/K measd correlateda dev/%
502.2 128.9 129.0 0.06 410.644 10.67c 10.67 -0.01552.2 337.8 340.0 0.64 417.221 13.33c 13.30 -0.21646.6 1338 1353 1.15 424.055 16.67c 16.60 -0.38731.8 3445 3472 0.78 429.738 19.93c 19.84 -0.47741.5 3793 3823 0.81 437.222 25.02c 24.88 -0.57745.9 3958 3992 0.86 437.219 25.02c 24.88 -0.58441.32 28.82b 28.06 -2.64 444.760 31.18c 30.98 -0.62462.21 49.64b 49.89 0.49 452.355 38.57c 38.32 -0.64483.54 83.43b 84.69 1.52 460.002 47.38c 47.08 -0.62492.37 102.0b 103.8 1.76 467.702 57.82c 57.48 -0.59508.48 145.5b 147.5 1.37 475.458 70.12c 69.75 -0.53526.98 211.7b 214.1 1.15 483.267 84.53c 84.15 -0.45554.21 348.9b 352.0 0.90 491.130 101.3c 101.0 -0.37644.26 1317b 1314 -0.20 499.046 120.8c 120.5 -0.28672.04 1868b 1833 -1.92 507.020 143.3c 143.0 -0.17699.82 2551b 2494 -2.24 515.043 169.0c 168.9 -0.07727.59 3378b 3329 -1.48 523.123 198.5c 198.6 0.04384.439 4.000c 4.057 1.42 531.253 232.0c 232.4 0.14391.702 5.333c 5.381 0.90 539.434 270.0c 270.7 0.24402.519 7.999c 8.024 0.32
a A ) 52.0693,B ) -7439.95,C ) -4.10178,D ) 1.37383× 10-18.b Ref 2. c Ref 3.
Table 9. Vapor Pressurep of Triacontane
p/kPa p/kPa
T/K measd correlateda dev/% T/K measd correlateda dev/%
713.5 82.32 81.35 -1.18 809.6 414.1 410.3 -0.92737.8 127.8 127.8 0.02 826.3 553.6b 524.5 -5.26761.2 190.2 191.5 0.68 830.1 621.9b 554.1 -10.90786.0 282.4 286.0 1.28 837.6 690.2b 617.1 -10.58
a A ) 151.299,B ) -20829.1,C ) -16.9027,D ) 1.92834× 10-18.b Measured vapor pressures not used in fit due to decomposition.
Table 10. Normal Boiling PointsTb Obtained from the ReportedCorrelations
Tb/K
compound this work previous
2-phenylethanol 491.9 492.05a
1-t-butoxy-2-propanol 425.2 425.15b
2-propene-1-ol 370.5 370.23c
369.75d
1-dodecanethiol 549.9thioanisole 467.5 467.456e
naphthalene 491.3 491.130f
triacontane 725.1
a Ref 8. b Ref 9. c Ref 10.d Ref 11.e Ref 12. f Ref 3.
1984 Journal of Chemical and Engineering Data, Vol. 51, No. 6, 2006
Literature Cited(1) VonNiederhausern, D. M.; Wilson, G. M.; Giles, N. F. Critical point
and vapor pressure measurements at high temperatures by means of anew apparatus with ultra low residence times.J. Chem. Eng. Data2000, 45, 157-160.
(2) Wilson, G. M.; Johnston, R. H.; Hwang, S.; Tsonopoulos, C. Volatilityof coal liquids at high temperatures and pressures.Ind. Eng. Chem.Process Des. DeV. 1981, 20, 94-104.
(3) Chirico, R. D.; Knipmeyer, S. E.; Nguyen, A.; Steele, W. V. Thethermodynamic properties to the temperature of 700 K of naphthaleneand of 2,7-dimethylnaphthalene.J. Chem. Thermodyn.1993, 25,1461-1494.
(4) Tsonopoulos, C.; Ambrose, D. Vapor-liquid critical properties ofelements and compounds. 3. Aromatic hydrocarbons.J. Chem. Eng.Data 1995, 40, 547-558.
(5) Poling, B. E.; Prausnitz, J. M.; O’Connell, J. P.The Properties ofGases and Liquids, 5th ed.; McGraw-Hill: New York, 2001.
(6) Gude, M.; Teja, A. S. Vapor-liquid critical properties of elementsand compounds. 4. Aliphatic alkanols.J. Chem. Eng. Data1995, 40,1025-1036.
(7) Nikitin, E. D.; Pavlov, P. A.; Popov, A. P. Vapour-liquid criticaltemperatures and pressures of normal alkanes with from 19 to 36carbon atoms, naphthalene andm-terphenyl determined by the pulse-heating technique.Fluid Phase Equilib.1997, 141, 155.
(8) Dreisbach, R. R.; Shrader, S. A. Physical data on some organiccompounds.Ind. Eng. Chem. 1949, 41, 2879.
(9) Evans, T. W.; Edlund, K. R. Tertiary alkyl ethers: preparation andproperties.Ind. Eng. Chem.1936, 28, 1186.
(10) Ewert, M. Theory of concentrated solutions. XIII. Aqueous solutionsof organic compounds.Bull. Soc. Chim. Belg. 1936, 45, 493.
(11) Stull, D. R. Vapor pressure of pure substances: organic compounds.Ind. Eng. Chem.1947, 39, 517.
(12) Osborn, A. N.; Douslin, D. R. Vapor pressure relations of 36 sulfurcompounds present in petroleum.J. Chem. Eng. Data1966, 11, 502-509.
Received for review February 28, 2006. Accepted May 2, 2006. Wethank the DIPPR 851 steering committee and the companies itrepresents for funding this research.
JE060088H
Journal of Chemical and Engineering Data, Vol. 51, No. 6, 20061985


![NEWS RELEASE 28 a RESIDENCE RESIDENCE] 10 20 as 18 11 15 … · news release 28 a residence residence] 10 20 as 18 11 15 a (±) 70 201 residence residence] residence (itþ#) : : jr](https://img.dokumen.tips/doc/110x75/5f4178718a31a4664d3bc562/news-release-28-a-residence-residence-10-20-as-18-11-15-news-release-28-a-residence.jpg)


