Embed Size (px)
Citation preview

CRITICAL CHOLORIDE CORROSION THRESHOLD FOR
GALVANIZED REINFORCING BARS
By
David Darwin
JoAnn Browning Matthew O’Reilly
Lihua Xing
A Report on Research Sponsored by the International Lead Zinc Research Organization, Inc.
Project Code – ZC-24-2
Structural Engineering and Materials Laboratory SL Report 07-2
THE UNIVERSITY OF KANSAS CENTER FOR RESEARCH, INC. 2385 Irving Hill Road, Lawrence, Kansas 66045-7563

CRITICAL CHLORIDE CORROSION THRESHOLD FOR GALVANIZED REINFORCING BARS
By
David Darwin JoAnn Browning Matthew O’Reilly
Lihua Xing
A Report on Research Sponsored by the
International Lead Zinc Research Organization, Inc. Project Code – ZC-24-2
Structural Engineering and Engineering Materials
SL Report 07-2
THE UNIVERSITY OF KANSAS CENTER FOR RESEARCH, INC.
LAWRENCE, KANSAS
December 2007

1
ABSTRACT
Galvanized reinforcement is evaluated to determine the chloride content required for
corrosion initiation. The bars conform to ASTM A 767, except that no chromate treatment was
applied. Specimens containing the galvanized bars are subjected to Southern Exposure test
conditions that are terminated upon corrosion initiation, after which the chloride content at the
level of the reinforcement is determined. These data are compared with chloride surveys
performed on bridge decks to obtain an average time to corrosion initiation. The time to
corrosion initiation for galvanized reinforcement is compared to conventional reinforcement and
MMFX Microcomposite reinforcement. The galvanized reinforcement specimens were also
examined after testing for signs of hydrogen formation.
The test results show that galvanized reinforcement has an average critical chloride
corrosion threshold of 2.57 lb/yd3, which is greater than conventional steel (1.63 lb/yd3) and
lower than MMFX steel (6.34 lb/yd3). Galvanized reinforcement exhibits a wider range of
values of chloride content at corrosion initiation than conventional reinforcement. Critical
corrosion threshold values for galvanized reinforcement range from values comparable to those
exhibited by conventional steel to values three to four times that of conventional steel. Autopsy
results revealed zinc corrosion products on the bars. Hydrogen gas evolution did not appear to
increase the porosity of the concrete in the non-chromate treated bars relative to conventional
reinforcement in air-entrained concrete. Some galvanized bars, however, showed signs of
corrosion, including loss of the pure zinc layer, which may be due to the lack of chromate
treatment or due to loss of metal in presence of high-pH concrete pore solution. Based on
chloride surveys of cracked bridge decks in Kansas, galvanized steel can be expected to increase
the average time to corrosion initiation at crack locations from 2.3 years for conventional steel to
4.8 years for bars with 3 in. of concrete cover. Corrosion initiation can be expected to occur at an
average age of 14.8 years for MMFX steel. All three systems will exhibit significantly longer
times to corrosion initiation in uncracked concrete.
Keywords: bridge decks, chromate pretreatment, corrosion, critical chloride corrosion threshold,
galvanized reinforcement, zinc,

1
2
ACKNOWLEDGEMENTS
Funding and material support for this research was provided by the International Lead Zinc
Research Organization, Inc. under Project Code – ZC-24-2. Additional support was provided by
the Kansas Department of Transportation under Contract No. C1281, with technical oversight by
Don Whisler, the Ash Grove Cement Company, BASF Construction Chemicals, and LRM
Industries.

3
INTRODUCTION
Metallic coatings of different types have been used for many years to protect steel from
corrosion. Principal among the metals has been zinc, applied as a molten coating. The process
results in the formation of an outer layer of pure zinc that is underlaid by several zinc-iron alloy
layers. Zinc provides protection in two ways. It acts as a barrier that prevents access of oxygen
and moisture to the protected material, and it acts as a sacrificial anode that corrodes in
preference to the protected metal. In air, zinc achieves significant protection itself due to the
formation of a hydrated oxide [Zn(OH)2], which in turn combines with carbon dioxide in the
atmosphere to form a protective zinc carbonate layer [ZnCO2] that prevents further corrosion
(Jones 1996).
In concrete, the behavior of zinc is somewhat different. Zinc reacts with hydroxyl ions in
plastic concrete and concrete pore solution to form zinc oxide and hydrogen gas. Zinc oxide
reacts with calcium ions to form calcium hydroxyzincate. At a pH below 13.3, calcium
hydroxyzincate forms a stable coating that passivates the zinc. Above a pH of 13.3, the
corrosion products form large crystals that do not provide corrosion protection (Andrade and
Macias 1988, Bentur et. al. 1997). A key aspect of providing corrosion protection is the retention
of the external layer of pure zinc. Once this layer is lost, the zinc required to form calcium
hydroxyzincate is removed and the underlying zinc-iron alloy layers are destroyed (Andrade and
Macias 1988).
Hot-dipped zinc-coated reinforcing steel is specified under ASTM A 767. Because zinc is
an amphoteric metal, that is, it corrodes in alkaline as well as acid environments, ASTM A 767
requires galvanized bars to be dipped in a chromate bath after coating to passivate the zinc
surface and prevent the zinc from reacting with hydroxyl ions in fresh concrete (Virmani and
Clemena 1998).
Over the years, the ability of galvanized bars to provide corrosion resistance has not been
uniformly positive. There have been cases in which galvanized bars have performed in a superior
manner (McCrum and Arnold 1993) and other cases in which they have not (Manning et al.
1982, Pianca and Schell 2005). The use of chromate treatment also has a negative implication
because the hexavalent chromate salts that are used to passivate the zinc are carcinogens.

2
Conventional reinforcing steel does not need corrosion protection for most applications.
The reason is that the alkaline environment within concrete results in the deposition of a passive
ferric oxyhydroxide layer on the surface of the bar. This layer limits access of oxygen and
moisture to the steel while reducing the solubility of iron. This protection, however, can be lost.
For example, this will occur if the pH of the concrete drops, such as due to carbonation from the
chemical combination of carbon dioxide in the air with alkalis in hydrated cement. This is
generally not a problem unless the concrete cover is low, because the carbonation process
penetrates the concrete at progressively slower rates with increasing depth. Corrosion protection
is also lost when reinforced concrete is subjected to chlorides, usually in the form of deicing
chemicals or sea water. The chlorides penetrate the passive layer on the steel surface and cause
active corrosion. Because of the wide-spread use of sodium and calcium chloride as deicing
chemicals, chloride-induced corrosion represents a major durability problem for concrete
structures, especially for reinforced concrete bridge decks.
There are two aspects to providing corrosion protection for reinforcing steel: raising the
chloride content in the concrete that corresponds to the loss of the passivity, and slowing the rate
of corrosion once it has begun. The purpose of this study is to evaluate the first of these aspects
for galvanized reinforcing steel, that is, the effect of the zinc coating on the chloride
concentration required to initiate corrosion. This chloride content is known as the critical
chloride corrosion threshold. The critical chloride corrosion threshold of galvanized bars is
compared with the corresponding threshold for conventional reinforcement and MMFX
reinforcement. The galvanized bars evaluated in this study have not been pretreated with
hexavalent chromium salts to determine if there is any visible evidence of the formation of
hydrogen at the surface of the bars.
EXPERIMENTAL WORK
Summary of Critical Chloride Threshold Test
This study involves the determination of the critical chloride corrosion threshold of
galvanized steel reinforcing bars. Class I galvanized No. 5 bars that meet the requirements of
ASTM A 767 but lack chromate treatment are used to fabricate 12 beam specimens (Figure 1).
The corrosion threshold values are compared with results for conventional reinforcing steel and

3
2.5 in.
measured ~ 1.0 in.
7.0 in.
6.0 in.
10 ohm
V1.0 in. x 9
measured
1.5 in. 1.5 in.
12 in.
MMFX microcomposite steel. The specimens are autopsied following the tests to look for
evidence of increased porosity in the concrete around the non-chromated bars, possibly caused
by excessive hydrogen evolution during initial curing, and the presence of corrosion products on
the bars.
The tests used in this study involve the direct analysis of the chloride content in concrete
beam specimens adjacent to reinforcing steel when corrosion starts. The beam specimens are 7
in. deep, 6 in. wide, and 12 in. long and are shown in Figure 1. Each specimen contains one No.
5 reinforcing bar, oriented in the 12 in. direction with 1 in. top cover, and two No. 5 bars, also
oriented in the 12 in. direction, with 1 in. bottom cover. The top and bottom bars are electrically
connected across a 10-ohm resistor. The specimens are subjected to an exposure regime that
consists of 4 days ponding with a 15% sodium chloride solution at room temperature followed
by 3 days of drying (after removal of the solution) at 100°F. This 7-day regime is repeated for
12 weeks, and then the specimens are ponded for 12 weeks at room temperature. The 24-week
cycle is repeated until corrosion is initiated, as represented by a measured corrosion rate above
0.3 μm/yr and a sharp drop in the corrosion potential. Readings are taken once per week during
the test period. Exposure to the sodium chloride solution is terminated upon initiation of
corrosion, and 20 samples, 10 from each side of the specimen, are obtained by drilling at the
level of the upper reinforcing bar, as shown in Figure 1. The details of the test procedure are
presented next.
(a) (b)
Figure 1 – Beam specimen, (a) end view and (b) side view showing sampling locations.

4
Materials, Specimen Fabrication, and Apparatus
Materials
1) Concrete: The concrete mixture proportions, shown in Table 1, are selected to
provide an objective comparison between the different systems. The concrete has a
water-cement ratio of 0.45 and an air content of 6%.
Table 1 – Concrete mixture proportions
w/c ratio
Cement
(lb/yd3)
Water
(lb/yd3)
Fine Aggregate
(lb/yd3)
Coarse Aggregate
(lb/yd3)
Air-Entraining Admixture
(oz/yd3)
0.45 598 270 1436 1473 2.5
The properties of the materials are as follows: Type I/II portland cement, total
chromium content = 45.52 ppm, hexavalent chromium content 0.44 ppm (analysis by
Ash Grove Cement Company); coarse aggregate: crushed limestone with maximum
size = 0.75 in., bulk specific gravity (SSD) = 2.58, absorption (dry) = 2.27%, unit
weight = 95.9 lb/ft3; fine aggregate: Kansas River sand with bulk specific gravity
(SSD) = 2.62, absorption (dry) = 0.78%, fineness modulus = 3.18; Air-entraining
admixture: Daravair 1400 from W.R. Grace.
2) Epoxy: A two-component epoxy is used to coat the four sides of the specimens,
including the electrical connections.
3) Salt solution: 15% NaCl solution (6.04 molal ion concentration). 300 ml of solution
is used to pond one specimen.
4) Wire: 16-gage copper electrical wires are used to make the electrical connections to
the bars.
5) Machine screws: 10-24×1 (1.0 in. long) screws are used to mount the bars in the
wooden mold. 10-24×1/2 (0.5 in. long) screws are used to connect the wire to the
bars.
6) Resistors: 0.5 or 0.25 watt 10-ohm resistors with 5% tolerance.
7) Wood: 2×2 lumber is used to support the specimens to allow for air movement under
the specimens.

5
8) Plastic sheeting: 3.5-mil clear plastic sheeting is used to cover the specimens during
ponding to reduce evaporation.
Specimen Fabrication
The beam specimens are fabricated in an inverted position. The concrete is consolidated
in two layers. Each layer is vibrated for 30 seconds on a vibrating table with an amplitude of
0.006 in. and a frequency of 60 Hz. The specimens are wet cured for three days (one day in the
form and two days in a plastic bag with deionized water) and then air cured until the test begins
at 28 days. The top surface of the concrete is sanded lightly prior to initiation of the tests.
Apparatus
1) Heating tent: The heating tent is designed to be mobile and can hold 36 beam
specimens at a time. The tent is an oblong structure, 3.5 feet high, 4 feet wide, and 8
feet long. The roof and ends are made of 0.75 in. thick plywood and are connected
together by six 8-ft long 2×4 studs. The sides of the tent are covered in two layers of
plastic, separated by a 1 in. dead space. Three 250 watt heating lamps are evenly
spaced along the roof of the tent. When the tent is placed over the specimens, the
lamps are 18 in. above the specimens. A thermostat with a temperature probe is used
to maintain a temperature range of 100 ± 3° F.
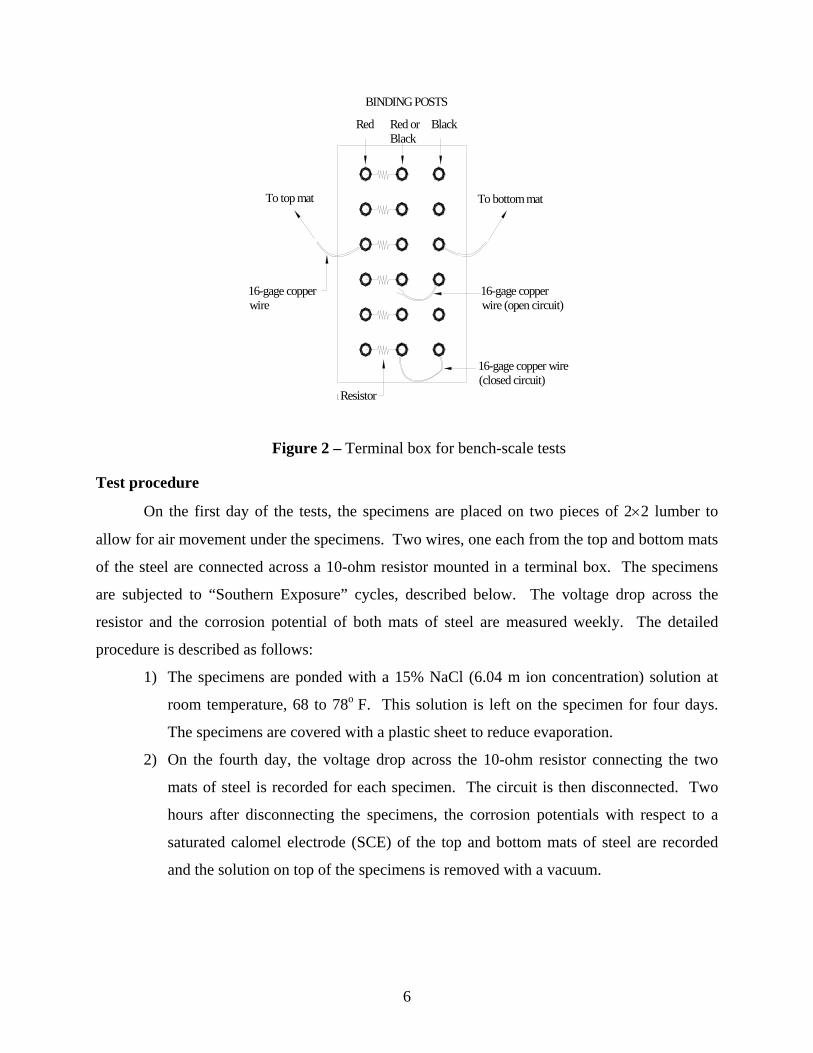
2) Terminal Box: The terminal box consists of a project box containing several sets of
two binding posts and switches, as shown in Figure 2. A 10-ohm resistor is placed
between the switch and the outer post to which the wire from the top mat of the steel
is connected. The switch allows for closing or breaking the circuit.
3) Voltmeter: A voltmeter is used to measure the voltage drop across the resistor and the
corrosion potential of the bars and is capable of reading to a precision of 0.001 mV.
4) Saturated Calomel Electrode (SCE): A saturated calomel electrode is used to take
potential readings during the testing cycles.
6
To bottom matTo top mat
16-gage copper wire
16-gage copper wire (open circuit)
16-gage copper wire (closed circuit)
Red BlackRed or Black
10 ohm Resistor
BINDING POSTS
Figure 2 – Terminal box for bench-scale tests
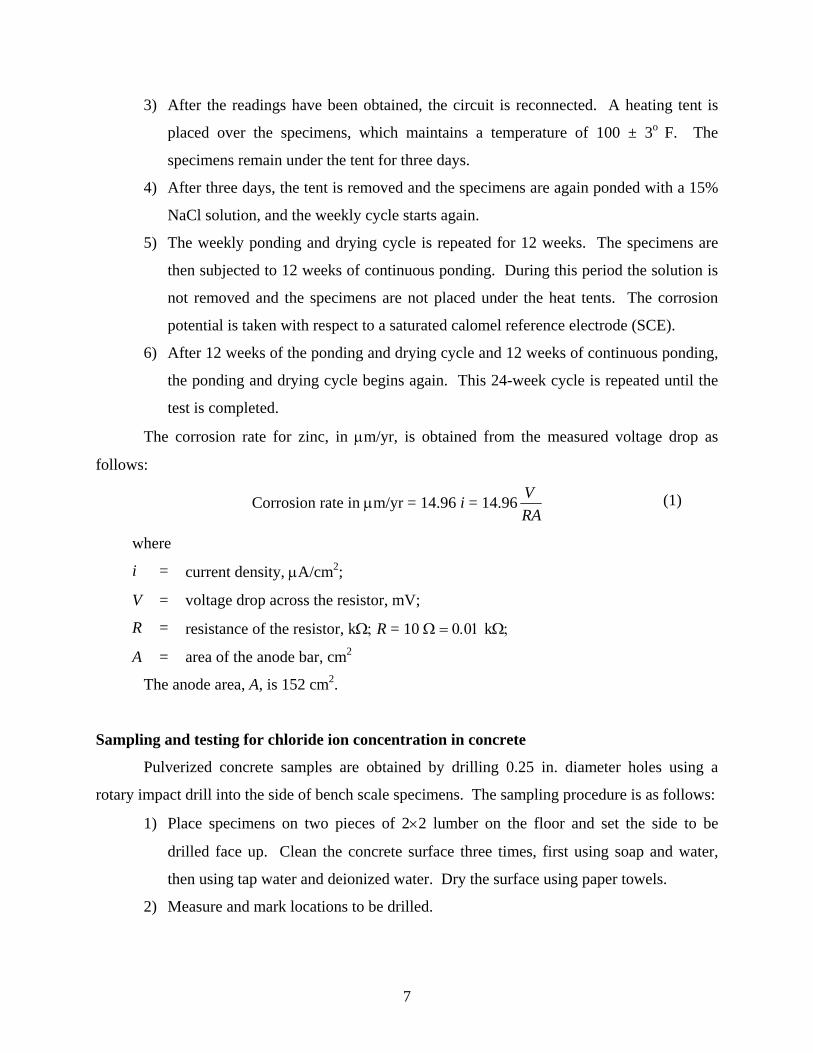
Test procedure
On the first day of the tests, the specimens are placed on two pieces of 2×2 lumber to
allow for air movement under the specimens. Two wires, one each from the top and bottom mats
of the steel are connected across a 10-ohm resistor mounted in a terminal box. The specimens
are subjected to “Southern Exposure” cycles, described below. The voltage drop across the
resistor and the corrosion potential of both mats of steel are measured weekly. The detailed
procedure is described as follows:
1) The specimens are ponded with a 15% NaCl (6.04 m ion concentration) solution at
room temperature, 68 to 78o F. This solution is left on the specimen for four days.
The specimens are covered with a plastic sheet to reduce evaporation.
2) On the fourth day, the voltage drop across the 10-ohm resistor connecting the two
mats of steel is recorded for each specimen. The circuit is then disconnected. Two
hours after disconnecting the specimens, the corrosion potentials with respect to a
saturated calomel electrode (SCE) of the top and bottom mats of steel are recorded
and the solution on top of the specimens is removed with a vacuum.
7
3) After the readings have been obtained, the circuit is reconnected. A heating tent is
placed over the specimens, which maintains a temperature of 100 ± 3o F. The
specimens remain under the tent for three days.
4) After three days, the tent is removed and the specimens are again ponded with a 15%
NaCl solution, and the weekly cycle starts again.
5) The weekly ponding and drying cycle is repeated for 12 weeks. The specimens are
then subjected to 12 weeks of continuous ponding. During this period the solution is
not removed and the specimens are not placed under the heat tents. The corrosion
potential is taken with respect to a saturated calomel reference electrode (SCE).
6) After 12 weeks of the ponding and drying cycle and 12 weeks of continuous ponding,
the ponding and drying cycle begins again. This 24-week cycle is repeated until the
test is completed.
The corrosion rate for zinc, in μm/yr, is obtained from the measured voltage drop as
follows:
Corrosion rate in μm/yr = 14.96 i = 14.96RAV (1)
where
i = current density, μA/cm2;
V = voltage drop across the resistor, mV;
R = resistance of the resistor, kΩ; R = 10 Ω = 0.01 kΩ;
A = area of the anode bar, cm2
The anode area, A, is 152 cm2.
Sampling and testing for chloride ion concentration in concrete
Pulverized concrete samples are obtained by drilling 0.25 in. diameter holes using a
rotary impact drill into the side of bench scale specimens. The sampling procedure is as follows:
1) Place specimens on two pieces of 2×2 lumber on the floor and set the side to be
drilled face up. Clean the concrete surface three times, first using soap and water,
then using tap water and deionized water. Dry the surface using paper towels.
2) Measure and mark locations to be drilled.

8
3) Using a heavy-duty hammer drill with a 6 in. long, 0.25 in. diameter drill bit, drill
perpendicular to the concrete surface (parallel to the ponded surface of the specimen)
to a depth of 0.5 in. (12.7 mm). Discard the powdered concrete by cleaning the drilled
hole and surrounding area using a vacuum.
4) Continue drilling the concrete to a depth of 2.5 in., collect the powdered sample on a
piece of printing paper using a 2 in. pure bristle brush, and transfer the sample into a
zip lock plastic bag.
5) Clean the drill bit with the brush and then deionized water, and dry it with paper
towels prior to the next sampling operation. While sampling, prevent the sample and
sampling tools from contacting any source of contamination.
Each hole produces a sample yield of about four grams.
The water-soluble chloride content of concrete is obtained using Procedure A (the
potentiometric titration test) in AASHTO T 260-97 “Standard Method of Test for Sampling and
Testing for Chloride Ion in Concrete and Concrete Raw Materials.” The procedure involves
using boiled distilled water to digest the powdered concrete sample and titrating the chlorides
with a silver nitrate solution. Millivolt readings are taken for the sample solution using an ion
selective electrode and a voltmeter during the titration. The endpoint of the titration is indicated
by the largest difference in two consecutive voltmeter readings. The detailed analysis procedure
and calculations are outlined in Sections 5.1, 5.3, and 5.4.1 in AASHTO T 260-97 for
determination of water-soluble chloride ion content (Procedure A).
The chloride content, in percent of weight of concrete, is converted to lb/yd3 of concrete
by multiplying by the unit weight of concrete, taken as 3786 lb/yd3.
To obtain the chloride threshold, concrete samples at the level of the reinforcing steel in
the beam specimens are taken immediately after the reinforcing steel begins to corrode. For each
sample, holes are centered so that the top of the holes and the top surface of the bar are in the
same plane. Since the concrete cover for each bar is not exactly 1 in., the actual value is
measured to determine the depth of the sample.
For conventional and MMFX reinforcing steel, corrosion initiation is considered to have
occurred when either the macrocorrosion rate [Eq. (1)] first reaches a value greater than or equal
to 0.3 μm/year or the corrosion potential of the top mat of steel first shifts to a value more
negative than –0.350 V with respect to a copper-copper sulfate electrode (CSE), nominally equal

9
to the value measured using a SCE minus 0.075 V. For zinc-coated steel, corrosion initiation is
based on a corrosion rate of 0.3 μm/year or when a sharp change in corrosion potential is
observed, with the former serving as the primary guide.
When corrosion begins for the top bar, ten powdered samples are obtained from each side
of the specimen by drilling ten holes perpendicular to the bar in the side of the specimen (20
samples for one specimen), as illustrated in Figure 1.
After the samples are taken, the specimens are autopsied. The bars are observed for
corrosion products and the concrete adjacent to the bars is inspected to look for evidence of the
formation of hydrogen bubbles before the concrete had set.
Test Program
The test program consisted of 12 beam specimens containing galvanized No. 5
reinforcing bars meeting the requirements of ASTM A 767, with the exception that the bars were
not treated with chromate salts after galvanizing, as required by ASTM A 767. The results for
these tests are compared with results obtained by Ji, Darwin, and Browning (2005) for
conventional reinforcement meeting the requirements of ASTM A 615 and MMFX
microcomposite reinforcement meeting the requirements of ASTM A 1035.
TEST RESULTS AND EVALUATION
The corrosion rates and corrosion potentials of the 12 beam specimens containing
galvanized reinforcing steel are shown, respectively, in Figures 3 and 4. The specimens were
exposed to the salt solutions until the corrosion rate reached 0.3 μm/year or when a sharp change
in corrosion potential of the top mat of reinforcing steel (Figure 4a) was observed, with the
former serving as the primary guide. The figures show that the corrosion rates were variable
during the first four to six weeks of the tests, with the corrosion potentials of both the top and
bottom mats stabilizing near –0.40 V. The early variations in corrosion rate, including apparently
negative values, result from the amphoteric nature of zinc. The corrosion rate is based on the
macrocell current between the top and bottom mats of steel, and early in the test, before
significant quantities of chloride has reached the top steel, the current is actually more likely to

10
-2.00
-1.00
0.00
1.00
2.00
3.00
4.00
0 6 12 18 24 30 36TIME (weeks)
COR
ROS
ION
RA
TE (µ
m/y
r)
B-Zn-45N-1 B-Zn-45N-2 B-Zn-45N-3 B-Zn-45N-4B-Zn-45N-5 B-Zn-45N-6 B-Zn-45N-7 B-Zn-45N-8B-Zn-45N-9 B-Zn-45N-10 B-Zn-45N-11 B-Zn-45N-12
indicate “negative corrosion” because the bottom mat contains two bars, compared to the single
bar in the top mat.
Figure 3 – Corrosion rates for beam specimens containing galvanized reinforcing steel
Upon the initiation of corrosion, the corrosion rate turns sharply positive (usually from
one week to the next) and the corrosion potential of the top mat changes sharply to more
negative values. This was true, except for specimens 2 and 9. The corrosion rate of specimen 2
increased from zero to a value above 0.3 μm/year over a two-week period, while the corrosion
rate for specimen 9 increased gradually between weeks 24 and 36.
Following corrosion initiation, the tests were stopped, samples were taken for chloride
analysis, and the specimens were autopsied.

11
-1.00
-0.80
-0.60
-0.40
-0.20
0.00
0 6 12 18 24 30 36TIME (weeks)
CO
RRO
SIO
N P
OTE
NTI
AL
(V)
B-Zn-45N-1 B-Zn-45N-2 B-Zn-45N-3 B-Zn-45N-4B-Zn-45N-5 B-Zn-45N-6 B-Zn-45N-7 B-Zn-45N-8B-Zn-45N-9 B-Zn-45N-10 B-Zn-45N-11 B-Zn-45N-12
-1.00
-0.80
-0.60
-0.40
-0.20
0.00
0 6 12 18 24 30 36TIME (weeks)
CO
RRO
SIO
N P
OTE
NTIA
L (V
)
B-Zn-45N-1 B-Zn-45N-2 B-Zn-45N-3 B-Zn-45N-4B-Zn-45N-5 B-Zn-45N-6 B-Zn-45N-7 B-Zn-45N-8B-Zn-45N-9 B-Zn-45N-10 B-Zn-45N-11 B-Zn-45N-12
(a)
(b)
Figure 4 – Corrosion potential vs. CSE for beam specimens containing galvanized reinforcing steel, (a) top mat, (b) bottom mat
12
Corrosion Threshold
The results of the chloride analyses for the galvanized bars are presented in Table 2. The
table includes the times-to-initiation, corrosion rates, corrosion potentials, and individual and
average critical chloride contents on a water-soluble basis. To limit the effect of outliers,
chloride contents that are more than two standard deviations away from the mean are removed
from consideration and the remaining values are again averaged. Twelve data points, or 5% of
the 240 chloride values, were removed for the galvanized bars. They are identified by an asterisk
in Table 2.
The bars had times-to-initiation ranging from 6 to 36 weeks, with an average corrosion
rate of 1.37 μm/yr and an average corrosion potential of –0.619 V with respect to a copper-
copper sulfate electrode at corrosion initiation. After the removal of outliers, the average chloride
threshold for all 12 specimens is 2.57 lb/yd3. The individual chloride contents ranged from 0.22
to 7.82 lb/yd3 and the average values for the individual specimens range from 1.00 to 4.93 lb/yd3.
The coefficients of variation (COV) for individual bars range from 0.31 to 0.97, and COV for the
average specimen threshold values is 0.62.
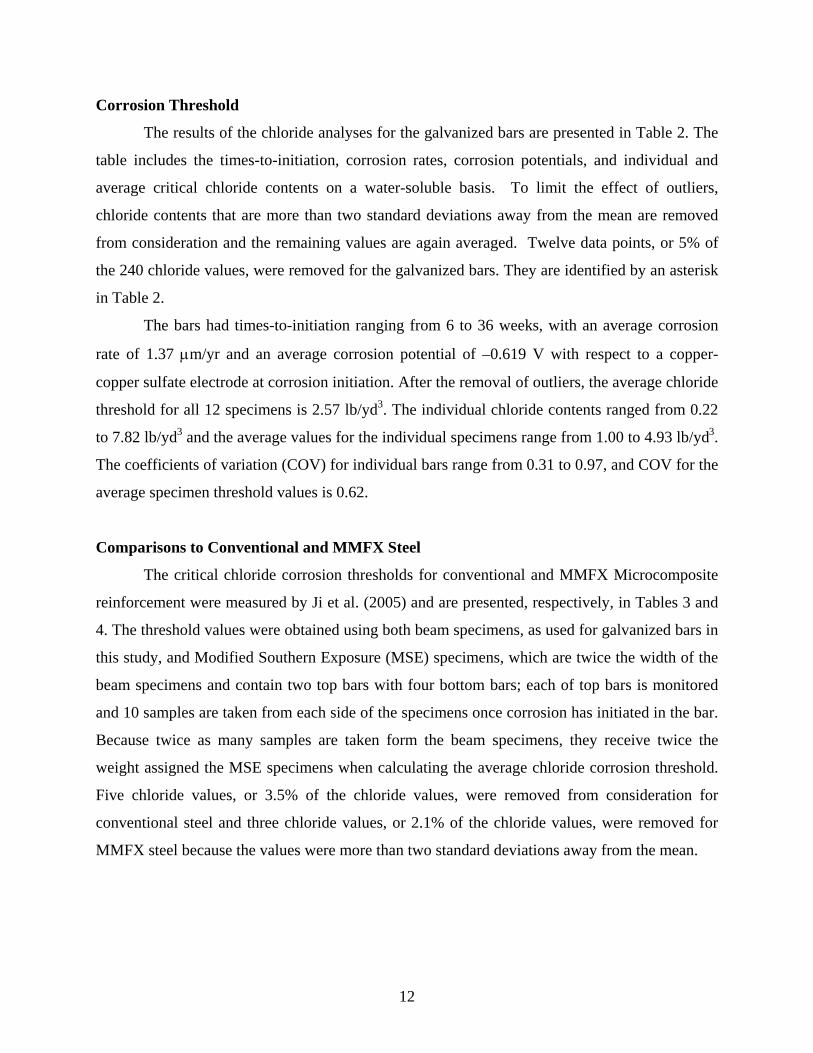
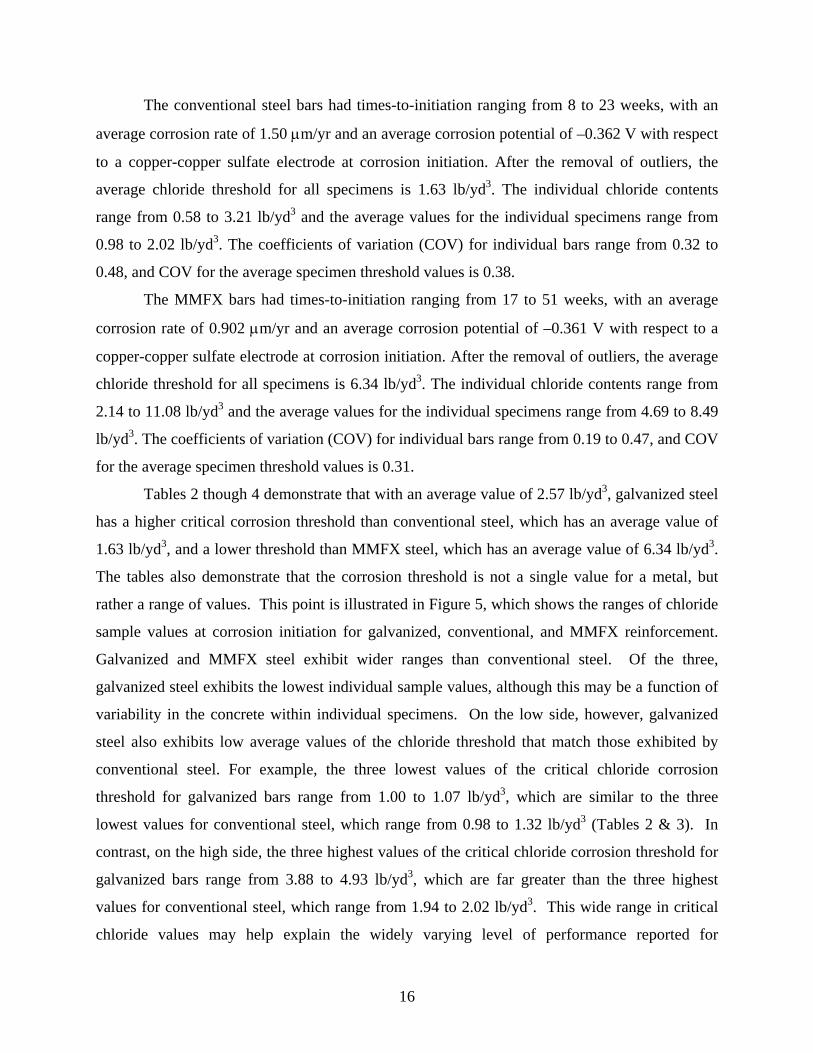
Comparisons to Conventional and MMFX Steel
The critical chloride corrosion thresholds for conventional and MMFX Microcomposite
reinforcement were measured by Ji et al. (2005) and are presented, respectively, in Tables 3 and
4. The threshold values were obtained using both beam specimens, as used for galvanized bars in
this study, and Modified Southern Exposure (MSE) specimens, which are twice the width of the
beam specimens and contain two top bars with four bottom bars; each of top bars is monitored
and 10 samples are taken from each side of the specimens once corrosion has initiated in the bar.
Because twice as many samples are taken form the beam specimens, they receive twice the
weight assigned the MSE specimens when calculating the average chloride corrosion threshold.
Five chloride values, or 3.5% of the chloride values, were removed from consideration for
conventional steel and three chloride values, or 2.1% of the chloride values, were removed for
MMFX steel because the values were more than two standard deviations away from the mean.

13
Average SDc COVc
Sideb 6 7 8 9 10 (lb/yd3)1 3.91 5.17 5.99 3.03 2.522 5.11 7.57 5.43 4.23 4.981 3.85 3.15 1.51 4.29 3.222 1.26 3.72 1.77 3.28 1.451 1.70 1.83 2.33 2.69 1.442 4.61 1.89 4.35 8.20* 5.491 1.39 1.77 1.70 0.69 1.392 0.57 1.07 0.69 2.02 0.821 1.26 1.70 0.66 2.71 2.092 1.39 2.46 0.38 3.09 1.011 0.38 0.22 0.41 2.33 0.382 1.48 0.82 1.07 3.47 1.581 8.77* 4.73 2.78 1.77 1.702 2.78 6.56 1.77 1.89 6.941 0.88 3.00 4.67 2.08 2.212 7.51 4.98 7.38 6.18 3.911 1.58 2.40 2.84 1.58 1.642 9.53* 9.72* 9.40* 11.3* 7.131 3.34 1.83 1.07 0.63 0.442 1.39 1.20 0.76 0.38 1.451 0.44 2.02 0.88 0.50 0.822 0.95 1.77 1.20 0.76 0.761 1.26 1.07 1.20 1.96 0.882 0.44 6.31 8.71* 0.38 0.57
Average 2.57
Specimensa
B-Zn-45N-6
B-Zn-45N-7
B-Zn-45N-1
B-Zn-45N-2
B-Zn-45N-3
0.35
3.44 1.32 0.38
B-Zn-45N-12
Water soluble Cl- (lb/yd3)
4.93 1.81
B-Zn-45N-8
B-Zn-45N-9
B-Zn-45N-10
B-Zn-45N-11
B-Zn-45N-4
B-Zn-45N-5
3.98 2.27 0.57
1.07 0.57 0.53
2.25 1.63 0.73
1.03 0.79 0.77
3.21 1.96 0.61
3.88 2.26 0.58
3.62 2.27 0.63
1.00 0.79 0.79
1.17 0.62 0.53
1.84 1.78 0.97
Age Rate Top PotentialSideb (weeks) (μm/yr) (V) 1 2 3 4 5
1 2.90 5.68 3.00 7.11 5.192 5.11 7.70 4.29 9.72* 4.671 4.79 3.22 2.21 2.46 4.232 4.92 4.48 5.87 4.35 4.861 7.38 8.64* 6.56 2.33 2.272 1.01 6.88 6.15 7.44 5.361 0.32 0.95 0.38 1.04 0.882 0.57 0.85 1.51 0.45 2.331 2.52 4.10 0.57 2.27 2.462 7.19 4.89 1.26 1.14 1.891 1.07 1.20 1.39 0.63 1.012 1.39 0.44 0.25 0.50 0.571 3.15 7.82 1.45 2.52 2.972 1.07 1.45 2.71 3.85 3.091 1.07 3.85 0.82 1.01 1.202 4.48 4.86 4.98 7.25 5.241 5.55 1.77 2.71 3.53 2.022 6.81 7.44 10.85* 7.95* 8.39*1 1.26 0.50 0.54 0.32 0.352 0.50 0.25 0.50 0.88 2.401 1.51 1.58 0.38 0.50 0.502 1.14 2.14 2.14 1.39 2.081 0.88 1.96 3.34 1.07 1.042 5.52 0.47 1.70 0.38 4.48
-0.54
-0.59
-0.56
-0.58
-0.72
-0.62
-0.52
-0.61
-0.81
-0.57
-0.66
-0.64
9
9
16
0.37
1.02
0.98
1.06
3.69
0.00
0.44
0.65
1.77
2.30
1.12
3.04
B-Zn-45N-12
12
24
18
6
7
6
21
16
36
B-Zn-45N-8
B-Zn-45N-9
B-Zn-45N-10
B-Zn-45N-11
B-Zn-45N-4
B-Zn-45N-5
B-Zn-45N-6
B-Zn-45N-7
Specimensa
B-Zn-45N-1
B-Zn-45N-2
B-Zn-45N-3
Water soluble Cl- (lb/yd3)
Table 2 – Galvanized Steel Critical Chloride Threshold
aBeam Specimens b10 chloride samples taken from each side of the bar per specimen cSD = Standard Deviation, COV = Coefficient of Variation *Outlier sample
14
1 2 3 4 51b - - - - - - - -2 8 0.84 -0.273 0.69 1.51 1.68 2.71 1.201b - - - - - - - -2 12 2.89 -0.396 0.94 2.39 1.28 4.78* 1.641 15 1.96 -0.404 0.69 0.82 0.63 0.82 0.942 14 1.79 -0.380 3.65* 1.70 1.01 1.32 2.271 9 1.76 -0.379 0.77 1.03 0.85 0.86 0.772 9 3.51 -0.421 0.80 1.04 1.67 0.60 0.771 14 0.82 -0.332 1.70 2.33 2.39 1.64 1.832 9 0.35 -0.280 0.87 0.84 0.65 1.03 0.691 20 1.52 -0.361 1.51 1.38 1.83 2.64 3.212 17 1.84 -0.379 2.71 1.83 1.83 3.02 2.83
Sidec
1 1.51 2.46 1.26 2.27 1.382 4.36* 2.29 1.95 2.31 1.451 2.27 0.85 1.82 1.67 1.302 1.13 2.71 2.71 2.77 2.581 2.27 1.04 1.89 2.77 3.97*2 2.14 3.08 1.57 2.90 2.20
MSE-Conv.-5
MSE-Conv.-6
MSE-Conv.-1
MSE-Conv.-2
MSE-Conv.-3
-0.344
B-Conv.-2 23 1.17 -0.392
B-Conv.-3 14 1.02
Top Potential (V)
B-Conv.-1 21 1.17 -0.358
Specimensa Bar No.
Age (weeks)
Rate (μm/yr)
MSE-Conv.-4
Water soluble Cl- (lb/yd3)
Average 6 7 8 9 10 (lb/yd3)
1b - - - - -2 - - - - -1b - - - - -2 - - - - -1 1.83 1.26 2.58 - -2 - - - - -1 0.77 0.58 1.29 0.77 1.372 1.02 0.84 1.38 0.77 1.631 1.13 1.51 0.92 0.73 1.202 0.87 0.73 0.73 1.60 0.941 1.33 3.02 1.45 2.27 2.082 1.13 1.16 1.32 2.20 1.70
Sidec
1 3.08 1.89 1.64 1.95 1.572 3.02 0.95 1.40 2.20 1.211 1.36 1.48 1.54 1.36 1.542 2.84 2.33 1.55 2.96 4.81*1 2.51 1.13 1.89 2.52 1.512 0.82 1.20 2.58 1.89 1.57
Average 1.63
Specimensa
MSE-Conv.-1
MSE-Conv.-2
MSE-Conv.-3
MSE-Conv.-4
MSE-Conv.-5
MSE-Conv.-6
B-Conv.-1
B-Conv.-2
B-Conv.-3
Water soluble Cl- (lb/yd3) SDd
1.56 0.62
0.98 0.32
2.02 0.68
COVd
1.56 0.74 0.48
0.40
1.32 0.64 0.48
0.33
1.22 0.54 0.44
0.34
1.88 0.59 0.32
1.94 0.67 0.35
1.97 0.66 0.34
Bar No.
Table 3 – Conventional Steel Critical Chloride Threshold
aB=Beam Specimens, MSE= Modified Southern Exposure bSample not available-bar subjected to testing using other trial methods c10 chloride samples taken from each side of the bar per specimen dSD = Standard Deviation, COV = Coefficient of Variation *Outlier sample

15
1 2 3 4 51 23 0.50 -0.390 5.41 5.98 5.70 7.93 9.822 17 0.60 -0.362 2.64 2.96 3.90 3.71 4.661 23 0.41 -0.333 5.85 4.85 10.07 8.99 10.652 28 0.01 -0.363 7.43 8.75 9.38 9.13 10.071b - - - - - - - -2 17 1.95 -0.460 2.52 4.09 4.31 5.04 5.731 30 0.57 -0.348 3.15 5.10 5.29 6.30 5.672 29 2.00 -0.367 4.91 3.97 3.46 6.67 5.10
MSE-MMFX-5c - - - - - - - - -1 26 1.20 -0.359 5.04 2.71 3.53 4.28 4.282 39 0.68 -0.368 4.23 4.91 5.59 5.36 5.21
Sided
1 7.30 9.25 9.63 8.61 9.322 9.95 9.90 10.51 10.12 8.081 2.14 2.46 3.15 3.12 5.292 3.84 4.78 5.67 5.54 5.161 6.42 6.30 6.78 8.03 7.352 8.37 6.17 4.60 5.92 5.35B-MMFX-3 36 0.56 -0.329
B-MMFX-2 26 1.22 -0.341
MSE-MMFX-3
MSE-MMFX-6
MSE-MMFX-2
-0.36B-MMFX-1 51 1.02
MSE-MMFX-4
Top Potential (V)
MSE-MMFX-1
Specimensa Bar No.
Age (weeks)
Rate (μm/yr)
Water soluble Cl- (lb/yd3)
Average 6 7 8 9 10 (lb/yd3)
1 10.26 11.08 11.52* 10.58 11.77*2 7.37 6.17 6.55 7.24 5.601 - - - - -2 8.75 13.09* 8.37 8.25 8.371b - - - - -2 7.55 6.23 8.18 5.04 5.791 5.67 3.84 - - -2 2.14 2.64 6.48 5.60 3.78
MSE-MMFX-5c - - - - - - - - -1 7.21 3.78 4.60 6.11 4.852 5.67 6.80 5.89 3.10 5.59
Sided
1 10.39 10.39 7.22 7.30 8.122 9.95 9.63 8.31 10.26 6.481 2.71 3.78 4.09 5.92 5.292 5.73 7.62 9.38 7.49 6.561 5.23 5.23 7.81 10.89 4.972 8.00 8.31 2.91 6.54 6.06
Average 6.34
1.59
5.45 1.66
SDe
6.53 2.59
Water soluble Cl- (lb/yd3)
6.56 3.10
6.54 1.69
4.69 1.37
6.99 2.11
8.49
COVe
0.40
0.19
0.30
B-MMFX-2
B-MMFX-3
0.29
0.30
0.47
0.26
6.22 1.72
Bar No.
MSE-MMFX-4
0.28
Specimensa
MSE-MMFX-1
MSE-MMFX-2
MSE-MMFX-3
MSE-MMFX-6
B-MMFX-1
Table 4 – MMFX Microcomposite Steel Critical Chloride Threshold
a B=Beam Specimens, MSE= Modified Southern Exposure b Sample not available-bar subjected to testing using other trial methods c Specimen contaminated from the outside d 10 chloride samples taken from each side of the bar per specimen e SD = Standard Deviation, COV = Coefficient of Variation *Outlier sample
16
The conventional steel bars had times-to-initiation ranging from 8 to 23 weeks, with an
average corrosion rate of 1.50 μm/yr and an average corrosion potential of –0.362 V with respect
to a copper-copper sulfate electrode at corrosion initiation. After the removal of outliers, the
average chloride threshold for all specimens is 1.63 lb/yd3. The individual chloride contents
range from 0.58 to 3.21 lb/yd3 and the average values for the individual specimens range from
0.98 to 2.02 lb/yd3. The coefficients of variation (COV) for individual bars range from 0.32 to
0.48, and COV for the average specimen threshold values is 0.38.
The MMFX bars had times-to-initiation ranging from 17 to 51 weeks, with an average
corrosion rate of 0.902 μm/yr and an average corrosion potential of –0.361 V with respect to a
copper-copper sulfate electrode at corrosion initiation. After the removal of outliers, the average
chloride threshold for all specimens is 6.34 lb/yd3. The individual chloride contents range from
2.14 to 11.08 lb/yd3 and the average values for the individual specimens range from 4.69 to 8.49
lb/yd3. The coefficients of variation (COV) for individual bars range from 0.19 to 0.47, and COV
for the average specimen threshold values is 0.31.
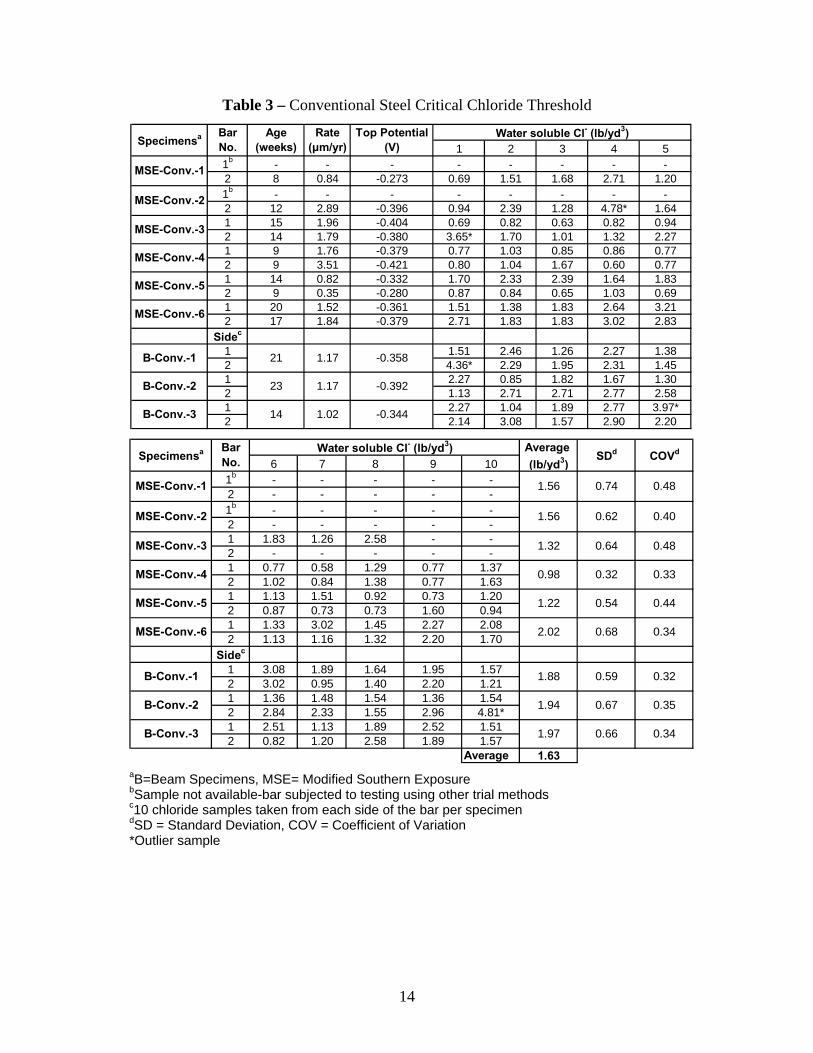
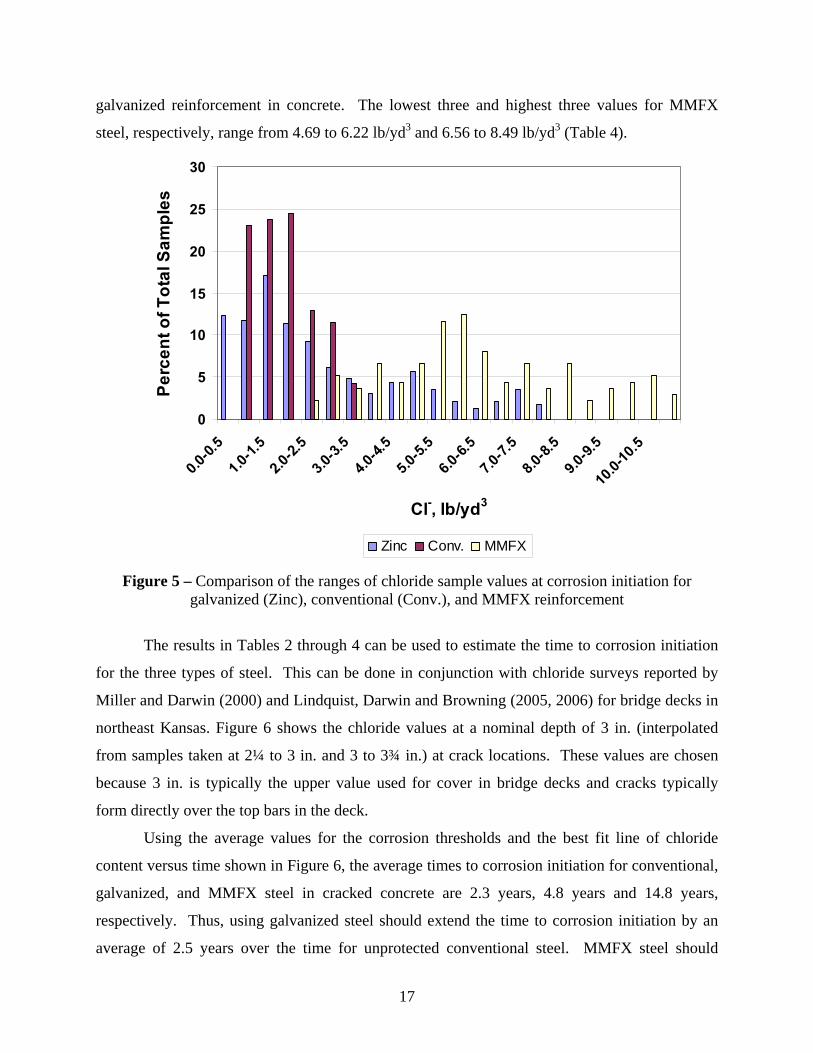
Tables 2 though 4 demonstrate that with an average value of 2.57 lb/yd3, galvanized steel
has a higher critical corrosion threshold than conventional steel, which has an average value of
1.63 lb/yd3, and a lower threshold than MMFX steel, which has an average value of 6.34 lb/yd3.
The tables also demonstrate that the corrosion threshold is not a single value for a metal, but
rather a range of values. This point is illustrated in Figure 5, which shows the ranges of chloride
sample values at corrosion initiation for galvanized, conventional, and MMFX reinforcement.
Galvanized and MMFX steel exhibit wider ranges than conventional steel. Of the three,
galvanized steel exhibits the lowest individual sample values, although this may be a function of
variability in the concrete within individual specimens. On the low side, however, galvanized
steel also exhibits low average values of the chloride threshold that match those exhibited by
conventional steel. For example, the three lowest values of the critical chloride corrosion
threshold for galvanized bars range from 1.00 to 1.07 lb/yd3, which are similar to the three
lowest values for conventional steel, which range from 0.98 to 1.32 lb/yd3 (Tables 2 & 3). In
contrast, on the high side, the three highest values of the critical chloride corrosion threshold for
galvanized bars range from 3.88 to 4.93 lb/yd3, which are far greater than the three highest
values for conventional steel, which range from 1.94 to 2.02 lb/yd3. This wide range in critical
chloride values may help explain the widely varying level of performance reported for
17
0
5
10
15
20
25
30
0.0-0.
5
1.0-1.
5
2.0-2.
5
3.0-3.
5
4.0-4.
5
5.0-5.
5
6.0-6.
5
7.0-7.
5
8.0-8.
5
9.0-9.
5
10.0-
10.5
Cl-, lb/yd3
Perc
ent o
f Tot
al S
ampl
es
Zinc Conv. MMFX
galvanized reinforcement in concrete. The lowest three and highest three values for MMFX
steel, respectively, range from 4.69 to 6.22 lb/yd3 and 6.56 to 8.49 lb/yd3 (Table 4).
Figure 5 – Comparison of the ranges of chloride sample values at corrosion initiation for galvanized (Zinc), conventional (Conv.), and MMFX reinforcement
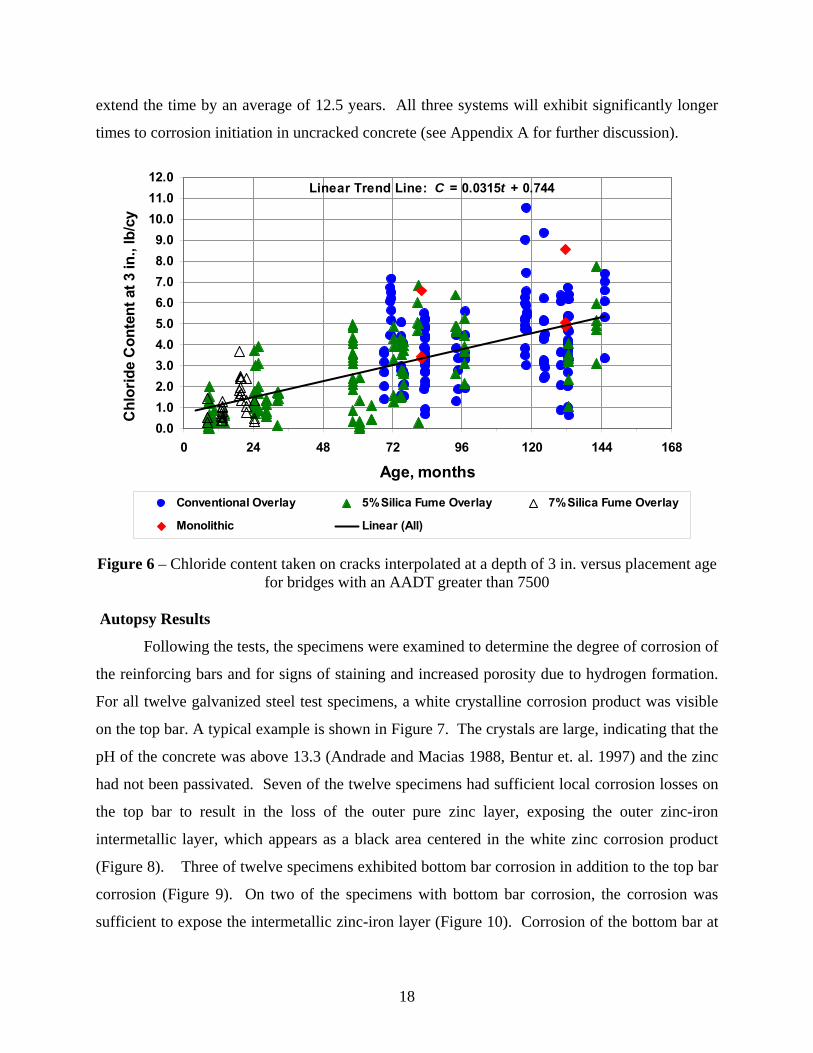
The results in Tables 2 through 4 can be used to estimate the time to corrosion initiation
for the three types of steel. This can be done in conjunction with chloride surveys reported by
Miller and Darwin (2000) and Lindquist, Darwin and Browning (2005, 2006) for bridge decks in
northeast Kansas. Figure 6 shows the chloride values at a nominal depth of 3 in. (interpolated
from samples taken at 2¼ to 3 in. and 3 to 3¾ in.) at crack locations. These values are chosen
because 3 in. is typically the upper value used for cover in bridge decks and cracks typically
form directly over the top bars in the deck.
Using the average values for the corrosion thresholds and the best fit line of chloride
content versus time shown in Figure 6, the average times to corrosion initiation for conventional,
galvanized, and MMFX steel in cracked concrete are 2.3 years, 4.8 years and 14.8 years,
respectively. Thus, using galvanized steel should extend the time to corrosion initiation by an
average of 2.5 years over the time for unprotected conventional steel. MMFX steel should
18
0.01.02.03.04.05.06.07.08.09.0
10.011.012.0
0 24 48 72 96 120 144 168
Age, months
Conventional Overlay 5% Silica Fume Overlay 7% Silica Fume Overlay
Monolithic Linear (All)
Linear Trend Line: C = 0.0315t + 0.744
Chl
orid
e C
onte
nt a
t 3 in
., lb
/cy
extend the time by an average of 12.5 years. All three systems will exhibit significantly longer
times to corrosion initiation in uncracked concrete (see Appendix A for further discussion).
Figure 6 – Chloride content taken on cracks interpolated at a depth of 3 in. versus placement age for bridges with an AADT greater than 7500
Autopsy Results
Following the tests, the specimens were examined to determine the degree of corrosion of
the reinforcing bars and for signs of staining and increased porosity due to hydrogen formation.
For all twelve galvanized steel test specimens, a white crystalline corrosion product was visible
on the top bar. A typical example is shown in Figure 7. The crystals are large, indicating that the
pH of the concrete was above 13.3 (Andrade and Macias 1988, Bentur et. al. 1997) and the zinc
had not been passivated. Seven of the twelve specimens had sufficient local corrosion losses on
the top bar to result in the loss of the outer pure zinc layer, exposing the outer zinc-iron
intermetallic layer, which appears as a black area centered in the white zinc corrosion product
(Figure 8). Three of twelve specimens exhibited bottom bar corrosion in addition to the top bar
corrosion (Figure 9). On two of the specimens with bottom bar corrosion, the corrosion was
sufficient to expose the intermetallic zinc-iron layer (Figure 10). Corrosion of the bottom bar at

19
corrosion initiation is unlikely due to chlorides. The presence of bottom bar corrosion may be
due to reduced passivity of zinc without the chromate treatment in plastic concrete or due to loss
of metal in presence of high-pH concrete pore solution. All specimens exhibited localized
corrosion on the bar comparable in area to the localized corrosion at initiation observed on
conventional bars (Figure 11). Measurements of total coating thickness using a pull-off gage
produced values ranging from 6.8 to 10 mils, with an average of 7.6 mils, with no more than a 2-
mil loss (this occurred on a bar with a coating thickness of 10 mils) at regions in which the pure
zinc layer had been lost, suggesting that, at the time of the autopsy, only the pure layer of zinc
had been lost. This loss, however, does not bode well for the long-term performance of the bars
because, without the outer layer of pure zinc, the intermetallic layers tend to break down very
rapidly because the protective layer of calcium hydroxyzincate cannot form (Andrade and
Macias 1988).
(a)
(b)
Figure 7 – Specimen B-Zn-45N-8 after autopsy. (a) Top bar (top) and bottom bars (bottom) after autopsy. (b) Corrosion product on top bar

20
(a)
(b)
Figure 8 – Specimen B-Zn-45N-3 after autopsy. (a) Top bar (top) and bottom bars (bottom) after autopsy. (b) Corrosion product on top bar showing underlying steel
Figure 9 – Specimen B-Zn-45N-11 showing corrosion on top bar (top) and bottom bars (bottom)
21
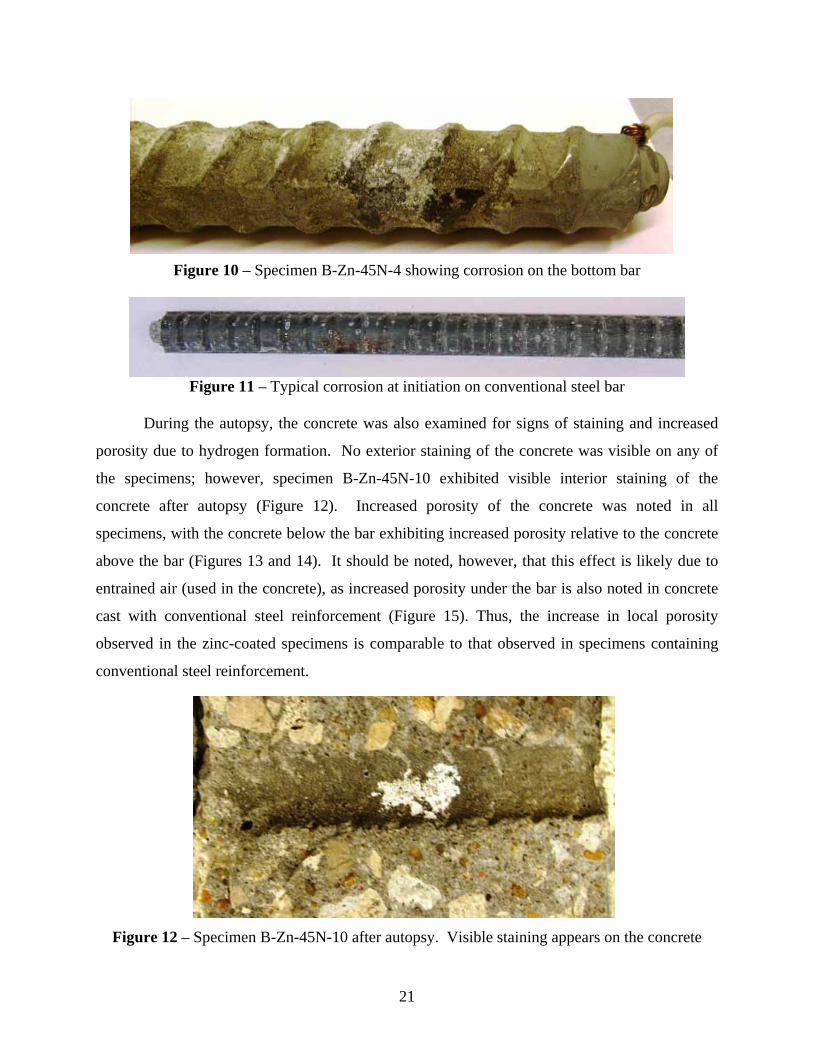
Figure 10 – Specimen B-Zn-45N-4 showing corrosion on the bottom bar
Figure 11 – Typical corrosion at initiation on conventional steel bar
During the autopsy, the concrete was also examined for signs of staining and increased
porosity due to hydrogen formation. No exterior staining of the concrete was visible on any of
the specimens; however, specimen B-Zn-45N-10 exhibited visible interior staining of the
concrete after autopsy (Figure 12). Increased porosity of the concrete was noted in all
specimens, with the concrete below the bar exhibiting increased porosity relative to the concrete
above the bar (Figures 13 and 14). It should be noted, however, that this effect is likely due to
entrained air (used in the concrete), as increased porosity under the bar is also noted in concrete
cast with conventional steel reinforcement (Figure 15). Thus, the increase in local porosity
observed in the zinc-coated specimens is comparable to that observed in specimens containing
conventional steel reinforcement.
Figure 12 – Specimen B-Zn-45N-10 after autopsy. Visible staining appears on the concrete

22
(a)
(b)
Figure 13 – Concrete from specimen B-Zn-45N-2 taken (a) above and (b) below the bar

23
(a)
(b)
Figure 14 – Concrete from specimen B-Zn-45N-2 taken (a) above and (b) below the bar

24
(a)
(b)
Figure 15– Concrete from conventional steel specimen taken (a) above and (b) below the bar
Summary
The beam tests demonstrate that galvanized reinforcement increases the time to corrosion
initiation compared with conventional steel. The average critical chloride thresholds for zinc,
conventional, and MMFX reinforcement are shown in Table 5. The average critical corrosion
threshold for galvanized reinforcement, 2.57 lb/yd3, is higher than the observed critical corrosion
threshold of conventional steel, 1.63 lb/yd3, and lower than the value for MMFX steel, 6.34
lb/yd3. The coefficient of variation for zinc reinforcement is larger than that for conventional
and MMFX reinforcement, potentially indicating a greater variation in the performance of

25
galvanized reinforcement. Zinc corrosion products were observed on the top bar of all twelve
specimens. Increased porosity was noted in the concrete directly beneath the reinforcement, but
the increase was comparable to that caused by entrained air with conventional reinforcement.
The presence of bottom bar corrosion may be due to a reduction in the passivity of zinc without a
chromate pretreatment in plastic concrete or due to loss of metal in presence of high-pH concrete
pore solution.
Table 5 – Average Critical Chloride Threshold (lb/yd3)
Specimens Average Median SDa COVa
Galvanized 2.57 1.83 2.09 0.62 Conventional 1.63 1.41 0.74 0.38 MMFX 6.34 5.92 2.24 0.31
aSD = Standard Deviation, COV = Coefficient of Variation
CONCLUSIONS
The following conclusions are based on the results and analyses presented in this report.
1. Galvanized reinforcement has a higher average critical chloride corrosion threshold than
conventional steel and a lower threshold than MMFX steel.
2. The range of values of chloride content at corrosion initiation is greater for galvanized
reinforcement than for conventional reinforcement. On the low side, galvanized steel
exhibits values that are similar in magnitude to those exhibited by conventional steel. This
may explain some of the variation in performance observed in the field for galvanized
reinforcing steel.
3. Some zinc corrosion products were observed on the surface of the galvanized bars.
4. Concrete adjacent to the non-chromate treated bars evaluated in this study revealed no
evidence of an increase in porosity due to hydrogen gas evolution during curing when
compared to conventional reinforcement in air-entrained concrete. Some galvanized bars,
however, showed signs of corrosion, including exposure of the intermetallic layer. The loss
of the zinc layer may be due to the lack of chromate treatment or due to loss of metal in
presence of high-pH concrete pore solution.
5. Based on chloride surveys of cracked bridge decks in Kansas, galvanized steel can be
expected to increase the average time to corrosion initiation at crack locations from 2.3 years
for conventional steel to 4.8 years for bars with 3 in. of concrete cover. Corrosion initiation

26
would be expected to occur at an average age of 14.8 years for MMFX steel. All three
systems will exhibit significantly longer times to corrosion initiation in uncracked concrete.
REFERENCES
Andrade, M. C. and Macias, A. (1988). “Galvanized Reinforcements in Concrete,” in Surface Coatings-2, A. D. Wilson, J. W. Nicolson, and H. J. Prosser, eds., Elsevier Applied Science, London and New York, pp. 137-182.
AASHTO T 260 (1997). “Standard Method of Test for Sampling and Testing for Chloride Ion in Concrete and Concrete Raw Materials,” AASHTO, Washington, DC.
ASTM A 615/A 615M. (2001). “Standard Specification for Deformed and Plain Carbon-Steel Bars for Concrete Reinforcement,” ASTM International, West Conshohocken, PA.
ASTM A 1035/ A 1035M. (2005). “Standard Specification for Deformed and Plain, Low-carbon, Chromium, Steel Bars for Concrete Reinforcement,” ASTM International, West Conshohocken, PA.
Bentur, A., Diamond, S., and Berke, N.S. (1997). Steel Corrosion in Concrete, E & FN Spon, New York, 133 pp.
Darwin, D., Browning, J., Nguyen, T. V., and Locke, C. E., “Evaluation of Metallized Stainless Steel Clad Reinforcement,” South Dakota Department of Transportation Report, SD2001-05-F, July 2007, 156 pp., also SM Report No. 90, University of Kansas Center for Research, Inc., Lawrence, Kansas
Ji, J., Darwin, D., and Browning, J. (2005). “Corrosion Resistance of Duplex Stainless Steels and MMFX Microcomposite Steel for Reinforced Concrete Bridge Decks,” SM Report No. 80, University of Kansas Center for Research, Inc., Lawrence, Kansas, December, 453 pp.
Jones, D. A. (1996). Principles and Prevention of Corrosion, Macmillan Publishing Company, New York, 500 pp.
Life-365, a Computer Program for Predicting the Service Life and Life-Cycle Costs of Reinforced Concrete Exposed to Chlorides, Concrete Corrosion Inhibitors Association, http://www.corrosioninhibitors.org/life365.htm
Lindquist, W. D., Darwin, D., and Browning, J. P. (2005). “Cracking and Chloride Contents in Reinforced Concrete Bridge Decks,” SM Report No. 78, University of Kansas Center for Research, Inc., Lawrence, Kansas, February 2005, 453 pp.
Lindquist, W. D., Darwin, D., Browning, J., and Miller, G. G. (2006). “Effect of Cracking on Chloride Content in Concrete Bridge Decks,” ACI Materials Journal, Vol. 103, No. 6, Nov.-Dec., pp. 467-473.

27
Manning, D. G., Escalante, E., and Whiting, D. (1982). Panel Report-Galvanized Rebars as Long –Term Protective System, Washington, D. C.
McCrum, L., and Arnold, C. J. (1993). “Evaluation of Simulated Bridge Deck Slabs Using Uncoated, Galvanized, and Epoxy Coated Reinforcing Steel,” Research Report No.R-1320, Michigan Department of Transportation, Lansing, MI.
Miller, G. and Darwin, D. (2000). “ Performance and Constructability of Silica Fume Bridge Deck Overlays,” SM Report No. 57, The University of Kansas Center for Research, Inc., Lawrence, KS, 423 pp.
Pianca, F. and Schell, H (2005). “The Long Term Performance of Three Ontario Bridges Constructed with Galvanized Reinforcement,” Report, Ontario Ministry of Transportation (MTO), Downsview, Ontario, Canada, 30 pp.
Virmani, Y. P., and Clemeña, G. G. (1998). “Corrosion Protection Concrete Bridges,” Report No. FHWA-RD-98-099, Federal Highway Administration, Washington, DC

28
APPENDIX A – CORROSION INITIATION IN UNCRACKED CONCRETE
The times to corrosion initiation discussed in the body of the report are based on chloride
contents at crack locations in bridge decks. Similar information is available for uncracked
regions in the same bridge decks. For all bridge decks in the study, the linear trend line for
chloride concentration versus deck age at a depth of 3 in. is (Lindquist et al. 2006)
C = 0.0053t - 0.0225 (A.1)
where C = chloride concentration, lb/yd3
t = deck age, months
Based on Eq. (A.1), the average times to corrosion initiation in uncracked regions on
bridge decks would be 26, 41, and 100 years for conventional, galvanized, and MMFX
reinforcement, respectively, demonstrating that uncracked concrete provides excellent protection
against chloride penetration. These values closely match those used in life-cycle models in which
chloride penetration is based on diffusion through uncracked concrete. The models (Life-365)
usually couple the time to corrosion initiation with a “standard” time for corrosion propagation
(time during which corrosion products cause concrete to crack) of 5 years for conventional
reinforcement to allow the models to give a reasonably good match with observed values of
service life. The 5-year period, however, greatly overestimates the rate of corrosion (Ji et al
2005, Darwin et al. 2007). For example, based on corrosion rates obtained in the laboratory (Ji et
al 2005, Darwin et al. 2007), the propagation time required to crack concrete in a bridge deck
after corrosion has begun would be approximately 10 years for conventional reinforcement,
giving an average total time to first repair of 36 years, which is much greater than obtained in the
field. In Kansas, bridge decks containing conventional reinforcement typically require
replacement within 20 years, with individual times to repair ranging from 10 to 25 years. Thus,
actual performance is much more in tune with a corrosion initiation time of 2.3 years, calculated
for cracked concrete, and realistic rates of corrosion, and diffusion of chlorides through
uncracked concrete does not appear to provide a good basis for estimating the life expectancy of
reinforced concrete structures that are subjected to chloride attack. Because of this lack of
correlation, times to corrosion initiation for uncracked concrete are not cited in the body of this
report.