Embed Size (px)
Citation preview

arX
iv:1
210.
3632
v1 [
q-bi
o.N
C]
12
Oct
201
2
Chapter 1
Critical brain dynamics at
large scale
Dante R. Chialvo
CONICET, (Consejo Nacional de Investigaciones Cientıficas y Tecnologicas),Buenos Aires, Argentina.
Essentially, all modeling of brain function from studying models of
neural networks has ignored the self-organized aspects of the process,
but has concentrated on designing a working brain by engineering all
the connections of inputs and outputs.Per Bak[1]
Abstract - Highly correlated brain dynamics produces synchronized states with no be-havioral value, while weakly correlated dynamics prevent information flow. In betweenthese states, the unique dynamical features of the critical state endow the brain withproperties which are fundamental for adaptive behavior. We discuss the idea put for-ward two decades ago by Per Bak that the working brain stays at an intermediate(critical) regime characterized by power-law correlations. This proposal is now sup-ported by a wide body of empirical evidence at different scales demonstrating that thespatiotemporal brain dynamics exhibit key signatures of critical dynamics, previouslyrecognized in other complex systems. The rationale behind this program is discussedin these notes, followed by an account of the most recent results.
In “Criticality in Neural Systems”, Niebur E, Plenz D, Schuster HG. (eds.) 2013 (inpress).
1
2 CHAPTER 1. CRITICAL BRAIN DYNAMICS AT LARGE SCALE
1.1 Introduction: If criticality is the solution,
what is the problem?
Criticality, in simple terms, refers to a distinctive set of properties found only at theboundary separating regimes with different dynamics, for instance between an orderedand a disordered phase. The dynamics of critical phenomena are a peculiar mix of orderand disorder, whose detailed understanding constitute one of the mayor achievementsof statistical physics in the last century [2].
What is the problem for which critical phenomena can be relevant in the contextof the brain? The first problem is to understand how the very large conglomerate ofinterconnected neurons produce a wide repertoire of behaviors in a flexible and selforganized way. This issue is not resolved at any rate, demonstrable by the fact thatdetailed models constructed to account for such dynamics fail at some of the threeemphasized aspects: Either 1) the model is an unrealistic low dimensional version ofthe neural structure of interest; or 2) it produces a single behavior (i.e., a hardwiredcircuit); and consequently 3) it cannot flexibly perform more than one simple thing. Acareful analysis of the literature will reveal that only by arbitrarily changing the neu-ronal connections, current mathematical models can play a reasonable wide repertoireof behaviors. Of course, this rewiring implies a kind of supplementary brain governingwhich connections need to be rewired in each case. Consequently, generating behav-ioral variability out of the same neural structure is a fundamental question which isscreaming to be answered, but seldom is even being asked.
A second related problem is how stability is achieved in such a very large systemwith astronomical number of neurons, each one continuously receiving thousands ofinputs from other neurons. We still lack a precise knowledge of how the cortex preventsan explosive propagation of activity while still managing to share information acrossareas. It is obvious that if the average number of neurons activated by one neuron istoo high (i.e., supercritical) a massive activation of the entire network will ensue, whileif it is too low (i.e., subcritical), propagation will die out. It was Turing, about fiftyyears ago [3], the first to speculate that the brain, in order to work properly, needs tobe at a critical regime, i.e., one in which these opposing forces are balanced.
Criticality as a potential solution to these issues was first explored by Per Bak [1]and colleagues [4, 5, 6, 7, 8] while attempting to apply ideas of self-organized criticality[9, 10] to the study of living systems. Throughout the last decade of his short butproductive life, in uncountable lively lectures, Bak enthusiastically broadcasted theidea that if the world at large is studied as any other complex system, it will reveala variety of instances in which critical dynamics will be recognized as the relevantphenomena at play. Basically, the emphasis was in considering criticality as anotherattractor. The claim was that “dynamical systems with extended spatial degrees of
freedom naturally evolve into self-organized critical structures of states which are barely
stable. The combination of dynamical minimal stability and spatial scaling leads to a
power law for temporal fluctuations” [9].
These ideas were only a portion of Bak’s much broader and deeper insight abouthow Nature works in general, often communicated in his unforgiving way, as for in-stance when challenging colleagues by asking: “Is biology too difficult for biologists?
And what can physics, dealing with the simple and lawful, contribute to biology, which
deals with the complex and diverse. These complex many-body problems might have
similarities to problems studied in particle and solid-state physics.” [11]. Thus, Per Bakwas convinced that the critical state was a novel dynamical attractor to which large

1.2. WHAT IS CRITICALITY GOOD FOR? 3
distributed systems will eventually converge, given some relatively simple conditions.From this viewpoint, the understanding of the brain belongs to the same problem ofunderstanding complexity in Nature.
The above comments should inspire us to think again about the much larger ques-tion underlying the study of brain dynamics using ideas from critical phenomena.Bak’s (and colleagues) legacy will be incomplete if we restrict ourselves (for instance)to find power laws in the brain and compare it in health and disease. By its theoreticalfoundations, critical phenomena offers the opportunity to understand how the brainworks, in the same magnitude that it impacted in some other areas, as for instancein the mathematical modeling of Sepkoski fossil record of species extinction events,which opened a completely novel strategy to study how macroevolution works [12].
The remaining of these notes are dedicated to review recent work on large scalebrain dynamics inspired on Bak’s ideas. The material is organized as follows: the nextsection dwells into what is essentially novel about critical dynamics; Sections 3 and4 are dedicated to discuss how to recognize criticality. Section 5 discusses the mainimplications of the results presented and Section 6 close the chapter with a summary.
1.2 What is criticality good for?
According to this program the methods used in physics to study the properties ofmatter should be useful to characterize brain function [13]. How reasonable is that?A simple but strong assumption needs to be made: that the mind is nothing morethan the emergent global dynamics of neuronal interactions, in the same sense thanferromagnetism is an emergent property of the interaction between neighboring spinsand an external field. To appreciate the validity of this point a key result from statis-tical physics is relevant here: universality. In brief, this notion says that a huge familyof systems will follow the same laws and exhibit the same dynamics providing thatsome set of minimum conditions are meet. This conditions involve only the presenceof some nonlinearity, under some boundary conditions and some type of interactions.Any other details of the system will not be relevant, meaning that the process willarise in the same quanti- and qualitative manner in very diverse systems, where or-der, disorder or the observation of one type of dynamics over another will be dictatedby the strength and type of the interactions. This is seen throughout nature, fromcell function (warranted by the interaction of multiple metabolic reactions) to globalmacroeconomics (modulated by trade), and so on.
Perhaps, considering the unthinkable one could appreciate better what universalitymeans, in general, and later translate it to complex systems. The world would be acompletely different place without universality, imagine if each phenomena would beexplained by a different “relation” (since it would not be possible to talk in terms ofgeneral laws) between intervening particles and forces. Gravity would be different foreach metals or different materials, Galileo’s experiments would not repeat themselvesunless for the same material he used, etc. It can be said that without universality,each phenomena we are familiar with would be foreign and strange.
1.2.1 Emergence
Throughout nature, it is common to observe similar collective properties emerging in-dependently of the details of each system. But what is emergence and why is relevant

4 CHAPTER 1. CRITICAL BRAIN DYNAMICS AT LARGE SCALE
to discuss it in this context? Emergence refers to the unexpected collective spatiotem-poral patterns exhibited by large complex systems. In this context, “unexpected”refers to our inability (mathematical and otherwise) to derive such emergent patternsfrom the equations describing the dynamics of the individual parts of the system. Asdiscussed at length elsewhere [1, 14], complex systems are usually large conglomeratesof interacting elements, each one exhibiting some sort of nonlinear dynamics. With-out entering into details, it is also known that the interaction can also be indirect,for instance through some mean field. Usually energy enters into the system, thussome sort of driving is present. The three emphasized features, ( i.e., large number ofinteracting nonlinear elements) are necessary, although not sufficient, conditions for asystem to exhibit emergent complex behavior at some point.
As long as the dynamics of each individual element is nonlinear, other details of theorigin and nature of the nonlinearities are not important [1, 15]. For instance, elementscan be humans, driven by food and other energy resources, from which some collectivepolitical or social structure eventually arises. It is well known that, whatever the typeof structure that emerges, it is unlikely to appear if one of the three above-emphasizedproperties is absent. Conversely, the interaction of a small number of linear elementswon’t produce any of this “unexpected” complex behavior (indeed this is the case inwhich everything can be mathematically anticipated).
1.2.2 Spontaneous brain activity is complex
It is evident, from the very early electrical recordings a century ago, that the brainis spontaneously active, even in absence of external inputs. However obvious thisobservation could appear, it was only recently that the dynamical features of thespontaneous brain state started to be studied in any significant way.
Work on brain rhythms at small and large brain scales shows that spontaneoushealthy brain dynamics is not composed by completely random activity patterns norby periodic oscillations [16]. Careful analysis of the statistical properties of neuraldynamics under no explicit input has identified complex patterns of activity previouslyneglected as background noise dynamics. The fact is that brain activity is alwaysessentially arrhythmic regardless of how it is monitored, whether as electrical activityin the scalp (EEG), by techniques of functional magnetic resonance imaging (fMRI),in the synchronization of oscillatory activity [17, 18], or in the statistical features oflocal field potentials peaks [19].
It has been pointed out repeatedly [20, 21, 22, 23, 24] that, under healthy condi-tions, no brain temporal scale takes primacy over average, resulting in power spectraldensities decaying of “1/f noise”. Behavior, the ultimate interface between brain dy-namics and the environment, also exhibits scale invariant features as shown in humancognition [25, 26, 27] human motion [28] as well as animal motion [29]. The origin ofthe brain scale free dynamics was not adequately investigated until recently, probably(and paradoxically) due to the ubiquity of scale invariance in nature [1]. The potentialsignificance of a renewed interpretation of the brain spontaneous patterns in term ofscale invariance is at least double. On one side, it provides important clues aboutbrain organization, in the sense that our previous ideas cannot easily accommodatethese new findings. Also, the class of complex dynamics observed seems to providethe brain with previously unrecognized robust properties.

1.3. STATISTICAL SIGNATURES OF CRITICAL DYNAMICS 5
1.2.3 Emergent complexity is always critical
The commonality of scale-free dynamics in the brain naturally leads one to ask whatphysics knows about very general mechanisms able to produce such dynamics. At-tempts to explain and generate nature’s non- uniformity included several mathemati-cal models and recipes, but few succeeded in creating complexity without embeddingthe equations with complexity. The important point is that including the complex-ity in the model will only result in a simulation of the real system, without entailingany understanding of complexity. The most significant efforts were those aimed atdiscovering the conditions in which something complex emerges from the interactionof the constituting non-complex elements [1, 9]. Initial inspiration was drawn fromwork in the field of phase transitions and critical phenomena. Precisely, one of thenovelties of critical phenomena is the fact that out of the short-range interaction ofsimple elements eventually long-range spatiotemporal correlated patterns emerge. Assuch, critical dynamics have been documented in species evolution [1], ants collec-tive foraging [30, 31] and swarm models [32], bacterial populations [33], traffic flow inhighways [1] and on the Internet [34], macroeconomic dynamics [35], forest fires [36],rainfall dynamics [37, 38, 39] and flock formation [40]. Same rationale leads to theconjecture [1, 6, 7] that also the complexity of brain dynamics is just another signa-ture of an underlying critical process. Since at the point near the transition the largestnumber of metastable states exists, the brain can then access the largest repertoire ofbehaviors in a flexible way. That view claimed that the most fundamental propertiesof the brain only are possible staying close to that critical instability independentlyof how such state is reached or maintained. In the following sections recent empiricalevidence supporting this hypothesis will be discussed.
1.3 Statistical signatures of critical dynamics
The presence of scaling and correlations spanning the size of the system are usuallyhints of critical phenomena. While, in principle, it is relatively simple to identify thesesignatures, in the case of finite data and the absence of a formal theory, as is the case ofthe brain, any initial indication of criticality need to be checked against many knownartifacts. In the next paragraphs we discuss the most relevant efforts to identify thesesignatures in large scale brain data.
1.3.1 Hunting for power laws in densities functions
The dynamical skeleton of a complex system can be derived from its correlation net-work, i.e., the subsets of the nodes linked by some minimum correlation value (com-puted from the system activity). As early as 2003 Eguiluz and colleagues [41] usedfunctional magnetic resonance imaging (fMRI) data to extract for the very first func-tional networks connecting correlated human brain sites. Networks were constructed(see Fig. 1.1) by connecting the brain sites with strongest correlations between theirblood oxygenated level dependent (BOLD) signal. The analysis of the resulting net-works in different tasks showed that: (a) the distribution of functional connections, andthe probability of finding a link vs. distance were both scale-free, (b) the characteristicpath length was small and comparable with those of equivalent random networks, and(c) the clustering coefficient was orders of magnitude larger than those of equivalentrandom networks. It was suggested that these properties, typical of scale-free small

6 CHAPTER 1. CRITICAL BRAIN DYNAMICS AT LARGE SCALE
Figure 1.1: Methodology used to extract functional networks from the brainfMRI BOLD signals. The correlation matrix is calculated from all pairs of BOLDtime series. The strongest correlations are selected to define the networks nodes.Top four images represent examples of snapshots of activity at one moment andthe three traces correspond to time series of activity at selected voxels fromvisual (V1), motor (M1) and posterio-parietal (PP) cortices. Figure redrawnfrom [41]
world networks, should reflect important functional information about brain statesand provide mechanistic clues.
This was investigated in a subsequent paper by Fraiman et al. [42] who studied thedynamic of the spontaneous (i.e., at “rest”) fluctuations of brain activity with fMRI.Brain “rest” is defined -more or less unsuccessfully- as the state in which there is noexplicit brain input or output. Now is widely accepted that the structure and locationof large-scale brain networks can be derived from the interaction of cortical regionsduring rest which closely match the same regions responding to a wide variety ofdifferent activation conditions [43, 44]. These so-called resting state networks (RSN)can be reliably computed from the fluctuations of the BOLD signals of the restingbrain, with great consistency across subjects [45, 46, 47] even during sleep [48] oranesthesia [49]. Fraiman et al [42] focused on the question of whether such states canbe comparable to any known dynamical state. For that purpose, correlation networksfrom human brain fMRI were contrasted with correlation networks extracted fromnumerical simulations of the Ising model in 2D, at different temperatures. For thecritical temperature Tc, striking similarities (as shown in Fig. 1.2) appear in the mostrelevant statistical properties, making the two networks indistinguishable from eachother. These results were interpreted as lending additional support to the conjecturethat the dynamics of the functioning brain is near a critical point.
Kitzbichler et al [50] analyzed functional MRI and MEG data recorded from nor-mal volunteers at resting state using phase synchronization between diverse spatiallocations. They reported a scale invariant distribution for the length of time that

1.3. STATISTICAL SIGNATURES OF CRITICAL DYNAMICS 7
101
102
103
Degree (k)
101
102
103
Fre
quen
cy
101
102
103
Degree (k)10
110
210
3
Degree (k)
101
102
103
Degree (k)
101
102
103
Fre
quen
cy
< k > ~ 713< k > ~ 127< k > ~ 26
T = 2 T = 2.3 T = 3
Brain
Figure 1.2: At criticality, brain and Ising networks are indistinguishable fromeach other. The graphs show a comparison of the link density distributionscomputed from correlation networks extracted from brain data (bottom panel)and from numerical simulations of the Ising model (top three panels) at threetemperatures: critical (T = 2.3), sub (T = 2) and supercritical (T = 3). Topthree panels depict the degree distribution for the Ising networks at T = 2,T = 2.3 and T = 3 for three representative values of 〈k〉 ≈ 26, 127, and 713.Bottom panel: Degree distribution for correlated brain network for the samethree values of 〈k〉. Figure redrawn from Fraiman et al [42].
two brain locations on the average remained locked. This distribution was also foundin the Ising and the Kuramoto model [51] at the critical state, suggesting that thedata exhibited criticality. This work was revisited recently by Botcharova et al. [52]who investigated whether the display of power law statistics of the two measures ofsynchronization - phase locking intervals and global lability of synchronization - canbe analogous to similar scaling at the critical threshold in classical models of syn-chronization. Results confirmed only partially the previous findings, emphasizing theneed to proceed with caution in making direct analogies between the brain dynam-ics and systems at criticality. Specifically, they showed that “the pooling of pairwisephase-locking intervals from a non-critically interacting system can produce a distri-bution that is similarly assessed as being power law. In contrast, the global labilityof synchronization measure is shown to better discriminate critical from non criticalinteraction” [52].
The works commented up until now rely on determining if probability density func-tions (i.e., node degree, or synchronization lengths) obey power laws. The approachfrom Expert et al. [53] looked at a well known property of the dynamics at criticality:self-similarity. They investigated whether the two point correlation function can berenormalized. This is a very well understood technique used in critical phenomenain which the data sets are coarse grained at successive scales while computing somestatistic. They were able to show that the two point correlation function of the BOLDsignal is invariant under changes in the spatial scale as shown in Fig. 1.3, which to-gether with the temporal 1/f scaling exhibited by BOLD time series, suggests critical

8 CHAPTER 1. CRITICAL BRAIN DYNAMICS AT LARGE SCALE
Figure 1.3: Self-similarity of the brain fMRI two-correlation function. Theplot shows the renormalized average correlation function versus distance forthe four levels of description: solid line: 128 x 128 x31 (n=0); dashed line:64x64x16(n=1); dahsed-dotted, 32 x 32 x 8 (n=2); and dotted line: 16x16x4(n= 3). (a) Linear-linear and (b) log-log axis. The exponent β = 0.47+ /− 0.2describes well the data. Figure redrawn from Expert et al. [53]
dynamics.
1.3.2 Beyond fitting: variance and correlation scaling of
brain noise
An unexpected new angle into the problem of criticality was offered by the surginginterest in the source of the BOLD signal variability and its information content. Forinstance, it was shown recently [54] in a group of subjects of different age, that theBOLD signal standard deviation can be a better predictor of the subject age thanthe average. Furthermore, additional work focused on the relation between the fMRIsignal variability and a task performance, concluded that faster and more consistentperformers exhibit significantly higher brain variability across tasks than the poorerperforming subjects [55]. Overall, these results suggested that the understanding ofthe brain resting dynamics can benefit from a detailed study of the BOLD variabilityper se.

1.3. STATISTICAL SIGNATURES OF CRITICAL DYNAMICS 9
Precisely at this aim was directed the work in [56], which studied the statisticalproperties of the spontaneous BOLD fluctuations and its possible dynamical mecha-nisms. In these studies, an ensemble of brain regions of different sizes were definedand the statistics of the fluctuations and correlations were computed as a function ofthe region’s size. The report identifies anomalous scaling of the variance as a functionof the number of elements and a distinctive divergence of the correlations with the sizeof the cluster considered. We now proceed to describe these findings in detail.
Anomalous scaling:
The object of interest are the fluctuations of the BOLD signal around its mean, whichfor the thirty-five RSN clusters used by [56], are defined as
Bh(~xi, t) = B(~xi, t)−1
NH
NH∑
i=1
B(~xi, t), (1.1)
where ~xi represents the position of the voxel i that belongs to the cluster H of sizeNH . These signals will be used to study the correlation properties of the activity ineach cluster.
The mean activity of each h cluster is defined as
B(t) =1
NH
NH∑
i=1
B(~xi, t), (1.2)
and its variance is defined as
σ2
B(t)=
1
T
T∑
t=1
(B(t)−B)2, (1.3)
where B = 1
T
T∑t=1
B(t) and T the number of temporal points. Please notice that the
average subtracted in Eq. 1 is the mean at time t (computed over N voxels) of theBOLD signals, not to be confused with the BOLD signal averaged over T temporalpoints.
Since the BOLD signal fluctuates widely and the numberN of voxels in the clusterscan be very large, one might expect that the aggregate of Eq. 1 obeys the law ofthe large numbers. If this was true, the variance of the mean field σ2
B(t)in Eq. 3
would decrease with N as N−1. In other words one would expect a smaller amplitudefluctuation for the average BOLD signal recorded in clusters (i.e., B(t)) comprised bylarge number of voxels compared with smaller clusters. However, the data in Fig. 1.4Ashows otherwise, the variance of the average activity remains approximately constantover a change of four orders of magnitude in cluster’ sizes. The strong departure fromthe N−1 decay is enough to disregard further statistical testing. which is confirmedby recomputing the variance for artificially constructed clusters having similar numberof voxels but composed of the randomly reordered Bk(t) BOLD raw time series (asthe four examples in the top left panels of Fig. 1.4A). As expected, in this case thevariance (plotted using squares symbols in the bottom panel of Fig. 1.4A ) obeys theN−1 law).

10 CHAPTER 1. CRITICAL BRAIN DYNAMICS AT LARGE SCALE
A B
Figure 1.4: Spontaneous fluctuations of fMRI data shows anomalous behaviorof the variance (A) and divergence of the correlation length (B). Top figuresin Panel A show four examples of average BOLD time series (i.e., B(t) in Eq.2) computed from clusters of different sizes N . Note that while the amplitudeof the raw BOLD signals (right panels) remains approximately constant, in thecase of the shuffled data sets (left panels) the amplitude decreases drastically forincreasing cluster sizes. The bottom graph in Panel A shows the calculations forthe thirty five clusters (circles) plotted as a function of the cluster size demon-strating that variance is independent of the RSN’s cluster size. The squaressymbols show similar computations for a surrogate time series constructed byrandomly reordering the original BOLD time series, which exhibit the expected1/N scaling (dashed line). Filled symbols in bottom panel are used to denotethe values for the time series used as examples in the top panel. In panel B thereare three graphs: the top one shows the correlation function C(r) as a functionof distance for clusters of different sizes. Contrary to naive expectations, largeclusters are as correlated as relatively smaller ones: the correlation length in-creases with cluster size, a well known signature of criticality. Each line in thetop panel shows the mean cross-correlation C(r) of BOLD activity fluctuationsas a function of distance r averaged over all time series of each of the thirty fiveclusters. The correlation length ξ, denoted by the zero crossing of C(r) is nota constant. As shown in the middle graph scale ξ grows linearly with the aver-age cluster’ diameter d for all the thirty five clusters (filled circles), ξ ∼ N1/3.The bottom graph shows the collapse of C(r) by rescaling the distance with ξ.Figure redrawn from Fraiman et al [56]
1.3. STATISTICAL SIGNATURES OF CRITICAL DYNAMICS 11
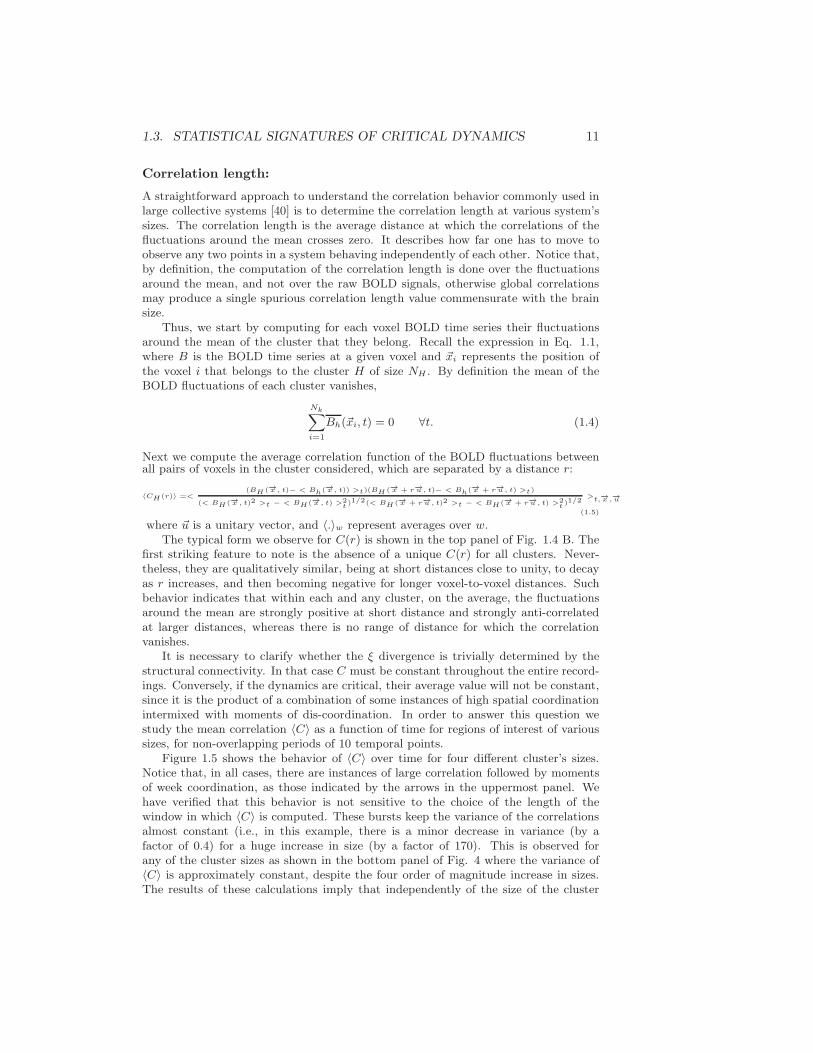
Correlation length:
A straightforward approach to understand the correlation behavior commonly used inlarge collective systems [40] is to determine the correlation length at various system’ssizes. The correlation length is the average distance at which the correlations of thefluctuations around the mean crosses zero. It describes how far one has to move toobserve any two points in a system behaving independently of each other. Notice that,by definition, the computation of the correlation length is done over the fluctuationsaround the mean, and not over the raw BOLD signals, otherwise global correlationsmay produce a single spurious correlation length value commensurate with the brainsize.
Thus, we start by computing for each voxel BOLD time series their fluctuationsaround the mean of the cluster that they belong. Recall the expression in Eq. 1.1,where B is the BOLD time series at a given voxel and ~xi represents the position ofthe voxel i that belongs to the cluster H of size NH . By definition the mean of theBOLD fluctuations of each cluster vanishes,
Nk∑
i=1
Bh(~xi, t) = 0 ∀t. (1.4)
Next we compute the average correlation function of the BOLD fluctuations betweenall pairs of voxels in the cluster considered, which are separated by a distance r:
〈CH (r)〉 =<(BH (−→x , t)− < Bh(−→x , t)) >t)(BH (−→x + r−→u , t)− < Bh(−→x + r−→u , t) >t)
(< BH (−→x , t)2 >t − < BH (−→x , t) >2t )1/2(< BH (−→x + r−→u , t)2 >t − < BH (−→x + r−→u , t) >2
t )1/2>t,−→x ,−→u
(1.5)
where ~u is a unitary vector, and 〈.〉w represent averages over w.The typical form we observe for C(r) is shown in the top panel of Fig. 1.4 B. The
first striking feature to note is the absence of a unique C(r) for all clusters. Never-theless, they are qualitatively similar, being at short distances close to unity, to decayas r increases, and then becoming negative for longer voxel-to-voxel distances. Suchbehavior indicates that within each and any cluster, on the average, the fluctuationsaround the mean are strongly positive at short distance and strongly anti-correlatedat larger distances, whereas there is no range of distance for which the correlationvanishes.
It is necessary to clarify whether the ξ divergence is trivially determined by thestructural connectivity. In that case C must be constant throughout the entire record-ings. Conversely, if the dynamics are critical, their average value will not be constant,since it is the product of a combination of some instances of high spatial coordinationintermixed with moments of dis-coordination. In order to answer this question westudy the mean correlation 〈C〉 as a function of time for regions of interest of varioussizes, for non-overlapping periods of 10 temporal points.
Figure 1.5 shows the behavior of 〈C〉 over time for four different cluster’s sizes.Notice that, in all cases, there are instances of large correlation followed by momentsof week coordination, as those indicated by the arrows in the uppermost panel. Wehave verified that this behavior is not sensitive to the choice of the length of thewindow in which 〈C〉 is computed. These bursts keep the variance of the correlationsalmost constant (i.e., in this example, there is a minor decrease in variance (by afactor of 0.4) for a huge increase in size (by a factor of 170). This is observed forany of the cluster sizes as shown in the bottom panel of Fig. 4 where the variance of〈C〉 is approximately constant, despite the four order of magnitude increase in sizes.The results of these calculations imply that independently of the size of the cluster

12 CHAPTER 1. CRITICAL BRAIN DYNAMICS AT LARGE SCALE
considered, there is always an instance in which a large percentage of voxels are highlycoherent and another instance in which each voxels activity is relatively independent.
Thus, to summarize Fraiman et al. work [56], revealed three key statistical prop-erties of the brain BOLD signal variability:
• the variance of the average BOLD fluctuations computed from ensembles ofwidely different sizes remains constant, (i.e., anomalous scaling);
• the analysis of short-term correlations reveals bursts of high coherence betweenarbitrarily far apart voxels indicating that the variance anomalous scaling hasa dynamical (and not structural) origin;
• the correlation length measured at different regions increases with region’s size,as well as its mutual information.
1.4 Beyond averages: Spatiotemporal brain dy-
namics at criticality
Without exception, all the reports considering large scale brain critical dynamics re-sorted to the computation of averages over certain time and/or space scales. However,since time and space is essential for brain function, it would be desirable to makestatements of where and when the dynamics is at the brink of instability, i.e., thehallmark of criticality. In this section we summarize novel ideas that attempt to meetthis challenge by developing techniques that consider large-scale dynamics in spaceand time in the same way that climate patterns are dealt with, tempting us to callthese efforts “brain meteorology”.
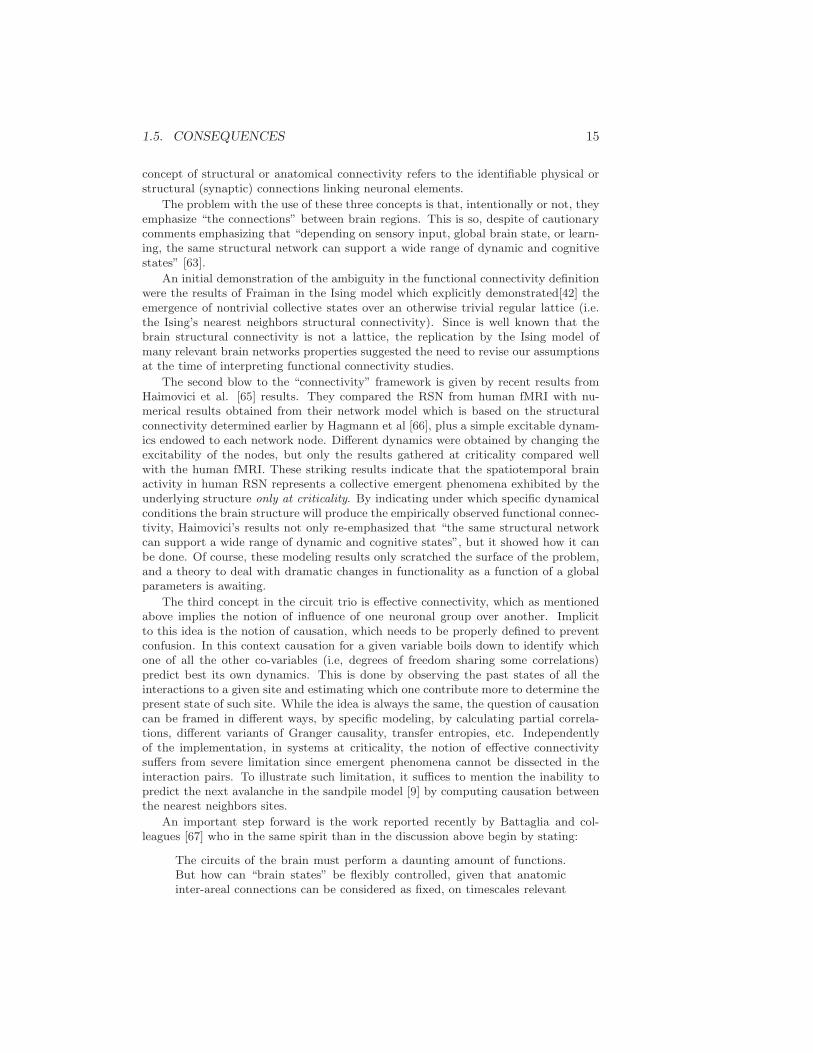
Tagliazucchi et al. departed from the current brain imaging techniques based onthe analysis of gradual and continuous changes in the brain blood oxygenated leveldependent (BOLD) signal. By doing that they were able to show that the relativelylarge amplitude BOLD signal peaks [57] contain substantial information. These find-ings suggested the possibility that relevant dynamical information can be condensedin discrete events. If that was true, then the possibility to capture space and time waspossible, an objective ultimately achieved in a subsequent report by Tagliazucchi andcolleagues [58] which demonstrated how brain dynamics at resting state can be cap-tured just by the timing and location of such events, i.e., in terms of a spatiotemporalpoint process.
1.4.1 fMRI as a point process
The application of this novel method allowed, for the first time, to define a theoreticalframework in terms of an order and control parameter derived from fMRI data, wherethe dynamical regime can be interpreted as one corresponding to a system close to thecritical point of a second order phase transition. The analysis demonstrated that theresting brain spends most of the time near the critical point of such transition andexhibits avalanches of activity ruled by the same dynamical and statistical propertiesdescribed previously for neuronal events at smaller scales.
The data in Figure 1.6 shows an example of a point process extracted from a BOLDtime series. A qualitative comparison with the established method of deconvolving theBOLD signal with the hemodynamics response function suggest that at first order, thepoint process is equivalent to the peaks of the deconvolucion.
1.4. BEYONDAVERAGES: SPATIOTEMPORALBRAIN DYNAMICS AT CRITICALITY13
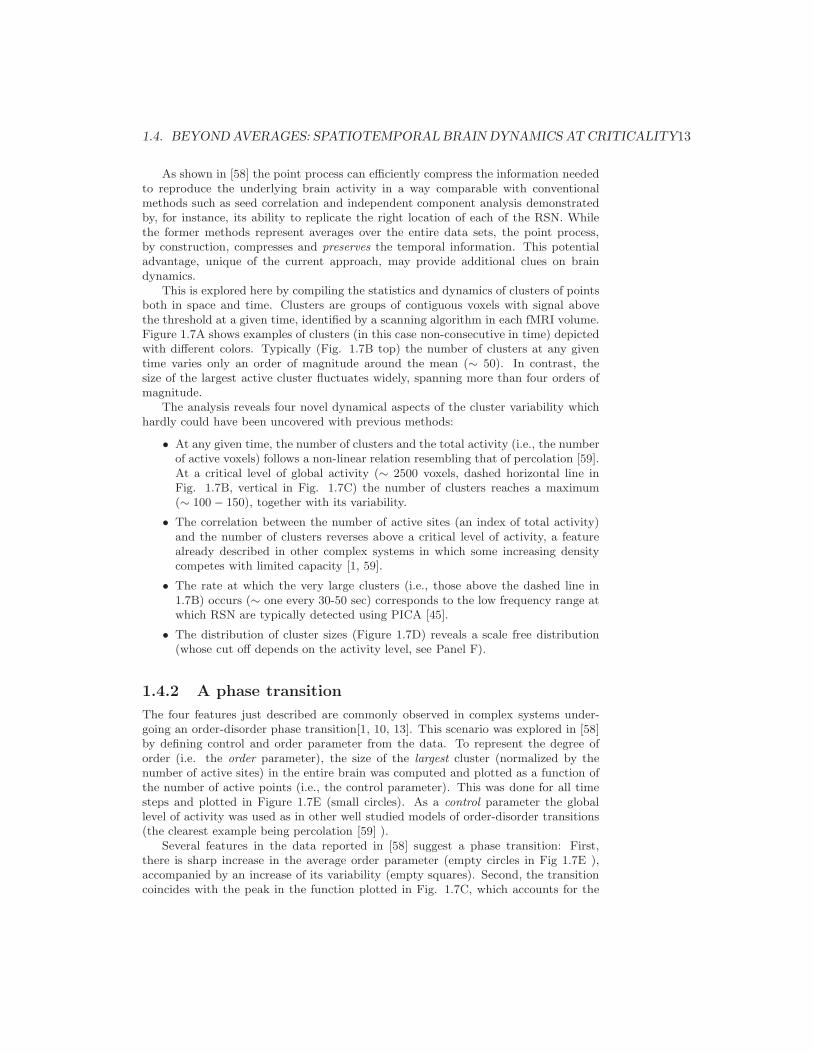
As shown in [58] the point process can efficiently compress the information neededto reproduce the underlying brain activity in a way comparable with conventionalmethods such as seed correlation and independent component analysis demonstratedby, for instance, its ability to replicate the right location of each of the RSN. Whilethe former methods represent averages over the entire data sets, the point process,by construction, compresses and preserves the temporal information. This potentialadvantage, unique of the current approach, may provide additional clues on braindynamics.
This is explored here by compiling the statistics and dynamics of clusters of pointsboth in space and time. Clusters are groups of contiguous voxels with signal abovethe threshold at a given time, identified by a scanning algorithm in each fMRI volume.Figure 1.7A shows examples of clusters (in this case non-consecutive in time) depictedwith different colors. Typically (Fig. 1.7B top) the number of clusters at any giventime varies only an order of magnitude around the mean (∼ 50). In contrast, thesize of the largest active cluster fluctuates widely, spanning more than four orders ofmagnitude.
The analysis reveals four novel dynamical aspects of the cluster variability whichhardly could have been uncovered with previous methods:
• At any given time, the number of clusters and the total activity (i.e., the numberof active voxels) follows a non-linear relation resembling that of percolation [59].At a critical level of global activity (∼ 2500 voxels, dashed horizontal line inFig. 1.7B, vertical in Fig. 1.7C) the number of clusters reaches a maximum(∼ 100− 150), together with its variability.
• The correlation between the number of active sites (an index of total activity)and the number of clusters reverses above a critical level of activity, a featurealready described in other complex systems in which some increasing densitycompetes with limited capacity [1, 59].
• The rate at which the very large clusters (i.e., those above the dashed line in1.7B) occurs (∼ one every 30-50 sec) corresponds to the low frequency range atwhich RSN are typically detected using PICA [45].
• The distribution of cluster sizes (Figure 1.7D) reveals a scale free distribution(whose cut off depends on the activity level, see Panel F).
1.4.2 A phase transition
The four features just described are commonly observed in complex systems under-going an order-disorder phase transition[1, 10, 13]. This scenario was explored in [58]by defining control and order parameter from the data. To represent the degree oforder (i.e. the order parameter), the size of the largest cluster (normalized by thenumber of active sites) in the entire brain was computed and plotted as a function ofthe number of active points (i.e., the control parameter). This was done for all timesteps and plotted in Figure 1.7E (small circles). As a control parameter the globallevel of activity was used as in other well studied models of order-disorder transitions(the clearest example being percolation [59] ).
Several features in the data reported in [58] suggest a phase transition: First,there is sharp increase in the average order parameter (empty circles in Fig 1.7E ),accompanied by an increase of its variability (empty squares). Second, the transitioncoincides with the peak in the function plotted in Fig. 1.7C, which accounts for the
14 CHAPTER 1. CRITICAL BRAIN DYNAMICS AT LARGE SCALE
number of clusters. Finally, the calculation of the relative frequency of the number ofactive sites (i.e. the residence time distribution) shows that the brain spends, on theaverage, more time near the transition than in the two extremes, the highly orderedand the highly disordered states. This supports the earlier conjecture that the brainworks near criticality. [1, 13, 53]. It would be interesting to investigate whetherand how this transition diagram changes with arousal states, unhealthy conditions,anesthesia, etc, as well as to to develop ways to parametrize such changes to be usedas objective markers of mind state.
1.4.3 Variability and criticality
It is important to notice that the description in term of a point process allows theobservation of activity fluctuations in space and time. In particular note that the re-sults in (i.e., Fig.1.7C and E) show that the resting brain dynamics achieves maximumvariability at a particular level of activation which coincide with criticality. Since isknown that the peak of variability in critical phenomena is found at criticality, it istempting to speculate that the origin of the brain spontaneous fluctuations can betraced back to a phase transition. This possibility is further strengthened by the factthat the data shows the brain spends most of the time around such transition.
Thus, overall the results point out to a different class of models which need toemphasize non-equilibrium self generated variability. The data is orthogonal to mostof the current models in which, without the external noise, the dynamics are stuck ina stable equilibrium state. On the other hand, non-equilibrum systems near criticalitydo not need the introduction of noise: variability is self-generated by the collectivedynamics which spontaneously fluctuate near the critical point.
1.5 Consequences
As discussed in previous sections, critical dynamics implies coherence of activity be-yond what is dictated by nearest neighbors connections and correlations longer thanthat of the neural structure and nontrivial scaling of the fluctuations. These anomaliessuggest the need to turn the page on a series of concepts derived from the idea thatthe brain works as a circuit. While it is not suggested here that such circuits do notexist, fundamentally different conclusions should be extracted from their study. As astarting point, the following paragraphs will discuss which of the associated notions ofconnectivity and networks should be revised under the viewpoint of criticality. At theend of the section, an analogy with river beds will be offered to summarize the point.
1.5.1 Connectivity vs functional collectivity
The present results suggest that the current interpretation of functional connectiv-ity, an extensive chapter of the brain neuro-imaging literature, should be revised. Thethree basic concepts in this area are: brain functional connectivity, effective connectiv-ity and structural connectivity [62, 63, 64]. The first one “is defined as the correlationsbetween spatially remote neurophysiological events” [62]. Per se, the definition is astatistical one, and it “is simply a statement about the observed correlations; it doesnot comment on how these correlations are mediated” [62]. The second concept, ef-fective connectivity, is closer to the notion of causation between neuronal connectionsand “is defined as the influence one neuronal system exerts over another”. Finally the
1.5. CONSEQUENCES 15
concept of structural or anatomical connectivity refers to the identifiable physical orstructural (synaptic) connections linking neuronal elements.
The problem with the use of these three concepts is that, intentionally or not, theyemphasize “the connections” between brain regions. This is so, despite of cautionarycomments emphasizing that “depending on sensory input, global brain state, or learn-ing, the same structural network can support a wide range of dynamic and cognitivestates” [63].
An initial demonstration of the ambiguity in the functional connectivity definitionwere the results of Fraiman in the Ising model which explicitly demonstrated[42] theemergence of nontrivial collective states over an otherwise trivial regular lattice (i.e.the Ising’s nearest neighbors structural connectivity). Since is well known that thebrain structural connectivity is not a lattice, the replication by the Ising model ofmany relevant brain networks properties suggested the need to revise our assumptionsat the time of interpreting functional connectivity studies.
The second blow to the “connectivity” framework is given by recent results fromHaimovici et al. [65] results. They compared the RSN from human fMRI with nu-merical results obtained from their network model which is based on the structuralconnectivity determined earlier by Hagmann et al [66], plus a simple excitable dynam-ics endowed to each network node. Different dynamics were obtained by changing theexcitability of the nodes, but only the results gathered at criticality compared wellwith the human fMRI. These striking results indicate that the spatiotemporal brainactivity in human RSN represents a collective emergent phenomena exhibited by theunderlying structure only at criticality. By indicating under which specific dynamicalconditions the brain structure will produce the empirically observed functional connec-tivity, Haimovici’s results not only re-emphasized that “the same structural networkcan support a wide range of dynamic and cognitive states”, but it showed how it canbe done. Of course, these modeling results only scratched the surface of the problem,and a theory to deal with dramatic changes in functionality as a function of a globalparameters is awaiting.
The third concept in the circuit trio is effective connectivity, which as mentionedabove implies the notion of influence of one neuronal group over another. Implicitto this idea is the notion of causation, which needs to be properly defined to preventconfusion. In this context causation for a given variable boils down to identify whichone of all the other co-variables (i.e, degrees of freedom sharing some correlations)predict best its own dynamics. This is done by observing the past states of all theinteractions to a given site and estimating which one contribute more to determine thepresent state of such site. While the idea is always the same, the question of causationcan be framed in different ways, by specific modeling, by calculating partial correla-tions, different variants of Granger causality, transfer entropies, etc. Independentlyof the implementation, in systems at criticality, the notion of effective connectivitysuffers from severe limitation since emergent phenomena cannot be dissected in theinteraction pairs. To illustrate such limitation, it suffices to mention the inability topredict the next avalanche in the sandpile model [9] by computing causation betweenthe nearest neighbors sites.
An important step forward is the work reported recently by Battaglia and col-leagues [67] who in the same spirit than in the discussion above begin by stating:
The circuits of the brain must perform a daunting amount of functions.But how can “brain states” be flexibly controlled, given that anatomicinter-areal connections can be considered as fixed, on timescales relevant

16 CHAPTER 1. CRITICAL BRAIN DYNAMICS AT LARGE SCALE
for behavior?
The authors conjectured, based on dynamical first principles, that even relatively sim-ple circuits (of brain areas) could produce many “effective circuits” associated withalternative brain states. In their language, “effective circuits” are different effectiveconnectivities arising from circuits with identical structural connectivity. In a proofof principle model, the authors demonstrated convincingly how a small perturbationcan change at will from implementing one effective circuit to another. The effect ofthe perturbation is, in dynamical terms, a switch to different phase-locking patternsbetween the local neuronal oscillations. We shall add that, for this switch to be possi-ble, the basins of attraction between patterns need to be close or, in other words, thesystem parameters need to be tuned to a region near instability. Furthermore theyfound that “information follows causality” which implies that under this conditionsbrief dynamics perturbations can produce completely different modalities of informa-tion routing between brain areas of a fixed structural network. It is clear that thisis the type of theoretical framework needed to tackle the bigger problem of how, atlarge scale, integration and segregation of information is permanently performed bythe brain.
1.5.2 Networks, yet another circuit?
The recent advent of the so called network approach has produced, without any doubt,a tremendous impact across several disciplines. In all cases, accessing the networkgraph represents the possibility to see the skeleton of the system over which the dy-namics evolves, with the consequent simplification of the problem at hand. In thisway, the analysis focuses on defining the interaction paths linking the systems degreesof freedoms (i.e., the nodes). The success of this approach in complex systems prob-ably is linked to the universality exhibited by the dynamics of this class of systems.Universality tells us that, in the same class, in many cases the only relevant informa-tion is the interactions, thus in that case a network represents everything needed tounderstand how they work.
Thus, in the case at hand, the use of network techniques could bring the falsehope that knowing the connections between neuronal groups the brain problem willbe solved. This illusion will affect even those that are fully aware that this is notpossible, because the fascination with the complexity of networks will at least producean important distraction and delay. The point is that we could be fulling ourselves inchoosing for our particular problem a description of the brain determined by graphs,constructed by nodes, connected by paths, and so on.
The reflection we suggest is that, despite changing variables and adopting differ-ent names, this new network approach preserves the same idea that we consider is(dangerously) rigid for understanding the brain: the concept of a circuit. This notion,introduced as the most accepted neural paradigm for the last century, was adopted byneuroscience from the last engineering revolution (i.e., electronics). Thus, while is truethat action potentials traverse, undoubtedly, and circulate trough paths, the systemis not a circuit in the same sense of electronic systems, where nothing unexpectedemerges out of the collective interaction of resistors, capacitors and semiconductors.Thus, if these new ideas will move the field ahead, it will depend heavily on resistingthis fascination to prevent the repetition of old paradigms with new names.

1.6. SUMMARY & OUTLOOK 17
1.5.3 River beds, floods and fuzzy paths
The question often appears on how the flow of activity during any given behavior couldbe visualized if the brain operates as a system near criticality.2
The answer, in absence of datum, necessarily involves the use of caricatures andanalogies. In such hypothetical framework, we imagine a landscape where the activityflows, and to be graphical let think of a river. If the system is near criticality, firstand most importantly, such landscape must exclude the presence of deep paths (i.e.,no “Grand Canyon”), only relatively shallow river beds, some of then with water andsome others dry. On the other hand, if the system is ordered the stream will alwaysflow following deep canyons. In this context, let imagine that “information” is trans-mitted by the water, and in that sense it is its flow that “connects” regions (wheneverat a given time two or more regions are wet simultaneously). Under relatively constantconditions erosion, due to water flow, will be expected to deepen the river beds. Con-versely, changes in the topology of this hypothetical network can occur anytime thata sudden increase makes a stream overflow its banks. After that, it will be possible toobserve that the water changed course, a condition that will be stable only until thenext flooding.
Thus, in this loose analogy, the river network structural connectivity (i.e. therelatively deeper river beds) is the less relevant part of the story to predict whereinformation will be shared. The effective connectivity can be created trough the historyof the system, and its paths are not even fixed. The moral behind this loose analogyis to direct our attention to the fact that the path’s flexibility depends on having alandscape composed by shallow river beds.
1.6 Summary & Outlook
The program reviewed here considers the brain as a dynamical object. As in othercomplex systems, the accessible data to be explained are spatiotemporal patterns atvarious scales. The question is whether is it possible to explain all these results froma single fundamental principle. And, in case the answer is affirmative, what does thisunified explanation of brain activity implies about goal oriented behavior? We submitthat, to a large extent, the problem of the dynamical regime at which the brain operatesit is already solved in the context of critical phenomena and phase transitions. Indeed,several fundamental aspects of brain phenomenology have an intriguing counterpartwith dynamics seen in other systems when posed at the edge of a second order phasetransition.
We have limited our review here to the large scale dynamics of the brain, nev-ertheless as discussed elsewhere [13] similar principles can be demonstrated at otherscales. To be complete, the analysis must incorporate behavioral and cognitive datawhich will show similar signatures indicative of scale invariance. Finally, and hope-fully, overall these results should give us a handle for a rational classification of healthyand unhealthy mind states.
2When asked, is difficult to resist the temptation to reply by posing another question:Considering that, according with current ideas, behavior is produced by the activity (actionpotentials) flowing trough a given circuit, how the mechanism responsible to switch betweenone to the other circuit is visualized?

18 CHAPTER 1. CRITICAL BRAIN DYNAMICS AT LARGE SCALE
101
102
103
104
Size (N) 10
-3
10-2
10-1
σ2 <
c>
0
0.5
1
<C>
0
0.5
1
<C>
0 240 480
Time (sec)
0
0.5
1
<C>
0
0.5
1
<C>
N=39
N=154
σ<c>
=0.17
N=890
N=6611
σ<c>
=0.17
σ<c>
=0.14
σ<c>
=0.10
Figure 1.5: Bursts of high correlations are observed at all cluster sizes, result-ing in approximately the same variance, despite the four orders of magnitudechange in the cluster size. The top panels illustrate representative examplesof short-term mean correlation 〈C〉 of the BOLD signals as a function of timefor four sizes spanning four orders of magnitude. The arrows show examples oftwo instances of highly correlated and weakly correlated activity, respectively.Bottom panel shows the variance of 〈C〉 as a function of cluster sizes. The fourexamples on the top traces are denoted with filled circles in the bottom plot.Figure redrawn from Fraiman et al [56]
1.6. SUMMARY & OUTLOOK 19
0 100 200 300 400 500 600Time (sec.)
0
2
4
De
co
nv.
BO
LD
rBeta
HRF
-5 0 5 10-0.5
0
0.5
1
1.5
Ave
rag
e (
S.D
.)0 100 200 300 400 500 600
-3
-2
-1
0
1
2
3
BO
LD
(S
.D.)
0 5 10 15Time (sec.)
0
0.2
0.4
Int.
rBeta
HRF
A B
DC
Figure 1.6: (A) Example of a point process (filled circles) extracted from thenormalized BOLD signal. Each point corresponds to a threshold (dashed line at1 S.D.) crossing from below. (B) Average BOLD signal (from all voxels of onesubject) triggered at each threshold crossing. (C) The peaks of the de-convolvedBOLD signal, using either the hemodynamic response function (HRF) or therBeta function [57] depicted in panel D, coincide on a great majority with thetiming of the points shown in panel A. Figure redrawn from Tagliazucchi et al[58]

20 CHAPTER 1. CRITICAL BRAIN DYNAMICS AT LARGE SCALE
0
50
100
Nu
mb
er
0 200 400 600Time (sec.)
101
102
103
104
Ma
x. S
ize
100 1000 100000
50
100
150
Clu
ste
rs
100
101
102
103
104
10-6
10-4
10-2
100
100 1000 10000
Active sites
0
0.2
0.4
0.6
0.8
1
Ord
er
P.
;
2 ;
R.
tim
e
Order P.
R. time
2
100
101
102
103
104
Cluster Size
10-6
10-4
10-2
100
P(s
)
low
middle
high
B
A
C D
FE
Figure 1.7: The level of brain activity continuously fluctuates above and belowa phase transition. (A) Examples of co-activated clusters of neighbor voxels(clusters are 3D structures, thus seemingly disconnected clusters may have thesame color in a 2D slice). (B) Example of the temporal evolution of the numberof clusters and its maximum size (in units of voxels) in one individual. (C)Instantaneous relation between the number of clusters vs. the number of activesites (i.e., voxels above the threshold) showing a positive/negative correlationdepending whether activity is below/above a critical value (∼ 2500 voxels, indi-cated by the dashed line here and in Panel B). (D) The cluster size distributionfollows a power law spanning four orders of magnitude. Individual statistics foreach of the ten subjects are plotted with lines and the average with symbols. (E)The order parameter, defined here as the (normalized) size of the largest clusteris plotted as a function of the number of active sites (isolated data points de-noted by dots, averages plotted with circles joined by lines). The calculation ofthe residence time density distribution (“R. time”, filled circles) indicates thatthe brain spends relatively more time near the transition point. Notice thatthe peak of the R. Time in this panel coincides with the peak of the number ofclusters in panel C, as well as the variance of the order parameter (squares). (F)The computation of the cluster size distribution calculated for three ranges ofactivity (low: 0- 800; middle: 800-5000; and high > 5000) reveals the same scaleinvariance plotted in panel D for relatively small clusters, but shows changes inthe cutoff for large clusters. Figure redrawn from [58]

Bibliography
[1] Bak P. (1998) How Nature Works, The science of self-organized criticality
(Copernicus)
[2] Stanley HE. (1987) Introduction to phase transitions and critical phenomena.Oxford Univ. Press.
[3] Turing AM. Computing machines and intelligence. Mind 59, 236 (1957).
[4] Stassinopoulos D, & Bak P. Democratic reinforcement. A principle for brainfunction Phys Rev D 51 5033 (1995).
[5] Ceccatto A, Navone H, Waelbroeck H. Stable criticality in a feedforward neuralnetwork Revista Mexicana de Fsica 42 5, 810–825 (1996).
[6] Chialvo DR & Bak P. Learning from mistakes. Neuroscience 90, 1137 (1999).
[7] Bak P & Chialvo DR. Adaptive learning by extremal dynamics and negativefeedback. Phys Rev E 63, 031912 (2001).
[8] Wakeling J & Bak P. Phys Rev E 64, 051920 (2001).
[9] Bak P, Tang C, Wiesenfeld K. Self-organized criticality: An explanation of the1/f noise. Phys Rev Lett 59, 381 (1987).
[10] Jensen HJ. Self-Organized Criticality. Cambridge University Press (1998).
[11] Bak P. Life laws. Nature 391, 652–653 (1998).
[12] Bak P & Sneppen K. Punctuated equilibrium and criticality in a simple modelof evolution. Phys Rev Lett 71, 4083–4086 (1993).
[13] Chialvo DR. Complex emergent neural dynamics. Nature Physics 6, 744–750(2010).
[14] Bak P & Paczuski M. Complexity, contingency, and criticality. Proc Natl Acad
Sci U S A 92, 6689–6696 (1995).
[15] Anderson P. More is different. Science 4393, 396 (1972).
[16] Buzsaki G. Rhythms of the Brain. Oxford University Press (2006).
[17] Linkenkaer-Hansen K, Nikouline VV, Palva JM, Ilmoniemi RJ. Long-range tem-poral correlations and scaling behavior in human brain oscillations. J Neurosci
21,1370–1377 (2001).
[18] Stam CJ & de Bruin EA. Scale-free dynamics of global functional connectivityin the human brain. Hum Brain Mapp 22, 97–109 (2004).
[19] Plenz D &Thiagarajan TC. The organizing principles of neuronal avalanches:Cell assemblies in the cortex? Trends Neurosci 30,101–110 (2007).
21

22 BIBLIOGRAPHY
[20] Bullock TH, Mcclune MC, Enright JT. Are the electroencephalograms mainlyrhythmic? Assessment of periodicity in wide-band time series. Neuroscience
121, 233–252 (2003).
[21] Logothetis NK. The neural basis of the blood-oxygen-level-dependent func-tional magnetic resonance imaging signal. Philos Trans R Soc Lond B Biol Sci
357, 1003–1037 (2002).
[22] Eckhorn R. Oscillatory and non-oscillatory synchronizations in the visual cortexand their possible roles in associations of visual features. Prog Brain Res 102,405–426 (1994).
[23] Miller KJ, Sorensen LB, Ojemann JG, den Nijs M. Power law scaling in thebrain surface electric potential. PLoS Comput Biol 5, e1000609. 10.1371/jour-nal.pcbi.1000609 (2009).
[24] Manning JR, Jacobs J, Fried I, Kahana MJ. Broadband shifts in local fieldpotential power spectra are correlated with single-neuron spiking in humans. JNeurosci 29, 13613–13620 (2009).
[25] Gilden DL. Cognitive emissions of 1/f noise. Psychol Rev 108, 33–56 (2001).
[26] Maylor EA, Chater N, Brown GD. Scale invariance in the retrieval of retro-spective and prospective memories. Psychon Bull Rev 8, 162–167 (2001).
[27] Ward LM. Dynamical Cognitive Science, London: The MIT Press (2002).
[28] Nakamura T, Kiyono K, Yoshiuchi K, Nakahara R, Struzik ZR, Yamamoto Y.Phys Rev Lett 99, 138103 (2007).
[29] Anteneodo C & Chialvo DR. Unraveling the fluctuations of animal motor ac-tivity. Chaos 19, 033123 (2009).
[30] Beckers R, Deneubourg J-L, Goss S, Pasteels JM. Collective decision makingthrough food recruitment. Insectes Sociaux 37, 258–267 (1990).
[31] Beekman M, Sumpter DJT, Ratnieks FLW. Phase transition between disor-dered and ordered foraging in Pharaohs ants. Proc Natl Acad Sci USA 98,9703–9706 (2001).
[32] Rauch EM, Chialvo DR, Millonas MM. Pattern formation and functionality inswarm models. Phys Lett A 207, 185–193 (1995).
[33] Nicolis G & Prigogine I. Self-Organization in nonequilibrium systems: Fromdissipative structures to order through fluctuations. Wiley, New York (1977).
[34] Takayasu M, Takayasu H, Fukuda K. Dynamic phase transition observed in theinternet traffic flow. Physica A 277, 248–255 (2000).
[35] Lux T & Marchesi M. Scaling and criticality in a stochastic multi-agent modelof a financial market. Nature 397, 498–500 (1999).
[36] Malamud BD, Morein G, Turcotte DL. Forest fires: An example of self-organized critical behavior. Science 281,1840–1842 (1998).
[37] Peters O. & Neelin D, Critical phenomena in atmospheric precipitation. Nature
Phys 2, 393–396 (2006).
[38] Peters O, Hertlein C, Christensen K. A complexity view of rainfall. Phys Rev
Lett 88, 018701-1 (2002).
[39] Peters O & Christensen K. Rain: relaxations in the sky. Phys Rev E 66,036120-1 (2002).

BIBLIOGRAPHY 23
[40] Cavagna A et al, Scale-free correlations in starling flocks. Proc Natl Acad Sci
USA 107, 11865–11870 (2010).
[41] Eguiluz VM, Chialvo DR, Cecchi G, Baliki M and Apkarian V. Phys Rev Lett
94, 018102 (2005). Also as E-print arxiv.org cond-mat/0309092.
[42] Fraiman D, Balenzuela P, Foss J, Chialvo DR. Ising-like dynamics in large-scalefunctional brain networks. Phys Rev E 79, 061922 (2009).
[43] Fox MD and Raichle ME. Spontaneous fluctuations in brain activity observedwith functional magnetic resonance imaging. Nat Rev Neurosci 8, 700–711(2007).
[44] Smith, SM, et al. Correspondence of the brain’s functional architecture duringactivation and rest. Proc. Natl. Acad. Sci. U.S.A. 106, 13040–1345 (2009).
[45] Beckmann CF, De Luca M, Devlin JT, Smith SM. Investigations into resting-state connectivity using independent component analysis. Philos Trans R Soc
London 360, 1001–1013 (2005).
[46] Xiong J, Parsons L, Gao J, Fox P. Interregional connectivity to primary motorcortex revealed using MRI resting state images. Hum Brain Mapp 8, 151–156(1999).
[47] Cordes D et al. Mapping functionally related regions of brain with functionalconnectivity MR imaging. Am J Neuroradiol 21, 1636–1644 (2000).
[48] Fukunaga M et al. Large-amplitude, spatially correlated fluctuations in BOLDfMRI signals during extended rest and early sleep stages. Magn Reson Imaging
24, 979–992 (2006).
[49] Vincent JL et al. Intrinsic functional architecture in the anesthetized monkeybrain. Nature 447, 83–87 (2007).
[50] Kitzbichler MG, Smith ML, Christensen SR, Bullmore E. Broadband critical-ity of human brain network synchronization. PLoS Comput Biol 5, e1000314(2009).
[51] Kuramoto Y. Chemical oscillations, waves and turbulence. Springer, Berlin(1984).
[52] Botcharova M, Farmer SF, Berthouze L. A power-law distribution of phase-locking intervals does not imply critical interaction. arXiv:1208.2659 (2012).
[53] Expert P, Lambiotte R, Chialvo DR, Christensen K, Jensen HJ, Sharp DJ,Turkheimer F. Self-similar correlation function in brain resting-state fMRI.Journal Royal Soc. Interface 8, 472–479 (2011).
[54] Garret D, Kovacevic N, McIntosh A, Grady C. Blood oxygen level-dependentsignal variability is more than just noise. J of Neurosc 30, 4914–4921 (2010).
[55] Garrett D, Kovacevic N, McIntosh AR, Grady CL. The importance of beingvariable. Journal of Neuroscience 31, 4496–4503 (2011).
[56] Fraiman D & Chialvo DR. What kind of noise is brain noise: Anomalous scalingbehavior of the resting brain activity fluctuations. Front Physiol 3, 307 (2012).
[57] Tagliazucchi E, Balenzuela P, Fraiman D, Montoya, P. Chialvo DR. Sponta-neous BOLD event triggered averages for estimating functional connectivity atresting state, Neurosc Lett 488, 158–163 (2011).

24 BIBLIOGRAPHY
[58] Tagliazucchi E, Balenzuela P, Fraiman D, Chialvo DR. Criticality in large-scalebrain fMRI dynamics unveiled by a novel point process analysis. Front Physio3, 15. doi: 10.3389/fphys.2012.00015 (2012).
[59] Stauffer, D. Aharony A, (1992) Introduction to percolation theory (Taylor &Francis).
[60] Rolls, E.T & Deco, G. (2010) The noisy brain. (Oxford University Press, Lon-don).
[61] Prigogine I. (1962). Non-Equilibrium Statistical Mechanics. NewYork: Inter-science Publishers.
[62] Friston KJ. Functional and effective connectivity in neuroimaging: a synthesis.Hum Brain Mapp 2, 56–78 (1994).
[63] Sporns O, Tononi G, Kotter R. The human connectome: A structural descrip-tion of the human brain. PLoS Comput Biol 1, 245–251 (2005).
[64] Horwitz B. The elusive concept of brain connectivity. Neuroimage 19, 466–470(2003).
[65] Haimovici A, Tagliazucchi E, Balenzuela P & Chialvo DR. Brain organiza-tion into resting state networks emerges from the connectome at criticality.arXiv:1209.5353 (2012).
[66] Hagmann P, Cammoun L, Gigandet X, Meuli R, Honey CJ, Wedeen VJ, SpornsO. (2008) PLoS Biol 6, e159 (2008).
[67] Battaglia D, Witt A, Wolf F, Geisel T. Dynamic Effective Connectivity ofInter-Areal Brain Circuits. PLoS Comput Biol 8, e1002438 (2012)


![Laplacian Dynamics and Multiscale Modular arXiv:0812.1770v3 … · 2009-10-09 · arXiv:0812.1770v3 [physics.soc-ph] 9 Oct 2009 Laplacian Dynamics and Multiscale Modular Structure](https://img.dokumen.tips/doc/110x75/5e7f491b8c37393dd67d4ce9/laplacian-dynamics-and-multiscale-modular-arxiv08121770v3-2009-10-09-arxiv08121770v3.jpg)