Embed Size (px)
Citation preview
CRISP Autofocus
Instruction Manual
Applied Scientific Instrumentation, Inc.
29391 West Enid Road
Eugene, OR 97402-9533 USA
Phone: (800) 706-2284
(541) 461-8181
Fax: (541) 461-4018
Web: www.ASIimaging.com
E-mail: [email protected]
2
Table of Contents
CRISP Continuous Autofocus System ....................................................................................... 4
System Overview ...................................................................................................................... 4
Fluorescent Filter Considerations .......................................................................................... 5
LED Characteristics and Filters ............................................................................................. 6
Commercial Filter Sets Suitable for CRISP ........................................................................... 6
LED Power and Eye Safety ..................................................................................................... 9
Installation .............................................................................................................................. 11
Theory of Operation .............................................................................................................. 11
Sample Considerations ......................................................................................................... 11
Photodiode Displacement Signal .......................................................................................... 12
Control of the CRISP system ............................................................................................... 14
Button Actions ...................................................................................................................... 14
CRISP System States ............................................................................................................ 15
ASI Console support for CRISP ........................................................................................ 16
CRISP Operations ................................................................................................................. 17
Quick Start Instructions Using ASI_Console ....................................................................... 17
Quick Start Instructions Using Controller Only ................................................................... 17
Engaging the LOCK for Normal Operation ......................................................................... 18
Calibration Details ................................................................................................................. 18
Optical Adjustment................................................................................................................ 20
Adjusting the Relay Lens position ....................................................................................... 20
Adjusting Position of the LED Light Source ....................................................................... 20
Adjusting the Primary Mirror ............................................................................................... 21
Advanced Techniques ............................................................................................................ 22
Troubleshooting Steps ........................................................................................................... 25
Computer Control of the CRISP System .................................................................................. 26
TTL Control of the CRISP focus lock ................................................................................. 29

3
Figure 1: CRISP with DCMS photo-port splitter. ............................................................................. 4
Figure 2: Schematic diagram of CRISP optical system ..................................................................... 5
Figure 3: Semrock Dichroic FF408/504/581/667/762-Di01.............................................................. 7
Figure 4: Semrock LF405/488/561/635-A-000 ................................................................................. 8
Figure 5: C-mount Splitter (DCMS) contains dichroic mirror and blocking filter. ......................... 11
Figure 6: Photo detector difference signal for a scan through a microscope slide. ......................... 13
Figure 7: Reflections from a glass bottomed Petri dish. .................................................................. 13
Figure 8: Reflection from glass slide of a) LED exit slit and b) focused deeper, the LED emitter,
when the LED holder is properly aligned by moving c) LED holder. ..................................... 21
Figure 9: Mirror Adjusting Screw.................................................................................................... 21
Figure 10: C-mount extension. ........................................................................................................ 22

4
CRISP Continuous Autofocus System
The Continuous Reflection Interface Sampling and Positioning (CRISP) system provides for a
very high level of focus stability, allowing a specimen to remain accurately focused for hours at a
time with drift <0.1 μm. The system compensates for focus changes caused by temperature
variations as well as mechanical drifts of the microscope mechanisms. The CRISP system
promises to be a solution to focus drifts that plague time-lapse experiments at high magnification.
The CRISP system uses a pupil obscuration method to determine focus from reflective surfaces.
The control system allows adjustment of the focal lock position, relative to a nearby surface, once
the system is locked. The unit is a C-mount device, that can be placed at the C-mount port.
Usually it is used in conjunction with the a dual C-mount Splitter (DCMS) so both the CRISP unit
and a data recording camera can share the same microscope photoport.
System Overview
The CRISP system consists of optical, electronic, and mechanical components. The optical
system injects IRLED light into the microscope, captures the beam reflected from the specimen
slide or cover slip, and routes the reflected beam onto a position-sensitive detector (PSD). The
signal from the PSD is conditioned by an amplifier circuit in the MS2000 controller and used as
the feedback signal for Z-axis control. The MS-2000 Z-axis controller changes the focal position
of the microscope either with a servomotor or with a PZ-2000 piezo Z-axis stage.
Figure 1: CRISP with DCMS photo-port splitter.
5
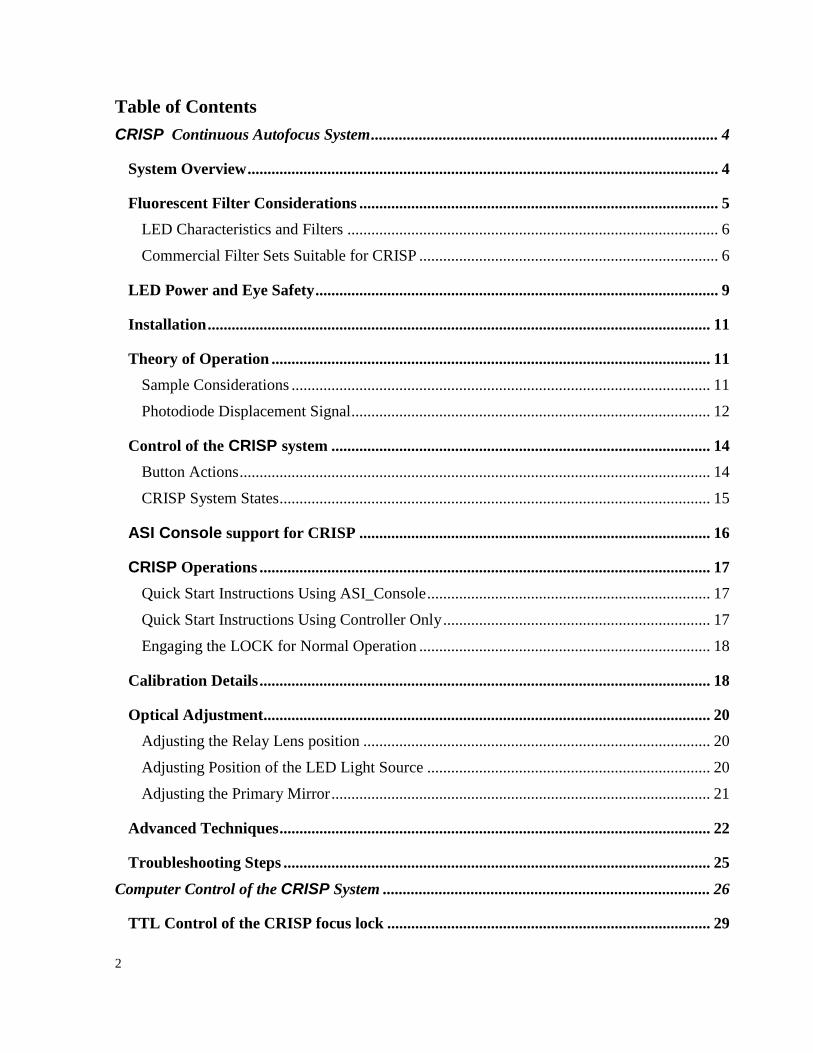
As shown in Figure 2, a dichroic beam splitter that reflects light from the IR LED and passes
visible light to the camera is used to couple the CRISP unit to the system at the C-mount photo-
port.
Figure 2: Schematic diagram of CRISP optical system
Fluorescent Filter Considerations
The CRISP system commonly utilizes an 850nm LED that is projected onto the sample. Proper
arrangement of the light filters in the microscope is necessary for the system to function properly.
A dichroic beam splitter that reflects the IR light is used in the dual C-mount splitter (DCMS). No
other filters can be in the path to the objective that block the IR light. An emission filter that
blocks the IR LED should be placed in front of the camera and can be located in the C-mount
fitting of the DCMS for the camera. Fluorescence dichorics need to have a “window” in the IR to
pass the CRISP LED. See the list of commercial filter sets that work with CRISP below.
The long C-mount adapter on the Olympus IX-71 or BX scopes permits the use of both a filter
wheel and the CRISP unit in the provided space. This allows use of specific emission filters in
conjunction with either a multi-band dichrioc with an IR pass band, or with a single excitation
wavelength and a long pass dichroic in the scope.
Some configurations provide an easier solution to the filter problem. If a spinning disk confocal
unit attached to the C-mount port is used for fluorescent microscopy, the filter cube is located in
the confocal head and not in the microscope. In this case the CRISP mounted on the DCMS will
work fine and not be impeded by any fluorescence filters in the microscope.

6
It may be possible to place the CRISP in the excitation path or to find an alternative location
between the objective and the microscope’s filter cube to insert the CRISP coupling beam splitter.
Although these solutions are perhaps better optically, they probably require customization for the
particular case. Contact ASI for details
LED Characteristics and Filters
Several LED wavelengths are available that will provide good performance with the CRISP
system. Usually the unit is supplied with an IR LED with 780nm peak wavelength. The table
below shows other LEDs that can be supplied, along with the suggested dichroic beam splitter and
blocking filters. With sufficient spectral distance between the LED wavelength and the dichroic
and camera block cut-off wavelength, a cleanup filter for the LED may not be required. The
detector in the CRISP unit begins to lose sensitivity after about 1000nm limiting the maximum
useable wavelength to about 1050nm.
LED Part Number
LED Color (nm)
Typ. LED
Power @50 mA
(mW)
FWHM (nm)
FW to 2% wings
Short Pass Dichroic Beam
Splitter
Short Pass Camera Block
Filter
Band Pass LED Cleanup
Filter
cutoff (nm)
Part Number
cutoff (nm)
Part Number
Cutoff (nm)
Part Number
VLCS5830 625 10 18 580-660 600 69216 600 84710 628/32 84087
L660-06 660 3 20 615-700 600 69216 600 84710 650/50 84774
L700-06 700 13 30 650-740 650 69217 650 84712 700/50 84775
L720-06 720 13 30 670-760 700 69218 700 84712 700/50 84775
L735-06 735 18 30 680-780 700 69218 700 84714 750/50 84776
L740-06 740 18 30 685-785 700 69218 700 84714 750/50 84776
L780-06 780 20 30 710-830 750 69219 750 64332 800/50 84777
TSHG8200 830 25 40 750-900 750 69219 750 64332
TSHG5210 850 27 40 790-930 800 69220 800 64333 850/50 84778
TSFF5210 870 23 40 810-950 800 69220 800 64333
TSHF5210 890 23 40 830-970 850 69221 850 64334 900/50 84779
L940-06 940 17 50 840-1040 900 69222 900 64335 950/50 84780
L970-06 970 5.5 50 910-1070 900 69222 900 64335
L1050-06 1050
2.0 50 950-1130 1064/80
NFD01-
1064 1000 64337 1050/50 85881
Commercial Filter Sets Suitable for CRISP
For fluorescent applications, choosing the correct filters is important. Matching the best CRISP
LED color with the filter set will give the best results.
Single band sets with single edge long pass dichroic beam splitters
There are many filter sets from several manufacturers that have a single edge, long pass
dichroic. Usually the emission filter provides the data pass-band in the region just above the
dichroic edge. Frequently the dichroic will continue to pass light well above the emission filter

7
pass-band. Wavelengths above the emission filter pass-band, where the dichroic is still
transmitting, provide the ideal wavelength region for CRISP. Specify the CRISP LED color to be
as far in the red/IR as possible away from the emission band, yet still where the dichroic has good
transmission (and the emission filter has good blocking for the CRISP LED). Often the
fluorescence emission filter can be placed directly in front of the camera in the DCMS C-mount
splitter where it will serve to block the CRISP IR LED from the camera.
Contact ASI with your filter specifications for further guidance.
Multi-band filter sets that will work with CRISP
Frequently the dichroic beam splitter on multi-band filter sets has limited transmission outside
the data-channel color bands. Nevertheless, there are several multi-band commercial filter sets that
can be used with CRISP. One interesting filter set is the Semrock five-band with the dichroic filter
characteristics below.
Figure 3: Semrock Dichroic FF408/504/581/667/762-Di01
This dichroic is used with either individual emitters and exciters for each band, or with
individual exciters only as a Pinkle set. The upper transmission band of the dichroic is perfect for
the standard 780nm CRISP IR LED. Used in this way, this filter set can be installed in the
microscope’s filter cube in the usual manner. A 750nm IR block is place in the DCMS splitter
camera C-mount to block the upper band from the camera.
Another Semrock multi band set, LF405/488/561/635-A-000, has an extended region for the red
band that would pass IR light. The pass band above 700nm is open, allowing easy operation with
a 780nm IR LED for CRISP. In this case, the emission filter would be installed in the DCMS
splitter C-mount in front of the camera and would act as the IR block for the CRISP LED.

8
Figure 4: Semrock LF405/488/561/635-A-000
To determine the correct filter set for your application, first check the filters you have to see if
there is a pass band in the IR. If not, consider alternatives that have such a pass band. Listed
below are several filter sets from major filter manufacturers that will work with CRISP. Some of
them require special non-standard LED color.
Semrock multi-band filter sets that will work with CRISP
LF405/488/594-A-000
Uses Di01-R405/488/594 dichroic which passes 780 to 800 IR LED
Uses a multiband emitter that can be placed in the camera’s DCMS C-mount
LF405/488/532/635-4x-A-000
Uses Di01-R405/488/532/635 dichroic which passes 780 to 820 IR LED
LF442/514/561-3X-A-000
Uses Di01-R442/514/561 dichroic which passes 780 to 830 IR LED
Uses a multiband emission filter that can be placed in the camera’s DCMS C-mount
Uses a multiband emitter that can be placed in the camera’s DCMS C-mount
LF488/561-2x-B-000
LF488/561-A-000
Uses Di01-R488/561 dichroic which passes 780 to 830 IR LED
Uses a multiband emission filter that can be placed in the camera’s DCMS C-mount
DA/FI/TR/Cy5/Cy7-5x-A-000
Uses FF408/504/581/667/762-Di01 dichroic with passes 780 to 850 IR LED
This five band set has the top band situated perfectly for CRISP
Uses a multiband emission filter with pass band in IR so can be used in microscope filter cube.
FRET - GFP/RFP –C-000
9
Uses FF 495-Di03 dichroic which passes 780 to 850 IR LED
Requires switched emission filter before camera for two channels
FRET-CFP/YFP-C-000
Uses FF458-Di02 dichroic which passes 780 to 850 IR LED
Requires switched emission filter before camera for two channels
Chroma multiband filter sets that will work with CRISP
59004 FITC/TRITC –ET
59204 FITC/TRITC
Uses 59004bs dichroic with available pass band at 740nm – specify 740nm LED for CRISP.
Uses a multiband emission filter that can be placed in the camera’s DCMS C-mount
59017 ECFP/EYFP – ET
59217 ECFP/EYFP
Uses 59017bs dichroic with available pass band at 650nm – specify 660nm LED for CRISP.
Uses a multiband emission filter that can be placed in the camera’s DCMS C-mount
69000 DAPI/FITC/TRITC
69300 DAPI/FITC/TRITC
Uses 69000bs dichroic with available pass band at 700nm – specify 700nm LED for CRISP.
Uses a multiband emission filter that can be placed in the camera’s DCMS C-mount
69008 ECFP/EYFP/mCherry
69308 ECFP/EYFP/mCherry
Uses 69008bs dichroic with available pass band at 735nm – specify 735nm LED for CRISP
Uses a multiband emission filter that can be placed in the camera’s DCMS C-mount
88000v2 DAPI/FITC/TEXAS RED/Cy5
Uses 88100bs dichroic with available pass band at 830nm – specify 830nm LED for CRISP
Uses a multiband emission filter that can be placed in the camera’s DCMS C-mount
This set will also work for CRISP in the microscope’s filter cube if the Cy5 channel is used for
CRISP – Specify 700nm LED for CRISP for this application, and place 650nm SP block in
front of camera.
Contact ASI or your filter supplier if you have further questions.
LED Power and Eye Safety
The CRISP system uses an IR LED to illuminate the sample and provide a reflected beam that
is used to determine focus. Although relatively bright IR LEDs are used in the CRISP unit, the
distributed nature of the LED source, masking of the LED, reduction in aperture and reduce duty
cycle combine to make the CRISP light source eye-safe. Never-the-less, please do not stare into

10
the CRISP C-mount when the unit is powered up. IR LED sources do not generate visible
radiation, so prolonged exposure is possible and should be avoided.
The maximum measured average power for a typical CRISP unit at the C-mount is less than
100µW (typically about 70 µW) with the LED set to 100% intensity and the internal aperture stop
open fully. The CRISP LED mask appears to be about 1.0 mm × 6.8 mm in the image plane. The
brightest part of the LED emitter depends slightly on the LED used and the exact focus, but is
about 1.0 mm square at the image plane. Based upon the objective used, you can use these
numbers to calculate typical maximum intensity of IR illumination at the sample. However, be
aware that many objectives will not pass the full aperture at the CRISP aperture stop, so the
number you get this way will be a maximum.
For example, a 60× objective will expose some parts of the sample to a maximum of about
0.36W/mm2 of IR radiation.
Total Power / Area = 100µW / (1/60 mm × 1/60 mm) = 0.36 W/mm2
You can reduce the radiative power at the sample by using a lower LED intensity and/or
reducing the internal aperture stop.

11
Installation
Install the Z-axis drive or PZ-2000 stage as described in its manual. Become familiar with the
functions of the Z-axis focus control system before installing the CRISP optics.
The CRISP device is designed to be used at a camera C-Mount location. In order to
accommodate both data recording camera and the CRISP unit on the microscope photo-port, a
dual C-mount splitter, such as the ASI DCMS is used. The DCMS is normally equipped with the
appropriate dichroic beam splitter to reflect the CRISP IR LED light into the microscope while
allowing the visible light to the camera.
Figure 5: C-mount Splitter (DCMS) contains dichroic mirror and blocking filter.
There should also be a blocking filter on the camera C-mount to keep LED light out of the
camera.
Mount the CRISP unit on the reflected port of the DCMS.
Mount the camera on the “straight-through” port of the DCMS.
Connect the DB9 cable from the CRISP unit to the labeled connector on the back of the
MS2000 control unit.
Theory of Operation
The CRISP autofocus device uses a conventional pupil obscuration method for determining
focal position. The device projects light from a small aperture into the specimen plane, but
restricts the projected light to only one half of the optical system’s pupil or optical aperture. As a
result, light reflected from the specimen appears to move laterally as the focal position is changed.
The light reflected from the specimen is focused on a split photodiode detector so that the lateral
motion of the reflected light can be detected and used as a feedback signal for the automated focus
device.
Sample Considerations
There are several classes of samples that are common in microscopy and present very different
challenges for focus systems. CRISP relies on reflected light from the sample to detect focus

12
position. Often the reflected light comes from small refractive index discontinuities at sample
surfaces. The amount of light reflected at a dielectric interface is given by
R = (n1 – n2)2 / (n1 + n2)
2
where n1 and n2 are the refractive indexes of the adjoining dielectric materials. The table
below shows the refractive index of several optical materials and the magnitude of the reflection
expected at various interfaces between materials. You will note that reflections from an air
interface are around 4%, whereas reflections from a water interface is about 1/10 as much. This
makes for “easy” and “difficult” focus applications.
The problem can get even harder when trying to discriminate between light coming from two
closely spaced interfaces, for example, the two sides of a cover slip, or the variable spacing
between a cover slip and a slide.
Table 1: Reflection Intensity from a Dielectric Interface
Material Refractive index @ 800nm
Reflectance at interface (%)
Air Water Glass
Air 1.000 — 2.0 4.3
Water 1.329 2.0 — 0.46
Immersion Oil 1.518 4.2 0.45 0.0003
Glycerol 1.473 0.03
Glass (typical) 1.523 4.3 0.46 —
Plastic (Polystyrene)
1.575 5.0 0.72 0.03
Plastic (PMMA acrylic)
1.483 3.8 0.30 0.02
Fused Silica 1.453 3.4 0.20 0.05
Photodiode Displacement Signal
The heart of the focus system is the split photodiode displacement sensor. The difference in
intensity of the light falling on the two halves of the detector is used to determine the relative
position of the reflected light beam. As focus position changes, the lateral position of the reflected
beam will shift. The difference of the two signals from the split photodiode is a measure of the
relative focal position.
13
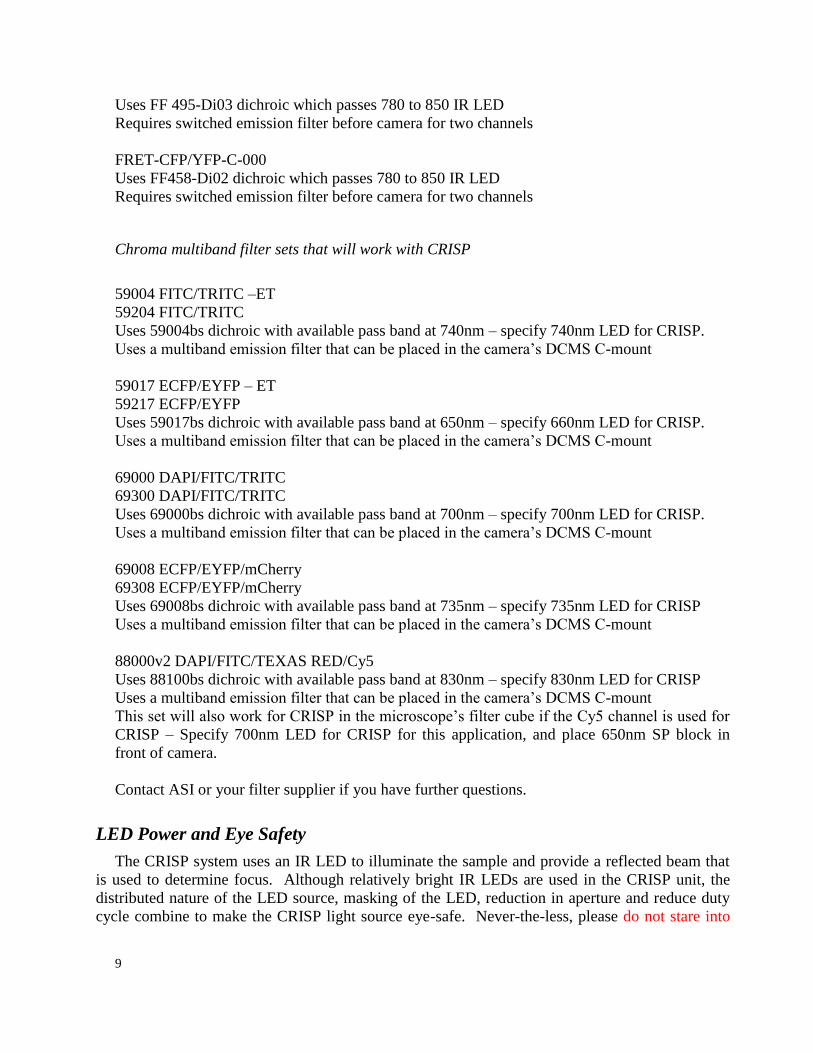
Figure 6: Photo detector difference signal for a scan through a microscope slide.
The figure above shows the difference signal from the photodiode pair as the focus is scanned
through a standard microscope slide. You will notice two green shaded zones corresponding to the
front and back surface of the slide. Any region with a large slope can be used to lock onto focus.
Most often we are interested in viewing right at the reflective surfaces or very near them. A
reference signal level, one of those marked by the two red lines, is used to specify the desired focal
position. Any deviation from the reference is an error signal that will direct the stage back toward
focus. Changing the focus reference allows you to adjust focus within the shaded regions. Once
the system is locked, the MS2000 control knob adjusts the focus reference level, thereby effecting
focus changes on the locked system.
The brown shaded regions have opposite slope compared to the regions near the surface. If, for
some reason, you wished to use one of those places to lock focus, the servo calibration would need
to be done again, and you would expect to get a negative calibration value.
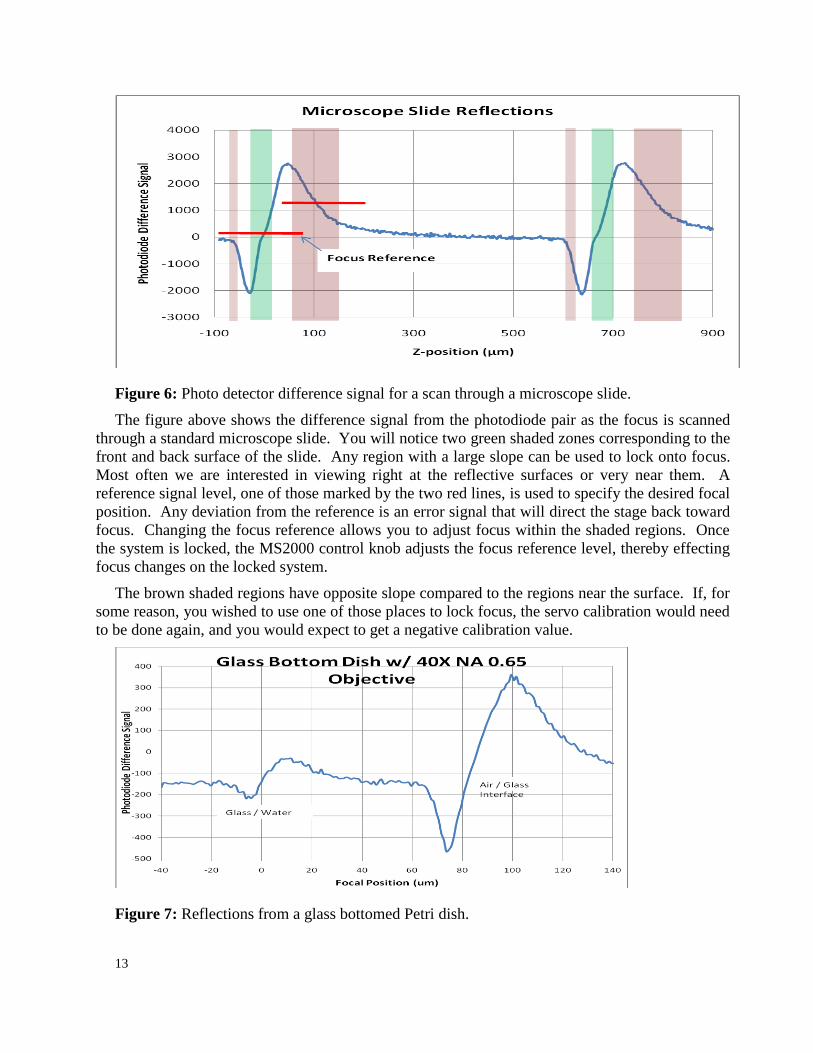
Figure 7: Reflections from a glass bottomed Petri dish.

14
A common typical sample is a glass-bottomed Petri dish with a water sample. Here we can
easily see the two reflections again, but note that the glass/water reflection is much less intense that
the air/glass reflection.
Control of the CRISP system
To use the LCD display, ensure that the display-mode DIP switches 1 and 2 located on the back
of the controller are in the UP position. The MS-2000 controller provides an easy means to turn
on and off the CRISP LED as well as to initiate the focus lock. The LCD display shows the status
of the system. The figure below shows the typical display.
LCD Display
On the MS2000 controller, the bottom line of the LCD display shows information about the
photo-detector signals and CRISP system state.
The meaning of the quantitative information on the display changes depending up on the system
state. The first character is the CRISP system state, described in the table below. The next
character is L if the LED is turned on, otherwise blank. In most states, the photodiode Sum signal
is next, followed by the Err signal. In the Dither state, the Err signal is the change in focus error
as the focus is moved over the cal_range. In any other state, the Err number is the relative focus
error.
Button Actions
The @ button is used to manually control the CRISP system. The duration of the button press
determines the action.
Function Button
Advance to next focus state Press @ briefly and release.
Back to Previous state or Advance
to Calibration state Press @ >3 sec. and release.
Set Focus Offset to zero from
READY state Press @ >10 sec. and release.
SumMM
X: 0.00000_mm: f Y: 1.23456_mm: f Z: 2.13570_mm: E RL 85 -145 00:12:21 73
State
Err LED

15
CRISP System States
Activating and calibrating the CRISP system is done moving to the next CRISP state using the
@ button on the controller and pressing it for various durations as shown in the “Next State” and
“Previous State” columns in the table below.
(You can use the serial command LK F=<decimal number> as shown in column two on the
table below to directly force a CRISP system state. For example, to set the CRISP state to Balance,
issue the serial command LK F=66. Use with care, as out-of-sequence events are not necessarily
handled smoothly.)
Table 2: CRISP system control states
State
Character
on LCD
“LK F”
ASCII
code
State
Name
Next State
(@ short) Previous
State
(@ long)
Comment
I 79 (O) Idle R G LED is tuned off going from Ready to Idle
R 85 (U) Ready K (D) I LED ON - @ button locks
D Dim (R) I Low returned light signal (prevents
Ready state)
K 83 (S) Lock R(F) R @ button unlocks
F In Focus R(K) R @ button unlocks
N Inhibit R I Low returned signal (unlocks system)
E Error R Usually Out-of-Range Error
G 72 (H) loG_cal R 1 Initiate basic Log-Amp Calibration
67 (C) gain_Cal (2,3,B,f) Initiate Servo-Gain Calibration
f (g,h,i,j)
102 (f) Dither R R Dither Z for optical adjustments
† c 97 (a) Curve (R) Generate focus curve data
† B 66 (B) Balance R Display shows signal from each half of
detector. Use to balance optics.
† o 111 (o) Set
Offset (R)
Resets focus offset to zero for present
focal position.
† States can only be initiated with LK F=code command.

16
ASI Console support for CRISP
The ASI Console program has built-in support for
the CRISP unit that makes it easy to setup and calibrate
the CRISP unit. Using the ASI Console program
eliminates the need to learn all of the special button
presses to accomplish the calibration steps. The ASI Console program is available on the ASI web site at:
http://www.asiimaging.com/support/downloads/asi-
console/ .
In operation, the CRISP control is found on the MORE
tab. Clicking on the CRISP button will bring up the
main CRISP control panel.
The main initialization steps are presented with
three buttons. Lock and Unlock functions are provided
as buttons as well. Set-up parameters are presented at
the bottom of the CRISP window as sliders for setting
LED intensity, Objective Numerical Aperture (used to
determine the range of calibration moves), relative Loop
gain and signal averaging.
After you have calibrated the
system with the three steps
indicated, you may wish to obtain a
plot of the focus curve. The
Graph… button will generate the
focus curve. The z-depth of the
focus range for the graph is
determined by the Objective NA
setting – smaller NA, longer travel.
Once the system is basically
working, the Loop Gain slider is the
easiest way to optimize the
performance. If you have plenty of
signal (dither Err number > 200)
you can probably increase the Loop
Gain to obtain faster focus and
tighter focus position. If the system
is marginally unstable, reduce the
Loop Gain and it will become more
stable.

17
CRISP Operations
The following guide assumes that the default CRISP parameter settings are adequate and will
provide an adequate focus lock with many objectives and sample types. Focus on your sample.
Quick Start Instructions Using ASI_Console
1) Download and install ASI_Console from the ASI website:
http://www.asiimaging.com/support/downloads/asi-console/
2) Using ASI_Console, connect to the MS2000 controller and navigate to the CRISP control
panel via the More… page.
3) Follow the three step initialization and calibration procedure in the CRISP control window.
Use the Lateral adjustment thumb screw to maximize the ERR signal for Step 2 dither.
Quick Start Instructions Using Controller Only
1) Press @ button for 3 seconds to achieve reflectivity calibration. Verify that LCD shows at
least 2.0 dB SNR on the LCD display and that the status indicators on the Left side of the
LCD show GL, indicating the Log Amp calibration is complete and the LED is on.
2) Press @ button for 3 seconds to initiate a gain calibration and Z-axis focus dither. After a
few seconds it should be apparent that the focus system is moving rapidly back and forth a
small distance. The number in the middle on the LCD status line indicates the magnitude of
the focus error change over the dither range.
hL 75 145 00:12:21
3) Adjust the detector lateral adjustment screw on the CRISP unit for maximum absolute
value. Motion of the detector will give large temporary values, so pause after changing the
adjustment to observe the reading. For best performance you would like to have a value
>50 with only modest fluctuations. When you have discovered the best spot for the
detector…
4) Press @ button briefly to advance to the READY state. You can verify that you have a good
calibration by changing the focus of the sample and observing the change of the Err value.
You should see Err respond proportionally to the change in focus, going positive in one
direction and negative in the other.
5) Press @ button briefly to advance to the Lock state. If the focus is not perfect, you can use
the knob on the controller to change the lock reference and hence the focus. If the lock state
is “nervous” or “sluggish”, see details below for how to adjust the loop gain and averaging
for more desirable behavior.
6) Press @ button briefly to unlock and return to the READY state. Subsequently you can just
use a quick-press of @ to toggle the focus lock on and off.
For optimum performance, please refer to the more detailed instructions below.

18
Engaging the LOCK for Normal Operation
In addition to the quick start instructions above…
If you have calibrated the system, but then perhaps changed samples or significantly disturbed
the system, you may find that the focus-error shown on the LCD is nowhere near zero when in the
Ready state prior to locking. If you try to lock, the system could easily run away. Instead reset the
offset by holding down the @ button for >10s first. When you release the button, the Err numbers
should fluctuate about zero, and the transition to the lock state should be smooth.
Once the Lock is engaged, the Z-axis control knob on the controller can be used to manually
adjust the reference lock value. This allows manual focus adjustment of the locked system.
To unlock the system, again, a short-press of the @ button to will do it, returning to the Ready
state.
When the Lock is engaged, any commanded move to the focus axis will fail and will generate a
COD 47 error.
Saving Calibration and Offsets
Once you are satisfied with the focus performance and adjustments, you can save the calibration
parameters to the controller so that in the future you don’t have to go through the entire calibration
procedure again. Merely back out of the READY state, to the IDLE state, with a long-press (3 sec.)
of the @ button. In the IDLE state, hold down the @ button for >10 seconds to save settings to
flash memory.
Now, as long as you stay with the same sample preps and objective lens, you should not need to
go through the first three steps above. When you power on the controller, advance from the IDLE
state to the READY state with a brief press of the @ button. A brief press again, and the system is
locked.
Calibration Details
Different samples and objective lenses can result in dramatically different levels of signal of
returned light and different sensitivity of the detector to focus error. For this reason, there are two
“single button” calibration steps that need to be done before the system is ready to use.
Log-Amp Calibration
Before calibration, choose your objective and focus on your sample.
This calibration step is initiated from the Idle state by a long press (3 sec.) of the @ button.
The log amplifier range offset is adjusted so that the light level on the photodiode is
approximately 75% of full scale. The LCD display shows a signal-to-noise number that is the
signal level on the photodiode compared to when the LED is turned off. For best results, it is good
to have SNR > 4.0 dB. If you have low levels, be sure your sample is in focus, and increase the
LED intensity using the UL X=n% command. Default LED level is 50%.

19
Focus Sensitivity Calibration and Detector Lateral Adjustment
Before this step, first focus on the sample and perform the Log-Amp Calibration described
above. This calibration step can be initiated from the loG_CAL complete state (G) by long-press (3
sec.) of the @ button, or with the serial command LR Y=NA, where NA is the numerical aperture
of the objective you are using. Using the serial command with the correct numerical aperture will
allow the system to use an optimal distance for the focus moves it needs to make. The default is
NA=0.65 which generates move distances suitable for a wide range of objectives, if not ideal. This
calibration step moves the focus up and down a few microns to determine the focus sensitivity of
the system and then proceeds to the Dither state where the focus is continuously moved back and
forth a small amount.
Focus Dither for Optical Adjustments
In the Dither state the focus is changed by up and down by the cal_range amount. The
difference in focus error signal is displayed on the LCD. The system will remain in the dither
state, moving the focus up and down, until commanded to turn off. During the dither, the LCD Err
number shows the change in focus signal from the top to bottom of the dithered focus move. Now
you can make changes to the optical alignment while maximizing the Err number.
Slowly adjust the detector lateral adjustment screw for a maximum absolute Err value. Large
negative numbers are just as good as large positive numbers for obtaining a lock. When you make
any optical adjustments using the Dither function you should keep an eye on the Sum indicator on
the LCD display as well. If the signal level on either detector half gets out of range for amplifiers,
the Sum will read either 0 or 100 for saturated low or high levels respectively. You may find that
best Err reading results in a lower or higher Sum signal that you started with. If the Sum signal is
outside the range 50-80 it is best to redo the log-amp calibration step.
When satisfied that the focus slope is the best possible, a short press of the @ button will cause
the controller to return the stage to the initial position, check and set the error offset to zero, and
leave the system in the Ready state.
Parameters used with the CRISP system
The serial commands give the user access to several parameters used with the CRISP system.
Advanced users may find that they have a need to change particular settings from the default
values for specific purposes.
cal_range Sets the distance the stage moves gain calibrations, dither moves, and focus
curve generation. This can be set directly using the LR F=cal_range command, or
indirectly using the LR Y=NA command where cal_range = 1.5µm/NA2 and NA is the
numerical aperture of the objective lens used.
cal_gain Sets the relative gain of the detector system to the focus motor. Higher
numbers represent less overall loop gain. This number is set by the focus sensitivity
calibration. The value can be queried or set with the LR X command. Users are encouraged
to use the KA command to change the relative gain rather the LR X, although either
parameter can be used to similar effect.

20
lock_range Specifies a maximum range of travel from the point of lock at which point
the controller will disable the lock function and halt motion. This prevents runaway
conditions from damaging objective lenses and sample. Set with the LR Z=lock_range
command.
lock_offset This parameter is an signed integer number representing the focus error on
the detector that corresponds with the desired focus point. The lock_offset is set upon
calibration, changes when the control wheel is turned when locked, and can be reset to the
value that will cause no change in position when the @ button is pressed for >10s in the
Ready state. The user can directly read and write this value with the LK Z command.
LED_Intensity The LED light level can be controlled with this parameter. The default
value of 50% is adequate for many applications. Improved signal to-noise can be obtained
using more light. Set with the UL X=LED_Intensity command.
Log_Amp_AGC This parameter is set automatically during the log amp calibration step. A
digital potentiometer is set such that the signal on the photodiode fills, but does not saturate,
the ADC converter input range. This number will increase with higher LED_Intensity
and more reflective samples.
The values of some of the parameters that are set during calibration will be sent to the serial port if
the verbose mode VB X=16 is set.
Optical Adjustment
The CRISP unit is pre-adjusted at the factory, and should not need major adjustments.
However, this guide will allow anyone to test and check the proper adjustment. The recording
camera is helpful for adjusting the primary mirror position. In order to see the illumination light,
any blocking filter in front of the camera needs to be removed.
Adjusting the Relay Lens position
The relay lens should be set to the center of its range. There is usually no reason to change this.
Adjusting Position of the LED Light Source
Focus on a glass slide with a 10X or 20X objective so that a typical glass/air reflected beam is
obtained. Remove the transmitted light and obtain an image of the reflected light on the camera.
(be sure the L LED indicator is showing on the LCD display) Be sure the mirror is intercepting
the beam. (You may wish to slide the mirror as far away from the LED holder as possible to
ensure adequate light entering the microscope.) Loosen the Adjusting screw on the LED holder
and move and twist the holder so that the image of the LED slit is in the center of the camera
sensor. Focus slightly deeper until the LED element comes in view and then twist the LED holder
so that the active element is showing near the center of the slit. Tighten the screw to hold the LED
in place.

21
a) b) c)
Figure 8: Reflection from glass slide of a) LED exit slit and b) focused deeper, the LED
emitter, when the LED holder is properly aligned by moving c) LED holder.
Sometimes you will notice an unfocused glare from the LED in the camera. This can be due to
light reflecting from within the microscope, often directly from the front surface of the tube lens or
other windows in the light path. Adjusting the position of the LED slightly off center or with a
small tilt can reduce this glare and significantly improve the performance of the CRISP unit.
Adjusting the Primary Mirror
The most critical alignment in the CRISP device is
the primary mirror that injects the LED light into
half of the optical aperture and allows light from the
other half of the optical aperture to reach the photo-
detector. It is important that this mirror reflect the
light exactly onto the optical axis and that the edge
of the mirror exactly stop at the centerline of the
system as well.
One approach for adjusting the mirror position is to
maximize the error signal received when in Dither
mode. First center the photo-detector board so it is
in the middle of its travel range. Use the mirror
adjusting screw to move the mirror back and forth.
You should also find that when the detector and
LED are aligned so that you are getting a reasonable dither ERR, you can adjust the mirror
position to maximize the Sum signal. However, a high dither Err number is most important for
proper operation, so be sure you can return to a good Err number is you use the Sum as a guide to
the mirror adjustment. In general, you will need to adjust the Lateral offset adjustment thumb
screw as you change the mirror position to maintain maximum dither ERR.
With the mirror properly adjusted, you should observe a strong lateral movement of the LED mask
image in the camera as the focus is changed back and forth.
Figure 9: Mirror Adjusting Screw
22
Advanced Techniques
A common problem is that the CRISP system will be able to hold focus best at a location that is
not in the center of the best focus range for the sample. This can typically happen because the
reference cover-slip is slightly in front of the region where the sample is best in focus. Often,
adjustment of the lateral position of the photo-detector will be enough to get acceptable operation.
For more extreme cases, the solution is to move the entire CRISP unit further back from the C-
mount using the sliding C-mount built into the CRISP body. The distance, D, to move the back
depends upon the objective magnification, M, and the required depth of focus change, δ, in media
of refractive index n. The dependence is:
D = δ/n M 2
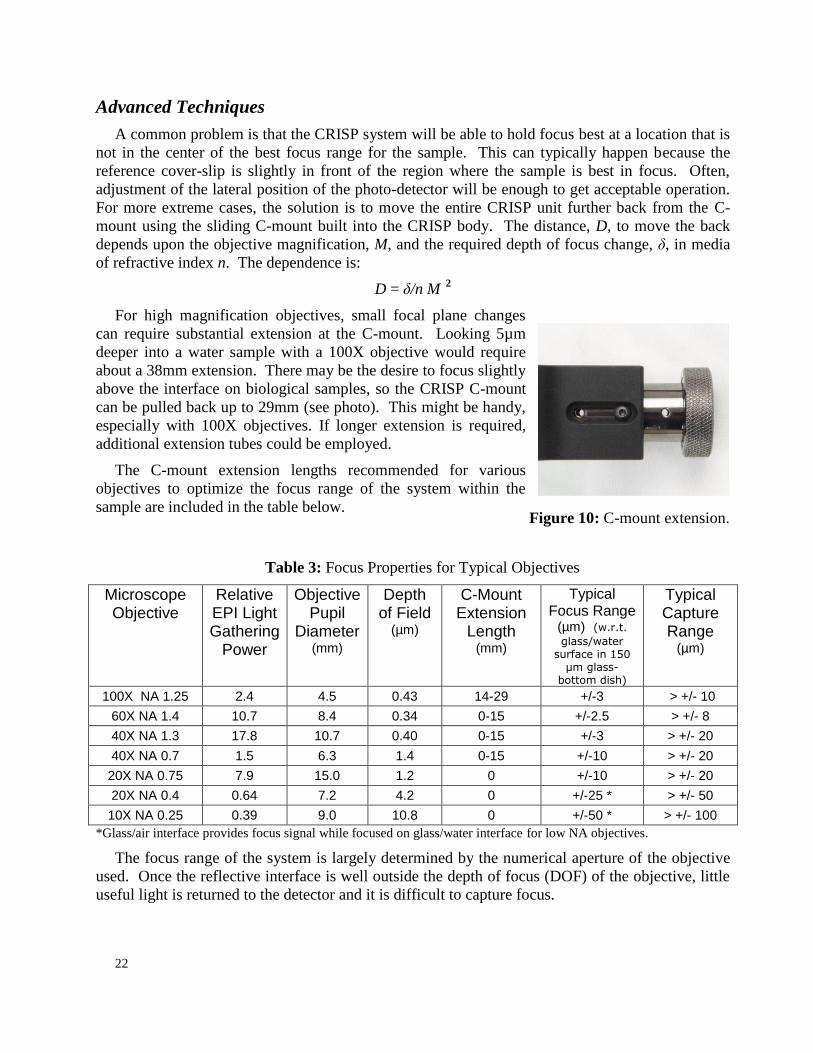
For high magnification objectives, small focal plane changes
can require substantial extension at the C-mount. Looking 5µm
deeper into a water sample with a 100X objective would require
about a 38mm extension. There may be the desire to focus slightly
above the interface on biological samples, so the CRISP C-mount
can be pulled back up to 29mm (see photo). This might be handy,
especially with 100X objectives. If longer extension is required,
additional extension tubes could be employed.
The C-mount extension lengths recommended for various
objectives to optimize the focus range of the system within the
sample are included in the table below.
Table 3: Focus Properties for Typical Objectives
Microscope Objective
Relative EPI Light Gathering
Power
Objective Pupil
Diameter (mm)
Depth of Field
(µm)
C-Mount Extension
Length (mm)
Typical Focus Range
(µm) (w.r.t.
glass/water surface in 150
µm glass-bottom dish)
Typical Capture Range
(µm)
100X NA 1.25 2.4 4.5 0.43 14-29 +/-3 > +/- 10
60X NA 1.4 10.7 8.4 0.34 0-15 +/-2.5 > +/- 8
40X NA 1.3 17.8 10.7 0.40 0-15 +/-3 > +/- 20
40X NA 0.7 1.5 6.3 1.4 0-15 +/-10 > +/- 20
20X NA 0.75 7.9 15.0 1.2 0 +/-10 > +/- 20
20X NA 0.4 0.64 7.2 4.2 0 +/-25 * > +/- 50
10X NA 0.25 0.39 9.0 10.8 0 +/-50 * > +/- 100
*Glass/air interface provides focus signal while focused on glass/water interface for low NA objectives.
The focus range of the system is largely determined by the numerical aperture of the objective
used. Once the reflective interface is well outside the depth of focus (DOF) of the objective, little
useful light is returned to the detector and it is difficult to capture focus.
Figure 10: C-mount extension.

23
The amount of light available for CRISP depends not only on the type of reflective interface,
but also on the light gathering ability of the objective lens. CRISP both illuminates and collects
through the objective, so the relative brightness goes as NA4/M
2. Examples are shown in Table 3.
With low power, low numerical aperture objectives, the light reflected from the air/glass
interface will begin to significantly contribute to the focus signal. If this is desirable (the glass is
flat and uniform), then an extension tube will enhance the focus signal from the air/glass interface
when focused on the glass/water interface. If you wish only to look at the glass/water interface,
there are various tricks you can play to enhance the separation between the light obtained from the
two closely space interfaces. You can preferentially detect the deeper reflection by the position of
the detector. Turn the detector lateral adjustment screw as far counter-clockwise as you can and
still obtain a good dither response magnitude with non-zero signal on both detector halves. 20X
objectives seem to be about the most difficult to separate the glass/water signal from a nearby
much larger glass/air interface. Tricks might include using thicker glass bottom dishes or
coverslips so the interface is further away, or just maintaining a very clean and uniform glass/air
surface so what contamination of signal from that surface that there is will not affect the overall
focus position.
Using the Iris LED Beam Stop
The internal iris in the CRISP unit can be used to improve the returned beam quality by
reducing the amount of stray LED light that cannot be accepted by the objective aperture. The
system is shipped with the iris all the way open so as to be able to accommodate high brightness
objectives. Use the dither calibration to optimize the iris size. You may discover that the Err
signal remains relatively constant as you decrease the aperture, but he Sum signal decrease,
reflecting the decrease in background light level. Decrease the aperture size until the Err signal
begins to decrease, and then redo the log-amp calibration.
Using Focus Curve Generation for Optimizing Adjustments
Sometimes it is instructive to plot the focus error response so you can asses exactly the useable
lock range and capture range of the system. To do this, first lock focus and adjust the lock
optimally. Unlock to the Ready state and press the Zero button to set the Z-in-focus position to
zero. Then issue the command LK F=97 to initiate the focus curve generation. Below is the
serial output from such a run. The third and fourth columns are the Z-position in microns, and the
relative focus error respectively.
LK F=97
:A a
T: 0 -10.4 0
T: 50 -10.4 -1
T: 100 -9.9 1
T: 150 -9.4 2
T: 200 -8.9 4
T: 250 -8.4 7
T: 300 -7.9 9
T: 350 -7.4 18
T: 400 -6.9 22
T: 450 -6.4 29
T: 500 -5.9 35
T: 550 -5.3 40
T: 600 -4.8 43
T: 650 -4.3 43 +Peak
T: 700 -3.8 41
T: 750 -3.3 37
T: 800 -2.8 32
T: 850 -2.3 27
T: 900 -1.8 23
T: 950 -1.3 22
T: 1000 -0.8 16
T: 1050 -0.3 10
T: 1100 0.2 2 Focus
T: 1150 0.7 -6
T: 1200 1.2 -16
T: 1250 1.7 -25
T: 1300 2.2 -30
T: 1350 2.7 -32
T: 1400 3.2 -33
T: 1450 3.7 -31
T: 1500 4.2 -34 -Peak
T: 1550 4.7 -30
T: 1600 5.2 -30
T: 1650 5.7 -27
T: 1700 6.2 -27
T: 1750 6.7 -25
T: 1800 7.2 -24
T: 1850 7.7 -22
T: 1900 8.2 -22
T: 1950 8.7 -19
T: 2000 9.2 -19
T: 2050 9.7 -19
T: 2100 10.1 -16

24
Cut and paste into Excel to plot the numbers. You can see the strong slope near the surface
(Z=0) that provides the focus feedback. For a focus at the interface, the capture range includes
any Z-position that has the correct polarity of focus error signal to bring the stage back to the
lock point. In this case the capture range extends to about 10µm into the sample and even further
before the surface. The useful lock range depth into the sample is any region of the focus error
curve with the correct slope – allowing for a little capture range beyond the lock point. In this
case beyond about -3.5µm (into the sample) it would be hard to hold lock since it is very close to
the focus peak.
Focus Variation Reduction by Averaging
In many instances, the focus lock mechanism is used to hold the subject in focus for long
periods of time. Dynamic performance is secondary, and stable focus on a weak interface may
be more important. In these cases, turning on averaging of the error correction signal can
improve performance. Use the “RT F=n” command to average 2n samples. Beware that
excessive averaging adds a time delay that can effect stability. If oscillation occurs, either
reduce the number of averaged samples or reduce the loop gain. Using n = 5 to 9 with reduced
loop gain (KA 1 to 5) can significantly smooth out marginal focus situations and hold the focus
very still even on weak interfaces where the purpose of the device is mainly thermal drift
compensation.
Dynamic Performance Optimization
For application of automated image acquisition, the speed of the autofocus can limit the
throughput of the system. In these instances, it is important that the focus respond quickly to
error conditions that change as the stage moves in XY. Default loop gain established by the
calibration procedure results in modest speed and moderate stability. To push the speed, there is
a separate variable set by “KA Z=m” that is used as a gain multiplier. The default KA value is
10. Usually the system will be stable increasing the value to 20 or higher, with significant speed
improvement, but increasing KA above 10 is best used only when you have a strong reflection
with low noise variation. Averaging should be turned off (RT F=0) when higher gain is used
since the time delay associated with the average can introduce instability. There is no substitute
for a strong reflected signal if you need to focus quickly and accurately.
25
Troubleshooting Steps
If you cannot get sufficient Err difference in the Dither state, check these troubleshooting
steps.
1) Verify that the electronics are working. Using the CRISP control in ASI console…
a) Set LED Intensity to 0%. Apply.
b) Click Step 1 Log Amp Calibration. Verify that the AGC number returned is less than
ten. If so, that indicates that the LED can be controlled, and the amplifier has good
noise performance. If the AGC number is >10, contact ASI.
c) Set LED Intensity to ~70%. Apply. Save. Be sure you can get AGC value >35.
2) Verify that you have an appropriate sample that is in focus. Prepared fixed samples
usually will not return a good reflected beam because of the index matching mounting
media. Choose a simple glass/air interface if you are having trouble before graduating to
glass/water interfaces.
3) Verify that the IR light can reach the objective. Remove filter cubes if unsure of their
properties.
4) Flat glass windows and prism surfaces can reflect more IR light than is coming from the
desired interface. Be sure you are using a 100% photo port without intervening prisms.
5) If problems persist, achieve and image of the CRISP LED on the system camera by
removing the IR block from the optical path. Usually there is sufficient light that leaks
through the dichroic to be able to see the CRISP LED light on the camera when there is no
other illumination. Verify that the CRISP LED light is present at the sample an go
through the steps described in the Optical Adjustment section of this manual.
26
Computer Control of the CRISP System
The focus controller responds to several commands dedicated to controlling the feedback system.
Please see the MS-2000 Programming Manual for further information about using serial
commands.
Command: LOCK
Shortcut: LK
Format: LK [X] [Y] [Z=lock_offset] [F=code]
Function: The LOCK command without any arguments X, Y, or Z advances to the next
focus state just as would a short-press of the @ button.
LK X? returns the single character indicating the current focus state as described
in the table on page 2 of this manual.
LK Y? returns the present value of the focus error which is also shown on the
LCD display.
LK Z? returns the present value of the focus error lock_offset. The offset is
automatically determined during calibration and is modified when the command
wheel on the controller is used to focus a locked system. The offset is also reset
with a >10 sec. press of the @ button. A particular value of lock_offset may be
set using LK Z= lock_offset.
LK F=code will unconditionally set the focus state. code is the ASCII decimal
equivalent for the ‘state’ character that is displayed on the LCD. For example, to
unconditionally enter the ‘B’ state the command would be LK F=66. Not all
states are best entered directly. See the system state table for the appropriate
ASCII code to enter a particular state gracefully.
Reply: “:A” is returned upon receipt of the command.
Example: LK X?
:A W shows the system is in the WAIT state.

27
Command: UNLOCK
Shortcut: UL
Format: UL [X=LED_Intensity][Z=Rel_LK_knob_spd][F=focus_index]
Function: Without arguments, this command unlocks the servo from the focus system and
returns control to encoder feedback from the Z-axis drive. The focus error offset
is not changed.
The LED_Intensity may be set from 0 to 100 (%) of full power using the X
argument. Default is 99.
Rel_LK_knob_spd (default 2) controls the sensitivity of the control focus knob
when the system is locked. This will vary depending on the calibration factor that
the system finds, so don’t be alarmed if you find large sensitivity differences with
conditions.
If the controller can handle more than one Z-axis focus device, you can specify
the focus_index to select which one is active for the CRISP system. Save the
parameter change (SS Z) and reset the controller.
Reply: “:A” is returned upon receipt of the command.
Command: LOCKRG
Shortcut: LR
Format: LR [X=cal_gain] [Y= objective lens NA] [Z=lock_range] [F=cal_range]
Function: The LOCKRG command allows the user to control of several system variables.
The X parameter, cal_gain, is the gain variable normally obtained from running
the calibration sequence. Although not recommended, it can be changed with this
command, but it will be reset upon running the calibration sequence.
The Y sets the cal_range focus depth appropriately for a given objective’s
numerical aperture.
The Z parameter controls the maximum excursion of the stage before the system
generates an error condition and unlocks. The value lock_range is in units of
millimeters. The default value is 1.0 mm.
The F parameter controls the excursion of the stage when going through the
calibration sequence. The default value for cal_range is 0.005 mm.
Reply: “:A” is returned upon receipt of the command.
Query: LR Z? returns the lock range.
A: Z = 0.050 (for example)

28
Command: KADC
Shortcut: KA
Format: KA [X=n] [Y=n] [Z=n] [F=n]
Function: Adjusts a gain multiplier in the CRISP servo loop where n is a signed integer.
Reply: “:A” is returned upon receipt of the command.
Query: KA Z? returns the current value.
:A Z=10 (for example)
Command: RT
Shortcut: RT
Format: RT [X=report_time] [Y=pulse_length] [Z=delay_time] [F=num_aves]
Function: The X argument Sets the time interval between report events when using
IN0_mode = 5, TTL triggered serial interface asynchronous reporting. The
report_time value has an acceptable range from 20 to 32700 milliseconds. The
default value is 200 ms.
The Y argument sets the length of the TTL output pulse when using any
OUT0_mode that generates a TTL pulse.
The Z argument sets the post-move delay time for sequenced arrays.
The F argument sets num_aves, the power-of-two exponent for the number of
samples to be averaged. Used with the CRISP system.
Reply: “:A” is returned upon receipt of the command.
Command: AFLIM
Format: AFLIM [X=Log_amp_AGC] [Y=LED_intesity_pot]
Function: Use this command to directly read and write values (0 to 255) to the CRISP
electronics digital potentiometers. (Not recommended for use with host
software.)
Command: EXTRA
Format: EXTRA [X?] [Y?]
Function: X? Provides the CRISP bottom line string as is shown on the LCD display.
Y? Returns the SNR value shown on the LCD after log amp calibration.

29
TTL Control of the CRISP focus lock
In some instances it may be desirable to be able to turn on/off the CRISP lock using a TTL
signal. Imaging software that does not support CRISP explicitly may support controller TTL I/O
which can provide a simple method to synchronize the autofocus function with other imaging
functions.
The MS2000 TTL Input can be programmed for several functions. Use TTL X=9 to select
the CRISP control function. (See the TTL command section in the MS2000 Programming
manual for more details.)
Use ASI_Console, the @ button interface, or explicit serial commands to calibrate and set the
CRISP system to the READY state (R on the LCD display). Once in the READY state, and with
TTL X=9 selected, a logic HIGH on the TTL IN BNC connector will engage the CRISP lock.
The lock will be maintained until the TTL IN signal goes to a logic LOW, at which point the
system will unlock and return to the READY state.