Embed Size (px)
Citation preview

CRISIS AND ECONOMIC GROWTH IN THE EU
Péter HALMAI
Faculty of Economics
University of Pannonia
Veszprém, Hungary
Viktória VÁSÁRY
Faculty of Economics
University of Pannonia
Veszprém, Hungary
Abstract
The dramatic decline in the actual output of the European economy is considered to be more
than a cyclical discrepancy from the potential output. Both the level and the growth rate of the
potential output show an unfavourable development. It is an important task of economic research to
identify the channels through which the financial crisis might have an impact on the level and growth
rate of the potential output. The European economic policies face major challenges while trying to
find those effective answers which contribute to the mitigation of the potential output losses.
The impacts of the crises on the potential growth need to be reviewed in regard to potential
growth factors (labour utilization, capital accumulation and total factor productivity). It is essential to
reveal the transmission channels and the experiences gained during previous financial and economic
crises.
The paper is based on broad mid-term quantitative analyses using the production function
approach. In the end alternative long-term scenarios are analyzed.
Keywords: economic crisis, potential economic growth, production function approach
JEL classification: E60, F15, O10
1. INTRODUCTION: POTENTIAL IMPACT OF THE CRISIS ON THE
POTENTIAL GROWTH
It is of high importance to reveal the potential growth trends. The potential growth is a
cumulative indicator showing the sustainable and non-inflationary growth generating ca-
pacity of the economy. The potential growth rate indicates the steady-state economic
dynamics. Unlike the actual growth rate it does not contain cyclical factors. (The difference
between the actual and the potential growth rate is considered the output gap i.e. a funda-
mental indicator of the boom.)

412 Péter HALMAI, Viktória VÁSÁRY
The potential growth can be calculated by using the growth accounting, the production
function approach. Focus was principally set on the supply-side of the economy (labour,
capital accumulation, total factor productivity (TFP), the main driving forces of the output).
In the production function the potential growth can be calculated based on the labour and
capital inputs and the development of the TFP. (While analysing the potential output the cy-
clical factor was removed as regards both labour and capital.) [See in detail D’Auria (2010)]
The Cobb-Douglas production function simplifies the analysis. The potential GDP can be
calculated as follows:
(1) TFPKLKEULEUY KKLL *)()( 11
where UL, UK is degree of excess capacity
EL, EK is efficiency level of the production factors
(2) ))(( 11 KLKL UUEETFP
The TFP summarizes the degree of utilisation of the production factors and their tech-
nological level. Factor inputs are measured in physical units. (Through hours worked for
labour input and a comprehensive measure including spending on infrastructure and equip-
ment for capital.)
The financial and economic crisis has a significant impact on the potential growth.
(The impacts on the long-term potential growth are particularly difficult to reveal.)
In the short run the significant decrease in the level of the potential output is the result
of the decrease in the productive capital stock (increasing capital depreciation), and the neg-
ative impact on the labour supply and the structural unemployment. The decisive question is
the impact of the crisis on the long-term potential output growth. If the potential growth will
be strengthened following the crisis, then the loss caused by the decrease in the output level
might be compensated after a while. The economy might get on a higher, sustainable growth
path due to the effects of the crisis forcing out structural transformation. (As for these pro-
cesses, the development in Sweden and Finland following the crisis at the beginning of the
1990s might serve as a good example.)
Actually, as regards the impacts of the crisis on the potential output the uncertainty is
significant. These impacts might be summarized in advance based on three main logical
scenarios. [European Commission, 2009b]. All three scenarios contain the decrease in the
potential output in the short run, but presume different impacts in the long run as regards its
growth rate:
- according to the ‘total rebound’ scenario the potential output will accelerate after
the crisis to an extent which contributes to the replacement of the total lost output and the
economy might get back on the growth path prior to the crisis;
- in the case of ‘the lasting loss of the potential output level’ the potential growth
pace will get back to the dynamics previous to the crisis, but at a lower output level;
- in the case of ‘the lasting loss of the potential growth rate’ it will come to the de-
crease in the dynamics of the long-term potential growth due to the crisis. Because of the
lower increase in the total factor productivity the potential output level will diverge more
and more form the path prior to the crisis, e.g. if the new financial conditions are more re-
strictive due to less dynamic innovation and decreasing R&D investments. (These scenarios
are indicated in figure no. 1)
In order to understand profoundly the impacts of the crisis on the potential output and
its growth the individual growth factors need to be analyzed at large. Applying the produc-
tion function approach the recession might have an impact on growth through three different

Crisis and Economic Growth in the EU 413
channels: capital accumulation, labour input and total factor productivity. The labour supply
can be divided into participation rate, average working hour and working age population and
the structural unemployment rate. (The latter is the NAIRU - Non-Accelerating Inflation
Rate of Unemployment) TFP shows the effectiveness of the use of production factors. (As
the latter is actually unobservable it is often calculated as the residue besides the labour and
capital factors.)
It needs to be highlighted, that the economic recession might have different impacts on
these factors of the potential growth over time. The relationship between recession and po-
tential growth might be both positive and negative depending on the mechanism of the
origin of the growth process.
1. ’total rebound’
Potential output level
time
Potential growth
during and
following the
crisis
Long-term potential
growth
2. ’lost decade’
Lasting loss in the
potential output level
Potential output level
time
The same long-term potential growth
after the crisis
3. ’lasting and increasing loss’
Potential output loss
Potential output level
time
Lower long-term output growth after the
crisis
Potential output level before the crisis (e.g. 2%)
Figure no. 1 1. ’total rebound’- 2. ’lost decade’- 3. ’lasting and increasing loss’
Source: [European Commission, 2009b]
414 Péter HALMAI, Viktória VÁSÁRY
2. TRANSMISSION CHANNELS OF THE FINANCIAL CRISIS. PAST AND
PRESENT EXPERIENCES
The last financial crisis has had an impact on the economy of the EU mainly through
three channels:
- connections within the financial system. Although the crisis started in the US the
banks in Europe (especially in the United Kingdom and in the Euro-zone) have suffered
higher write-downs. These losses result in a significant contraction in the economic activi-
ties. In the deleveraging process the banks reduced remarkably the share of emerging
markets. (Through closing further credit lines and capital repatriation.) As the crisis pro-
gressed the financing has decreased to a significant extent in the emerging European
economies.
- confidence and wealth effect on the demand. During the period of the strengthening
lending standards the declines in the wealth of households and the fall in the asset prices
(particularly stocks and housing prices) the savings have increased the demand for consumer
durables (among them cars) and the residential investments have decreased. This process
was strengthened by the inventory cycle: the cutback of previous involuntary stock building
resulted in further decrease in production. All these factors have had an unfavourable feed-
back effect onto the financial markets.
- international trade. The global trade collapsed basically in the last quarter of 2008.
The business investments and the demand for consumer durables - both depend significantly
on credit granting and both are trade intensive – have remarkably decreased. The fall in
trade was greater than it could have been expected according to previous experiences. Its
main causes are considered the composition of the demand shock (which affected mainly the
trade intensive capital goods and consumer durables), the cessation of the trade finance and
the fall in the economic activity.
The GDP fall in the EU exceeded in average 4% in 2009. This recession has been the
most serious since WWII. (Table 1 and 2)
Table no. 1 Main macroeconomic indicators in the EU
2008 2009 2010
GDP (change, %) 0,9 -4 -0,1
Private consumption (change, %) 0,9 -1,5 -0,4
Public consumption (change, %) 0,9 -1,5 -0,4
Total investment (change, %) 0,1 -10,5 -2,9
Unemployment rate (%) 7 9,4 10,9
Inflation (core inflation, %) 3,7 0,9 1,3
Source: [Eurostat]
The financial crises have deep impacts on the long-term output growth. According to
Cerra and Saxena’s analysis [2008] the recession was not followed by rapid recovery. The
loss of trend output has not been fully recovered later on. The loss of the GDP level was
generally not set off by a higher growth after the crisis. In the countries analyzed (in the case
of 7 countries out of 14) the growth pace experienced during the decade following the
trough of the crisis is somewhat lower than that prior to the crisis.
Crisis and Economic Growth in the EU 415
The bank crises and the bigger recessions share several common peculiarities. Both are
characterized by the decline in the activity and the industrial reallocation and the significant
decrease in the investment. All these have remarkable impact on the potential growth.
The recessions following a financial market crisis are deeper than the ‘ordinary’ re-
cession. Those are generally associated with the significant decrease in the housing prices
and the construction output. [Reinhard and Rogoff, 2008, Claessens et al., 2009] The de-
crease in consumption is high during recessions. It reflects also the loss of assets (e.g.
decrease in the housing prices.)
Table no. 2 Development in actual economic growth (2008-2010)
2008 2009 2010
Bulgaria 6,0 -1,6 -0,1
Czech Republic 0,2 -2,7 0,3
Estonia -3,6 -10,3 -0,8
Latvia -4,6 -13,1 -3,2
Lithuania 3,0 -11 -4,7
Hungary 0,5 -6,3 -0,3
Poland 4,8 -1,4 0,8
Romania 7,1 -4,0 0,0
European Union 0,9 -4,0 -0,1
Source: [Eurostat]
During the past decades the impacts of the economic recessions (not only the financial
crises) are mixed as regards the long-term potential growth in the European countries.
The dynamics of the capital accumulation has decelerated in most European econo-
mies in the short- and medium term. [Haugh et al., 2009, European Commission, 2009b] In
the long run the contribution of the capital accumulation to the potential growth has basical-
ly not changed in most EU member states. The dynamics of the capital intensity has slowed
down dynamically and continuously in a small group of the countries considered (FI, SE,
IE). Although the recession affected the capital accumulation in the short run, in the long
run the structural factors played a decisive role. The growth model of these economies
changed significantly in the 1990s. Due to the change in the industrial structure the capital
accumulation declined and the contribution of the TFP to the potential growth increased.
After the severe recession the contribution of labour to the potential growth increased
in most countries analyzed. During the decade following the recession the contribution of
labour increased in 7 countries out of 10 countries analyzed. The level of NAIRU grew dur-
ing recessions but it generally declined after it.
After the big recessions the dynamics of the total factor productivity was different, but
it was considered the main driving force behind the long-term output growth. In certain
countries (EL, FI, SE and UK) the dynamics of TFP intensified and in other countries (BE,
DE, ES, FR, IT, and PT) declined. The TFP and the increasing dynamics of the potential
growth coincided in the countries considered. (The only exception was Spain, where the
participation rate grew significantly. Thus the contribution of labour to the potential growth
increased.) TFP growth is considered a key factor as regards the differences of the potential
growth among countries during recessions.

416 Péter HALMAI, Viktória VÁSÁRY
Output losses after banking crises are 2 to 3 times higher. It takes on average twice as
long for output to recover back to its potential level. [Haugh et al., 2009] In comparison with
other financial and real-estate crisis driven recessions the current slump it is considered to
be severe as regards both output and investments. It might be compared with the Great De-
pression in the 1930s.
In terms of the demand components the main factor of the downturn was the collapse
in fixed capital formation. The household consumption, stock formation and net-exports
contributed to the recession as well. The deleveraging has namely continued in the house-
hold and the corporate sector (financial and non-financial sector) also during the deepening
of the recession.
After the crisis hit the bottom the recovery has started both in the global economy and
the economy of the EU. The economic policy measures (liquidity enhancement through
monetary policy, additional fiscal demand stimulus etc.) have played a significant role in the
moderation in the downturn and the initial boom. The pace of the recovery is, however, lag-
ging behind the dynamics experienced following previous recessions. [Reinhart, 2010],
IMF, 2009] Differences between countries are significant.
At the same time the fiscal stimulus applied broadly while handling the crisis has led
to an increase in current account deficit and public debt. In 2010 the government deficit
might reach 6.5% expressed as percentage of the GDP and the public debt might excess
80% of the GDP in 2011 [European Commission, 2010] Adjustment of the public finances is
unavoidable. The fiscal consolidation might result in the fall of economic growth in the
short run. In the long run its impact is positive, especially if it comes also to the introduction
of growth enhancing structural reforms. The high ration of public debt causes significantly
lower growth both in developed and emerging economies. [Reinhart and Rogoff, 2010]
(Besides the crowding out effect also the financing of the deficit through distorting taxation
and the increase in the government risk premium need to be underlined in its mechanism.)
The current crisis leads to potential output loss in the European Union. While the ef-
fect on the potential growth is much more uncertain, the decline in the dynamics of the
potential output – by having basically the same policies – is unavoidable in the medium and
long run, due to the decrease in the TFP dynamics in particular.
3. FINANCIAL CRISIS AND SLOWDOWN IN POTENTIAL GROWTH
(MEDIUM-TERM QUANTITATIVE ANALYSIS)
The likelihood of the lasting effects on potential growth is much higher in the case of
the current crisis than of previous recessions. The length of the crisis its global characteris-
tics and the change in the risk related behaviour might explain that. According to the
forecast of the European Commission (Spring 2010), the crisis is expected to be longer than
the previous crises. [European Commission, 2009d] It will have an adverse effect on the in-
vestments - on intangible investments in particular (namely R&D) – which has a severe
impact on the TFP growth and the potential output. On the on hand the NAIRU might in-
crease due to the hysteresis effect [See Blanchard et al., 1989] resulting in further drop in
the potential output level and slowing down the potential growth in the short and medium
term. Many discouraged workers leave the labour market decreasing this way the labour
supply.
As the crisis is a global one the possibilities of recovery through rechanneling of re-
sources from sectors producing non tradable goods into sectors producing for export is

Crisis and Economic Growth in the EU 417
limited, because global trade declined remarkably. In the middle of the 1990’s - following
the financial crisis – the essential factor of the Finnish and Swedish ‘miracle’ was the struc-
tural transformation, the reallocation of resources based on effectiveness and
competitiveness into ICT sectors.
The risk-related output losses can be estimated only vaguely. The long recession has a
severe and drown-out effect on the main factors of the production function. On the potential
growth path negative structural changes might occur, none the less the downturn will gradu-
ally stop.
The current crisis leads to potential output loss in the European Union. (2. scenario in
figure 1) While the effect on the potential growth is much more uncertain, the decline in the
dynamics of the potential output – by having basically the same policies – is unavoidable in
the medium and long run, due to the decrease in the TFP dynamics in particular.
3.1. Slowdown in potential growth (Medium-term quantitative analysis)
In the medium term estimations the uncertainty is considerably high as regards the
forecasts on investments and total factor productivity. The moderate investment dynamics
of the recovery period due to the financial market problems, the growing cost of capital, the
shocked capital allocation system and the capital allocation system - that is more unfavoura-
ble than it would be in an optimal case – and because of all of these the slower dynamics of
the inevitable structural transformation intensify the uncertainty and the possibility of ad-
verse trends. So there are several factors having significant impact through the capital
accumulation channel. Thus the change in the TFP or the capacity utilization can be meas-
ured only loosely. Considerable depreciation rate and at the same time the impacts of the
crisis on the innovation and the structural transformation of sectors need to be taken into ac-
count.
In 2009-2010 the potential growth rate of the Euro zone (and the EU3: Denmark,
Sweden, United Kingdom) is expected to drop to the half of that measured in 2008.i (I.e. the
annual growth rate of 1,3-1,6% is likely to decrease to 0,7-0,8%.) The new MSs show the
same situation, the growth rate is, however, higher in their case as they are catch-up coun-
tries. (see table 3).
Table no. 3 Potential growth in the European Union
Potential
growth
(as percent-
age of the
annual
change)
Contribution to the potential
growth
Labour Capital TFP
NAIRU
(as percent-
age of the
labour force)
Investment
rate
(as percent-
age of the
potential
output)
Euro zone (EA-16)
2001-
2005
1,8 0,5 0,7 0,6 8,5 20,9
2006 1,5 0,3 0,8 0,4 8,4 21,9
2007 1,5 0,3 0,9 0,4 8,4 22,6
2008 1,3 0,1 0,8 0,4 8,6 22,3
2009 0,7 -0,2 0,5 0,4 9,1 19,8
2010 0,8 -0,1 0,4 0,5 9,5 19,3
2011 1,0 0,0 0,4 0,6 9,8 19,5
2012 1,5 0,4 0,5 0,7 9,9 19,9

418 Péter HALMAI, Viktória VÁSÁRY
Potential
growth
(as percent-
age of the
annual
change)
Contribution to the potential
growth
Labour Capital TFP
NAIRU
(as percent-
age of the
labour force)
Investment
rate
(as percent-
age of the
potential
output)
2013 1,6 0,4 0,5 0,7 10,0 20,3
2014 1,7 0,4 0,6 0,8 10,0 20,6
EU3 (DK, SE, UK)
2001-
2005
2,4 0,3 0,8 1,4 5,1 17,6
2006 2,2 0,3 0,9 0,9 5,4 18,9
2007 2,0 0,2 1,0 0,8 5,6 19,9
2008 1,5 0,0 0,8 0,7 6,0 19,1
2009 0,8 -0,3 0,4 0,7 6,5 15,9
2010 0,8 -0,2 0,3 0,7 6,9 15,3
2011 1,1 0,0 0,3 0,8 7,3 15,5
2012 1,5 0,2 0,5 0,9 7,5 16,4
2013 1,8 0,2 0,6 0,9 7,6 17,4
2014 1,9 0,2 0,7 1,0 7,6 18,2
E8 (BG, CZ, EE, HU, LT, LV, PL, RO)
2001-
2005
3,6 -0,4 1,6 2,3 11,7 22,5
2006 4,4 0,7 2,0 1,7 10,1 25,2
2007 4,4 0,7 2,3 1,5 9,3 27,8
2008 4,0 0,5 2,3 1,2 8,7 28,3
2009 2,9 0,2 1,7 1,0 8,5 24,9
2010 2,4 0,0 1,5 0,9 8,6 24,4
2011 2,3 -0,2 1,5 0,9 8,7 25,0
2012 2,4 -0,2 1,5 1,0 8,7 25,6
2013 2,2 -0,3 1,5 1,0 8,7 25,7
2014 2,0 -0,4 1,4 1,0 8,7 25,4
Source: [own compilation based on the OGWG database]
In the Euro zone and the EU3 the decrease in the potential output is to be explained
mainly by the significant decrease in labour- and capital factors. The structural unemploy-
ment is expected to rise by 1-1,5% and the investment as a share of GDP might decrease by
3%. The dynamics of TFP is in average low in the Euro zone and it is decreasing by approx-
imately 0,1% per year in the EU3. (This TFP assessment is relatively conservative. It does
not take into account that there is a one-off downward shift in the TFP level related to the
change in the industrial structure.)
In the EU8 – i.e. in the new MSs outside the Euro-zone - the financial crisis is likely to
result in a strong decrease in the potential growth rate: from an annual 4% in 2008 to 2,9%
in 2009 and 2,4% in 2004. The different factors of the potential growth react basically simi-
larly to the financial crisis both in the Euro zone and the EU3.
As regards the direction of the growth dynamics in 2009-2010 it is to be considered
similar both in the old and the new MSs. There is, however, a significant difference in the
case of the medium term trends of 2011-2014. The potential growth rate in the Euro zone
and the EU3 is expected to be recovered by and large in this period. (The dynamics will be
similar to that prior the crisis.) The prospects of the EU8 are much more unfavourable. The
Crisis and Economic Growth in the EU 419
contribution of the investments and the TFP won’t be recovered from the 2009-2010 level.
The labour market trends might even worsen further on. (Primarily, due to the significant
deceleration of the growth rate of the working age population.)
3.1.1. Potential growth in the main country groups
The financial crisis has affected the different MSs to different extent. The symmetric
shock has had asymmetric consequences.
The intensity of the impacts of the financial crisis depends on the initial circumstances
and the vulnerability originating from them. The overestimation of the housing markets, ex-
port dependency of the economies, their current account position, the size of the financial
sector and the exposure to risky assets might have a significant role. In the individual MSs –
in relation to the factors mentioned – the potential growth rate, the investment rate, the
structural unemployment (NAIRU) etc. differ to a great extent. Henceforth, the countries of
the EU 27 are categorized into 5 groups based on the potential growth dynamics, the in-
vestment as a share of the GDP, the main economic and economic policy peculiarities, the
advancement in the field of the Lisbon Agenda and to less extent their location.
The ‘continental countries’ (BE, DE, FR, LU) are members of the Euro zone. The po-
tential growth rate fell remarkably prior the crisis. These are countries with current account
surplus (with the exception of FR). The Lisbon-type reforms have been carried out restrain-
edly.
The ‘reform countries’ (AT, DK, FI, IE, NL, UK, SE) have shown significant im-
provement as regards the structural reforms. The ‘Anglo-Saxon’ and the ‘Scandinavian’
model have proved to be more competitive than the continental one during the globalization
period. The potential growth rate exceeded that of the continental countries. At the same
time the growth dynamics moderated preceding the crisis and it converged towards the dy-
namics of the continental countries. The smaller countries belong mainly to the Euro zone. 3
MSs (DK, SE, UK) are not members of the Euro zone. Characteristically there is a current
account surplus (with the exception of UK and IE).
The potential growth dynamics has been very low in some ’Mediterranean’ countries
for years (IT, PT), but it fell also in the others (EL, ES, MT) at the outset of the crisis. The
current account deficit and significant structural deficiencies are typical in these MSs.
In the ‘catch-up’ group there are the MSs joined the EU in 2004 which showed favour-
able growth and convergence prior the crisis (CZ, CY, PL, SK, SL). 3 smaller countries
among them are members of the Euro zone, but the two bigger countries are not. All the
countries classified as ‘catch-up’ countries have current account deficit. (It is, however, rela-
tively moderated in this group – with the exception of CY.)
The ‘vulnerable’ group contains the Baltic States and Hungary which joined the EU in
2004 and Bulgaria and Romania which joined the EU in 2007. With the exception of these
two countries (BG, RO) the potential growth rate decreased before the crisis. There is little
advancement as regards the structural reforms. None of the countries is a member of the Eu-
ro zone. The current account deficit is mostly high (two digit!), the dependency on the
external financing and their vulnerability is very high.
The characteristics of the groups and the countries in the groups are indicated in table 4
and the potential growth is shown in Figure no. 2.
Based on the dataset the following needs to be stressed in terms of the country groups.

420 Péter HALMAI, Viktória VÁSÁRY
The potential growth rate in the ‘continental’ countries is significantly decreasing dur-
ing the crisis, then it will recover, it might even outdo the first half of the decade which is
very unfavourable in their case. Among the decisive factors of the potential growth there is a
slight intensification in the contribution of the TFP (The annual 0,3% in 2007-2010 will in-
crease to 0,8%). According to the simulation there is no increase in the structural
unemployment in this country group. The investment ratio will, however, decrease by
roughly 2% of the potential GDP.
Table no. 4 Potential growth, current account and the investment ratio in the country groups
Country group
Potential growth
rate
Current account
deficit
(as percentage of the
GDP )
Investment ratio
(as percentage of the
potential output)
2005 2008 2005 2008 2005 2008
‘Continental’ (a)
(BE, DE, FR, LU)
0,8-1,9 (a)
1,0-1,7(a) 2,2-5,2(a) 0,2-
6,6(a)
18,7-
22,0(a)
21,2-
23,5(a)
(except FR)
‘Reform countries’
(AT, DK, FI, IE,
NL. UK, SE)
1,4-3,6 1,4-2,6 3,9-7,5 2,2,-8,3 17,7-22,3 18,6-
22,0
(except IE, UK)
‘Mediterranean’
(EL, ES, IT, MT,
PT)
0,6-3,3 0,4-2,6 -1,2;-11,0 -3,0;-
13,8 20,3-28,3
15,7-
28,2
‘Catch-up’
(CZ,CY, PL, SK,
SL)
3,5-5,4 3,3-5,0 -1,2;-8,6 -3,3;-
5,1 18,7-28,0
22,8-
31,2
(except CY)
‘Vulnerable’
(BG, EE, HU, LT,
LV, RO)
3,1-7,0 0,8-5,1 -7,1;-12,5 -6,6;-
22,9 24,8-37,0
24,6-
40,0
EU27 1,8 1,5 -0,3 -1,1 20,5 21,8
USA 2,5 1,8 -5,9 -4,9 19,9 18,0
Note: (a): Without the date of LU
Source: [own calculation]
Figure no. 2 Potential growth in the country-groups of the EU
Source:[ own calculation]

Crisis and Economic Growth in the EU 421
The growth performance of the ‘reform countries’ exceeded highly that of the previous
country group during the first half of the decade. The decrease in the potential growth is
bigger during the crisis in these countries than in the ‘continental’ countries. The financial
turmoil is significant in certain ‘reform countries: the exposure to the international capital
flow, the impacts of the risky financial assets, the risks of the toxic assets, the housing-
bubble burst might have an impact, too. Due to all that – based on the simulations – the in-
vestments decrease to an extent that equals 5% of the GDP when the crisis hits its bottom.
The structural unemployment increases by approximately 2%, but even so it is lower than
that of the ‘continental’ countries. Among the individual growth factors the decrease in the
contribution of the capital accumulation to the potential growth is significant. (This factor
which equalled 1% of the potential GDP in 2005 will be decreased to 0,7% by 2010.) The
decrease in the TFP that started prior the crisis is a significant trend. During the recovery pe-
riod from 2011-2012 onwards the dynamics of the TFP – together with the capital factor –
will increase. At the same time the growth rate of the TFP will exceed the similar indicator
of the continental countries all the time.
In the ‘Mediterranean’ country group the potential growth rate is only 0,2% in 2009.
During the critical years of the crisis the contribution of the labour factor to the growth de-
velops particularly unfavourably (negative). The investment ratio expressed as the share of
the GDP decreases by more than 5% during the crisis. The NAIRU increases by over 3%
and it keeps growing also in the recovery period. The TFP shows particularly low dynamics
– that is lagging behind the other two countries all the time. (It will slightly increase from
2011 onwards.) As regards the potential growth rate the ‘Mediterranean’ countries have
been not converging towards the more developed countries of the previous two groups since
2008.
The ‘catch-up’ countries have been converging persistently, but the potential growth
rate is decreasing also while the countries are getting out of the recession. The catch-up is
slowing and the labour input will be particularly unfavourable in 2013-2014. The structural
unemployment (especially in Poland) keeps decreasing and it hits a lower level than the con-
tinental countries after 2010. When the crisis hits the bottom the investment ratio decreases
about 3% and then it starts to increase again, but it won’t reach the previous ratio. The con-
tribution of the capital factor to the potential growth has been continuously decreasing since
2008. The dynamics of the TFP decreases until 2009 and later on it will be stabilized at an
annual rate of 1,3%.
In the ‘vulnerable’ countries the structural unemployment rate will increase by more
than 2%. The investment ratio will decrease by approximately 7% in two years. That’s why
the decrease in the potential growth dynamics is dramatic: from an annual 3,3% in 2008 to
1,2% in 2010! The contribution of the labour factor has been negative since 2008. The TFP
has hit the level of the “Mediterranean’ countries and from 2010 onwards it won’t even
reach it. The potential growth rate won’t reach the EU27’s average from 2012 onwards. This
group is highly characterized by the convergence crisis the catch-up will stop completely so
this group will lag behind the average development level of the EU27.
The following consequences offer themselves based on the analysis of the medium-
term growth processes of the country groups (the main factors of which are listed in table
no. 5).

422 Péter HALMAI, Viktória VÁSÁRY
Table no. 5 Potential growth and its factors in the country groups
Potential growth rate
Contribution to the potential growth
Labour Capital TFP
2010 2014 2010 2014 2010 2014 2010 2014
Continental 1,1 1,6 0,1 0,2 0,5 0,5 0,5 0,8
Reform coun-
tries 0,7 1,9 -0,3 0,2 0,3 0,7 0,7 1,0
Mediterranean 0,3 1,8 -0,2 0,6 0,3 0,5 0,2 0,6
Catch-up 3,0 2,2 0,2 -0,5 1,5 1,3 1,3 1,3
Vulnerable 1,2 1,5 -0,5 -0,3 1,6 1,6 0,1 0,3
EU27 0,9 1,8 -0,1 0,2 0,4 0,6 0,5 1,0
USA 1,4 2,1 0,0 0,2 0,5 0,9 0,9 1,0
Source: [own calculation]
- Summarising: the financial crisis might generate significant decrease in the poten-
tial output and it might have a remarkably negative impact on the labour (on the non-
demographic driving forces, such as the NAIRU), capital and TFP.
- As regards the potential growth the individual country groups show substantially
different trends. While the more developed countries and those being a member in the Euro
zone will get close to their previous growth performance, the potential growth rate will de-
crease in the Member States which are less developed than the average. Due to that the
growth dynamics of the country groups will converge. (But it cannot occur as regards the
level of the potential growth.) That is: a surprising convergence might develop in the growth
rate of the basically different country groups. (see figure no. 2)
Figure no. 3 Contribution of labour to the potential growth
Source:[ own calculation]
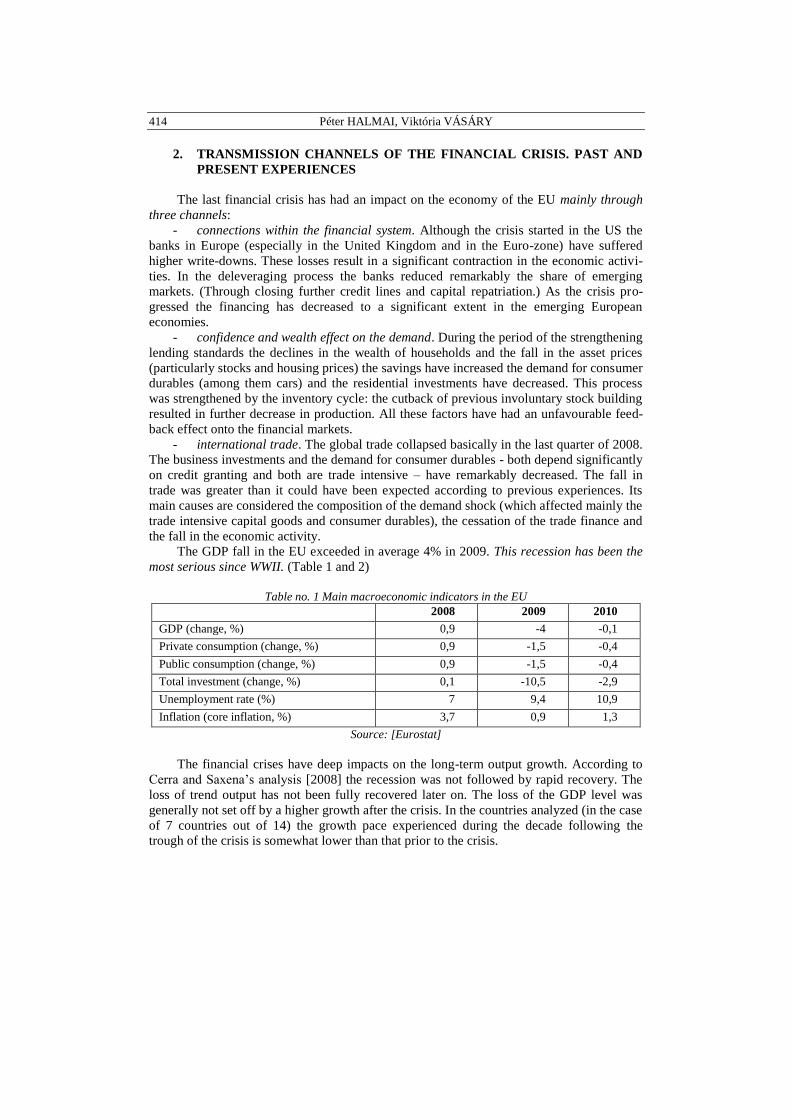
- The contribution of the individual factors to the potential growth is very different.
The structural unemployment (NAIRU) (Figure 6) will slightly decrease in the catch-up
countries, it won’t change in the continental group, it will increase by about 2% in the re-
form countries and it will increase by about 3% in the Mediterranean and the vulnerable
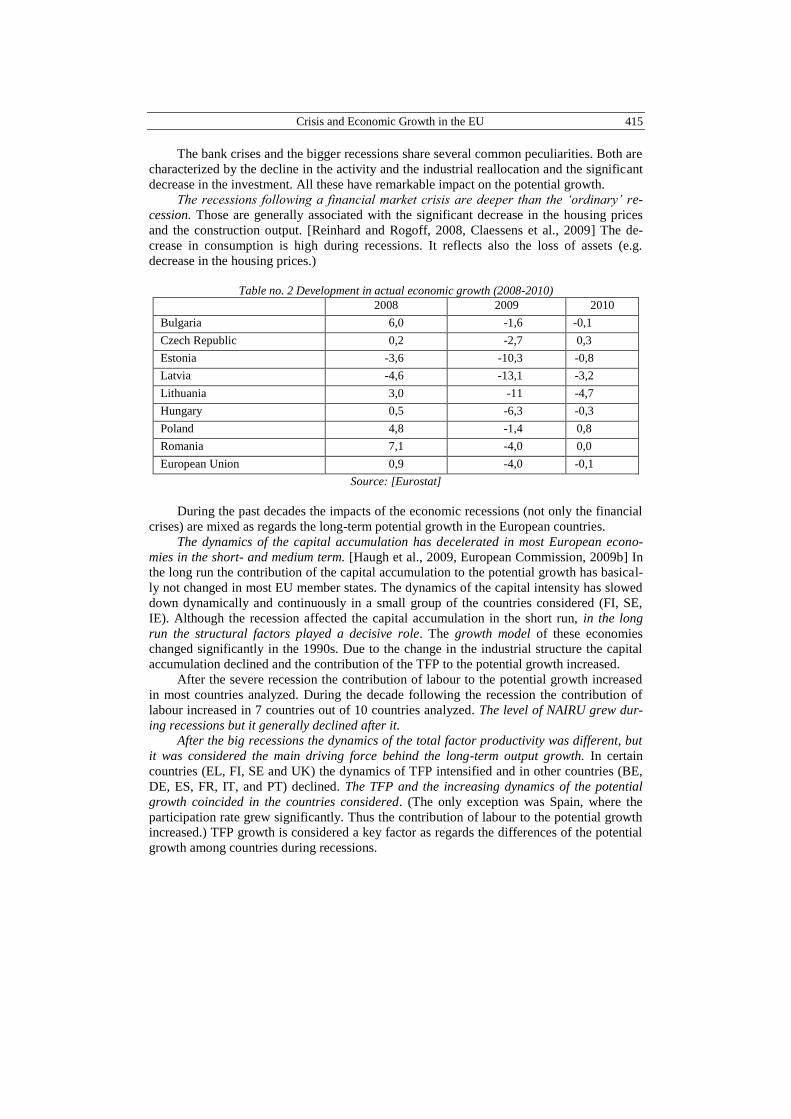
country groups. The investment ratio in the continental and the reform countries will be re-
covered by and large at the level preceding the crisis. It decreases by 2% in the catch-up
countries and by about 4% in the Mediterranean and vulnerable countries. The contribution
of the labour input is modest on the whole, while its contribution is negative in the case of

Crisis and Economic Growth in the EU 423
the catch-up and vulnerable countries. The contribution of the capital factor is the most
modest in the continental and Mediterranean countries. (See figure 4)The TFP as the deci-
sive factor of the potential growth in structural terms will grow after the crisis has hit the
bottom but it will remain at a low level on the whole (see figure no. 5). The most unfavour-
able dynamics of this structural component is to be expected in the Mediterranean and
vulnerable country groups.
- Unfavourable trends were to be experienced in the case of the Mediterranean and
vulnerable countries. (Figure no. 2-7) In the period analysed the catch up will practically
stop in the country group indicated.
Figure no. 4 Contribution of capital accumulation to the potential growth
Source: [own calculation]
Figure no. 5 Contribution of TFP to the potential growth
Source: [own calculation]
424 Péter HALMAI, Viktória VÁSÁRY
Figure no. 6 Contribution of NAIRU to the potential growth
Source: [own calculation]
Figure no. 7 Contribution of investment to the potential growth
Source: [own calculation]
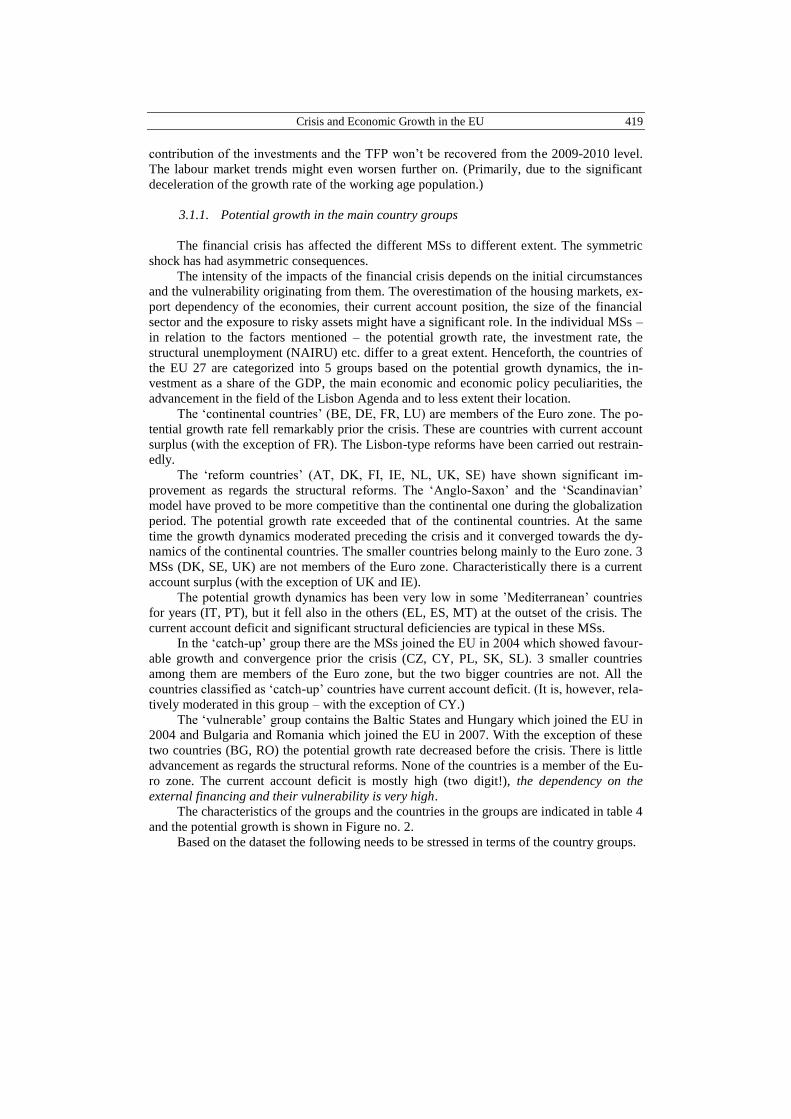
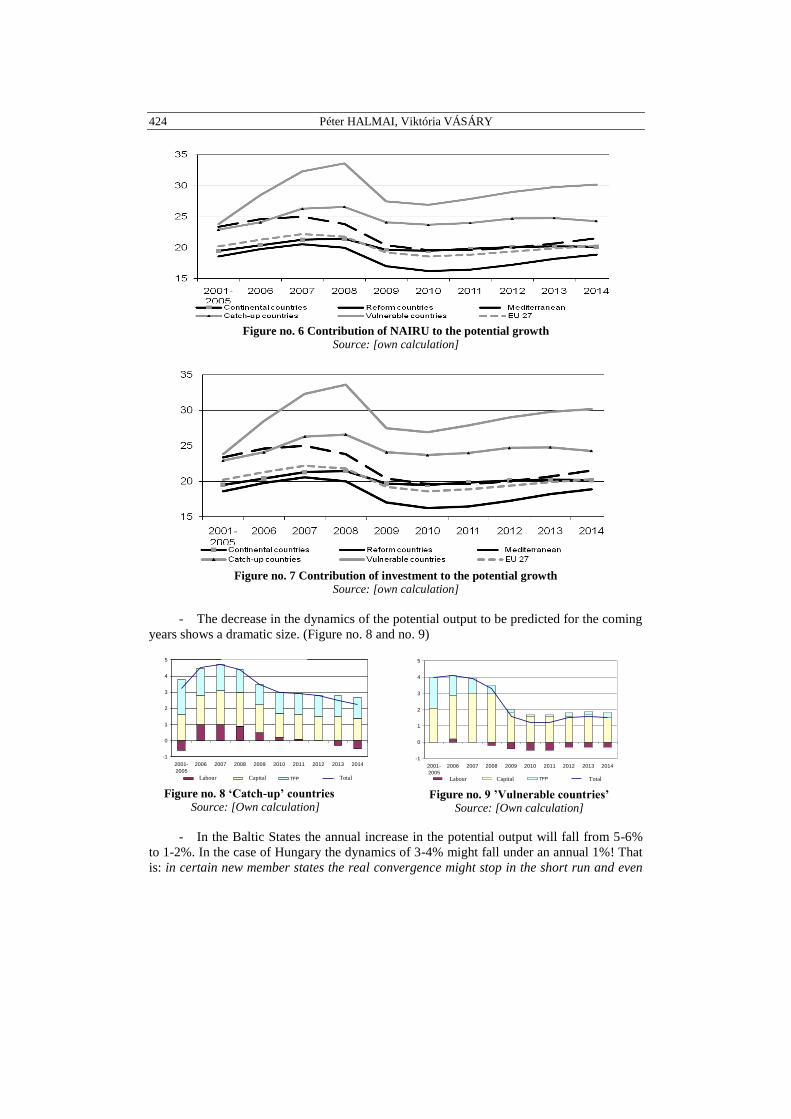
- The decrease in the dynamics of the potential output to be predicted for the coming
years shows a dramatic size. (Figure no. 8 and no. 9)
"Felzárkózó" országok
-1
0
1
2
3
4
5
2001-
2005
2006 2007 2008 2009 2010 2011 2012 2013 2014
Munka Tőke TFP Összesen
Capital Labour Total
Figure no. 8 ‘Catch-up’ countries
Source: [Own calculation]
"Sérülékeny" országok
-1
0
1
2
3
4
5
2001-
2005
2006 2007 2008 2009 2010 2011 2012 2013 2014
Munka Tőke TFP Összesen
Labour Capital Total
Figure no. 9 ’Vulnerable countries’
Source: [Own calculation]
- In the Baltic States the annual increase in the potential output will fall from 5-6%
to 1-2%. In the case of Hungary the dynamics of 3-4% might fall under an annual 1%! That
is: in certain new member states the real convergence might stop in the short run and even

Crisis and Economic Growth in the EU 425
divergence might occur compared to the more developed countries. This convergence crisis
might cause severe tensions in the medium-term period indicated both in the countries af-
fected and the EU.
3.1.1. Potential growth in the EU and the USA
In a broader context it is to state that the potential growth rate shows in general a
downward trend both in the USA and the Euro zone countries. (There is an exception in the
USA from the mid 1990s onwards.) The potential growth rate represented a downward trend
both in the Euro zone and the USA prior the financial crisis. The acceleration of the poten-
tial growth related to the ICT proved to be short-lived in the middle of the 1990s in the
USA. The potential growth rate decreased around 2000 once again.
The current crisis is linked with the repeated deterioration that occurred on the supply
side earlier both in the USA and the Euro zone. The potential growth rate was much lower
in 2008 than in 2000 (It is lower by 1,5% in the USA and by 0,8% in the Euro zone.) The
current financial crisis decreases these rates by 0,25-0,50% in 2009-2010. According to ta-
ble 6 the deterioration induced by the financial crisis might be relatively short-lived. The
main scenario of the medium-term simulation based on the production function indicates the
recovery of the potential growth rate (annual 2%) until 2013 in the USA. In the Euro zone
the potential growth rate might reach the level of 1,7%. The latter might even slightly ex-
ceed the dynamics measured in the years directly prior the crisis.
According to the analyses carried out using the production function method, the finan-
cial crisis might strengthen the models that differ between the Euro zone and the USA as
regards the contribution of the growth factors to be experienced. The contribution of labour
exceeds that of the USA further on, while in the latter the increase in the investment is ex-
pected to be significantly stronger from 2011 onwards.
Table no. 6 Potential growth in the EU, USA and Japan
Potential
growth
(As percentage
of the annual
change )
Contribution to the
growth
Labour Capital TFP
NAIRU
(As % of
the labour
force)
Investment
ratio
(as percent-
age of the
potential
output)
EU 27
2001-
2005
2,0 0,2 0,8 1,0 8,6 20,2
2006 1,8 0,4 0,9 0,6 8,2 21,3
2007 1,8 0,4 0,9 0,5 8,1 22,2
2008 1,5 0,2 0,9 0,4 8,2 21,8
2009 0,8 -0,1 0,5 0,5 8,6 19,2
2010 0,9 -0,1 0,4 0,5 8,9 18,6
2011 1,1 0,0 0,5 0,7 9,2 18,9
2012 1,6 0,2 0,5 0,8 9,3 19,4
2013 1,7 0,2 0,6 0,9 9,4 19,9
2014 1,8 0,2 0,6 1,0 9,4 20,3
USA
2001-
2005
2,5 0,2 1,1 1,2 4,9 19,2

426 Péter HALMAI, Viktória VÁSÁRY
Potential
growth
(As percentage
of the annual
change )
Contribution to the
growth
Labour Capital TFP
NAIRU
(As % of
the labour
force)
Investment
ratio
(as percent-
age of the
potential
output)
2006 2,4 0,2 1,2 1,0 5,6 19,8
2007 2,1 0,2 1,0 0,9 5,9 19,2
2008 1,8 0,1 0,8 0,9 6,3 18,0
2009 1,1 -0,1 0,4 0,9 7,0 15,2
2010 1,4 0,0 0,5 0,9 7,4 15,7
2011 1,7 0,3 0,5 0,9 7,6 16,1
2012 1,8 0,1 0,7 1,0 7,8 17,3
2013 2,0 0,2 0,8 1,0 7,8 18,2
2014 2,1 0,2 0,9 1,0 7,9 18,3
Japan
2001-
2005
0,8 -0,6 0,3 1,1 4,2 23,4
2006 0,7 -0,5 0,3 0,9 4,6 23,4
2007 0,6 -0,5 0,3 0,8 4,8 23,5
2008 0,7 -0,3 0,2 0,8 4,9 22,1
2009 0,3 -0,3 -0,1 0,7 5,1 19,3
2010 0,2 -0,5 -0,1 0,7 5,3 19,3
2011 1,0 0,3 -0,1 0,8 5,3 19,1
2012 -0,1 -0,8 -0,1 0,8 5,4 18,9
2013 0,0 -0,8 -0,1 0,9 5,4 18,9
2014 0,0 -0,8 -0,1 0,9 5,4 19,1
Source: [own compilation based on the OGWG database]
Despite the ICT bubble burst the TFP growth is still twice as high as in the Euro zone.
In the USA the contribution of labour to the potential growth was one sixth of the 1990’s
level before the crisis. At the same time in the Euro zone in 2007 the contribution of labour
to the growth was nearly twice as high as in the USA. Due to the crisis the contribution of
the labour is expected to be moderated in both regions at the outset. The annual contribution
of the labour to the potential growth will be 0,4% in the medium term (2012-2014) in the
Euro zone, while it will be only 0,1-0,2% in the USA. The contribution of the capital accu-
mulation is expected to show convergence at a level of 0,5% in 2009-2010. At the same
time the investment will decrease by 10% in both regions. In the medium-term (i.e. until
2014) in the USA the investment dynamics will reach the rate that has been prevailing from
1990’s on and has been exceeding the European rate.
The annual contribution of the TFP to the potential growth decreased from the 1,5%
prevailing at the end of the 1990s to approximately 0,8% in 2007-2008. But this dynamics
was still more than twice as high as the rate in the Euro zone. In both regions the TFP con-
tribution will be moderated due to the financial crisis in 2009-2010. These contribution rates
return to the level prior the crisis. According to the forecast the contribution of the TFP to
the potential growth in the USA will be significantly higher during the period from 2009 to
2013 than in the Euro zone. In order to explain why the performance of the USA is continu-
ously higher there is a need to analyse the key driving forces of the tangible and intangible
investments.

Crisis and Economic Growth in the EU 427
4. EROSION OF THE EUROPEAN GROWTH POTENTIAL.
ALTERNATIVE LONG-TERM SCENARIOS
Due to the severe structural productivity problems of the EU-15 and the insufficient
adjustment to the globalization a permanent and significant decline in the potential growth
rate is to be expected. [See European Commission, 2006, Carone et al, 2006, Halmai, 2007,
etc.) The unfavourable investment environment promotes a higher level of capital outflow
and a notable increase in the share of imported products and services.
Applying the production function approach the longer-term simulations indicate that
the potential growth rate both in the EU-15 and the EU-27 falls. ii [European Commission,
2006, 2008b, 2009b] According to the base scenario This reduction will be continuous,
moving from an annual 2.4% in 2004-2020 to an average 1.7% in 2021-2030 and then down
to 1.3% in 2031-2060.
The forecast decline in the potential rate of growth is far greater in the EU-10 and EU-
12 countries than in the EU-15 statesiii
. Output in the EU-12 between 2007 and 2030 will
expand far more rapidly than in the EU-15 countries, i.e. the convergence process will con-
tinue. But as time passes the pace of convergence will slow down, and then stop after 2030.
(Based on the simulations, annual GDP in the EU-10 will grow by only 0.6% in 2041-2060,
compared to a figure of 1.5% for the EU-15 countries.iv That is there is a switch from con-
vergence to divergence, see table 7)
In the new MSs the potential growth rate will decline at a greater pace, thus the real
convergence will stop from 2030 onwards and even a moderate divergence from the EU-15
might occur. It can be explained by the following factors: on the one hand the productivity
growth rate might be rebalanced by 2050, on the other hand the demographic simulation are
significantly more unfavourable in the NMSs than in the old ones.
The long-term paths indicating the erosion of the European growth potential could be
considered rather optimistic based on the analysis of the impacts of the current crisis on the
potential growth.
In order to calculate the impacts of the current crisis alternative scenarios need to be
set up. In view of the large uncertainty regarding the length of the slump in economic activi-
ty the case of the temporary shock and the case of the permanent shock needs to be defined.
Two temporary shock scenarios can be described: a 'lost decade' and a 'rebound' sce-
nario.v
Table no. 7 Potential GDP growth rate (annual average as percentage)
2007-2020 2021-2030 2031-2040 2041-2050 2051-2060 2007-2060
CZ 4,0 1,7 1,1 0,8 0,9 1,8
HU 2,9 2,1 1,5 0,9 0,9 1,7
Pl 4,3 2,3 1,0 0,3 0,4 1,7
Sl 3,7 1,4 0,8 0,7 1,0 1,6
SK 5,3 2,3 0,9 0,3 0,4 2,0
RO 4,9 2,1 1,6 0,6 0,4 2,0
EU- 27 2,4 1,7 1,4 1,3 1,3 1,7
EU- 15 2,2 1,7 1,5 1,5 1,5 1,7
EU- 10 4,2 2,1 1,1 0,6 0,6 1,8
Source: [European Commission, 2008b]

428 Péter HALMAI, Viktória VÁSÁRY
Those figures are much lower than the baseline projection for the period until 2014.
Therefore the annual potential GDP growth in the EU-27 included in the latest analysis car-
ried out by the European Commission is lower by around -0,9 % in both scenarios than in
the baseline scenario.
The potential growth components will then converge to reach the growth rate projected
in the baseline:
- in the 'lost decade' scenario, labour productivity is assumed to reach the baseline
growth rate in 2020. Labour input is assumed to reach the baseline growth rate in 2020, too.
- in the 'total rebound' scenario, labour productivity and labour input are expected to
reach the baseline level in 2020.
Given the current economic crisis and a very considerable degree of uncertainty, the
impact of a permanently worse situation of the growth potential can also be analyzed. This
is the ‘lasting and increasing loss’ (or 'permanent shock') scenario.vi
According to the ‘lasting and increasing loss’ scenario from 2014 to 2020 the labour
productivity growth and labour input growth will reach the baseline figures, but the unem-
ployment rate will be permanently 1% higher than in the baseline from 2020 onwards; and
the labour productivity growth rate will be 0,25 % lower than that from 2020 onwards.
The 'lost decade scenario' causes a reduction in the per-capita GDP level by the end of
the period examined compared with the baseline. It implies a lower expected potential
growth up to 2020. This period is 'lost' in terms of accumulated wealth creation. The loss in
GDP per capita in the EU-27 is around 8% in 2020. This scenario carries over the loss in the
rest of the projection period. The growth projection remains broadly unchanged between
2020 and 2060. In the ' total rebound' scenario, the GDP per capita by 2060 is the same as
in the baseline (The deterioration relative to the baseline up to 2014 is offset by the im-
provement between 2015 and 2020). [European Commission, 2009b]
A more marked reduction in the GDP per capita level occurs in the ‘lasting and in-
creasing loss’ scenario. In that case the GDP per capita is 10% lower than in the baseline in
2020, 14% lower in 2040 and 18% lower in 2060. It means that this scenario reflects signifi-
cant lower growth throughout the projection period than it was assumed before. (The growth
path of the different variables is summarized by figure no. 10)
0,00
0,50
1,00
1,50
2,00
2,50
3,00
3,50
4,00
2007 2011 2015 2019 2023 2027 2031 2035 2039 2043 2047 2051 2055 2059
Alapvonal "Feléledés" "Elveszett évtized" Állandósult sokk
baseline rebound lost decade permanent shock
Figure no. 10 Potential GDP growth under different shocks (annual growth rate)
Source: [European Commission, 2009b]

Crisis and Economic Growth in the EU 429
The permanent shocks would result in the complete collapse of the growth and catch-
up models in Europe. In the long term one fifth of the GDP would fall out and the chances
of real convergence would deteriorate dramatically, though differently country by country.
8. CONCLUSIONS
The main conclusions are summarized as follows:
1. Applying the supply side approach the recession has an impact on growth through
three different channels: capital accumulation, labour input and total factor productivity.
The probability of the lasting impacts on the potential growth is much higher as regards the
recent crisis than it was in the case of previous recessions. It has to be particularly highlight-
ed, that the risk related behaviour might change permanently.
2. The present global crisis resulted in the deepest recession we have seen since WWII.
New risks appeared. The new MSs have been experiencing a continuous fall in potential
growth since 2008. The potential decrease in the dynamics of the potential growth in the
medium term is of dramatic size in certain new NMSs. In these countries real convergence
might stop in the short run and it might even come to a divergence. We call it ‘convergence
crisis’.
As regards the potential growth and the contribution of the individual factors the most
unfavourable trends were to be experienced in the case of the Mediterranean and vulnerable
countries. In the period analysed the catch up will practically stop in the country group indi-
cated.
3. According to the growth accounting analysis based on the production function the
contribution of the individual factors to the potential growth is very different. The structural
unemployment (NAIRU) is somewhat decreasing in the ‘catch-up’ countries, it doesn’t
change in the ‘continental’ country-group, but it increases significantly in the other countries
particularly in the ‘Mediterranean’ and the ‘vulnerable’ country-group. The investment rate
is decreasing in the country-groups consisting of the less developed countries than the EU
average, first of all in the ‘Mediterranean’ and the ‘vulnerable’ country-groups. The contri-
bution of the labour factor is moderate. (It is negative in the case of the ‘catch-up’ and
‘vulnerable’ countries. The contribution of the capital to the growth is the most moderate in
the ‘continental’ and the ‘Mediterranean’ countries. The dynamics of TFP - as the decisive
structural factor of the potential growth - is expected to be the lowest in the ‘Mediterranean’
and ‘vulnerable’ country-groups.
4. It is important to compare the European and the US growth model. In the long run
the potential growth rate shows a declining trend both in the USA and the Euro zone coun-
tries. The TFP growth rate is much higher in the USA from the middle of the 1990’s
onwards than in the Euro zone. This higher dynamics is expected to last also in the medium
term.
5. Catch-up and convergence is based on the economic growth. In relation with chal-
lenges of the globalisation and competitiveness problems of the European Union’s economy
- the current average annual rate of potential growth in the European Union of 2.4% could
fall to half this level on average in the coming decades. The potential growth rate will be cut
in half, despite the prognosis containing relatively benign development in labour productivi-
ty. This may also indicate adverse demographic changes. But its decisive structural element
is the decreasing dynamics of the total factor productivity.
430 Péter HALMAI, Viktória VÁSÁRY
The risk of shock repetition is high. These changes project further erosion of the
growth potential in Europe. That is: due to the crisis and its potential long-term impacts
there might be scenarios which are more unfavourable than those indicating decreasing po-
tential growth in the previous point. The trajectory of the permanent shocks threatens with
the complete collapse of the European growth and catch-up model.
References
[1] Blanchard, O., Summers, L.H., Hysteresis in Unemployment, NBER Working Papers No. 2035.
National Bureau of Economic Research, 1989
[2] Carone, G., Denis, C., Mc Morrow, K., Mourre, G., Röger, W., Long-term labour productivity
and GDP projections for the EU25 Member States: a production function framework, European
Commission, Economic Papers No. 253, European Commission, Directorate General for Eco-
nomic and Financial Affairs, 2006, at
http://ec.europa.eu/economy_finance/publications/economic_papers/economicpapers253_en.ht
m
[3] Cerra, V., Saxena, S.C., Growth dynamics: the myth of economic recovery, in American Eco-
nomic Review, Vol. 98, No. 1, 2008
[4] Chatterji, M., Convergence clubs and endogenous growth, in Oxford Review of Economic Policy
8(4), pp. 57-69, 1992
[5] D'Auria, F. , Denis, C. , Havik, K. , Mc Morrow, K., Planas, C., Raciborski R., Röger, W.,
Rossi, A., The production function methodology for calculating potential growth rates and
output gaps, Economic Papers No. 420, July 2010
[6] Denis, C., Mc Morrow, K., Röger W., Globalisation: Trends, Issues and Macro Implications for
the EU, European Commission, Economic Papers No. 254, European Commission, Directorate
General for Economic and Financial Affairs, 2006, at
http://ec.europa.eu/economy_finance/publications/economic_papers/ economicpa-
pers254_en.htm
[7] Denis, C., Grenouilleau, D., Mc Morrow, K., Röger, W., Calculating potential growth and out-
put gaps - a revised production function approach, Economic Papers No. 247, European
Commission, Directorate General for Economic and Financial Affairs, 2006
[8] Denis, C., Mc Morrow, K., Röger, W., Production function approach to calculating potential
growth and output gaps - estimates for the EU Member States and the US, Economic Papers No.
176, European Commission, Directorate General for Economic and Financial Affairs, 2002
[9] Durlauf, S., Quah, D., The new empirics of economic growth, NBER Working Paper No 6422,
2002
[10] EC, The impact of ageing on public expenditure: projections for the EU25 Member States on
pensions, healthcare, long-term care, education and unemployment transfers (2004-50), Europe-
an Economy, Special Report No. 1, DG ECFIN, Brussels, 2006
[11] EC, The 2009 Ageing Report: Underlying Assumptions and Projections Methodologies for
EU27 Member States (2007-2060), European Economy 7. DG ECFIN, Brussels, 2008
[12] EC, Economic forecast Spring 2009, European Economy 3, DG ECFIN, Brussels, 2009a
[13] EC, The 2009 Ageing Report: Economic and budgetary projections for the EU-27 Member
States (2008-2060), European Economy 2, DG ECFIN, Brussels, 2009b
[14] EC, Five years of an enlarged EU Economic achievements and challenges, European Economy,
No. 1, Economic and Financial Affairs DG, Brussels, 2009c
[15] EC, Impact of the current economic and financial crisis on potential output, European Economy.
Occasional Papers. 49. June 2009. Economic and Financial Affairs DG, Brussels, 2009d
[16] EC, Economic crisis in Europe: causes, consequences and responses, European Econom, no.. 7,
September 2009, 103pp, Economic and Financial Affairs DG, Brussels, 2009e
[17] EC, Economic Forecast Spring 2010, European Economy 2/2010

Crisis and Economic Growth in the EU 431
[18] Furceri, D., Mourougane,. A., The effect of financial crises on potential output: new empirical
evidence from OECD coutnries, ECO/WKP No. 40, 2009
[19] Halmai, P., Convergence and growth, Development and Finance, 2007/3
[20] Haugh, D., Ollivaud, P., Turner, D., The macroeconomic consequences of banking crisis in
OECD countries, OECD Working Paper No. 683, 2009
[21] OECS, Economic Policy Reforms, Going for Growth, Structural Policy, Indicators, Priorities
and Analysis, 2009
[22] Mankiw, G., Romer, D., Weil D., A Contribution to the Empirics of Economic Growth. Quar-
terly Journal of Economics, 1992
[23] Ratto, M., Roeger, W., in’t Veld, J., QUEST III - An estimated DSGE model of the Euro Area
with fiscal and monetary policy, European Economy Economic Paper No. 335, 2008
[24] Reinhart, C.M., Rogoff, K.S., The aftermath of financial crisis, NBER Working Paper No.
14656, 2009
[25] Reinhart, C.M., After the fall, NBER Working Paper no. 16334, September, 2010
[26] Reinhart, C.M., Rogoff, K. S., Growth in a time of debt, American Economic Review, Vol. 100, No. 2,
2010
[27] Rivera-Batiz, L.A., Romer, P., Economic Integration and Endogenous Growth, The Quarterly
Journal of Economics 106, pp. 531-555, 1991
1. The analysis is based on the database calculated according to the production function
methodology of the EPC Output Gap Working Group (OGWG). The data were grouped and
processed by the authors.
2. In this section we used the quality analysis - based on the production functions - that was carried
out for the European Commission. (See European Commission, 2006, 2008b, 2009b; Carone et
al, 2006; Denis et al 2006).
3. EU-10 covers the MSs which joined the EU in 2004. The trends indicated are similar also
considering the EU-12 – i.e. the country group containing Bulgaria and Romania.
4. The average growth rate in the EU-12 is expected to be 2.6% in 2020, 1.8% in 2030, 1.2% in
2035, 0.8% in 2040, 0.6% in 2045 and 0.4% in 2050!
5. The analysis is based on the database applying the production function method of the EPC Out
put Gap Working Group and the database of the Ageing Report.
6. It requires sensitivity scenarios embedded in the long-term projection exercise.
Notes