Embed Size (px)
Citation preview

NASA/TM_1999-208799
Crew Factors in Flight Operations XI: A Survey
of Fatigue Factors in Regional Airline Operations
Elizabeth L. Co, Kevin B. Gregory, Julie M. Johnson, and Mark R. Rosekind
Ames Research Center, Moffett Field, California
k.j
October 1999
https://ntrs.nasa.gov/search.jsp?R=20000032967 2020-03-24T10:54:15+00:00Z
The NASA STI Program Office ... in Profile
ASA has been dedicated to
teronautics and space_cientific and Technical
ogram Office plays a key
\ maintain this important
CONFERENCE PUBLICATION.
Collected papers from scientific and
technical conferences, symposia,
seminars, or other meetings sponsored
or co-sponsored by NASA.
ram Office is operated bynter, the lead center ford technical information.
ram Office provides access
abase, the largest
tical and space science STIgram Office is alsomechanism for
alts of its research and
s. These results are
n the NASA STI Report
s the following report
'UBLICATION. Reports of
lrch or a major significant
:h that present the resultsams and include extensive
:al analysis. Includes
significant scientific andnd information deemed to
g reference value. NASA_eer-reviewed formal
)ers, but having less
ions on manuscript length
raphic presentations.
4_EMORANDUM.
._chnical findings that are
)f specialized interest, e.g.,
ports, working papers, andhat contain minimal
s not contain extensive
', REPORT. Scientific and
gs by NASA-sponsored
grantees.
SPECIAL PUBLICATION. Scientific,
technical, or historical information from
NASA programs, projects, and missions,
often concerned with subjects having
substantial public interest.
TECHNICAL TRANSLATION.
English-language translations of foreignscientific and technical material
pertinent to NASA's mission.
Specialized services that complement the STI
Program Office's diverse offerings include
creating custom thesauri, building customized
databases, organizing and publishing research
results ... even providing videos.
For more information about the NASA STI
Program Office, see the following:
• Access the NASA STI Program Home
Page at http://www.sti.nasa.gov
• E-mail your question via the Internet to
• Fax your question to the NASA STI
Help Desk at (301) 621-0134
• Telephone the NASA STI Help Desk at(301) 621-0390
Write to:
NASA STI Help Desk
NASA Center for AeroSpaceInformation
7121 Standard Drive
Hanover, MD 21076-1320
V
V
,ll_
i
Since its founding,/'the advancement of
science. The NASA
Information (STI) P
part in helping NASrole.
The NASA STI Pro_
Langley Research C_NASA's scientific a:
The NASA STI Pro_to the NASA STI Da
collection of aeronat
in the world. The Pr4
NASA's institutiona
disseminating the re_,
development activiti_
published by NASASeries, which inclu&
types:
• TECHNICAL i
completed rese
phase of reseat
of NASA progdata or theoret!
compilations otechnical data
be of continuir
counterpart of
professional pa
stringent limit._
and extent of
• TECHNICAL ]
Scientific and 1
preliminary orquick release r_
bibliographiesannotation. Do,
analysis.
• CONTRACTO_
technical findil
contractors and

NASA/TMD1999-208799
Crew Factors in Flight Operations Xh A Survey
of Fatigue Factors in Regional Airline Operations
Elizabeth L. Co
San Jose State University Foundation, San Jose, California
Kevin B. Gregory
Sterling Software, Inc., Palo Alto, California
Julie M. Johnson
San Jose State University Foundation, San Jose, California
Mark R. Rosekind
Ames Research Center, Moffett Field, California
- j
",,...../
National Aeronautics and
Space Administration
Ames Research Center
Moffett Field, Califomia94035-i000
October 1999

Acknowledgment
This research, conducted by NASA Ames Research Center, was requested and sponsored by the
Federal Aviation Administration's Office of Aviation Research, Human Factors Division.
V
NASA Center for AeroSpace Information
7121 Standard Drive
Hanover, MD 21076-1320
301-621-0390
Available from:
National Technical Information Service
5285 Port Royal Road
Springfield, VA 22161703-605-6000 V
1.0 Operational Overview
This report on fatigue factors in regional air-
line operations is the eleventh in a series on the
physiological effects of flight operations on
flight crews, and on the operational signifi-cance of these effects.
Regional airline operations, a growing segmentof the commercial air transport industry,
depend on the human operator to maintain
high levels of flight safety. The specific
operational requirements of regional opera-tions create unique challenges regarding
human fatigue. Regulatory differences, sched-
uling practices, and other factors have been
suggested anecdotally as potential fatiguefactors for regional operators. This survey
study was conducted to identify operationalfactors that may contribute to fatigue in
regional airline operations.
A retrospective survey of 119-questions wasdisseminated to pilots from 26 regional
carders. The survey addressed 7 main topics:
general demographics, sleep at home, flying,duty, fatigue, and work environment, with a
separate 3-question section for management
pilots that focused on scheduling. Subjectswere 1,424 regional flight crewmembers who
voluntarily and anonymously completed the
survey.
Overall, crewmembers identified fatigue as an
important consideration in regional airline
operations, with 89% rating it a moderate or
serious concern. Further, 88% reported that
fatigue was a common occurrence in regional
operations, and 92% reported that when
fatigue occurs, it represents a moderate or
serious safety issue. However, 86% reported
that they received no training from their
companies that addressed fatigue issues.
Fatigue factors identified by respondents
included multiple flight segments, scheduling
considerations, varying regulations, and others.
The short-distance nature of regional
operations results in multiple flight segmentsrather than the one or two long segments
common in long-haul operations. The two
most commonly cited fatigue factors regarded
flying multiple (more than four) segments.
Scheduling factors identified by crewsaccounted for nine of the ten most common
recommendations that crewmembers made to
reduce fatigue in regional operations. The
scheduling factors included: long duty days,
continuous-duty overnights, reserve status,
early duty report times, and the amount of
time between flight legs. Many of these sched-
uling practices are unique to regional opera-
tions. Another specific challenge is that
regional airlines operate under various parts ofthe Federal Aviation Regulations (FARs),
including Part 135, which is the most common,Part 121, the Part under which major airlines
operate, and Part 91 for General Aviation.
Differing requirements among these regula-
tions were cited as contributing to fatigue in
regional operations. Other factors identified
were: the flight deck environment, including
high temperatures and noise; automation,
including the lack of autopilot and other
equipment; and diet, including dehydration
and the availability of food.
The data from flight crewmembers suggestedcertain recommendations, including education
of industry personnel about fatigue issues, and
examination of scheduling practices. Educa-
tion plays a critical role in any effort to
address fatigue in operations. Physiological
background information and practical strate-
gies for fatigue management are two crucial
topics. Educating individuals in every part of
the system would maximize the benefit of this
activity. Analyzing scheduling practices and
identifying potential improvements may resultin reduced fatigue as well as other benefits to
operations.
2.0 Introduction
Modern commercial aviation requires 24-hour
operations. While sophisticated technology isutilized in aircraft, air traffic control, mainte-
nance, and other parts of the system, the
human operator remains central to all of these
activities. Therefore, human physiological
capabilitiesandlimitations are critical factors
in maintaining safety and productivity in the
air transport industry.
Regional airlines play a specific and important
role in commercial aviation. They provide
service to many airports that major airlines donot serve, and connect these locations to main
routes. In the current industry structure, major
airlines concentrate operations at large "hub"
airports, and regionals complete the system by
linking smaller airports to the hubs. As the
name implies, these airlines generally operate
in one region of the country, increasing effi-
•ciency by limiting routes. This strategy results
in a class of air transport operators that fly
shorter distances, smaller aircraft, and more
flight segments, carrying fewer passengers. In
1998, 102 regional airlines enplaned 66.1
million revenue passengers compared to the
577.3 million enplaned by 36 large
commercial airlines, most by the 10 majorairlines (ref. 1).
However, regional operations have showndramatic growth in the last 20 years. Passenger
enplanements, average seating capacity, and
trip distance have increased steadily since thelate 1970's, and industry projections forecast
that they will continue to grow (ref. 2). As
regional airlines carry more passengers andplay an increasingly important role in com-
mercial air transportation, the industry and the
flying public may focus more attention on the
safety of these operations.
While much information now exists concern-
ing safety issues in other commercial flight
environments (e.g., refs. 3-5), relatively few
empirical data are available for regional
operations, which may require unique consid-
eration. In particular, data on fatigue in
regional operations have been largely anec-
dotal. The objective of this investigation was to
identify operationally significant factors that
contribute to fatigue or impede alertness in
regional operations.
2
2.1 Physiological Background
Fatigue, alertness, and performance are
physiologically determined. A basic under-
standing of two physiological factors--sleep
and the internal body clock (called the cir-
cadian clock)---are necessary background
information. Together, sleep and circadian
rhythms play a fundamental role in determin-
ing fatigue and alertness at a given time.
Therefore, factors that affect sleep or the
circadian system have the potential to affect
fatigue, alermess, and performance as well.
Sleep is a vital physiological need. Most indi-
viduals require about 8 hours of sleep each
day. When a person loses sleep, essentially all
aspects of functioning suffer, including alert-
ness, performance, and mood. Sleep loss can
degrade cognitive processes, vigilance, physi-cal coordination, judgment and decision
making, communication, outlook, and count-
less other parameters (refs. 6-7). In fact,
research has demonstrated that 1 hour of sleep
loss can affect waking alertness, and that 2
hours of sleep loss can significantly affect
both alermess and performance (ref. 8). Sleep
loss, over time, accumulates into a sleep debt,
which can exacerbate the effects of acute sleeploss.
Sleep is a complex process, influenced bymany factors. The quantity and quality of
sleep an individual obtains at a given time
depend on prior sleep and wakefulness, time
of day, age, environment, psychophysiologicalstate, and the individual's innate and learned
ability to sleep. Further complicating the mat-ter, these factors interact with one another.
The basic concept behind the influence of prior
sleep/wake patterns is a simple one: when indi-viduals don't sleep, they become sleepy. That
is, a homeostatic drive to sleep builds from the
time of awakening until the next sleep, just as
the drive to eat (hunger)buildsSetween one
meal and the next. The longer the period of
time since sleep, the stronger the drive to sleep.
Conversely, the homeostatic drive is weaker
shortlyaftersleep.A very longperiodof con-tinuouswakefulnesscancreateanintensesleepdriveandassociatedsleepiness.Whenthedrivefor sleepbecomesstrongenough,it cansendthebrainandbodyintospontaneoussleep,regardlessof whethersleepis appropriateorsafeunderthecircumstances.
Almost every aspect of sleep changes with age.
In general, the quantity and quality of sleep
decrease with age. While older people do not
necessarily need less sleep, they tend to obtain
less sleep at night, have more nocturnal awak-
enings, truncate sleep in the morning, and nap
more during the day. Therefore, the age of
crewmembers may affect their experience of
fatigue and alertness.
The sleep environment also plays a large role
in the quantity and quality of sleep. Dark,
quiet surroundings and a comfortable tem-
perature and sleep surface are key elements
for a sleep-conducive environment (ref. 9).
Because individual preferences differ widely,
the ability to adjust the environment for com-
fort is an important consideration,Even with an ideal sleep environment, sleep
may be difficult due to stress, thoughts, or
worries. Long-haul commercial pilots identi-
fied thoughts and worries as one of the topfive items that interfered with their sleep in on-
board crew rest facilities (ref. 10).
The ability to sleep also varies with the cir-
cadian rhythm of sleepiness. The term
"circadian rhythm" (from Latin circa
"about" and dies "day") refers to the cycle
of a physiological function that repeats
approximately every 24 hours. Virtually all
functions of the body (e.g., sleep/wake, diges-
tion, immune function) are controlled by
circadian rhythms, which are regulated by the
circadian clock in the brain. Generally, the
body is programmed to sleep at night and to
be awake during the day. Additionally,
humans have two times of maximal sleepiness
and two times of peak alertness each day. At
approximately 3-5 a.m. and 3-5 p.m., sleepi-ness peaks, and sleep may come more easily.
These times correspond to lower levels of
alertness and performance. Conversely, at
about 9-11 a.m. and 9-11 p.m., alertness and
•performance peak, and it may be difficult to
obtain sleep, even if sleep-deprived. Time-of-
day fluctuations in performance have beenobserved in several unrelated operational set-
tings (ref. 11).
The circadian system cannot adjust immedi-
ately to changes in the work/rest schedule or
time zone. When such changes occur, the cir-
cadian system is desynchronized from the
environment for a period of time, and individ-
ual rhythms are out of sync with one another.
Circadian disruption caused by irregularschedules or time zone changes can lead to
sleep loss, performance decrements, worsened
mood, digestive upset, and other symptoms. Itcan take from days to weeks for the circadian
clock to resychronize completely.
Clearly, a range of physiological factors can
influence fatigue, alertness, and performance.
While an attempt was made to distinguish
fatigue factors from one another in this studyfor the purpose of clarity, they are not com-
pletely independent. Further, beyond the intri-
cacies of physiology, the complexity of flight
operations precludes accounting for eachdifference in circumstance. However, while
there is no simple solution to these issues, bymanaging fatigue and alertness in regional
flight operations, the industry takes an impor-
tant step in maintaining or improving the
safety margin. Identifying the specific chal-
lenges that face regional pilots will inform anyefforts to address fatigue in this particular
flight environment.
2.2 Regional Airline Regulation:Parts 121 and 135
Different regional airline operations are sub-
ject to different sections of the Federal Avia-
tion Regulations (FARs). The number of
passenger seats in the aircraft flown determine
which FAR Part applies: Part 135 regulatesaircraft with 30 or fewer seats and Part 121
those with more than 30 seats. While a
3

majority of regional airlines operations are
regulated by Part 135, many fall under Part121, the set of rules that governs major
airlines, which is more stringent in certainareas. An airline that flies aircraft with 30 seats
(or fewer) as well as aircraft with more than 30
seats may conduct operations under bothParts. Prominent differences between the
requirements of Parts 121 and 135 include
airport certification, dispatch personnel, flight
attendants, and flight time and rest
requirements (ref. 12).
The National Transportation Safety Board hasexamined commuter' airline safety and has
recommended that all scheduled passengerservice in aircraft with 20 or more seats (those
with 10 or more seats when possible), be con-
ducted under the same regulations as major
airlines (ref. 12). The Board based these rec-
ommendations on site-surveys of a representa-
tive sample of commuter air carriers and their
pilots, and a public forum on commuter airsafety. The Board cited two main reasonsbehind the recommendations:
1) regional/commuter airlines become
increasingly like major airlines in the passen-
gers they serve and in the size and sophistica-tion of aircraft, and
2) to the public, what used to be a clear dis-tinction between commuter airlines (under Part
135) and majors (under Part 121) has become
unclear, if not transparent. When commuter
airlines began operating in markets previously
served by major airlines, many arranged to
share flight codes (numbers that identify
flights in airline reservation systems) with
major airlines. While code-sharing can sim-
plify reservations, passengers may infer that
the major airline owns and operates the com-
muter, which may or may not be the case; thus
the major may lend its reputation to an unre-lated commuter airline. The Safety Board
determined that, because passengers may not
'While the terms "commuter" and "regional" are often
used interchangeably, the report defined "commuter" as
those operations conducted under Part 135.
4
distinguish between majors and commuters,
both should meet the same requirements.
In its report, the NTSB identified several spe-cific issues that arise from differences between
Parts 121 and 135. One conspicuous exampleis that the two FAR Parts set different limits on
flight duty time per week, month, and year, an
issue that will be addressed in the following
section within the context of scheduling prac-
tices. Another consideration is that airports
serving Part 135 operators may meet less
stringent standards than those serving Part 121
carders, potentially resulting in lower levels of
airport safety 2. Smaller airports that serve
regional airlines may have less sophisticated
navigational aids or air traffic control systems,which would further increase workload in the
terminal area. Also addressed in the NTSB
report was that requirements for support per-sonnel, including licensed dispatchers and
cabin crew, vary according to number of pas-
senger seats. Operations under Part 135 do not
require licensed dispatch service, and manycompanies do not provide it (ref. 12). Dis-
patchers aid pilots in flight planning, moni-
toring fuel loads and other performance
parameters, and obtaining pertinent informa-
tion in-flight. Such help can be especially
important in decreasing pilot workload during
fast turnarounds between flights. Some pilots
in the NTSB Commuter Study (ref. 12 )
reported that they must rush to complete many
important tasks (e.g., weight and balance, fuel
load) within a short period of time, and
reported that a licensed dispatcher checkingcalculations would increase their confidence.
Flight attendants also can help decrease pilot
workload in-flight, especially in case of emer-
gency, by administering passenger safety.
However, only aircraft with 20 or more seats
are required to carry flight attendants. Many
of these factors have the potential to play a
role in fatigue.
-'Airports that do not serve aircraft with more than 30
seats cannot participate in the FAR Part 139
Certification Program, and Part 135 carriers are not
restricted to certified airports.
V

2.3 Scheduling Practices
In response to the unique demands of regional
operations, certain distinctive scheduling prac-
tices have become common, including reduced
rest, continuous-duty overnights, reserve status,and schedules based on different FAR Parts or
combinations thereof (ref. 12).
Both Parts 121 and 135 allow for scheduling
or assigning a reduced-rest period (as short as
8 h) before a flight, in exchange for a longer
compensatory rest after the duty period. This
provision was intended to acknowledge thatflight operations are susceptible to unpredict-
able events (e.g., weather, air traffic) and to
provide flexibility in case of delays. However,
reduced rest has become a standard scheduling
practice in regional airlines (ref. 12). The 8-hour rest period includes transportation to and
from layover accommodations, meals, the
opportunity to shower, change, and attend to
other physiological needs, in addition to
sleeping. Therefore, an 8-hour rest period may
only allow 7 or 6 hours of sleep, while most
individuals require approximately 8 hours.
Additionally, the circadian timing of the rest
period may influence how much sleep acrewmember physiologically can obtain.
During the day, sleeping even 6 or 7 hours
within an 8-hour period may prove difficult.
Further, while the longer compensatory rest
after the duty period may benefit pilot alert-
ness and performance on the subsequent
flight, it does not compensate for sleep loss on
the flight that immediately follows reducedrest.
Continuous-duty overnights (CDOs), another
regional scheduling practice, consist of flying
one or more evening flights, spending the
night on duty at a destination, then flying one
or more flights the next morning. Several
CDOs, also called "stand-up overnights", can
be scheduled consecutively. Officially, pilots
remain on duty through the night (i.e., the
"stand-up" portion) because the ground time
is not long enough for a rest period. However,
while regulations do not require airlines to
provide rest accommodations for the "stand-
up" portion, most companies that schedule
CDOs do so (ref. 12). Because CDOs require
wakefulness during much of the night and
sleep during the day, they create potential for
performance decrements, circadian disruption,and acute or cumulative sleep loss.
The complex and unpredictable nature of air-
line operations requires flexibility, and the
industry often uses reserve status to respond to
changing operational demands. A pilot on
reserve status may remain awake and available
for duty for almost 16 hours and then be
called for a duty period of 14 hours or more.
Therefore, a crewmember may experience a
very long period of continuous wakefulness,
which creates the potential for fatigue.
Finally, the FAR Part that regulates a given
operation affects scheduling. Parts 121 and 135differ in their flight time and rest requirements:
Part 121 limits pilots to 30 flight hours per
week, 100 per month, and 1,000 per year, whilePart 135 sets limits at 34 h/wk, 120 h/mo, and
1,200 h/yr. Therefore, a pilot conducting
operations under Part 135 can be scheduled for
more flight hours than a coworker flying underPart 121. Additionally, certain non-revenue
operations, such as ferrying empty aircraft,
training exercises, and check rides, may beconducted under FAR Part 91, a practice that
allows flight times to be extended past a full
duty day of Part 135 or 121 operations.
2.4 T Other Considerations
Regional operations engender other distinctive
factors that may affect crewmember alertness
and performance.
Because regional routes generally are shorter
and flight segments more numerous, regional
pilots may conduct more takeoffs and land-
ings during each duty day compared to other
airline pilots. These low-altitude flight phases
are considered critical, demanding more con-
centration and higher levels of performance
than cruise, for example. Accident statisticsfrom 1994 illustrate the critical nature of
5

ground and terminal operations: 70% of seri-
ous accidents' during scheduled Part 135
operations occurred during ground or termi-
nal area operations, compared to 48% of Part
121 accidents (ref. 13). The fact that regional
pilots spend more of their flight time in critical
phases of flight suggests that they require atleast the same level of alertness and perform-
ance as their counterparts in the major airlines.
Additionally, the level of automation in the
aircraft may differ significantly among
regional operations and from equipment used
by major airlines. Engine type (e.g., jet vs.
turboprop vs. piston), pressurization, naviga-
tional systems, and warning systems may affect
flight deck environment, workload, and the
level of vigilance required of pilots. Environ-mental conditions such as noise and vibration,
which have been identified as fatigue factors
by other commercial pilots (refs. 10, 14), vary
among aircraft as well.
Clearly, some of these considerations stem
from regulatory differences, others from
operational requirements. Regardless of thesource, regional operations present numerous
challenges to flight crews attempting to main-tain high levels of alertness and performance
while performing their duties.
3.0 Methods
3.1 Survey
A retrospective survey designed to examinefatigue factors in regional flight operations
comprised 119 questions divided into 7 sec-
tions (see Appendix A). The sections
addressed general demographic information,
sleeping at home, flying (including recent
flying experiences), duty days (including
scheduling practices), fatigue (including per-
ceptions of fatigue in regional operations,
fatigue factors, and fatigue effects), and work
environment (including corporate attitudes,
safety, and management quality). A separate
3Accidents resulting in serious injury, fatality, or
substantial aircraftdamage.
6
section for management pilots focused on
scheduling. Data on demographics, home
sleep, and flying experience provided context
for an examination of current flight and duty
patterns, work environment, and fatigue issues.For the three carriers from Alaska, two addi-
tional questions were included to reflect dif-
ferences in their flight operations, and focused
on duty time.
3.2 Subjects
Subjects were regional airline pilots from 26
regional carriers. A representative sample of
regional pilots was targeted by identifying a
representative sample of carriers. The regional
carriers operating at the time of selection were
categorized by the nine Federal Aviation
Administration geographical regions and then
stratified into three groups based on size'.
Carriers that offered only cargo or mail service
(i.e., no passenger service) were eliminated to
control for operational differences. Three car-tiers, one from each stratum (large, medium,
and small), were selected at random _ from
each of the nine geographical regions, result-
ing in a list of 27 potential participant airlines.
Of these 27 carriers, 19 agreed to participate.
Two of the 19 carriers were replaced due to azero return rate. Therefore, 17 (63%) of the
originally selected carriers provided data. Of
the 10 remaining spaces, 9 carriers were
replaced by carders from corresponding FAA
region and size stratum, but no large carrier
from the Southwest region was available for
participation. Therefore, 26 carriers partici-
pated, representing each geographical region
and size except for large carders from theSouthwest.
4Assessed by number of enplanements as reported in the
Regional Airline Association's 1994 annual report, or,
when enplanement figures were unavailable, number ofaircraft.
SWhen only one airline from a specific region and size
stratum was available, it was selected.
V
",,.,..t
x_..,i
3.3 Implementation
Once a carrier agreed to participate in the
study, a company contact was identified towork with NASA investigators. To demonstrate
their cooperative support for the study, a
member of company management and a pilot
representative each signed a cover letter that
accompanied the survey. Survey packets (one
for each pilot at the company) were sent in
bulk to the company contact, who distributed
them to the pilot population.
Each survey packet included a survey, a
postage-paid envelope addressed to the investi-
gators, and the cover letter signed by investi-
gators as well as management and pilot
representatives. To encourage accurate and
forthright responses, the cover letter empha-
sized that participation was voluntary, anony-mous, and confidential. Toward that end, pilots
were instructed not to identify themselves and
to return surveys directly to NASA investigators
in the enclosed envelope.
3.4 Data
Data from completed surveys was entered into
a Filemaker Pro (Claris Corp, Santa Clara, CA)
database, and imported into S-Plus (StatisticalSciences Inc, Seattle, WA) for further data
processing and analysis. Other analyses were
produced with the BMDP (University ofCalifornia, Los Angeles) and ANOVA
(analysis of variance; University of California,
San Diego) statistical packages.
4.0 Results
Regional crewmembers returned 1,424 com-
pleted surveys of the 4,583 sent to carriers, a31% overall return rate. The number of pilots
per carder ranged from 6 to 855, and returnrates for individual carriers ranged from 6% to83%.
4.1 Demographics
Ninety-five percent of the respondents were
male, and subjects averaged 36.4 yrs of age,
5 ft 11 in of height, and 179 lb. Over half
(58%) reported an assigned domicile in the
Eastern time zone, 20% in the Pacific, and
17% in the Central. Likewise, a majority (54%)
reported living inthe Eastern time zone, 20%in the Pacific, and another 20% in the Central.
Pilots reported a 1.6-h commute, on average,
and 80% commuted by automobile. The 20%
who reported holding other jobs described
spending 43 h/too at them.
4.2 Sleeping at Home
The pilots presented a normal home sleep pro-file, on average, sleeping 7.9 h per night,
going to bed at 2248 h, and rising at 0736 h.
They reported an average sleep latency of 21
min and 1.4 awakenings per night. Asked to
identify one predominant cause of the awak-
enings, 48% cited the need to use the bath-
room, 18% reported being awakened by their
children or spouse, 12% by noise, 11% by"other" factors, and 10% because they were
unable to sleep. After awakening, it took sub-
jects an average of 13 min to return to sleep.
They reported getting 2.6 nights of sleep at
home between trips.
Subjects were asked to rate the frequency with
which they nap based on a five-point scalefrom "never" to "very often: 5-7 times/wk",
with a middle rating of "sometimes: 1-3
times/mo". Forty-five percent reported nap-
ping "rarely" or "never", 33%"sometimes", and 22% "often" or "very
often". The average reported nap duration
was 1.2 h. Rating the frequency with which
they experience problems getting to sleep (onthe same 5-point scale), over half of the group
(58%) reported "rarely" or "never", 33%
"sometimes", and 9% "often" or "very
often". Most (95%) reported "never" or
"rarely" taking medication to aid sleep.
Similarly, 90% reported "never" or "rarely"
using alcohol as a sleep aid, while 3% reported
using it "often" or "very often". Overall, the
pilots identified themselves as good sleepers,
with 89% rating themselves as "'good" or
"very good" sleepers. Ninety percent
reported having no sleep problem. Of those
who reported problems, 6% (I 1 subjects) had
been diagnosed by a physician, and 11%
7
(27 subjects) reported that the problem had
prevented them from flying a scheduled trip atsome time.
Subjects were asked to rate 18 factors on theextent to which each affects home sleep, using
a 5-point scale from "l-interferes" through
"3-no effect" to "5-promotes". The
responses for each factor were averaged. The
top five promoting factors based on these
averages were "pillows" (mean = 3.88),
"'readiness for sleep" (3.79), "quality of
sleep surface" (3.75), "ventilation" (3.73),and "sheets" (3.70). The most interfering
factors based on averages were "thoughts
running through your head" (1.82), "randomnoise events" (2.11), "high humidity" (2.21),
"heat" (2.23), and "background lighting"
(2.34). Based on the highest proportion of
"promotes" responses (i.e., "5-promotes"),the five most promoting factors were "readi-
ness for sleep" (35%), "pillows" (34%),
"quality of sleep surface" (33%), "privacy"
(23%), and "ventilation" (22%). The highest
proportions of "interferes" responses were
"thoughts running through your head"
(38%), "heat" (30%), "high humidity"(23%), "random noise events" (21%), and
"background lighting" (17%).
Asked to rate 4 additional factors on the extent
to which they interfere with sleep, on a 5-point
scale from "l-strongly interferes" to "5-no
effect", subjects rated "personal worries" as
the most interfering (mean = 2.33, rated 1 by26%), followed by "thirst" (2.85, 11.6%),
"hunger" (3.23, 8.2%) and respiratoryfactors (3.84, 5%).
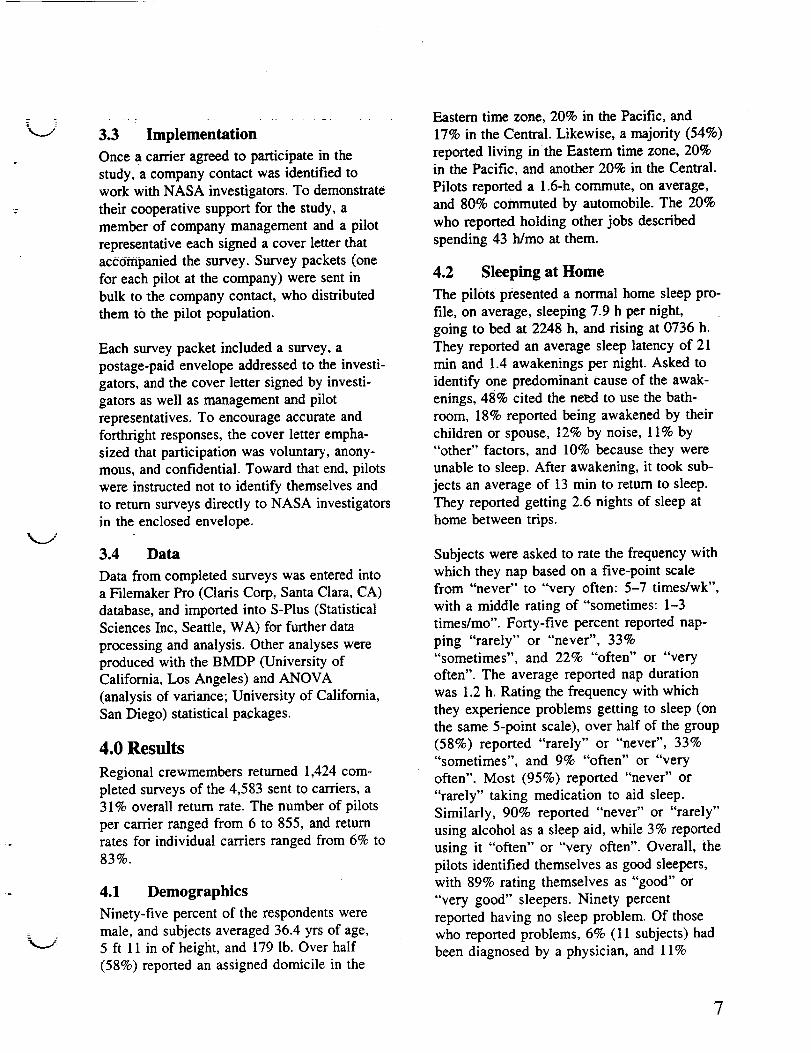
Two questions concerned sleep at home when
on reserve status. Subjects reported that, whenon reserve status at home and not called out,
they usually get 7.7 h of sleep at home. Theyidentified factors that most interfered with
sleep at home while on reserve, and those that
most promoted sleep on reserve. Their
responses were categorized, and Figure 1shows the five most commonly cited interfer-
ing factors (indicated by negative values) aswell as the top five promoting factors (positive
values). The five categories of most commonly
identified interfering factors were: "work
worry," including concerns about being called
for duty, what the trip would entail, what
scheduling changes would be made;
"thoughts," including non-work oriented
thoughts or anxiety; "noise"; "environ-
ment," including temperature, humidity, andventilation; and "not ready for sleep," which
refers to a physiological inability to fall asleepat the time. The five categories of most com-
monly identified promoting factors were:
V
600
t 400(Promote) 200
# responses 0
(Interfere) 200
400
600
800
W°rkThoughts Noise Envir. Notfor
i-|i -
Figure 1. Factors that interfere andpromote home sleep whefi on reserve.
8

"home/family," including the familiarity of
surroundings and having a bed partner
present; "lack of work worry," including
knowledge of the schedule and details for a
trip, and feeling secure that there would be alate call or no call; "environment"; "ready
for sleep," which refers to a physiological
ability to fall and stay asleep; and "comfort,"
including sleep surface, pillows, and blankets.
4.3 Flying Information
The pilots reported having an average of 3090
total flight hours when hired by their currentairlines, and 7050 lifetime hours at the time of
the survey. Most subjects (85%) reported
holding an Air Transport Pilot Certificate.
Subjects reported 4310 h of flight time withairlines, 1820 h in general aviation, 1630 h in
other categories, and 674 h of military time. In
a typical month, pilots reported flying 81 hwith airlines, 1.1 h of general aviation, 0.35
military hours, and 0.12 h in other categories.
They had held salaried flying positions with an
average of 2.8 different companies, and hadbeen employed at the present airlines for an
average of 4.9 yrs at the time of the survey.Crewmembers reported flying the following
types of aircraft: 1191 (96%) reported flying
turboprop aircraft, 81 (6%) jets, and 11 (1%)
reciprocating-engine aircraft. Almost three-
quarters (68%) reported flying under Part 135of the FARs only (i.e., not Part 121); 27%
reported flying only under Part 121; and 63
(4%) reported operating under both Parts 121
and 135 (fig. 2). In addition to regular opera-
tions under Parts 121 and 135, 10% reported
operations under Part 91. On average, pilots
reported an hourly wage of $33 and a monthly
income of $2,590. A slightly higher percent-
age of captains (54%) than first officers (46%)
responded to the survey.
Pilots answered a series of questions based on
flying done for their regional airline jobs
within the past year. For several questions, they
were asked to report three values: a typical
value, and high and low values. They reported
flying 13.5 h of actual IFR (i.e., IMC, instru-ment meteorological conditions) in a typical
month, flying 4.6 h at least and 27.1 at most.
A typical flight delay lasted 24 min, while theshortest lasted 7 min and the longest 1 h 39
min. Air traffic control (ATC) delays occurred
3.6 times in a typical month, 0.6 times in thebest case, and 9.5 times in the worst case.
Delays due to weather occurred 2.3 times/wk
typically, and ranged, on average, from 0.35 to
7.8 times/wk. Company-mandated delays 2.7
times in a typical week, ranging from 0.8 to
5.9 times/wk. In a typical week, 1.9 mechanical
delays occurred, with 0.4 in the best case and4.4 in the worst' Pilots reported flying in a
high density operating area 3.9 times in a
typical day, 210 times/day at least and 6.0 times
at most. They flew in non-radar environments
3.4 times/wk typically, 1.4 times/wk at least and6.6 times at most.
Thirty percent reported flying reserve lines atthe time of the survey. Most of those (93%)
identified the type of reserve as "on call at
home", while 5% reported airport reserve and
2% cited both. Subjects reported that 45% of
their flight hours in a typical month was
reserve flying, on average, 16% at least and
63% at most. Typically, pilots were notified an
=i Part 135 only (68%)
• Part 135 & 121 (5%)
[] Part 121 (27%)
Figure 2. Subjects by FAR Part (135 vs. 121).
9

average of 4.9 h before they were expected to
report for duty while on reserve, 1.0 h beforeduty at least and 19.9 h at most. They reported
getting 5.6 h of sleep before reporting for
duty when called out of reserve. Subjects wereasked how often their 24-consecutive-hour
required rest period was assigned after the fact,
that is, assigned retroactively to be the 24
hours preceding the callout. Pilots reported
that their required rest was assigned retroac-
tively 1.0 times in a typical month, 0.3 times inthe best case and 2.1 times in the worst case.
4.4 Duty
Pilots reported flying 18.3 duty days in a typi-
cai month, 15 days/mo at least and 20.9 days
at most. Alaskan flight crew were asked howmany consecutive duty "days they worked in a
month, and 24 crewmembers reported that
they typically worked 6.8 days in a row on
average (range: 4-30) and at most, they
worked 13.6 days in a row on average (range:
6-45). They reported being scheduled for an
average of 81.3 h in a typical month, with a
range from 66.4 h to 92.1 h, and actually fly-
ing an average of 80.6 h typically, with a
range from 63.1 h to 96.0 h. A typical duty
day included 5.6 flight segments, 2.3 at least
and 7.4 at most. Subjects reported an averageof less than half an hour (mean = 27 min) on
the ground between flights, with a range from7 min to 4 h 24 min.
In a typical month, 1.2 duty days exceeded 8
h of actual flight time, ranging from 0.2 days
to 2.8 days. Asked to indicate on a four-point
scale how often their companies readjustedschedules to account for actual block times,
19% reported "never", 38% "rarely", 34%
"occasionally", and 9% "frequently".
Pilots reported ferrying aircraft under Part 91
FARs, after flying 8 h under another Part,
0.7 times in a six-month period. They cited
undergoing check rides or training flights
under Part 91, after flying 8 h under anotherPart, 0.2 times in a typical year. Subjects were
asked how many times in the year preceding
the survey they had exceeded the 7-consecu-
tive-day flight time limit, which is 30 h underPart 121 and 34 h under Part 135. Pilots
reported exceeding the limit 0.3 times while
Mean #
per month
8
7
6
5
4
3
2
1
00000- 0400-
0359 0759
0800-- 1200- 1600- 2000-
1159 1559 1959 2359
Duty report time
Figure 3. Distribution of means of duty report times in month preceding survey.
10
\,._..j:flying under Part 121 (43% reported 0 times)and 0.9 times utider Part 135
(74% reported 0 times).
Subjects reported an average typical duty dayof 11.2 h, a shortest day of 5.6 h and a longest
of 15.0 h. The longest day of their airlinecareers was 16.8 h, on average. Pilots reported
that, within a typical month, 0.8 duty days were
extended to keep flight time within regulated
limits, with a range from 0.2 to 1.8 times. In a
typical month, pilots stayed in hotels 8.3 times,in trailers 0.04 times, and in other accommoda-
tions 0.8 times. Duty report times in the month
preceding the survey were most commonly in
the early morning, between 0400 and 0759
(mean = 6.8 times), while 3.3 duty days started
between 1200 and 1559, and 3.2 days began
between 0800 and 1159 (fig. 3).
Pilots were scheduled for reduced rest an
average of 3.8 times in a typical month, 1.4
times at least and 6.4 times at most. They
reported being asked to take unscheduled
reduced rest 1.1 times in a typical month, atleast 0.2 times and at most 2.5 times/mo. When
asked to take unscheduled reduced rest, the
rest periods were reduced to 8 h an average of
1.7 times and to 9 h an average of 0.8 times.
In a typical month, 3.3 duty days included
CDOs, 1.1 days at least and 6.9 at most. During
a CDO, the typical scheduled ground portion
was 6.4 h; ranging from 4.8 h to 7.7 h. Pilots
reported that the time available for sleep during
these periods was typically 4.8 h, and rangedfrom 3.2 h to 6.2 h. Indicating on a four-point
scale how often they slept during the "stand-
up" portion of a CDO, over three quarters(79%) cited "frequently", 16% "occasionally",
and 5% "rarely" or "never". Over three quar-
ters (79%) of the pilots reported that their com-
panies provided accommodations for the
"'stand-up" portion of CDOs. Those who
responded to a question regarding these
accommodations reported that, in a typical
month of flying, they stayed in hotels 3.7 times,0.1 times in trailers, and 0.2 times in other
accommodations. On a five-point scale from
"'very poor" to "very good", 67% rated theaccommodations "good" or "very good",
28% rated them "fair", and 5% "poor" or
"'very poor". Pilots reported getting an average
of 4.6 h of sleep during the "stand-up" portion
of CDOs typically, 5.9 h in the best case and 2.6
h in the worst case. They reported that they
ferried planes during the "stand-up" portions
of CDOs an average of 0.49 times in a typical
month. Over half (56%) acknowledged having
flown the final segment of a CDO without
having slept at all.
The rest period between consecutive CDOs
lasted 11.5 h typically, and ranged from 8.9 h
No. of
resp.
900
800
700
600
500
400
300
200
100
0Long
dutyWeather Multiple Delays Short CDO's No breaks/ Early Long Pt 91
fit. legs rest food report waits fits.
Figure 4. Factors contributing to worst work day.
11

to 14.9 h. Of those times, 8.3 h was typically
available for sleep, 6.1 h minimum and 10.8 h
maximum. Pilots reported getting 3.3 h of
sleep between consecutive CDOs typically, 2.3h in the worst case and 5.8 h in the best case.
4.5 Fatigue
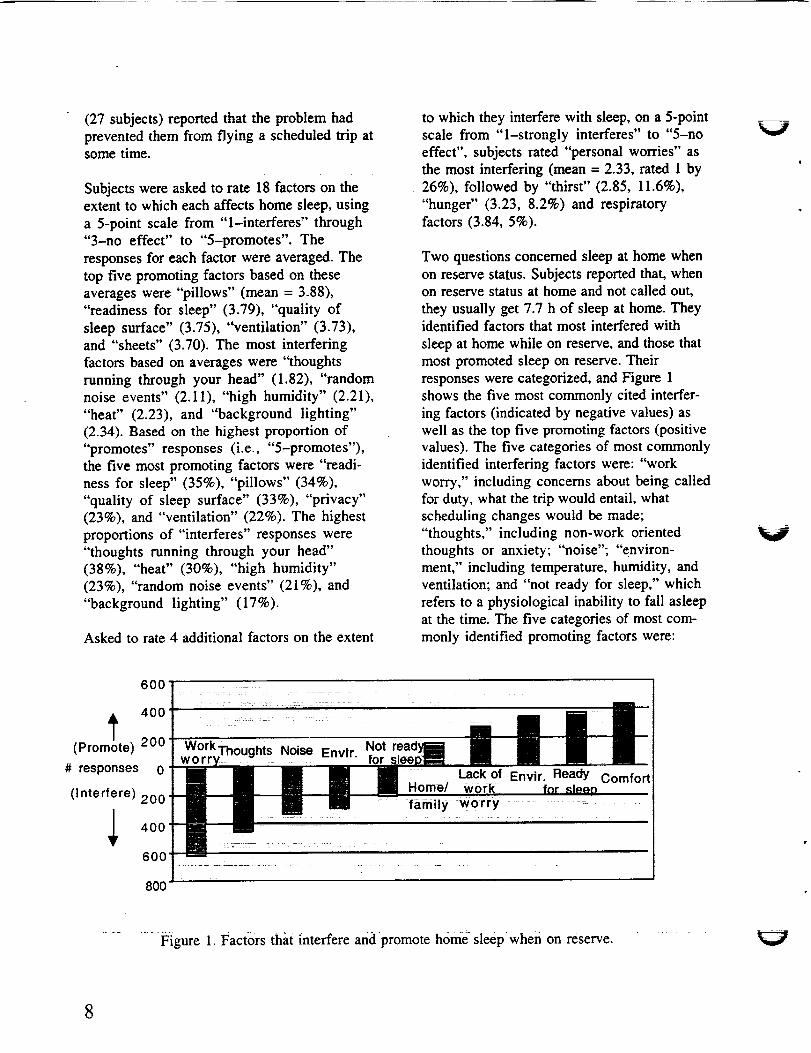
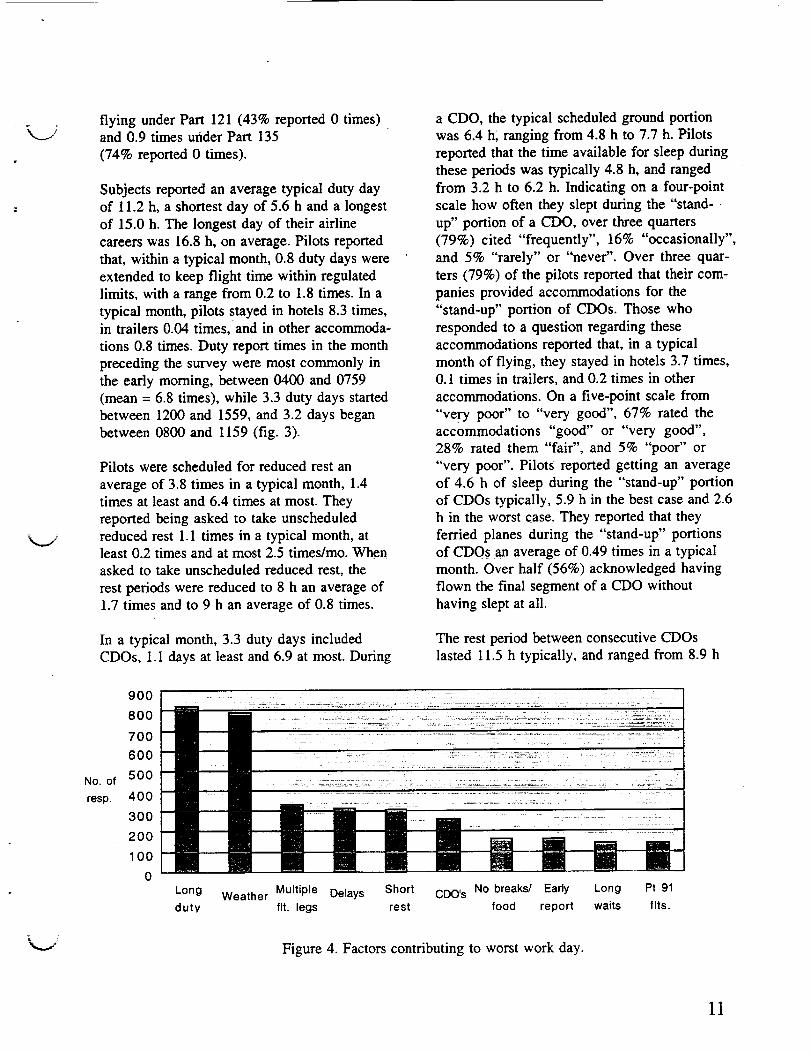
Subjects were asked to describe the worst work
day flying regional airlines, including the spe-
cific contributing factors. The reported factors
were categorized, and the ten most commonly
reported factors, shown in figure 4, were: long
duty day; weather (including flying in instru-
ment meteorological conditions and shooting
instrument approaches to minimum descent
altitudes, but not delays on the ground due to
weather); multiple flight legs; delays
(including mechanical, weather, and others);
short rest (including reduced rest and inade-
quate rest or sleep); continuous-duty
overnights (including single and consecutiveCDOs); no breaks/food (including turn-around
times between flight legs that were too short to
allow for food or other physiological needs);
early duty report times; long waits (including
long periods of time between flight segments);
"Part 9i flights" included ferrying of aircraft
and other operations under FAR Part 91. Most
subjects (89%) indicated that they considered
fatigue a "moderate" or "serious" concern
in regional flight operations, while 11% con-sidered it "minor" or not a concern. Simi-
larly, 88% described crew fatigue as a com-
mon occurrence in regional operations.Further, most (92%) indicated that, when crew
fatigue occurs, it is a "moderate" or "seri-
ous" safety issue. Subjects described specific
ways in which fatigue affects their flight per-
formance (fig. 5). Asked which flight phase is
most affected when flight performance is
affected by fatigue, 40% identified the enroute
phase, 30% landing, 19% descent, and 7%
takeoff, and 4% taxi. Descent and landing
together, which includes the approach phase,
accounted for almost half (49%) of responses.
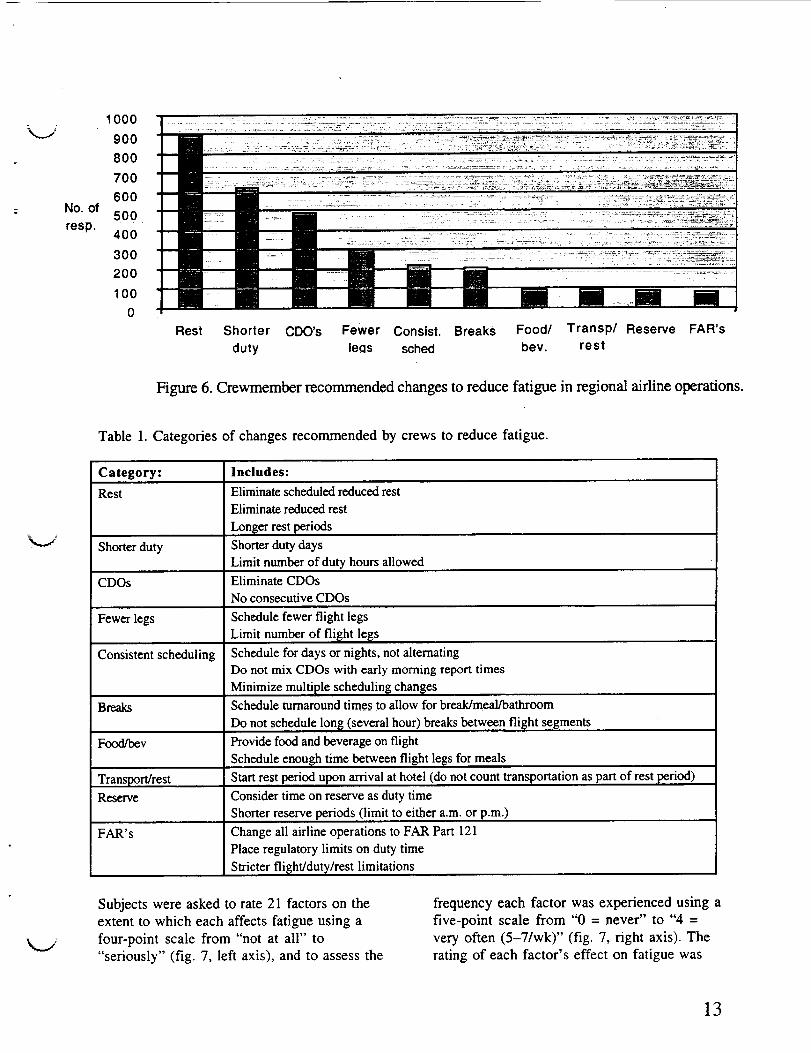
Pilots were asked to suggest changes to reduce
fatigue in regional airline operations. Figure 6shows the ten most commonly recommended
changes along with the number of times eachwas cited. Table 1 provides examples of
suggestions from each category.
Over three-quarters of the subjects (80%)
acknowledged having nodded off during a
flight at some time. Over half (56%) reported
that they had been on a flight during which
arrangements had been made for one pilot to
sleep during the segment.
V
No. of
resp
700
600
5OO
400
300
2OO
100
0 attn/
alertflight slow missed apathy tired/ judgement errors worseperf rxn items sleepy mood
Figure 5. Specific effects of fatigue on crewmember performance.
memory
12
No. of
resp.
1000
900
800
700
600
50O
400
300
200
100
0
" ............................................... i'- " _ .......... IF ..........
Rest Shorter CDO's Fewer Consist. Breaks Food/ Transp/ Reserve FAR's
duty le.ClS sched bev. rest
Figure 6. Crewmember recommended changes to reduce fatigue in regional airline operations.
Table 1. Categories of changes recommended by crews to reduce fatigue.
Category: Includes:
Rest Eliminate scheduled reduced rest
Eliminate reduced rest
Longer rest periods
Shorter duty Shorter duty days
Limit number of duty hours allowed
CDOs Eliminate CDOs
No consecutive CDOs
Fewer legs Schedule fewer flight legs
Limit number of flight legs
Consistent scheduling
Breaks
Food/bev
Transport/rest
Reserve
FAR's
Schedule for days or nights, not alternating
Do not mix CDOs with early morning report times
Minimize multiple scheduling changesSchedule turnaround times to allow for break/meal/bathroom
Do not schedule long (several hour) breaks betw_nflight segments
Provide food and beverage on flight
Schedule enough time between flight legs for meals
Start rest period upon arrival at hotel (do not count transportation as part of rest period)
Consider time on reserve as duty time
Shorter reserve periods (limit to either a.m. or p.m.)
Change all airline operations to FAR Part 121
Place regulatory limits on duty time
Stricter flight/duty/rest limitations
Subjects were asked to rate 21 factors on the
extent to which each affects fatigue using a
four-point scale from "not at all" to
"seriously" (fig. 7, left axis), and to assess the
frequency each factor was experienced using a
five-point scale from "0 = never" to "4 =
very often (5-7/wk)" (fig. 7, right axis). The
rating of each factor's effect on fatigue was
13

assigned a numerical value (e.g., not at all = 1,
seriously = 4), and responses were averaged.
The 10 factors with highest average ratings are
shown in Figure 7, which shows/lists the mean
fatigue rating as well as the mean frequency
rating for each factor.
Examining the fatigue effect rating in con-
junction with the frequency of occurrence,
eight of the top ten factors received frequency
ratings higher than "sometimes": ratings
indicated that flying 7 or more flight segments
occurred almost halfway between "some-
times" and "often"; company scheduling
practices and noise, slightly more than"often"; high ambient temperatures, lack of
available nutritious food, and IFR flight,
slightly less than "often"; flying without an
autopilot slightly more than "sometimes";and flying 4-6' flight segments occurred"often". Severe turbulence, while rated as
having a moderate effect on fatigue, was rated
as occurring "very rarely", and dehydrationless than "sometimes".
1 Effect on fatigue
4
4.6 Work Environment
• Crews were asked to give their perceptions oftheir companies' priorities by ranking
6 factors, with an additional 7 e option for
"other". Average rankings were as follows:
"profit" 1.4; "public image" and "'safety"3.2; "customer satisfaction" and "growth"
3.6; and "employee satisfaction" 5.6. Over
three-quarters (78%) of the crewmembers per-
ceived "profit" as the companies' first prior-
ity. "Safety" was ranked as the companies"
first priority by 12%. About three-quarters
ranked "employee welfare" as their compa-
nies' 6 'h or 7'h priority.
Comparing the safety of their regional airlines
to that of the majors using a five-point scalefrom "much less safe" to "much safer", 41%
rated their airlines "as safe", 35% "somewhat
less safe", and 11% "somewhat safer". A
weighted average (mean = 2.7) indicated a
perception that the regional airlines werebetween "somewhat less safe" and "as safe"
compared to major airlines. Rating their job-
security using a four-point scale from "very
4_ Frequency
4
3.5
3
2.5
2
1.5
1> 7 fit
segments
co. sched sevr high arab lack of no noise IFR fit
_ractices turb temp nutr food autopilot (actual) segments
Effect on3.6 3.3 3.2
fatigue
Frequency 2.4
3.1
3.1 1.1 2.8
_L
4-6 fit dehydration
3.0
3.1 3.0 2.8 2.7 2.7
2.8 2.1 3.1 2.7
Figure 7. Highest rated fatigue factors and frequency of occurrence.
3.5
3
2.5
2
1.5
1
0.5
0
14

insecure" to "very secure", 49% felt"secure" and 28% "insecure".
Almost three-quarters (72%)reported that
there was no pilot union on the property at the
time of the survey. Of those who indicated that
a pilot union was present, 92% reported beinga member. Subjects rated how well the union
and company management worked together,
based on a five-point scale from "very
poorly" to "very well": over a third (34%)
indicated "very poorly", 29% "poorly",
26% "moderately", and I 1% "well" or
"'very well". Pilots rated the quality of their
unions on a five-point scale, and the average
was 3.2, slightly better than "fair" (8% "very
good", 36% "good", 34% "fair", 16%
"poor", and 6% "very poor"). Pilots rated
management on the same scale resulting in an
average of 2.5, indicating a rating halfway
between "poor" and "fair".) A majority
(86%) reported that their companies did not
offer any training that addressed fatigueissues.
4.7 Management
Pilots who also held management positions in
the company were asked to answer three addi-
tional questions. They reported having logged
4500 flight hours in airlines, 4100 h in the
military, 2040 h in general aviation, and 700 h
in other types of flying, on average. Almost a
fifth (19%) reported that they were involved in
company scheduling decisions. This subset of
the group (n = 10) was asked to rank factors
with regard to the priority given to each factor
in scheduling decisions. "Maximizing net
income" received the highest average rating(2.1) and was ranked first by 7 of the 10
respondents; "availability of equipment" had
the second highest rating (2.6) and was rated
second by 6 respondents; "pilot's duty timefor the work day" had an average ranking of
3.4, with rating that varied among respondents;
"number of legs flown by pilot" had the
fourth highest average ranking of 3.6, but 5 of
9 ranked it as their third highest priority;
"takeoff time during night/early morning"
received the lowest ranking (4.6) with 4 of 9
ranking it as their fourth priority. Addition-
ally, the one response in the "other" category
that was ranked first priority was "pilot
experience."
5.0 Discussion
5.1 Caveats
As with any operational study, certain limita-
tions apply to this investigation. Survey stud-
ies, in particular, are limited by the subjective
nature of the data. Responses depend on sub-
jects' perception, memory, and understanding
of the questions. Additionally, research has
demonstrated that individuals' subjective per-
ception of their sleep often is discrepant fromphysiological measures (ref. 15). Self-assessed
estimates of sleep latency times, sleep dura-
tions, awakenings, and other parameters are
frequently inaccurate. Attempts were made toquantify response choices to minimize inter-
pretation of descriptors (e.g., "often: 1-4times/wk."). Also, because much of the infor-
mation requested was retrospective, subjects
were asked to reference their logbooks orpaysheets for accuracy. Nevertheless, inter-
pretation of the findings should allow for thelimitations of subjective data. The survey for-
mat also has inherent sampling limitations due
to the fact that voluntary respondents are a
self-selected group.
5.2 Fatigue in Regional Operations
Overall, responses indicated that regional flight
crewmembers consider fatigue a significant
issue in regional flight operations. According
to reports from the flight crews surveyed,
fatigue is a moderate-to-serious concern that
most agree is common in regional flight
operations. Further, a great majority of crew-
members consider fatigue a moderate-to-seri-
ous safety issue when it does occur, and almost
half identified descent or landing as the flight
phases most affected by fatigue-induced per-formance decrements, which are critical
operational phases.
Providing further evidence that fatigue affects
regional operations, most crewmembers
15
reported that they have nodded off during a
flight at some time, and over half reported thatthey have been on a flight during which
arrangements were made for one pilot to nap
in-flight. Nevertheless, few reported that they
received training about fatigue from their
flight departments.
5.3 Fatigue Factors Identified
Responses from regional flight crewmemberscorroborated many of the fatigue issues that
are typically identified anecdotally, as well as
those described in the NTSB Commuter Study
(ref. 12). These include long duty days, multi-
ple flight segments, continuous-dutyovemights (CDOs), flying reserve, issues
around operations under different Parts Of theFARs, and technology and equipment. Also
identified as fatigue considerations were early
duty report times, environmental factors, and
personal physiological requirements, such asfood.
5.3.1 Operational Requirements: Multiple
Flight Segments
Regional operations require multiple take-offs
and landings each duty day, which increasesthe amount of time spent in critical low-
altitude operations. This fact is significant
from two perspectives. From one perspective,
flying multiple segments may contribute to
fatigue. This potential is evidenced by the fact
that flying multiple segments in the same duty
day accounted for two of the top ten fatiguefactors identified by crews, as well as the third
most frequently identified factor contributingto the worst work day in regionals. From
another perspective, fatigue that affects a
regional pilot, who faces these high-workload,
critical flight phases about five times as fre-
quently as long-haul pilots, may create
increased opportunity for fatigue-induced per-formance decrements to manifest themselves.
5.3.2 Scheduling Factors
Crewmembers rated company scheduling
practices as the second most fatiguing factor,
reporting that it occurred often. Several spe-cific issues concerning regional airline
16
scheduling practices were identified through
responses to questions on CDOs, flying
reserve, and duty report times. Schedulingfactors accounted for 8 of the I0 most fre-
quently cited contributors to the worst regional
flying day. Suggestions concerning schedul-
ing factors represented nine of the ten most
common recommendations to reduce fatigue
in regional operations.
Regional crewmembers reported average
workdays of 11.3 hrs. Long duty days were
the most frequently cited factor in the worst
regional workday. Crews recommendations tolimit or reduce the length of duty days were
the second most common suggestion to reduce
fatigue in regional operations.
Continuous-duty overnights (CDOs) entail
flying during much of the night and sleeping
during the day, especially when CDOs are
scheduled consecutively. Most companies
provide accommodations, usually hotels, for
their pilots flying CDOs. However, crewmem-
bers reported that only 4.8 h were available for
sleep during the "stand-up" portion, of which
they slept 4.6 h, compared to their normal at-
home average of 7.9 h. This suggests thatcrews may have started early morning flight
segments with an average of 3.3 h of sleep
loss, regardless of the sleep they may have had
later in the day. Over half of the crewmembers
reported having flown the final segment with-out any sleep at all. This sleep loss may
exacerbate those performance decrements that
normally would occur during the early morn-
ing circadian low. Further, crewmembers
reported that despite the fact that an average of
8.3 h was available for sleep between consecu-tive CDOs (i.e., during the day), they obtained
only 3.3 h of sleep on average, which trans-
lates to 4.6 h of sleep loss. This abbreviated
sleep time is consistent with the fact that the
circadian signal to be awake during the day
often prevents people from getting their nor-
mal amount of sleep when they attempt to
sleep during the day. These factors may affect
any flight involving CDOs, which was almostone-fifth of flights according to crewmembers. v
k.i
CDOs represented the sixth most frequentlycited factor in the worst workday, and theelimination or reduction of CDOs was the third
most frequent suggestion to reduce fatigue in
regional operations.
The approximately one-third of crewmembers
who fly reserves may face another set of chal-
lenges. The nature of flying on reserve meansthat crewmembers must respond when called
for duty, thus creating unpredictability in their
schedules. This unpredictability can lead to
sleep loss, for example, when a call for duty
occurs when a sleep period was planned. As
evidence that sleep loss occurred, crewmem-
bers reported getting 5.6 h of sleep before
duty on average--2.3 h less than their normal
average sleep. Sometimes (about once a month
according to responses), the rest period that a
crewmember must be given was assigned
retroactively. That is, when called for duty, thecrewmember was told that the previous hours
constituted the required rest period. Clearly,
this may add to the problem of planning a
sleep schedule. These factors may result in
flight crewmembers starting duty sleep-
deprived. Modifying reserve scheduling prac-
tices was among the ten most commonly citedrecommendations to reduce fatigue.
Another scheduling factor that may lead to
sleep loss among crewmembers are early duty
report times. The most common report timeswere between 4 a.m. and 7:59 a.m., according
to responses. Early morning starts may trun-cate the normal sleep period, resulting in sleep
loss. In order to accommodate an early report
time, crewmembers may attempt to go to sleep
earlier than normal to get their usual amount
of sleep. However, because the natural ten-
dency of the circadian clock is to lengthenrather than shorten the day, they may be
physiologically unable to fall asleep earlier. A
NASA study of pilot s flying short-haul air
transport operations concluded that early
reports times contributed to the sleep loss the
crews experienced (ref. 4). Further, the type of
sleep lost may be REM sleep, which occurs
more in the morning, and which is often
credited with the restoration of cognitive
functions. Early report times were among the
ten most frequently cited factors in the worst
regional flying day.
Finally, the amount of time between flight legsaccounted for two of the ten most frequently
cited factors in the worst workday as well as
the sixth most common suggestion to reduce
fatigue in regional operations. Interestingly,two issues seem to be involved: first, short
periods between flights that do not allow formeals or breaks; second, extended waits
between flight segments that may contribute to
long duty days with little flight time. There-
fore, while very short breaks were among the
commonly cited factors, very long periods
between flights also were cited.
5.3.3 Factors Concerning FARs
The fact that many regional airlines operateunder a different Part of the FARs from the
majors (i.e., Part 135 vs. 121) and sometimes
operate under more than one Part (i.e., Parts
135, 121, 91) raises several potential issues,
including discrepant flight time limitations and
differing requirements for support.
As a general overview question regarding the
safety of regional airlines compared to that of
major airlines, crewmembers rated their
regional airlines as being between somewhatless safe than and as safe as major airlines.
A NASA study of short-haul air transport
pilots flying for major airlines used both
physiological and subjective measures to assess
fatigue factors, and the results suggested some
similarities between those operations and
regional airline operations (ref. 4). Like
regional flight operations, short-haul flying
required multiple flight segments (5.6 in
regional vs. 5.1 in short-haul). Regional duty
days (averaging 11.2 h) were somewhat longerthan in short-haul (10.6 h), and the daily flight
times were comparable, with regional pilots
averaging 4.4 h of flight per duty day, while
short-haul pilots averaged 4.5 h. Therefore,
regional pilots flew slightly more flight seg-
ments, had slightly longer duty days, and flew
17
approximately the same number of hours.However, the regional operations under Part
135 differed in thei r requirements for flight
and rest time, flight dispatch service, and air-
port certification, all of which are regulated
more under Part 121. These discrepancies in
themselves may constitute an additional chal-
lenge to alertness in regional operations.
In the NTSB Commuter Study, pilots reportedthat short turn-around times without the help of
dispatchers made them uncomfortable about
the possibility of making mistakes concerning
important flight information (ref. 12). The
regional pilots in this study corroborated short
turn-around times, reporting an average turn-around time of 27 minutes and a shortest turn-
around of under 7 minutes.
As described earlier, airlines may assign cer-
tain operations, such as ferrying aircraft or
training flights, under Part 91 after a crew-member has met the 8-h flight time limit
under Part 135 or 121. Pilots reported that
they ferried planes 0.7 times in six months,and had check rides or training flights 0.2
times in a typical year. These responses sug-
gest that operations under Part 91 after regularoperations under another Part may not be fre-
quent but that they do occur, about 1-2 timesper y_ar, on average. Part 91 operations in
addition to standard Part 135 or 121 opera-
tions were among the ten most frequently cited
factors in the worst regional flying day.
5.3.4 Other Fatigue Considerations in
Regional Operations
The ten highest-rated fatigue factors identified
by regional pilots included two environmental
factors (high ambient temperature and noise),
two factors that may be related to aircraft
automation (flying without autopilot and flightin actual IFR conditions), and two dietary
factors (lack of available nutritious food and
dehydration).
Aircraft flown in regional operations may be
older, less technologically advanced, and less
well-equipped than aircraft flown by major
airlines. Depending on the specific aircraft and
other equipment, this may result in less control
over environmental factors such as flight deck
temperature and noise. The technology and
automation, also dependent on the specifica-
tions of the aircraft, may not include autopilot
or the latest navigation equipment (which may
affect operations in IFR conditions).
Finally, the lack of available nutritious food
and dehydration may relate to various factors.
For example, food may be provided, but it may
not be of high nutritional value, or food may
not be provided at all. The availability of both
food and water in flight also may relate to
whether or not the flight includes food and
drink service for passengers, and whether flightattendants are on board.
Some of these challenges, such as regionalschedules or the automation level in the air-
craft, may be complex to address, while others,such as available food and water, may be more
straightforward.
5.4 Recommendations
Regional flight crewmembers identified several
fatigue factors in their responses. These factors
may be categorized broadly as deriving from
operational requirements, scheduling, FARs,
technology and equipment, "and individual
physiological requirements.
Whether the fatigue factors concern regulation,
flight/duty schedules, aircraft environment,or personal sleep habits, education plays an
invaluable role in managing fatigue. If all
industry members, including policy makers,
flight department managers, schedulers, dis-
patchers, flight crews, cabin crew, and others,
were equipped with basic information con-
cerning sleep, circadian physiology, and theeffects of these factors on flight operations, "
they would be better able to help improve
alermess and performance in regional airlines.
Additionally, flight crews and others may
benefit greatly from learning fatigue counter-
measures, including the use of planned naps,
strategic caffeine, how to create an appropriate
V
18

_...J
sleep environment at home and on trips, and
how to develop and practice good sleep habits.
Scheduling factors accounted for the two
highest rated fatigue factors, eight of the ten
most frequently cited factors in the worst
regional flying day, as well as the five mostcommon recommendations from pilots to
reduce fatigue in regional operations. Anoverall review of scheduling practices may be
an important part of any attempt to address
fatigue. Duty duration, continuous-duty
overnights, reduced rest, consistency of day vs.
night duties, report times, and reserve practices
might benefit from special attention. Identifi-
cation of ways to improve schedules from a
fatigue standpoint while meeting operationaland economic needs of the airlines would be
invaluable.
Environmental fatigue factors identified by
regional flight crews, high ambient
temperature and noise, might be addressed by
maximizing control of those factors to the
extent possible. Potential approaches rangefrom providing individuals with certain
equipment to making aircraft modifications.
The lack of available nutritious food may be
addressed by both crewmembers and by air-
lines. For example, companies might provide
fresh, nutritious in-flight meals when flightshave food service. Crews, in turn, could plan
ahead and bring healthy snacks. Likewise,
while companies can provide beverages, crew-
members can be sure to have enough liquids
by bringing some bottled water or other non-
caffeinated beverage.
Additionally, education can help ensure that
pilots are aware of the dehydrating effects of
the aircraft and the importance of staying
hydrated.
Finally, the responses suggest that operations
under Part 135 may face unique challenges.
This supports the NTSB recommendation that
distinct regulatory standards for different seg-ments of the airline industry be re-examined.
As the NTSB noted in its Commuter Study,
regional airlines are continuously growing in
the number of passengers they carry as well as'
in the role they play in the air transport indus-
try. Therefore, it becomes increasingly impor-
tant for regulations that guide the airline
industry to reflect available scientific
information on fatigue, alertness, and
performance.
Just as there is not a solitary cause for fatigue
in regional flight operations, there will be no
single solution. To maximize alertness and
performance in flight crews, dispatchers, cabincrews, maintenance technicians, and others
crucial to flight safety, the regional air trans-
port industry will need to take a comprehen-
sive, integrated approach by addressing to the
fullest extent possible each contributing factor.
By managing fatigue, the industry can con-
tribute to a higher overall safety margin in
regional flight operations.
19
References
1. Federal Aviation Administration. (1999.)
FAA Aerospace Forecasts--Fiscal Years
1999-2010. (FAA Publication No. FAA
APO-99-1.) Washington, DC: Author.
2. Regional Airline Association. (1994).
1994 Annual Report. Washington, DC:Author.
3. Gander, P. H., Graeber, R. C., Connell, L.
J., and Gregory, K. B. (1991). Crew factors
in flight operations: VIII. Factors
Influencing Sleep Timing and Subjective
Sleep Quality in Commercial Long-Haul
Flight Crews. (Technical Memorandum
103852). Moffett Field, CA: National
Aeronautics and Space Administration.
4. Gander, P. H., Graeber, R. C., Foushee, H.
C., Lauber, J. K., and Connell, L. J. (1992).
Crew Factors in Flight Operations." II.
Psychophysiological Responses to Short-
Haul Air Transport Operations. (Technical
Memorandum 88321). Moffett Field, CA:
National Aeronautics and Space
Administration.
5. Gander, P.H., Connell, L.J., Gregory, K.B.,
Miller, D.L., Rosekind, M.R., and Graeber,
R.C. (1996). Crew Factors in Flight
Operations: VIL Psychophysiological
Responses to Overnight Cargo Operations.
(Technical Memorandum 110380).
Moffett Field, CA: National Aeronautics
and Space Administration.
6. Broughton, R.J. & Ogilvie, R.D. (Eds.).
(1992). Sleep, Arousal, and Performance.Boston: Birkhauser.
7. Dinges, D.F. & Kribbs, N.B. (1991).
Performing while sleepy: effects of
experimentally-induced sleepiness. In T.H.
Monk (Ed.), Sleep, Sleepiness and
Performance, (pp. 97-128). Chichester:
Wiley.
8. Carskadon, M.A. & Roth, T. (1991). Sleep
Restriction. In T.H. Monk (F_,d.), Sleep,
Sleepiness, and Performance (pp.
155-167). Chichester, UK: John Wiley and
Sons, Ltd.
9. Zarcone, V.P. (1994). Sleep Hygiene. In
M.H. Kryger, T. Roth, and W.C. Dement
(E,ds.), Principles and Practice of Sleep
Medicine (2nd Edition) (pp. 542-546).
Philadelphia: W.B. Sauders Co.
10. Rosekind, M.R., Miller, D.L., Gregory,
K.B., & Dinges, D.F. (1995). Flight Crew
Sleep in Long-Haul Aircraft Bunk
Facilities: Survey Results. Sleep Research,
24, 112.
11. Folkard S. & Monk TH. (1979). Shiftwork
and Performance. Human Factors,
21:483-492.
12. National Transportation Safety Board.
(1994). Commuter Airline Safety
(NTSB/SS-94/02). Washington, DC. (NTIS
No. PB94-917004)
13. National Transportation Safety Board.
(1996). Annual Review of Aircraft
Accident Data. Washington, DC. (NTIS
No. PB96-145180) "
14. Rosekind, M.R., Co, E.L., Gregory, K.B.,
Miller, D.L., & Neff, D.F. (1997). A
Survey of Fatigue Factors in
Corporate/Executive Aviation Operations.
Sleep Research, 26, 213.
15. Sasaki, M., Kurosaki, Y., Mori, A., and
Endo, S. (1986) Patterns of Sleep-
Wakefulness Before and After
Transmeridian Flight in Commercial
Airline Pilots. In R.C. Graeber (Ed.) Crew
Factors in Flight Operations: IV. Sleep
and Wakefulness in International Aircrews.
(Technical Memorandum 88231). Moffett
Field, CA: National Aeronautics and Space
Administration.
20

_- Appendix A: Regional Survey
21


M..J
Please answer all questions as accurately as possible. Watch for specialinstructions for a question or set of questions.
A. GENERAL
1. Gender? r--'l r'-'lfemale male
2. Age? yr
3. Weight? lb
4. Height? ft in
5. In what time zone is your domicile? I""l I"-'l r"-I I'-"1 v---'l !7Eastern Central Mountain Pacific Hawaiian Alaskan
6. In what time zone do you live? !"-'-'1 I''1 I""1 I'--"1 I"'-I I--"1Eastern Central Mountain Pacific Hawaiian Alaskan
V-----q7. How long does it usually take you ! Ihr and
to travel from your home to your
assigned domicile?
min
8. What is the typical mode of I'-l'! I'--I
transportation from your home auto airplaneto your assigned domicile?
r----1other - specify
9. Do you currently hold another job(s) yes noin addition to your airline job? [] []
10. If you answered yes to #9 abovehow many hours do you spendat your additional job(s) in a typicalmonth?
hr
23
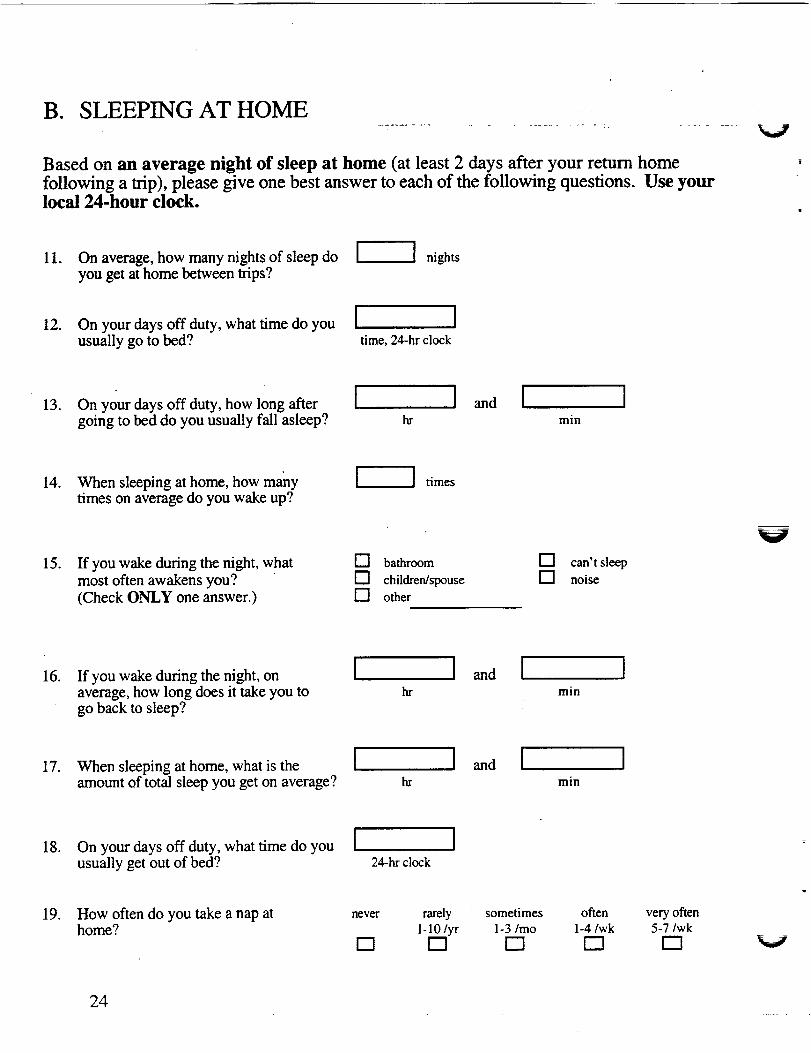
B. SLEEPING AT HOME
Based on an average night of sleep at home (at least 2 days after your return homefollowing a trip), please give one best answer to each of the following questions. Use yourlocal 24-hour clock.
11. On average, how many nights of sleep do [ I nights
you get at home between trips?
I I12. On your days off duty, what time do you I I
usually go to bed? time, 24-hr clock
13. On your days off duty, how long aftergoing to bed do you usually fall asleep?
I lan [ 1hr min
14. When sleeping at home, how many times
times on average do you wake up?
15. If you wake during the night, what [] bathroom []
most often awakens YOU? [] children/spouse []
(Check ONLY one answer.) [] other
can't sleep
noise
V
16. If you wake during the night, on L ] and
average, how long does it take you togo back to sleep?
hr
t !rain
I Imin
17. When sleeping at home, what is the [
amount of total sleep you get on average? hr
] and
18.
19.
On your days off duty, what time do youusually get out of bed?
How often do you take a nap athome?
[ ]24-hr clock
never rarely sometimes often very often
1-10/yr 1-3/mo 1-4/wk 5-7/wk
[] [] [] r"i r--i
24
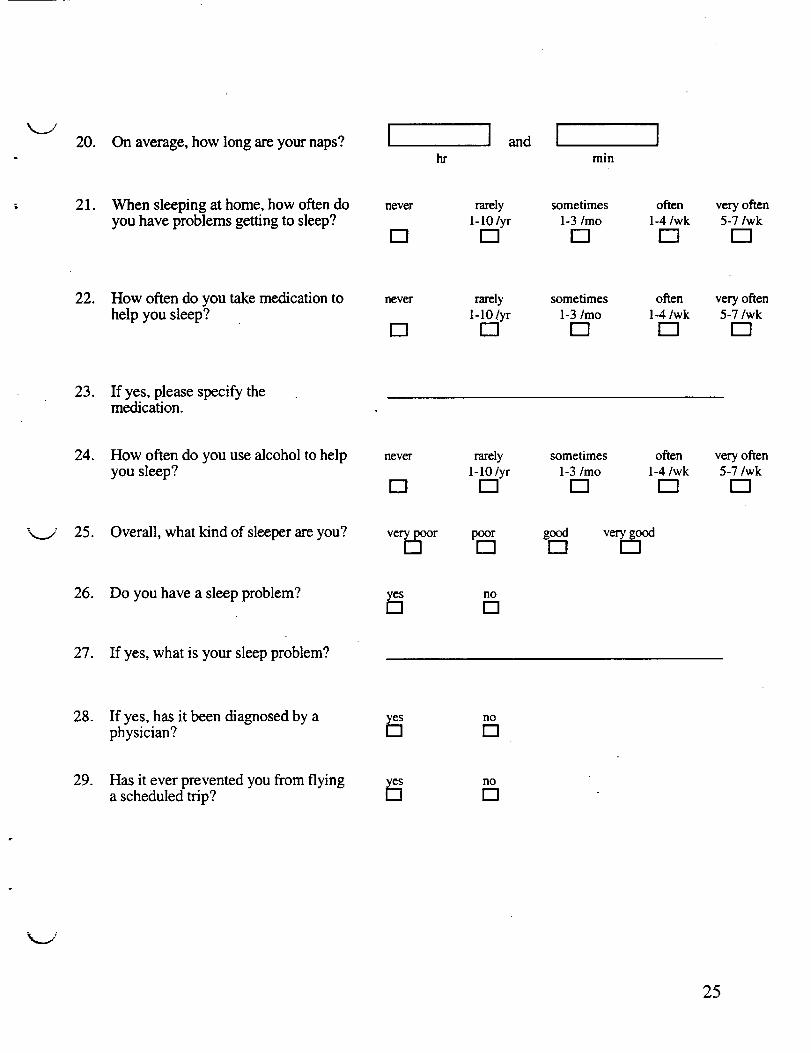
20. On average, how long are your naps? I lan ! 1hr min
21. When sleeping at home, how often doyou have problems getting to sleep?
never
[]
rarely
1-10/yr[]
sometimes1-3/mo
r-q
often
1-4/wk
D
very often5-7/wk
r--q
22. How often do you take medication tohelp you sleep?
never
[]
rarely
1-10/yr[]
sometimes
1-3/mo
[]
often
1-4/wk
r--q
very often5-7/wk
D
23. If yes, please specify themedication.
24. How often do you use alcohol to helpyou sleep?
never
[]
rarely
1-10 lyrr-q
sometimes
1-3/mo
r-q
often
1-4/wk
D
very often5-7/wk
D
"x..j 25. Overall, what kind of sleeper are you? very poor[]
poor
[]good[]
26. Do you have a sleep problem? yes
[]no
[]
27. If yes, what is your sleep problem?
28. If yes, has it been diagnosed by aphysician?
yes
[]no
[]
29. Has it ever prevented you from flyinga scheduled trip?
yes
[]no
[]
25
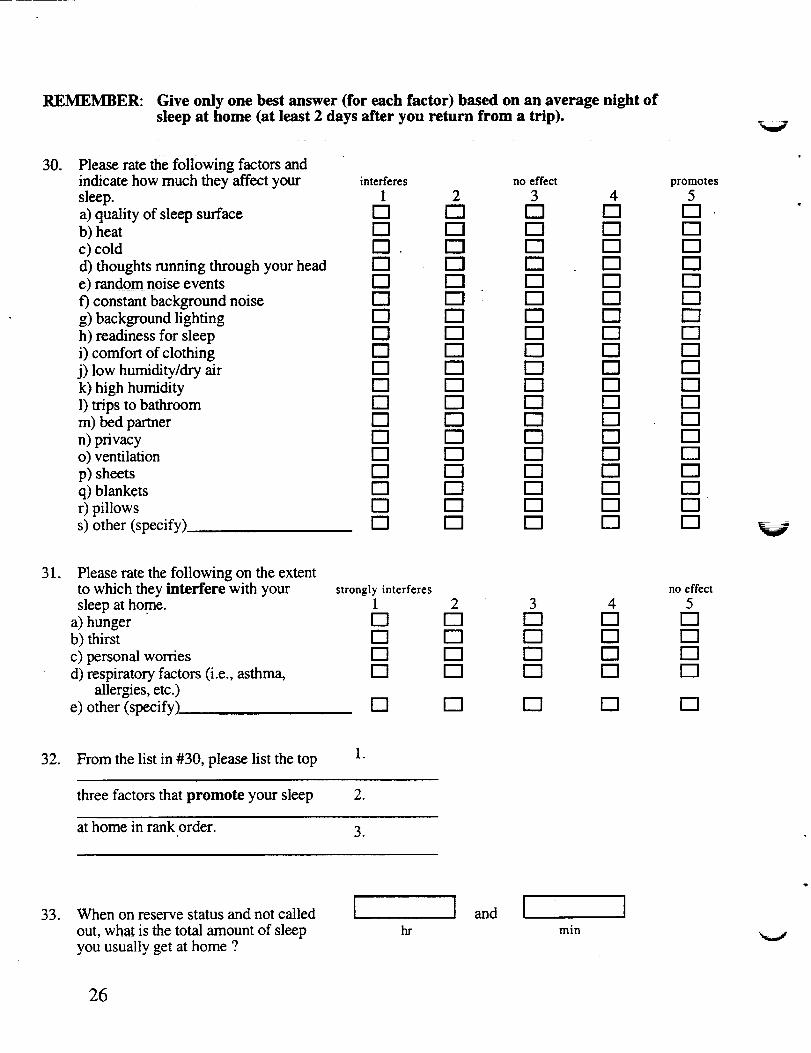
REMEMBER: Give only one best answer (for each factor) based on an average night ofsleep at home (at least 2 days after you return from a trip).
30. Please rate the following factors andindicate how much they affect your interferes no effectsleep. 1 2 3 4
a) quality of sleep surface [] [] [] []
b) heat [] [] [] []
c) cold [] • [] [] []
d) thoughts running through your head [] r-'! [] []
e) random noise events [] [] [] []
f) constant background noise [] [] []
g) background lighting [] r-'! [] []
h) readiness for sleep [] _ I"-I []
i) comfort of clothing [] [] [] []
j) low humidity/dry air [] [] [] []
k) high humidity [] [] _ []
1) trips to bathroom [] [] _ []
m) bed partner [] [] [] []
n) privacy [] [] [] []
o) ventilation [] [] r"l []
p) sheets [] [] [] []
q) blankets [] [] [] []
r) pillows [] [] [] []
s) other (specify). [] r-I [] []
promotes5
[][][][][][][]n[][]F-1[][][][]r'l[][][] V
31. Please rate the following on the extentto which they interfere with yoursleep at home.
a) hunger
b) thirst
c) personal worries
d) respiratory factors (i.e., asthma,allergies, etc.)
e) other (specify)
strongly interferes no effectI 2 3 4 5[] r-I I---I [] [][] [] [] [] [][] [] [] [] [][] [] [] [] []
[] [] [] [] []
32. From the list in #30, please list the top 1,
three factors that promote your sleep 2.
at home in rank order. 3.
33. When on reserve status and not called [
out, what is the total amount of sleepyou usually get at home ?
]an I Ihr min
26
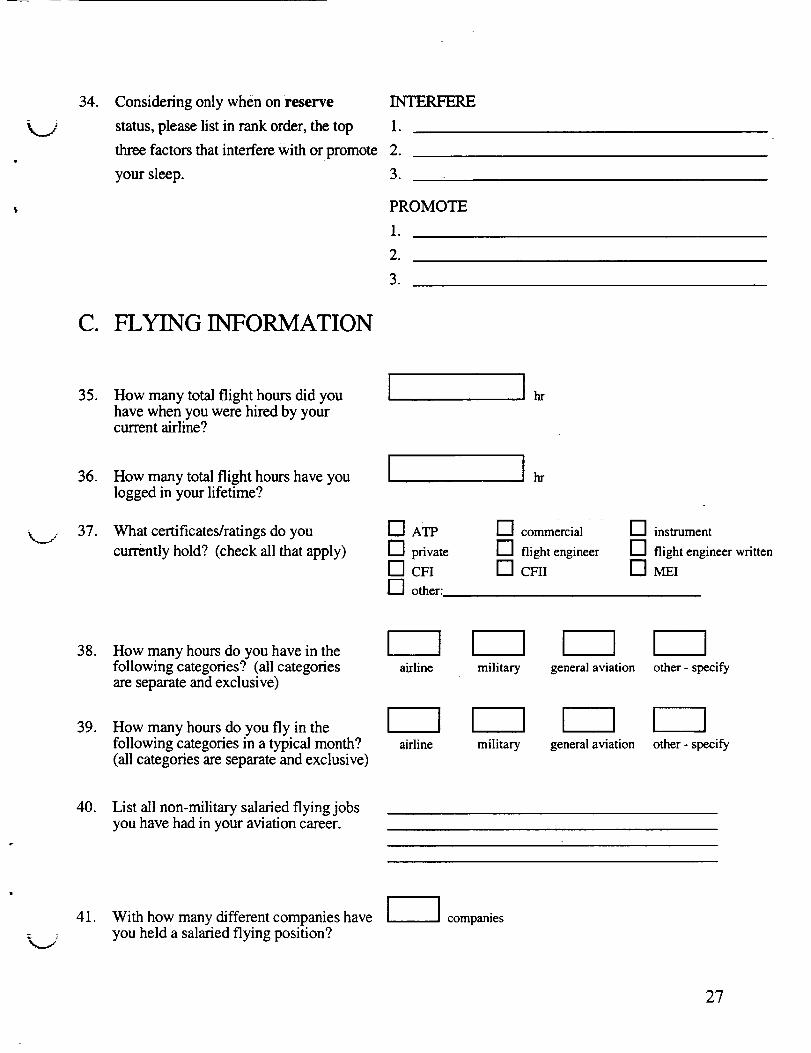
34. Considering only when on reserve
status, please list in rank order, the top
three factors that interfere with or promote
your sleep.
INTERFERE
1.
2.
3. _
PROMOTE
1.
2.
3.
C. FLYING INFORMATION
x.._.,,.-
35.
36.
37.
How many total flight hours did youhave when you were hired by yourcurrent airline?
How many total flight hours have youlogged in your lifetime?
What certificates/ratings do you
currently hold? (check all that apply)
hr
hr
i"] ATP
[_ private
["] CFI
'"]other:
[-'1 commercial
i'-] flight engineer
['7 CFII
["] instrument
["1 flight engineer written
1-'1 ram
38. How many hours do you have in thefollowing categories? (all categoriesare separate and exclusive)
airline military general aviation other- specify
39. How many hours do you fly in thefollowing categories in a typical month?(all categories are separate and exclusive)
airline military general aviation other - specify
40. List all non-military salaried flying jobsyou have had in your aviation career.
41. With how many different companies haveyou held a salaried flying position?
companies
27

42. List all company aircraft (make andmodel) that you are currently flying.
1 i iI I 1I ! 1
43. How long have you been employed
by your present airline?
yr and mo
4, Under which of the following FARParts do you currently fly in your job?(check all applicable)
Part 121 []Part 135 []
Part 135 cargo only DPart 91 []
45. What is your hourly wage with yourcurrent airline?
J hourly
46. What is your usual monthly income from [ ] usual monthly
your current airline position?
47. What is your flightdeck position? . F/O S/O or F/Er---'l r----1
V
Answer according to the flying done ONLY for your regional airline job within the past year.
48. How many hours of actual IFR do youfly in a month (not just filed flight plans,but actual conditions)?
hr hr
typical fewer more
hr
49. What is the duration of a flight delay? ["_ min [-"-'q min [-"'_ min
typical shortest longest
50. How frequently do ATC delays occur? _'_ perwk
average
per wkshortest
per wk
worst case
V
- 28
51.
52.
How frequently do delays occur dueto weather? typical
How frequently do company-mandated
flight delays occur? typical
per wk
per wk
shortest
fewer
per wk
per wk
longest
more
per wk
per wk
53. How frequently do mechanical delaysoccur?
D per wk
typical
per wkfewer
per wk
more
54. How frequently do you fly into ahigh density operating area?
per day
typical
per dayfewer
per daymore
55. How frequently do you fly into anon-radar environment?
per wk
typical
D per wk
leastper wk
most
x._,/
56. Do you currently fly reserve lines?
57. Which type of reserve do yo u currentlyfly?
yes no[] []
[] on call at home
[] airport reserve
58.
59.
What percentage of your flight hoursfor the company is reserve time in amonth?
How many hours prior to report timeare you notified while on reserve?
D hr
typical shortest
hr
highest
hi"
longest
:= j
60. When called out of reserve status,
how much sleep do you usuallyget before reporting for duty?
61. How often is your 24-consecutive-hour
required rest period assigned after thefact (i.e., you receive a call indicatingthat the previous 24-hour-duty-freeperiod was your required rest period)?
hr and
D per mo
typical
min
per mobest case
per moworst case
29

62. What are your aspirations foradvancement in your current airline?
63. What are your long-term aviation
career goals?
D. DUTY(Please answer the following questions using your logbook or paysheet.)
64. How many duty days do you fly in days
a month? typical least
days days
most
65. What is your number of scheduledflight hours per month?
hi"
typical least
hr
most
hr
66. What is your number of actual flight h r
hours per month? typical least
hi-
most
hi"
67. How many flight segments do youfly in a duty day? typical least most
68. How much time do you have onthe ground between flights(time between blocking in and out)?
hi"
typical least
hi"
most
hr
69. On how many duty days in a monthdoes your actual flying time exceed8 hours?
typical least most
70. How often does your company readjust neverschedules to account for actual block times? []
rarely
Doccasionally
[]frequently
r-1
30

71. During a six month period, how manytimes do you ferry a plane under Part 91after already flying 8 hours underPart 121 and/or Part 135?
times
72. During a typical year, how many timesdo you have a check ride or training flightunder Part 91 after already flying 8 hoursunder Part 121 and/or Part 135?
times
73. During the past year, how many timeshave you exceeded the 7-consecutive-day flight time limit?
D times
(Part 121-30 hr)
D times
(Part 135-34 hr)
74. What is the duration of your duty day? typical:
shortest:
longest:
hr and
hr and
hr and
min
min
min
75. What is the longest duty day you havehad in your airline career?
hr and rain
76. How many times a month is your dutyday extended to keep your regulatedflight time within limits?
typical best case worst case
77. In a typical month of flying, how manytimes do you stay in the followingaccommodations during your layoverrest periods?
hotel trailer other: specify
78. During the past month, how many
times have you reported for duty
during each of the following time
periods?
000 -
0400-
0800 -
0359 hr
0759 hr
1159 hr
1559 hr
1959 hr
2359 hr
31
79. How many times are you scheduled forreduced rest in a month? typical
times
least
times
most
times
80. How many times are you asked to takeunscheduled reduced rest in a month?
times
typical least
times times
most
81. When asked to take unscheduled reducedrest, how many times in a typical monthis your rest period reduced to thefollowing number of hours?
8hr
times
9hr
times
82. In a month of flying, how manyduty days include continuous dutyovemights (CDOs)?
typical least most
83.
84.
During a continuous duty overnight,
how long is the scheduled ground time
("stand-up" portion)?
How much time is available for sleep
during the "stand-up" portion of the
CDO?
typical:
best case:
worst case:
typical:
best case:
worst case:
hr
hr
hr
hr
hr
and
and
and
and
and
and
min
rain
min
rain
min
min
V
85. How often do you sleep during the"stand-up" portion of a CDO?
never
[]occasionally
D freq_ntly
86. Which of the following accomodationsdoes your company provide for CDOs(check as many as applicable)?
[] hotel[] trailer
[] other: specify.
87. In a typical month of flying, how manytimes do you stay in the followingaccomodations during the "stand-up"portion of a CDO?
hotel trailer other: specify
88. Please rate the accomodations. very poor[]
pOOT
DfairD
good[]
very goodD
V
32
k..j89.
90.
What are the good qualities of theaccomodations?
What are the bad qualities of theaccomodations?
91. How much total sleep do you get
during the "stand-up" portion of a CDO?
typical:
best case:
worst case:
and
and
and
min
min
min
92. During a typical month, how many
times do you ferry a plane during the"stand-up'portion of a CDO?
times
M...:
93. Have you ever flown the final segmentof a CDO without getting any sleep atthe out-station?
yes[]
no
[]
94. How long is the scheduled rest period
between consecutive CDOs?
typical:
best case:
worst case:
__ hr
hr
hr
and
and
and
rain
min
min
95. How much time is available for
sleep between consecutive CDOs?
typical:
best case:
worst case:
hr and
hr and
hr and
min
min
min
96. How much total sleep do you get
between consecutive CDOs?
typical:
best case:
worst case:
hr and
hr and
hr and
min
min
min
M.,,,"
33
E. FATIGUE
97. Describe the worst work day you'vehad while flying regionals, includingthe specific factors that made it the worst.
98. In your opinion, to what extent isfatigue a concern in regional flightoperations?
not at all[]
minor
[]moderate
[]serious
[]
99. Is crew fatigue a common occurrencein flight operations?
yesD
no
[]
100. When crew fatigue occurs, howsignificant a safety issue is it?
101. In what w_ays does fatigue affect
your flight performance?
not at allr--i
minor[]
moderater-"l
seriousr--1
v
102. When your flight performance isaffected by fatigue, which phase offlight performance is most affected(choose only ONE answer)?
taxi
takeoff
el'll'OUt6
DDD
descent
landing
r--1rl
103. List three strategies that you use for
coping with fatigue ir_rank order.
PRETRIP:
1.
2.
3.
INFLIGHT:
1.
2.
3.
34
104. What three changes would you maketo reduce fatigue in regional airlineoperations? List the most importantfirst.
.
2.3.
105. Have you ever "nodded off" duringa flight?
no
[]
106. Have you ever been on a flight wherearrangements were made for one of thepilots to sleep during the leg?
no
[]
35
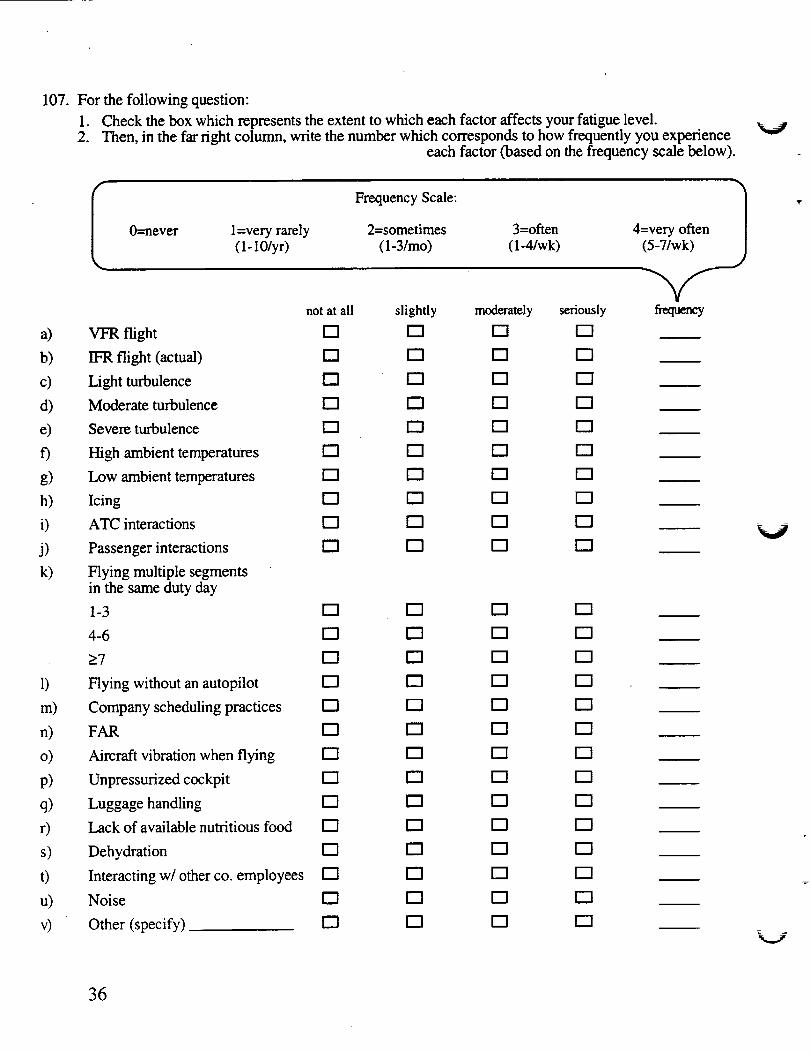
107. For the following question:
1. Check the box which represents the extent to which each factor affects your fatigue level.2. Then, in the far right column, write the number which corresponds to how frequently you experience
each factor (based on the frequency scale below).
a)
b)
c)
d)
e)
f)
g)
h)
i)
j)
k)
I)
m)
n)
o)
P)
q)
r)
s)
t)
u)
v)
I Frequency Scale:0=never l=very rarely 2=sometimes
(1-10/yr) (1-3/mo)
3=often(1-4/wk)
not at all slightly moderately
VFR flight [] [] []
IFR flight (actual) [] [] []
Light turbulence [] [] []
Moderate turbulence [] [] []
Severe turbulence [] 1"'1 i"'1
High ambient temperatures [] [] []
Low ambient temperatures [] [] []
Icing [] [] []
ATC interactions [] [] []
Passenger interactions [] [] []
Flying multiple segmentsin the same duty day
1-3 [] [] []
4-6 [] [] []
>7 [] [] []
Flying without an autopilot [] [] []
Company scheduling practices [] [] []
FAR [] [] []
Aircraft vibration when flying [] [] []
Unpressurized cockpit [] [] []
Luggage handling [] [] []
Lack of available nutritious food [] [] []
Dehydration [] [] []
interacting w/other co. employees [] [] []
Noise [] [] []
Other (specify) [] [] []
seriously
r-q
r-1
r-i
r--1
r--1
r-I
r--1
D
D
r--1
r--1
r-q
D
r--1
r--1
r--I
r-i
r-q
D
r--1
r--1
r-1
r-i
4=very often 1
frequency
36
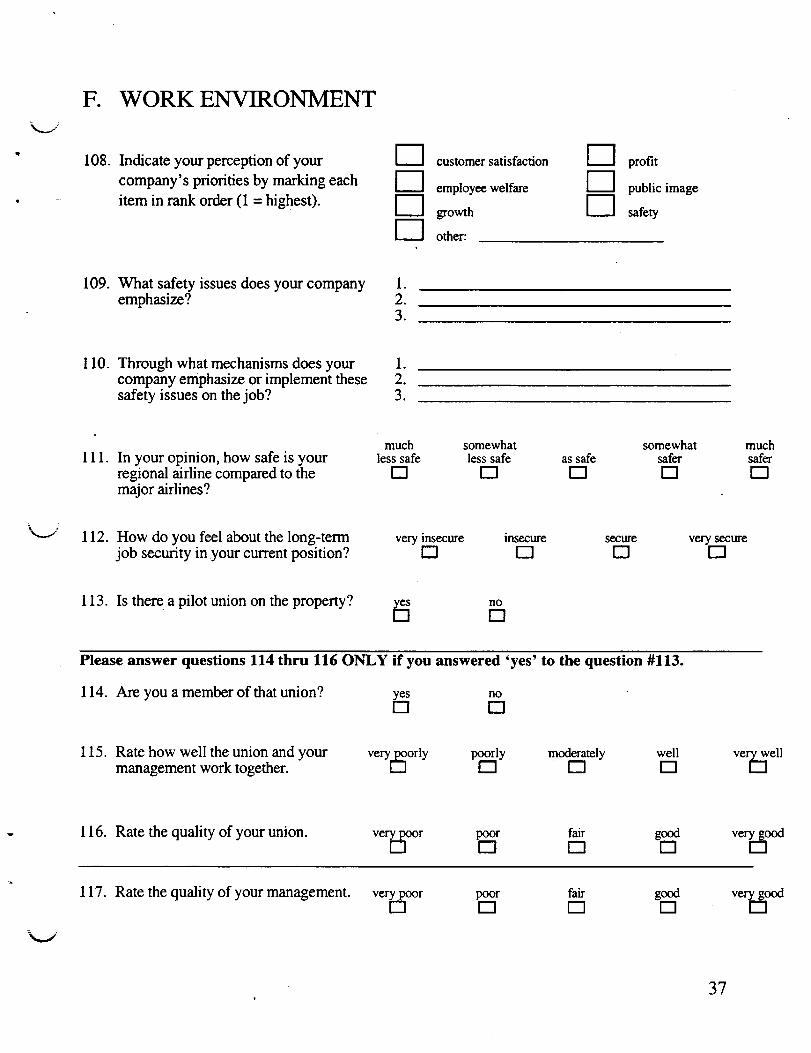
F. WORK ENVIRONMENT
108. Indicate your perception of your
company's priorities by marking each
item in rank order (1 = highest).
DDD
customer satisfaction
employee welfare
growth
other:
r-q
profit
public image
safety
109. What safety issues does your companyemphasize?
.
2.3.
110. Through what mechanisms does yourcompany emphasize or implement thesesafety issues on the job?
I.
2.3.
much somewhat111. In your opinion, how safe is your less safe less safe as safe
regional airline compared to the [] I"'1 r"lmajor airlines?
somewhatsafer[]
muchsaferr--l
x,_...-- 112. How do you feel about the long-termjob security in your current position?
very insecure insecure secure very secure[] r-q [] r--1
113. Is there a pilot union on the property?___ no[]
Please answer questions 114 thru 116 ONLY if you answered 'yes' to the question #113.
114. Are you a member of that union? yes no[] []
115. Rate how well the union and your very poorly poorly moderately wellmanagement work together. [] !"'1 [] []
very well
116. Rate the quality of your union, very poor poor fair good[] _ _ []
very goodr-1
117. Rate the quality of your management, very poor poor fair good[] D _ []
very good[]
37
118. yes no[] []
119.
Does your company offer anytraining that addresses fatigue issues?
If you answered "yes" to the abovequestion, please elaborate.
V
38

M.../
MANAGEMENT
Please answer the following questions ONLY if you hold a management position in
your company.
l° For each of the applicable categories,check the box and write the number
of flight hours you have logged.
[] airline
[] military
[] general aviation
[] other: specify'[] not applicable
2. Are you involved in flight schedulingfor your company? ___ no[]
. If yes, please rank the following categorieswith regard to their priority in yourscheduling decisions (1=highest priority).
__.a) number of legs flown by pilot
__b) pilot's duty time for the work day
__.c) takeoff times during the night/early morning
__d) availability of equipment
__e) maximizing net income
_f) other:
•. 39
Form ApprovedReport Documentation Page OM_ NO.0704-01_
pubNc_oorl_g boom fo¢tli co,_¢tk_ of i_,_a_z_ is intimated Io ,.vocagl I Izo_rp_ rupome, _ _ _ _ _ _, _ _ _ _. _ _ _ _ _n_d, and ¢mrc_ling ar,d _tt_ _ ofi,don'mtim S_mdcommentsrtga_ t_ lan'am tm_rab or _ _ _ _ _ _ of _ _ _ _ _ _ _ _W=l_ng_ i.kmdq_ms S_, Diroc_te lot INumatio_ O_lims ¢.¢1R_tb, 1215 Jo_rso_ Davis H_._ 1_, _, VA _ _ b h _ _ _ z_ _ _R,d==i_P_ (0704-01_.W=h_. DC_OS03.
1.AGENCYUSEONLY(Leaveb/ank) 2.REPORTDATE
October, 1999
4.TITLEANDSUBTITLE
Crew Factors in Right Operations X[: A Sm'vey of Fatigue
Factors in Regional Airline Operations6.AUTHOR(S)
Elizabeth L. Co, Kevin B. Gregory, Julie M. Johnson, and
Mark R. Rosekind
7. PERFORMINGORGANIZATIONNAME(S)ANDADDRESS(ES)
NASA Ames Research Center
Moffett Field, California 94035-1000
9.SPONSORING/MONITORINGAGENCYNAME(S)ANDADDRESS(ES)
National Aeronautics and Space Administration
3. REPORTTYPEANDDATESCOVERED
Technical Memorandum
5. FUNDINGNUMBERS
548-30-32
REPORTNUMBER
]H-003
10.SPONSORING/MONITORINGAGENCYREPORTNUMBER
NASA/TM--1999-208799
11.SUPPLEMENTARYNOTES
Point of Contact: David Neri, Ames Research Center, M/S 262-4, Moffett Field, CA 94035
(650) 604-065812A.DISTRIBUTiOWAVAILABILI'FYSTATEMENT 12B.DISTRIBUTIONCODE
Subject Category: 52-03 Distribution: Public
Availability: NASA CASI (301) 621-039013.ABSTRACT(Maximum200words)
This report is the eleventh in a series on the physiological effects of flight operations on flight crews. A119-question survey was completed by 1,424 flight crewmembers from 26 regional carriers to identifyfactors contributing to fatigue in regional airline operations. Eighty-nine percent of crewmembersidentified fatigue as a moderate or serious concern with 88% reporting that it was a common occurrenceand 92% reporting that, when it occurs, fatigue represents a moderate or serious safety issue. However,86% reported they received no company training addressing fatigue issues. Identified fatigue factorsincluded multiple flight segments, scheduling considerations, varying regulations, and others. The twomost commonly cited fatigue factors regarded flying multiple (more than four) segments. Schedulingfactors accounted for nine of the ten most common recommendations to reduce fatigue in regional
operations. Differing requirements among regulations were cited as contributing to fatigue. Otheridentified factors were the flight deck environment, automation, and diet. The data suggested specificrecommendations, including education of industry personnel about fatigue issues and examination ofscheduling practices. Education plays a critical role in any effort to address fatigue. Analyzingscheduling practices and identifying potential improvements may result in reduced fatigue as well as other
benefits to operations.
14.SUBJECTTERMS
Fatigue, Sleep, Duty and rest, Scheduling, Regional airlines
17. SECURITYCLASSIFICATIONOFREPORT
UnclassifiedNSN 7540-01-280-5500
18.SECURITYCLASSIRCATIONOFTHISPAGE
Unclassified
19.SECURITYCLASSIRCATIONOF ABSTRACT
Unclassified
15.NUMBEROFPAGES
3916.PRICECODE
A03
20. UMITATIONOFABSTRACT
UnlimitedStandardForm298 (Rev. 2-89)Prescribed by ANSI Std. Z-39-18298-102
V
V