Embed Size (px)
Citation preview

CREEP LIFE PREDICTION OF P91 STEEL FROM STRESS RELAXATION TESTS
Krishna Guguloth1, J. Swaminathan1 1Materials Science and Technology Division,CSIR- National Metallurgical Laboratory, Jamshedpur-831 007, India
R. N. Ghosh2 2Department of Metallurgical and Materials Engineering, Indian Institute of Technology, Kharagpur-721 302, India
Email:[email protected], [email protected]
Abstract Reliable creep life prediction of engineering materials needs long hours of testing over a range of stress and temperature. There have been considerable efforts to develop alternative methods to cut down the test duration. Short term stress relaxation test (SRT) is one of the possible options. Recent works suggest that if stress relaxation tests are done at a stress a little higher than the yield stress of the material the stress drops within a span of 10 to 20 hours to a level where most of the creep tests are done. From such tests material parameters describing the stress/temperature dependence of the minimum creep rate of the material can be established. Since the minimum creep rate has a definite correlation with the time to rupture this could possibly be a method worth exploring for quicker estimation of creep life of engineering materials. However there is very little experimental data to establish the correlation between the parameters like stress exponent (n) and activation energy (Q) derived from stress relaxation tests with those obtained directly from the conventional creep tests. The work presents creep as well as stress relaxation data on P91 steel obtained from tests performed on specimens made from the same stock of steel. The Q & n obtained from stress relaxation tests were found to be a function of the total strain at which the tests were done. These were found to be 355kJ/mol and 7.3 respectively at a total strain of 1.8%. The Q & n obtained from the creep tests are 597kJ/mol and 9.9 respectively. This suggests that stress relaxation is likely to overestimate the creep rate at a given stress and temperature. Nevertheless there is a definite correlation between the two. The relation between the true creep rate { and that obtained from SRT . % and may be expressed as follows:
0.088 . %.
(1) The work therefore suggests that if stress relaxation tests are to be used for creep life prediction the estimated creep rates must be converted. The conversion factor is a function of the strain at which the stress relaxation tests are done.
1. INTRODUCTION Several new grades of high temperature materials have been introduced over the last three decades to raise the operating temperature of the new generation of energy efficient power plants so that the emission of green house gases per MW of power generated can be reduced. This includes ferritic steels such as P91, P92, E911 and many others having temperature capability as high as 625°C. There is a distinct advantage in the use of such grades in the high temperature sections of a power plant instead of austenitic steel having better high temperature capability. It has lower coefficient of thermal expansion, higher thermal conductivity and lower elastic modulus. As a result ferrtic grades are more resistant to the problems associated with higher temperature gradient across thicker sections. However unlike older grades like P22 long term creep strain time data particularly at lower stresses on the relatively new grades of ferritic steel are not readily available. Therefore life prediction of such components may often be a challenging task. There have been some efforts in the recent past to explore the possibility of creep life prediction from the stress versus time plot obtained during a stress relaxation test (SRT) where the test specimen is loaded to a fixed level of initial stress (σ0) at a specified loading rate and thereafter the total strain (ε) is held constant. The strain consists of two parts elastic strain (εe) and plastic or creep strain (εc). Since the total strain (ε) is held constant the relation between the two strain rates can be described as follows:
0 (2) The rate of accumulation of creep strain in engineering materials is a function of both stress (σ) and temperature (T). This is often described by Norton’s equation:
(3)
where Q is the activation energy, R is the universal gas constant, A and n are the two material constants. On the basis the two equations and the fact that
where, E is the elastic modulus, it is possible to derive an equation that describes how stress (σ) would change with time. This is given by
/ (4)
The negative sign suggests that the stress deceases with time. The test at a given temperature is represented in the form of a stress (σ) versus time (t) plot. This can be used to estimate the rate at which the stress keeps dropping as a function of stress (σ). Therefore from such a test using equation (4) it is in principle possible to estimate the material parameters describing creep strain accumulation in the material. In short term stress relaxation test may be visualized as a creep test under a situation where the stress keeps decreasing whereas a conventional creep test is performed under a constant load. The rate at which the stress drops during the test at a constant temperature is a strong function of stress. If such a test is performed at an initial stress, a little higher than the yield strength of the material, the stress soon drops to a level where most of the creep tests are done. Therefore it is argued that it may be used as one of the accelerated testing

methods to evaluate long term rupture strength of materials where such data are not readily available. It is claimed that the prediction on the basis of such tests is satisfactory for a range of Ni base alloys and steel. However in most of the cases the creep data used for validation were not necessarily obtained from the same stock of the alloy. Therefore a planned investigation was taken up where a set of samples made from the same test bar was used to evaluate both high temperature creep and stress relaxation behavior of P91 steel. Table 1 gives the composition of the steel used in this work. Apart from 9%Cr and 1%Mo it has a small amount of V and Nb to help retain Mo in solid solution so that its creep strength is much higher than that of the well known 9Cr1Mo (P9) steel. P91 steel was first developed by Oakridge National Laboratory during 1970s and later incorporated in ASME boiler code during mid 1980s. This is now one of the most popular steels used for steam pipes and headers of super-critical power plants. The paper presents creep and stress relaxation test data on this steel over a range of temperature and attempts to establish a correlation between the strain rates predicted from a stress relaxation test with that directly obtained from a creep test. 2. EXPERIMENTAL
2.1 Material The base material was received in the form of plate of size 240 mm × 138 mm × 12 mm. This was supplied under normalized (at 1080C for 1hr) and tempered (760C for 2hr) condition. The chemical composition of the investigated steel conformed to P91 steel containing Vanadium and Niobium; Table 1. Standard creep and stress relaxation test specimens were machined from the same plate. They all had identical orientation with respect to the rolling direction. Table 1: Chemical composition of the modified 9Cr-1Mo (P91) steel examined
Element C Mn P S Si Cr Mo V Nb Ni Al Fe Wt. (%) 0.08 0.39 0.02 0.01 0.50 9.4 1.0 0.25 0.09 0.13 0.23 Bal 2.2 Creep test Creep tests were performed on Mayes (ASTM E139) constant load creep testing machines having automatic lever leveling system and provisions to apply a maximum load of 30kN. Standard cylindrical test specimens having 6 mm diameter and 50 mm gauge length were used. Creep tests were performed at different loads at three temperatures (550, 600 and 625oC). Specimens temperatures were monitored by a set of two calibrated thermocouples (Pt/Pt-13%Rh) fitted at the two ends of the gauge length. Sample temperature was maintained and controlled within ±3oC in entire gauge length portion using a three zone closed loop furnace with independent temperature controller. Deformation was measured with the help of a pair of calibrated linear variable differential transducer (LVDT) mounted outside the furnace on a set of extension

rods fixed on the specimens. Tests were run till rupture. Typical creep curves are shown in Fig.1.
2.3 Stress relaxation test Stress relaxation tests were performed at 550, 600, and 625oC on ±30 kN servo-electric Instron (1380 model) material testing system. Specimens having 5 mm diameter and 30 mm gauge length were used. A pair of ceramic rods was mounted across a distance of 12.5 mm on the specimen gauge length to facilitate strain measurement. Specimens were heated using a three zone split furnace with Eurotherm (810) temperature controller. Temperature was monitored and maintained within ±3oC. Once the temperature of the specimen stabilizes it was pulled at a constant strain rate of 1×10⁻³ s-1 till a specified strain. There after the cross head was held stationary and the stress was monitored as a function of time till 20 h. During the relaxation stage of the test, the total strain was held constant. It was monitored by an extensometer to check if it was indeed so. These tests were performed at predetermined strains: 0.8 percent and 1.8 percent. A typical stress vs. time curve of 1.8% is shown in Fig.2. 2.4 Metallography Metallographic examination was carried out on as-received, as well as, after creep and stress relaxation tests to evaluate and compare the effect of thermal exposure. Thin foil specimen were prepared from as received, crept and stress relaxation test sample for transmission electron microscopy (TEM). Microstructures of as received sample are shown in Fig.7.
2.5 Hardness Test Hardness test was performed on as received and tested specimens using Vickers hardness testing machine model Reicheter Stiefel Mayer UH-3. Measurements were taken on polished surface and using diamond indenter with 30kg load and a dwell time of 10s. The hardness of two regions of the specimens (the shoulder and the gage) is shown in Fig.10 as function of thermal exposure expressed in terms of Larson Miller parameter (LMP) [1]. 3. RESULTS AND DISCUSSION 3.1 Creep test Creep rupture tests were performed at three different temperatures (550°, 600° and 625°C) and over a range of stress levels (80-220MPa). Figure 1 shows a set of creep curves of P91 steel at two different temperatures. Most of these have three distinct stages; primary, secondary and tertiary. From these plots the minimum creep rates were estimated. These are shown in Fig.3 as log (strain rate) versus log (stress) at three different temperatures. Least square analysis shows that the trend can be represented by three parallel straight lines having identical slopes. It indicates that the minimum creep rate can described by equation (3) and gives a set of material constants for P91 steel (Table 2). The
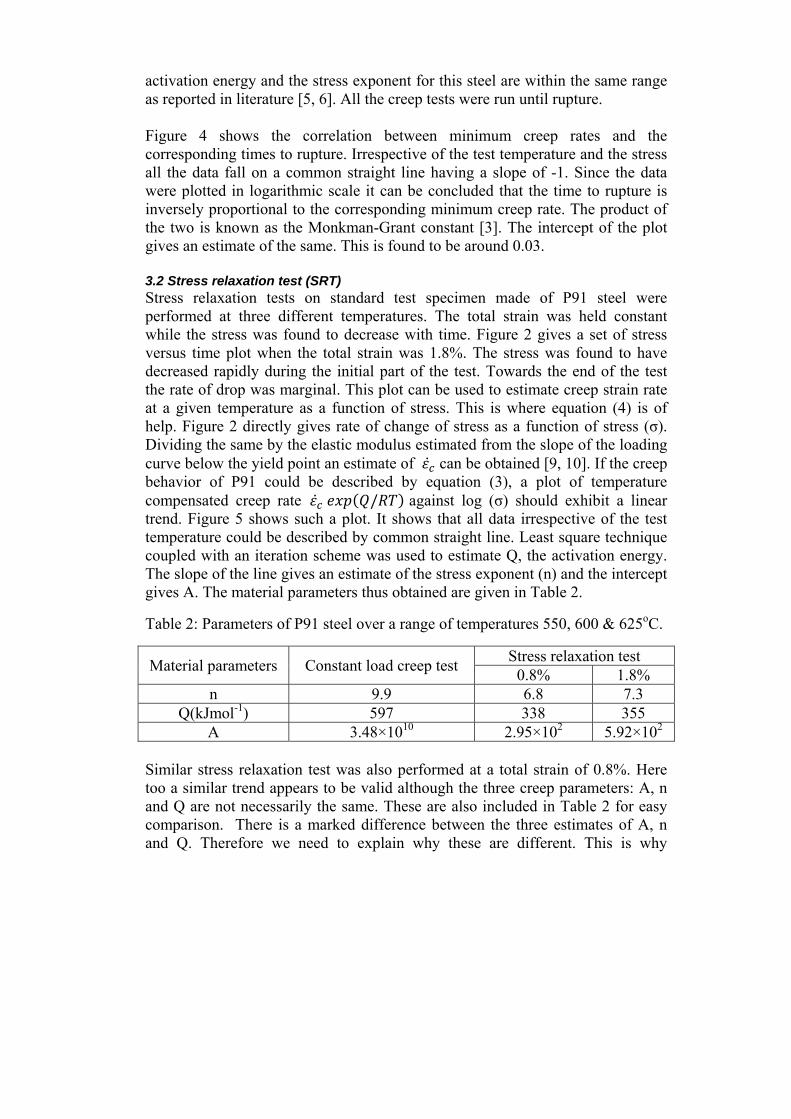
activation energy and the stress exponent for this steel are within the same range as reported in literature [5, 6]. All the creep tests were run until rupture. Figure 4 shows the correlation between minimum creep rates and the corresponding times to rupture. Irrespective of the test temperature and the stress all the data fall on a common straight line having a slope of -1. Since the data were plotted in logarithmic scale it can be concluded that the time to rupture is inversely proportional to the corresponding minimum creep rate. The product of the two is known as the Monkman-Grant constant [3]. The intercept of the plot gives an estimate of the same. This is found to be around 0.03. 3.2 Stress relaxation test (SRT) Stress relaxation tests on standard test specimen made of P91 steel were performed at three different temperatures. The total strain was held constant while the stress was found to decrease with time. Figure 2 gives a set of stress versus time plot when the total strain was 1.8%. The stress was found to have decreased rapidly during the initial part of the test. Towards the end of the test the rate of drop was marginal. This plot can be used to estimate creep strain rate at a given temperature as a function of stress. This is where equation (4) is of help. Figure 2 directly gives rate of change of stress as a function of stress (σ). Dividing the same by the elastic modulus estimated from the slope of the loading curve below the yield point an estimate of can be obtained [9, 10]. If the creep behavior of P91 could be described by equation (3), a plot of temperature compensated creep rate / against log (σ) should exhibit a linear trend. Figure 5 shows such a plot. It shows that all data irrespective of the test temperature could be described by common straight line. Least square technique coupled with an iteration scheme was used to estimate Q, the activation energy. The slope of the line gives an estimate of the stress exponent (n) and the intercept gives A. The material parameters thus obtained are given in Table 2.
Table 2: Parameters of P91 steel over a range of temperatures 550, 600 & 625oC.
Material parameters Constant load creep test Stress relaxation test
0.8% 1.8% n 9.9 6.8 7.3
Q(kJmol-1) 597 338 355 A 3.48×10¹⁰ 2.95×10² 5.92×10²
Similar stress relaxation test was also performed at a total strain of 0.8%. Here too a similar trend appears to be valid although the three creep parameters: A, n and Q are not necessarily the same. These are also included in Table 2 for easy comparison. There is a marked difference between the three estimates of A, n and Q. Therefore we need to explain why these are different. This is why

hardness measurement and microstructural examination were done on samples before and after test. 3.3 Hardness test Hardness gives a fair idea about the average microstructure of most materials. Figure 10 gives a plot of hardness of creep ruptured samples as a function of a combined time-temperature parameter which a measure of net thermal exposure [1]. It includes data from two distinct regions of the sample: the shoulder and the gauge. The trend suggests that hardness decreases with increasing thermal exposure. However the hardness of the gauge portion is always lower than that of the shoulder. This is because the stress in the gage portion is much higher than that of the shoulder. This suggests that evolution of microstructure during the creep test is a function of both stress and thermal exposure. Figure 11 gives a comparison of hardness of the gauge portion of samples subjected to creep and stress relaxation test at three different temperatures. The hardness of the creep tested samples is significantly lower than that of SRT. This suggests that the microstructure of the two should also be different. Since material parameters describing creep behavior of steel is a function of its microstructure, the parameters estimated from SRT at two different strains are not the same. 3.4 Transmission Electron Microscopy (TEM) P91 is an air hardening martensitic grade of steel. It is used in normalized and tempered condition. Figure 7 gives a TEM image of the as received sample. It has elongated lath martensite structure, having fine precipitates (grey and dark color of elliptical and round shape) within the laths and along the grain boundaries. The martensite laths have high dislocation density and there are signs of formation of sub-cells within the laths. Figure 8 is a TEM image of a creep tested specimen (at 625oC/80MPa). It shows coarsening of precipitates. It has both coarse as well as a few fine sub-grains and randomly distributed fine and coarse precipitates lying along the lath boundaries. Figure 9 gives an image of a sample subjected to SRT at 625oC/1.8 % strain. It shows elongated martensite lath structure with mostly very fine precipitates of V(C, N) and NbC [11]. A few of these are a little coarser. Dislocation density too appears to be high. A comparison of the micro-structural features of the two samples suggests that the extent of degradation in creep tested specimens is much more than that in samples that were subjected to SRT. Coarsening of precipitates, dislocation rearrangement, coarsening of sub-grains or laths is responsible for the loss of load bearing capacity of steel during prolonged high temperature exposure. Therefore it also reflects as loss of strength or hardness. This the reason why the

estimated creep rate from SRT can never be expected to be the same as those obtained from creep tests.
3.5 Creep strain rate prediction from SRT: an empirical approach: Although SRT may not give a direct estimate of creep strain rate in the case of P91 steel it worth exploring if there is any possibility of getting a rough estimate of creep rate using an empirical conversion factor. Figure 5 gives a plot of creep rates obtained directly from creep tests with those estimated from an analysis of SRT tests data if ε = 1.8%. Such plot may be useful in converting the apparent creep rates estimated by SRT into an approximate estimate of minimum creep rate which in turn can give an estimate of time to rupture using Monkman-Grant relation. The following empirical relation the true creep rate { and that obtained from SRT . % and may be expressed as follows:
0.088 . %.
(5) The above study therefore suggests that although SRT is reported to have given reasonable estimates of minimum creep rate for several engineering materials including Ni base alloys [7, 8], it appears that in the case of P91 steel the predictions differs widely. This is possibly associated with its micro-structural instability. As received P91 steel has high initial dislocation density [11]. With creep exposure it decreases giving rise to an extended period of primary creep. The duration of SRT tests is too short to have any significant structural change. Therefore SRT is likely to give an estimate of creep rate corresponding to higher dislocation density [5, 6]. Since creep rate of a material is directly proportional to its dislocation density SRT is likely to overestimate its creep rate.
4. CONCLUSIONS
On the basis of the creep and stress relaxation tests performed on samples made from the same stock of P91 steel the following conclusions may be drawn.
1. Minimum creep rate of P91 steel over a wide range of stress and temperature can be represented by Norton’s power law with Q = 597 kJ/mol & n = 9.86.
2. Assuming power law creep to be valid during a stress relaxation test it is possible to get an estimate for Q and n. However these are not the same as those obtained from creep tests. The magnitudes of Q and n depend on the magnitude of total during SRT.
3. The difference in the estimates of Q & n can be attributed to the difference in the micro-structural change that takes place during creep and stress relaxation tests.
4. The creep rates predicted from SRT is significantly higher than obtained directly from constant load creep tests.
5. In spite of these limitations empirical relations can be derived so that an approximate estimate of creep rate can be obtained from SRT.

ACKNOWLEDGEMENT I would like to thank Mr.S.C.Bose has given valuable suggestion to do this work during his at NML, Jamshedpur. REFERENCES
[1] F.R. Larson and J. Miller, A Time-Temperature Relationship for Rupture and Creep Stresses. Trans. ASME 74 (1952)765.
[2] A Pagliarello and J Beddoes. The stress relaxation and creep behavior of a manganese-stabilized austenitic stainless steel, J. Strain Analysis Vol.44
[3] F.C. Monkman and N.J. Grant; Proc, ASTM 56(1956)593. [4] S.R. Humphries, M.D. Callaghan, B.A. Latella, K.U. Snowden and W.
Yeung. Advanced high temperature testing of ferritic pressure vessel steel, Mater. Forum 30(2006).
[5] S.C. Bose, Kulvir Singh, and J. Jayaraman. Application of stress relaxation test methodology for predicting creep life of a large steam turbine rotor steel (1CrMoV), J. Testing and Evaluation, Vol.31, No.3
[6] S.C. Bose, Kulvir Singh, G. Jayaraman, and K. Venugopal. Evaluation and establishment of short term stress relaxation test methodology for predicting long-term creep life of steam turbine components, J. Met. & Mater. Sci. Vol. 42, No.3. July-Sept. 2000, pp. 177-197
[7] J.A. Daleo, K.A.Ellison, D. A. Woodford. Application of stress relaxation testing in metallurgical life assessment evaluations of GTD 111 alloy turbine buckets. J. Eng. for Gas Turbines & Power, January 1999, Vol.121, pp. 129-137
[8] David A. Woodford. Advances in the use of stress relaxation data for design and life assessment in combustion turbines. JSME Int. J. Series A, Vol.45, No.1, 2002
[9] S.R.Humphries, K.U.Snowden, W. Yeung. The effect of repeated loadings on the stress relaxation properties of 2.25Cr-1Mo steel at 550oC and the influence on the Feltham ‘a’ and ‘b’ parameters. Mat. Sci. Eng. A 527 (2010)3240-3244
[10] S.R.Humphries, W.Y.Yeung, M.D. Callaghan. The effect of stress relaxation loading cycles on the creep behaviour of 2.25Cr-1Mo pressure vessel steel. Mater. Sci. Eng. A528 (2011)1216-1220
[11] P J ENNIS, A CZYRSKA-FILEMONOWICZ, Recent advances in creep-resistant steels for power plant applications, Sadhana 28(2003) 709-730.

Figure 1: Long term creep tests performed at two different temperatures and stress of P91 steel
Figure 2: Stress relaxation tests performed at different temperatures of P91 steel.
0
100
200
300
400
500
0 5 10 15 20 25
Stress, M
Pa
Time, hours
Strain : 1.8%
550
600
625
0 2000 4000 6000 8000
0
3
6
9
12
15
18
Str
ain
, %
Time, h
600oC/100 MPa
625oC/80 MPa

Figure 3: Stress vs. minimum creep rate plots of P91 steel at different temperatures during steady state creep.
Figure 4: Minimum creep rates vs. rupture time plot of P91 steel at different test temperatures.
1,00E‐07
1,00E‐06
1,00E‐05
1,00E‐04
10 100 1000
Minim
um creep rate, /h
Stress, MPa
550
600
625
1,00E‐07
1,00E‐06
1,00E‐05
1,00E‐04
1,00E‐03
100 1000 10000 100000
Minim
um creep rate, /h
Rupture time, hour
550
600
625
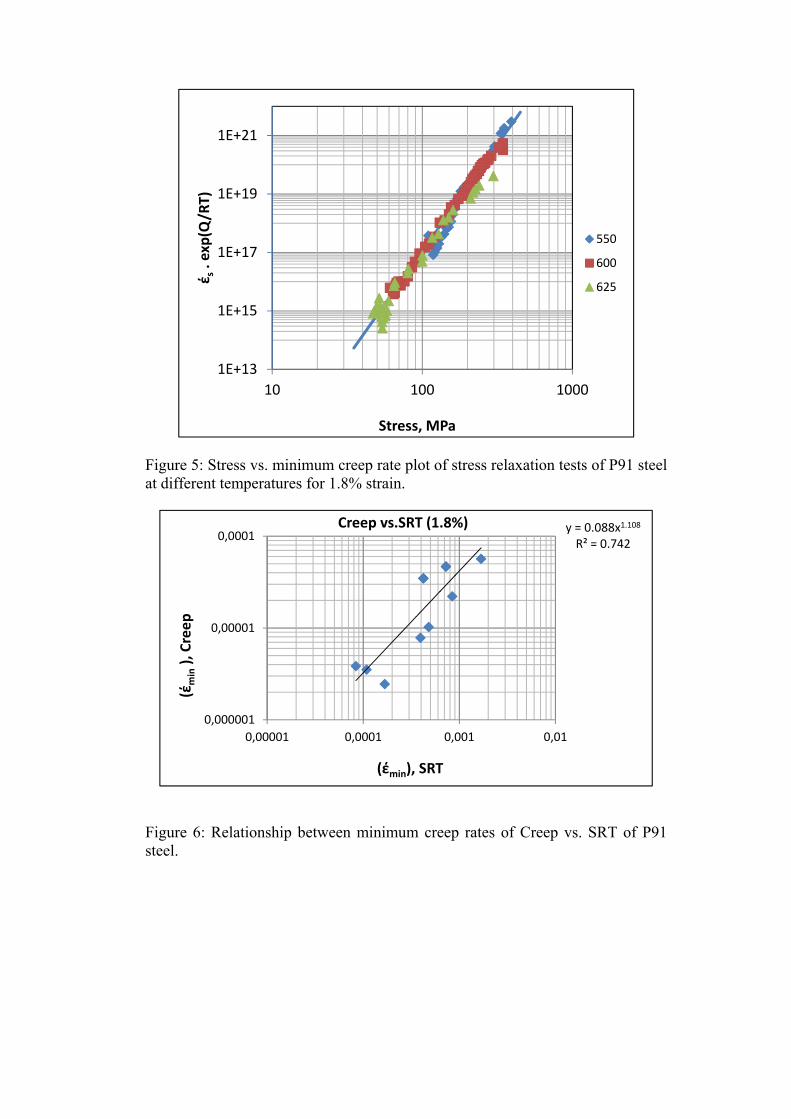
Figure 5: Stress vs. minimum creep rate plot of stress relaxation tests of P91 steel at different temperatures for 1.8% strain.
Figure 6: Relationship between minimum creep rates of Creep vs. SRT of P91 steel.
1E+13
1E+15
1E+17
1E+19
1E+21
10 100 1000
έ s. exp(Q
/RT)
Stress, MPa
550
600
625
y = 0.088x1.108
R² = 0.742
0,000001
0,00001
0,0001
0,00001 0,0001 0,001 0,01
(έmin), Creep
(έmin), SRT
Creep vs.SRT (1.8%)

Figure 7: As received TEM micrograph of P91 steel shows elongated lath martensitic structure.
Figure 8:TEM micrograph of crept specimen performed at 625oC/80MPa of P91steel
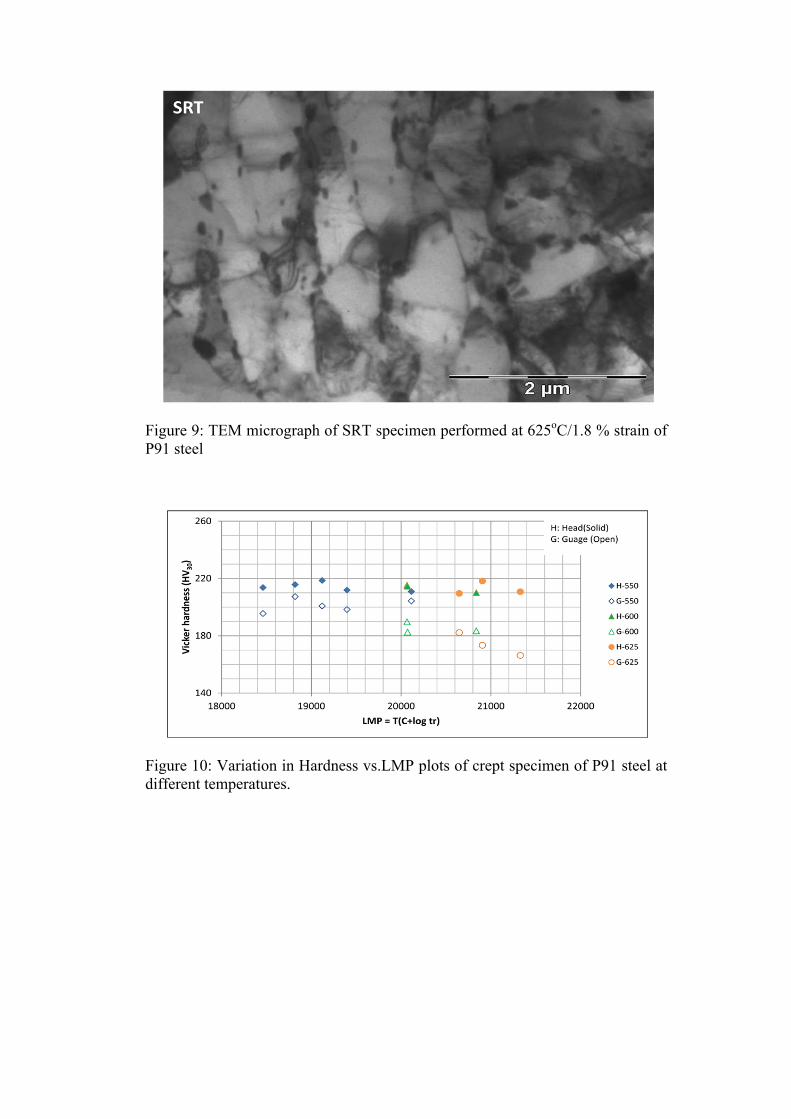
Figure 9: TEM micrograph of SRT specimen performed at 625oC/1.8 % strain of P91 steel
Figure 10: Variation in Hardness vs.LMP plots of crept specimen of P91 steel at different temperatures.

Figure 11: Variation in Hardness vs. Temperature plots of Crept and SRT specimens of P91 steel at different temperatures.
140
180
220
260
525 550 575 600 625 650
Vickers hardness (HV30)
Temperature (oC)
SRT
Creep