Embed Size (px)
Citation preview

1
Creditor Rights and Capital Structure:
Evidence from International Data
Sadok El Ghoul
University of Alberta, Edmonton, AB T6C 4G9, Canada
Omrane Guedhami
University of South Carolina, Columbia, SC 29208, USA
Seong-Soon Cho
Ewha Womans University, Seoul, 125-750 Korea
Jungwon Suh
Sungkyunkwan University, Seoul, 110-745 Korea
This draft: April 15, 2012
ABSTRACT
Using firm-level data from 51 countries, we document evidence that creditor protection is an
important country-level determinant of corporate capital structure. Specifically, strong creditor
rights are associated with low long-term leverage across countries. This pattern is robust to
controlling for key firm characteristics and various country-level factors. We also find that under
strong creditor protection, firms tend to substitute safe capital (i.e., shareholders’ equity) for long-
term debt. The observed negative relation between creditor rights and leverage is not consistent with
the supply-side view that strong creditor protection results in high corporate leverage because it
induces lenders to provide credit at favorable terms. Instead, our results support the demand-side
view that strong creditor protection discourages firms from making long-term cash flow
commitments to service debt because managers and shareholders avoid the risk of losing control in
the case of financial distress.
JEL classification: G15; G32; G33; K22
Key words: Creditor rights; Investor protection; Capital structure; Bankruptcy
2
It is commonly believed that investor protection influences the development of financial markets
and corporate decisions across countries. However, while prior research provides substantial
evidence on the importance of shareholder protection for the size of capital markets, stock returns,
externally financed firm growth, and R&D expenditure (e.g., La Porta, Lopez-de-Silanes, Shleifer
and Vishny (LLSV), 1997, 1998; Demirguc-Kunt and Maksimovic, 1998; Carlin and Mayer, 2003),
the literature on the role of creditor protection is in its infancy. It is relatively recently that
researchers begin to generate evidence of the role of creditor protection in corporate finance (e.g.,
Qian and Strahan, 2007; Bae and Goyal, 2009; Brockman and Unlu, 2009; Houston, Lin, Lin and
Ma, 2010; Benmelech and Berman, 2011; Miller and Reisel, 2012).
This study attempts to contribute to the growing literature on creditor protection by
analyzing the importance of creditor protection in shaping corporate capital structure across
countries. Few studies examine the potential link between creditor protection and corporate capital
structure. Djankov, McLiesh and Shleifer (2007) and Djankov, Hart, McLiesh and Shleifer (2008)
examine the effect of creditor protection on the size of credit markets across countries, but not its
effect on corporate capital structure. Fan, Titman and Twite (2010) analyze effects of various
country-level institutional factors on capital structure, but they do not consider creditor protection.
Oztekin and Flannery (2012) consider creditor protection alongside many other institutional
characteristics, but their focus is not on capital structure per se but on the speed of leverage
adjustments. While LLSV (1997) and Demirguc-Kunt and Maksimovic (1999) examine the effect of
creditor protection on capital structure, the focus of these two studies is placed more on other
institutional characteristics, such as legal origin and shareholder protection, than on creditor
protection. Moreover, these studies use only mean or quartile values of leverage for each country,
restricting the number of data points available for regression analysis.1
Using firm-level data covering 51 countries over the 1991-2007 period, we assess two
conflicting views concerning whether strong creditor protection should increase or decrease firms’
use of debt. The first view—which focuses on the supply side of the financial market (i.e.,
investors)—hypothesizes that creditor protection has a positive effect on the firms’ use of debt. This
1 LLSV (1997) and Demirguc-Kunt and Maksimovic (1999) use only 39 and 29 data points, respectively, in
regressions. Because their regressions control for various other country characteristics (e.g., GDP and legal
origin), the degree of freedom is reduced even further. LLSV (1997) point to their lack of data as a potential
reason for not uncovering conclusive evidence on the role of creditor rights in capital structure.

3
view is based on the premise that strong (weak) creditor protection induces lenders to provide credit
at more (less) favorable terms, resulting in firms adopting high (low) leverage. For example, LLSV
(1997) argue that “to the extent that better legal protections enable the financiers to offer
entrepreneurs money at better terms, we predict that the countries with better legal protections
should have more external finance.” In line with this view, Djankov et al. (2007) documents that
creditor protection plays a role in shaping the use of private credit across countries.
In contrast, the second view—which focuses on the demand side of the financial market
(i.e., corporations)—hypothesizes that creditor protection has a negative effect on the firms’ use of
debt. This view posits that strong creditor protection deters managers and shareholders from using
large debt because they want to avoid losing control in the case of financial distress. Countries
differ in the extent to which bankruptcy codes favor managers and shareholders vis-à-vis creditors.
For example, the U.S. bankruptcy code places managers at an advantage over creditors because its
code is based on the debtor-in-possession principle and grants managers the exclusive right to
devise a reorganization plan. However, in countries with strong creditor protection where the
bankruptcy code is not as protective of debtors, managers can be removed from their position upon
default and replaced by creditors or trustees. Hence, self-interested managers have an incentive to
avoid debt in the face of strong creditor protection. Consistent with the demand-side view, Rajan
and Zingales (1995) argue that strong creditor protection commits creditors “to penalizing
management (and equity holders) if the firm gets into financial distress, thus giving management
strong incentives to stay clear of it.”
Our empirical analysis supports the demand-side view on the relation between creditor
rights and the use of debt. We find that creditor rights have a significantly negative effect on the use
of long-term debt in our sample: on average, a one-unit increase in the creditor rights index of
Djankov, McLiesh and Shleifer (2007) is associated with a decrease in the long-term debt ratio of
approximately two percentage points or more, depending on the model specification. This result
implies that the average long-term debt ratio for countries with the highest creditor rights score (i.e.,
4) is lower than that for countries with the lowest creditor rights score (i.e., 0) by as much as eight
percentage points. This pattern is robust to controlling for firm-specific variables (e.g., firm size,
profitability, asset tangibility and growth opportunities) and country-level variables (e.g., legal
origin, financial market development and per capita GDP). The negative relation between creditor

4
rights and the long-term debt ratio also continues to persist in weighted least squares regressions
and after removal of the two largest countries, the U.S. and Japan, from the dataset. Additionally,
creditor rights have a significantly negative effect on the amount of long-term debt that firms add to
their capital structure each year, which suggests that firms are not willing to increase debt under
strong creditor protection. We further find that creditor rights have a significantly negative effect on
alternative measures of leverage, such as market leverage and total leverage.
We conduct a series of additional tests to ensure that the negative effect of creditor rights
on leverage is driven by demand-side forces. Our results show that among the four indicator
variables comprising the creditor rights index, MGMT_NOT_STAY (which captures the ability of
creditors or courts to replace the incumbent management during bankruptcy) has the most negative
effect on long-term leverage in terms of the magnitudes of the coefficient estimates. The indicator
variables NO_AUTOSTAY (which equals one if the bankruptcy code prohibits an automatic stay on
assets) and RESTRICT_REORG (which equals one if the bankruptcy code prevents management
from unilaterally filing a reorganization plan) also have significantly negative effects on long-term
leverage. These results suggest that the negative effect of creditor protection on long-term leverage
is driven by demand-side forces, namely, managers and shareholders’ desire to avoid the risk of
losing control in the case of financial distress under strong creditor protection. In contrast,
SECURED_FIRST (which equals one if secured creditors’ claims are given absolute priority
relative to government or employee claims)—the indicator variable that is least likely to be
associated with demand-side forces—has a positive effect on long-term leverage.
We also estimate quantile regressions to examine whether creditor protection has
differential effects on leverage depending on firms’ existing debt levels. The demand-side view
predicts that the negative effect of creditor rights on leverage should be more pronounced for firms
with high leverage, because highly levered firms face a higher probability of bankruptcy and thus
their managers and shareholders are likely to be more concerned about the risk of losing control
under strong creditor protection. In contrast, the supply-side view makes no such prediction. Our
quantile regression results suggest that the effects of creditor rights on leverage are indeed more
negative for firms with high leverage than for firms with low leverage, which provides further
support to the demand-side view.
We next ask whether strong creditor protection induces firms to use equity capital to a

5
greater extent than long-term debt, given that equity is “safe” capital, that is, free of the problems
posed by strong creditor protection. We find that the proportion of shareholders’ equity in long-term
capital (defined as the sum of long-term debt and shareholders’ equity) tends to increase with the
degree of creditor protection across countries. Regression results further confirm that the effect of
creditor rights on the use of equity capital is significantly positive after controlling for key firm and
country characteristics. These results suggest that under strong creditor protection, firms substitute
safe capital (i.e., equity) for risky capital (i.e., long-term debt) because managers and shareholders
seek to insulate themselves from the risk of losing control in the case of bankruptcy.
Thus our additional tests consistently suggest that demand-side forces drive the negative
effect of creditor protection on leverage. Our final analyses examine whether this negative effect of
creditor protection weakens or strengthens depending on institutional characteristics such as
information sharing, the rule of law and financial market development. We find little evidence that
information sharing or the rule of law mediates the negative effect of creditor protection on the use
of long-term debt. Interestingly, however, we find that the negative effect of creditor protection
disappears among financially underdeveloped countries. This suggests that demand-side forces are
relatively weak in financially underdeveloped countries because firms are financially constrained
and thus less able to reject available debt capital despite the risk of their managers and shareholders
losing control in the case of financial distress.
This study contributes to the literature on investor protection and corporate finance by
identifying creditor protection as a key country-level institutional factor influencing corporate
capital structure across countries. The salient feature of our findings is that firms’ use of debt is
negatively associated with the strength of creditor protection. To our knowledge, this study is the
first one to present evidence that demand-side forces drive corporate financing in international
corporate governance research amid the popularity of the supply-side view among scholars. Indeed,
recent research on creditor rights and debt financing shows the importance of only the supply-side
forces in the debtor-creditor relationship. For example, Djankov et al. (2007) shows that creditor
protection has a positive effect on the size of credit markets. Houston, Lin, Lin and Ma (2010) and
Benmelech and Bergman (2011) document that strong creditor protection is associated with greater
risk taking by financial institutions and airlines. Similarly, Qian and Strahan (2007) and Bae and
Goyal (2009) provide evidence in favor of the supply-side view in loan contract data.

6
Our evidence of the negative effect of creditor rights on debt financing suggests that
managers’ and shareholders’ incentives to avoid risk play a role in determining the amount of debt.
In this respect, the current study is related to the work of Friend and Lang (1988) and Berger, Ofek
and Yermack (1997), who document that entrenched managers use relatively low levels of debt to
avoid risk. Our evidence also suggests that managers and shareholders’ self-interest may result in
suboptimal leverage under strong creditor protection. This inference is in line with Acharya,
Amihud and Litov (2011), who suggest that there may be a dark side to strong creditor protection.
Using a sample of 35 countries, these authors report that strong creditor protection is associated
with a higher incidence of diversifying mergers, lower corporate operating risk and increased
preference for merger targets with high-recovery assets. Interestingly, they find that among the four
components of the creditor rights index, these effects are most pronounced for MGMT_NOT_STAY,
just as the current study finds that MGMT_NOT_STAY has the greatest influence on long-term
leverage. Overall, the current study, together with Acharya et al. (2011), suggests that strong
creditor protection could lead to value-decreasing corporate decisions, as strong creditor protection
induces managers and shareholders to take decisions that minimize risk.
Although we document that demand-side forces shape firms’ capital structures across
countries, the evidence does not reject the supply-side view per se. Some of our findings suggest
that supply-side forces may be also at work. Specifically, the positive effect of SECURED_FIRST
(in our view, the best component that captures the supply-side forces because it is least related to the
demand-side forces) on the long-term debt ratio indicates that better protection of secured creditors
increases those creditors’ willingness to provide credit and in turn firms’ use of debt. However,
while creditor protection likely increases both the willingness of creditors to provide credit and the
reluctance of corporations to use debt, our overall results suggest that the latter (demand-side forces)
outweighs the former (supply-side forces) in shaping corporate capital structure across countries.
Despite the popularity of the supply-side view among scholars, our evidence suggests that
the overall relation between creditor rights and corporate leverage is negative. The absence of a
positive relation between creditor rights and leverage can also be understood in light of the evidence
reported by recent studies on creditor rights and terms of loan contracts or covenants. Davydenko
and Franks (2008) show that French banks respond to weak creditor protection in that country by
requiring higher levels of collateral and demanding collateral forms that are less subject to dilution.

7
Nini, Smith and Sufi (2009) suggest that in the face of weak legal protection, creditors demand
greater control rights through private agreements such as covenants. Indeed, Miller and Reisel
(2012) show that bond contracts are more likely to include restrictive covenants in countries where
creditor protection is weak. Brockman and Unlu (2009) also argue that weak creditor protection
induces creditors to impose low dividend payouts on debtor firms through covenants. To the extent
that creditors can circumvent weak legal protection by adjusting terms of contracts or covenants,
weak creditor protection may not dampen creditors’ desire to lend to firms, which in turn may work
against a potentially positive relation between creditor rights and the amount of debt financing.
Finally, our results may have to be reconciled with those of Qian and Strahan (2007) and
Bae and Goyal (2009), who provide evidence in favor of the supply-side view in loan contract data.
Qian and Strahan (2007) find that in a sample of 43 countries, strong creditor rights are associated
with longer maturities and lower spreads in loan contracts. Bae and Goyal (2009) report similar
findings, although they find that statistical significance is somewhat weak. In interpreting these
results, it is important to keep in mind that loan contract data are subject to self-selection bias
because such data include only those firms that decide to increase debt, that is, the data exclude
those firms that choose not to increase debt, for example, out of concern that management or
shareholders may lose control in the case of bankruptcy. Patterns observed in loan contract data may
therefore reflect the effects of the supply-side forces but not the effects of the demand-side forces
that are revealed in the current study.2
The rest of the paper proceeds as follows. Section I provides background and describes the
data. Section II presents our main results. Sections III searches for further evidence for the demand-
side view vs. the supply-side view. Section IV conducts subgroup regression analysis. Section V
concludes.
I. Background and Data
The purpose of this study is to examine whether and how corporate capital structure varies across
countries based on the extent of creditor protection. Although it is intuitive that creditor rights may
affect the amount of debt that firms use, whether this effect is driven by supply-side forces or
2 Interestingly, Bae and Goyal (2009) report that loan contract size is negatively related to creditor rights.
This observation could be viewed as evidence of the demand-side forces at work because it implies that
managers and shareholders operating under strong creditor protection avoid large debt levels.

8
demand-side forces is not obvious. Existing international corporate governance research tends to
focus on the supply side of the financial market (i.e., creditors). For example, LLSV (1997) and
Giannetti (2003) argue that strong creditor rights result in high corporate leverage because it
induces lenders to provide credit to firms at favorable terms. On the other hand, Demirguc-Kunt and
Maksimovic (1999) do not pre-specify the direction of the effect of creditor rights on corporate
leverage as their cross-country study is exploratory in nature.
In this study we argue that it is important to consider not only supply-side forces but also
demand-side forces in assessing the link between creditor rights and leverage. Prior studies in the
international corporate governance literature generally overlook the role of demand-side forces, that
is, the ability of management and shareholders to modify financial policy in response to the level of
creditor protection provided by law. Strong creditor protection can place a debtor-firm’s managers
and shareholders at a disadvantage vis-à-vis creditors, thereby discouraging firms from using high
levels of debt. This demand-side view predicts a negative relation between creditor rights and
corporate leverage. To our knowledge, Rajan and Zingales (1995) is the only prior study in the
literature to seriously consider this prediction, although their dataset consists of only seven
countries and does not offer conclusive evidence.
Prior studies face several other limitations in addition to the lack of attention on demand-
side forces. Two key studies, LLSV (1997) and Demirguc-Kunt and Maksimovic (1999), do not
examine creditor protection in its own right but rather consider it along with a number of
institutional characteristics that may affect the amount of debt or equity financing across countries.
In addition, these studies use only mean or quartile values of leverage for each country, restricting
the number of data points available for regression analysis. LLSV (1997), for example, point to
their lack of data as a potential reason for not uncovering conclusive evidence on the role of creditor
rights in capital structure; for example, while they find that the amount of debt financing (scaled by
GDP) in a country is positively correlated with the strength of creditor rights in that country, the
significance disappears after controlling for legal origin. More recent studies are subject to similar
data issues. For example, Booth, Aivazian, Demirguc-Kunt and Maksimovic (2001) employ a
sample that comprises only ten developing countries and Giannetti (2003) examines a sample of
only eight European countries.
In contrast to the above research, our dataset contains more than 127,000 firm-year

9
observations from 51 countries over the 1991-2007 period. Our primary proxy for leverage is the
long-term debt ratio (i.e., the amount of long-term debt scaled by book assets), although we also
consider the total debt ratio (i.e., the sum of short-term and long-term debt scaled by book assets) as
an alternative proxy. Our choice of the long-term debt ratio as our main leverage measure is
motivated in part by the well-documented observation that total leverage is driven largely by the
amount of long-maturity debt, while the use of short-maturity debt is negatively correlated with the
use of long-maturity debt (see, e.g., Barclay and Smith, 1995; Johnson, 2003). Moreover, firms use
short-term debt primarily to finance current assets or as part of working capital management, and
thus leverage measures that include short-term debt may be less sensitive to factors that are assumed
to affect firms’ corporate leverage policy. We use leverage ratios based on book value in our main
analyses, though we check the robustness of our results by considering the market debt ratio (i.e.,
the amount of long-term debt scaled by market assets, where market assets are book assets plus
market equity – book equity) as an alternative leverage measure. Our choice of book debt ratios as
main leverage measures is justified by the fact that bank loan covenants are written in terms of book
value; hence firms are likely to be more concerned about book leverage ratios than market leverage
ratios (Harvey, Lins and Roper, 2004).
Our key explanatory variable is the creditor rights index (CR) of Djankov, McLiesh and
Shleifer (2007), who update the original index prepared by LLSV (1998). We use the 2002 values of
this index in our analysis, following Djankov et al. (2007) and Brockman and Unlu (2009).3 This
index is computed as the sum of four dummy variables—NO_AUTOSTAY, SECURED_FIRST,
RESTRICT_REORG, and MGMT_NOT_STAY—each of which equals one if a country’s
bankruptcy code provides creditors with that specific type of protection and zero otherwise. More
specifically, NO_AUTOSTAY equals one if the bankruptcy code prohibits an automatic stay on
assets. The existence of an automatic stay, which prevents automatic liquidations of insolvent firms
by secured creditors, gives managers and shareholders of a distressed firm greater bargaining power
vis-à-vis secured creditors. SECURED_FIRST equals one if secured creditors are given absolute
3 While the creditor rights index is available for each individual year over the period 1981-2004, the index
exhibits a high degree of persistence (Djankov et al., 2007). For example, during the period 1991-2004, which
overlaps our 1991-2007 sample period, only 15 changes (6 upward and 9 downward) are experienced by 13 of
the 51 countries in our sample. This means that the majority of countries never experience any change in their
creditor rights scores. We find (in unreported results) that all our findings remain unaffected when we use the
time-varying index.
10
priority to claims during bankruptcy relative to government or employee claims.
RESTRICT_REORG equals one if management cannot file a reorganization plan unilaterally (i.e.,
without creditor consent). In some countries (e.g., the U.S.), the bankruptcy code grants
management an exclusive right to draw up a reorganization plan, which puts debtor firms at a
substantial advantage relative to creditors. Finally, MGMT_NOT_STAY equals one if either
creditors or the courts can change the incumbent management during bankruptcy and equals zero if
management has the power to remain in charge during bankruptcy.
To determine what drives the linkage between creditor rights and leverage, we examine the
extent to which the four components of the creditor rights index influence long-term leverage. The
direction of the estimated effect of these dummy variables in the leverage regression can shed light
on whether demand-side or supply-side forces drive the relation between creditor rights and
corporate leverage. For example, the supply-side view predicts positive coefficients on these four
dummy variables because it assumes that strong creditor protection induces creditors to provide
credit to companies at favorable terms. In contrast, the demand-side view predicts negative
coefficients on these dummy variables (except for SECURED_FIRST) because it assumes that
strong creditor protection increases the chance that managers and shareholders will lose control
during bankruptcy, and as a result they will try to avoid this situation by reducing the use of debt. In
the case of SECURED_FIRST, it is only weakly related to the power of managers and shareholders
to retain control during bankruptcy because it corresponds to the ability of secured creditors to
recover investments against claimants other than managers and shareholders.
In our leverage regressions, we use shareholder rights (AD)4 and per capita GDP as our
main country-level control variables. Assuming that strong shareholder protection increases
investors’ willingness to provide equity capital, the degree of shareholder protection is likely to be
negatively associated with leverage. Per capita GDP can be viewed as a proxy for several
institutional characteristics, such as financial market development and the rule of law. Our firm-
level control variables include profitability (ROA), market-to-book (M/B), firm size (log(Sales))
and asset tangibility (PPE). The literature on capital structure generally identifies these four
4 We use anti-director rights as our measure of shareholder rights. In unreported results, we also use the anti-
self-dealing index (Djankov, La Porta, Lopez-de-Silanes and Shleifer, 2008) in place of shareholder rights and
find that results remain essentially unchanged.

11
characteristics as key cross-sectional determinants of capital structure (Titman and Wessels, 1988;
Rajan and Zingales, 1995; MacKay and Phillips, 2005; Lemmon, Roberts and Zender, 2008;
DeAngelo and Roll, 2011).
Data used to construct our leverage variables and other firm characteristics come from the
Worldscope database. Our starting sample comprises 95 countries over the 1991-2007 period. We
omit financial and utility firms from the analysis as well as observations with negative market-to-
book equity ratios. We also require that sample countries have at least ten valid firm-year
observations. This requirement eliminates countries such as Argentina and Tunisia, which each have
only eight valid observations, leaving us with 51 sample countries. These filters yield a final sample
of 127,500 observations across 51 countries over the 1991-2007 period. Definitions for our leverage
and firm characteristic variables as well as for the country-level variables are provided in Table AI
in the Appendix. We address extreme values by winsorizing the firm-level variables in this study at
the top and bottom one percent of their distributions in each year’s sample.
II. Main Results
A. Graphical Illustration
Table I reports summary statistics for the long-term debt ratio along with creditor rights scores and
shareholder rights scores for the 51 countries included in our sample. As Brockman and Unlu (2009)
point out, creditor rights and shareholder rights are not perfectly correlated and there is considerable
variation in creditor rights across countries with similar legal origins and shareholder rights scores.
For example, the U.S., the U.K., Canada and Australia are all common law countries that tend to
rank towards the top of the shareholder rights index. However, the U.K. and Australia ranks towards
the top of the creditor rights index, while the U.S. and Canada rank towards the bottom.
To illustrate the potential importance of creditor protection in shaping corporate leverage
decisions, Figures 1 and 2 plot the median long-term debt ratio and median total debt ratio,
respectively, for five groups of countries classified by their creditor rights scores (0 to 4). Figure 1
shows that the use of long-term debt tends to decrease with creditor rights. For example, the median
long-term debt ratio is approximately 13.36% and 14.07% for the bottom two groups of countries in
terms of creditor rights (i.e., CR=0 and CR=1), while it is only 7.90% for the top group of countries
in terms of creditor rights (i.e., CR=4). Figure 2 shows that although the median total debt ratio

12
does not decrease monotonically with the creditor rights score, the top two groups in terms of
creditor rights (i.e., CR=3 and CR=4) have median total leverage—at 19.49% and 15.06%,
respectively—that is substantially lower than for the other groups of countries with weaker creditor
protection. Taken together, Figures 1 and 2 indicate that firms tend to use low levels of debt in
countries with strong creditor protection.
For comparison purposes, Figure 3 plots the median value of long-term debt ratio for
groups of countries classified by shareholder rights (AD), which is our proxy for shareholder
protection. The figure shows that those countries with a medium level of shareholder protection
(e.g., AD=3 or 3.5) display relatively high long-term debt levels. Thus, Figure 3 does not provide
evidence of either a positive or a negative relation between shareholder protection and the long-term
debt ratio.
In summary, the use of long-term debt tends to decreases with the creditor rights score.
This pattern is not consistent with the supply-side view, which posits that strong creditor protection
gives rise to greater use of debt by firms because it makes lenders more willing to provide credit at
favorable terms. Instead, the observed pattern is consistent with the demand-side view, which
argues that strong creditor protection deters managers and shareholders from adopting high leverage
because of their desire to avoid losing jobs and control in case of financial distress.
B. Regression Results
We conduct regression analysis to assess the effect of creditor rights on long-term debt. In our main
analysis, we use firm-level leverage as the dependent variable.
Table II reports results of regressions in which the control variables comprise firm
characteristics previously identified as determinants of leverage—profitability (ROA), market-to-
book (M/B), firm size (Log(Sales)) and asset tangibility (PPE) (see, e.g., Titman and Wessels, 1988;
Rajan and Zingales, 1995; MacKay and Phillips, 2005; Lemmon, Roberts and Zender, 2008;
DeAngelo and Roll, 2011). We find that creditor rights have a substantially negative effect on the
use of long-term debt in all model specifications. Thus, the negative association between creditor
rights and long-term debt observed in Figure 1 therefore carries over to the regression results. In
particular, the estimated coefficients on creditor rights exceed -0.02 (in absolute value) in all model
specifications reported in the table, which suggests that on average, a one-unit increase in the
13
creditor rights index is associated with a decrease in the long-term debt ratio of more than two
percentage points.
In Table III we add controls for two country characteristics—shareholder rights (AD) and
per capita GDP (GDP)—that could compete with creditor rights in shaping firms’ leverage policy
across countries. Shareholder rights are included primarily to assess the importance of creditor
protection in comparison to shareholder protection. LLSV (1997) argue that shareholder protection
is a key determinant of the size of a country’s equity market. If strong shareholder protection leads
to greater use of external equity, high levels of shareholder rights should be associated with
relatively low leverage. However, strong shareholder protection could induce greater use of debt if
shareholder protection reduces agency costs and in turn increases the willingness of financial
institutions to provide credit. We also include GDP to account for the pattern, as noted by Djankov
et al. (2007), that rich countries have higher creditor rights scores than do poor countries. GDP also
proxies for financial market development and the rule of law.5 Demirguc-Kunt and Maksimovic
(1999) document that the use of long-term debt tends to be higher among developed countries than
developing countries, and we therefore expect GDP to be positively associated with leverage.
The results in Table III show that the estimated coefficient on creditor rights is
significantly negative in all model specifications. The size of coefficients on creditor rights is
roughly the same—ranging from -0.0211 to -0.0238—as in Table II. Thus, the effect of creditor
rights on the long-term debt ratio remains significantly negative after controlling for two key
country characteristics. This provides further support for the demand-side view of the effect of
creditor rights. In contrast, the effect of shareholder rights on the long-term debt ratio is not
significant in any of the model specification considered. Taken together with Figure 3 in the
preceding graphical analysis, there is little evidence that shareholder rights (linearly) affect the use
of debt. The effect of GDP on the long-term debt ratio is significantly positive in models (4)-(6) in
which we control for firm-level characteristics, which suggests that firms in rich countries may tend
to use more debt than those in poor countries.
In Table IV, we estimate country-level leverage regressions in which the dependent
variable is country-level leverage. Specifically, the dependent variable is the average long-term debt
5 GDP is highly correlated with the rule-of-law index (LLSV, 1997), which is regarded as an important
determinant of the size of external finance.
14
ratio in a given year for a country over the period 1991-2007. The results are reassuring. Creditor
rights have a significantly negative effect on country-level long-term debt ratio in all model
specifications, which confirms the firm-level leverage regression results.
Overall, both firm-level and country-level leverage regression results consistently suggest
that creditor rights have a significantly negative effect on the use of long-term debt. Combined with
the evidence from the graphical analysis, the observed negative effect of creditor rights lends
support to the demand-side view, as opposed to the supply-side view.
C. Robustness Checks
We perform three sets of analyses to ensure the robustness of our main finding that creditor rights
have a significantly negative effect on long-term leverage.
First, we ask whether our results are driven by the uneven distribution of observations
across countries, in particular, by a few large countries (e.g., the U.S. and Japan) that contain a
disproportionately large number of sample firm-years. Panel A of Table V reports results of
weighted least squares regressions in which the weight for a given country is equal to the reciprocal
of the number of firm-year observations for that country. The results show that the coefficients on
creditor rights remain negative and significant. Panels B and C of Table V report results of ordinary
least squares regressions for our sample firm-years without the U.S. and without the U.S. and Japan,
respectively. The results again show that the coefficients on creditor rights are negative and
significant. Taken together, these results indicate that the significant effect of creditor rights on
long-term debt is not driven by the uneven distribution of observations across countries.
Second, we control for additional country characteristics in the long-term debt regression:
(i) legal origin, (ii) rule of law, (iii) financial market development and (iv) property rights. In
controlling for legal origin, we use four dummy variables to capture whether a country belongs to
Anglo-Saxon, French, German, Scandinavian or Socialist legal origin. Our rule of law measure is
LLSV’s (1997) survey-based estimate of the quality of law enforcement, which LLSV find is
consistently associated with the extent of a country’s capital market development. Our proxy for
financial market development (FINMKT) captures both the size and liquidity of a country’s stock
and debt markets by taking the average of the standardized values of stock market development and

15
debt market development scores calculated by Brockman and Unlu (2009).6 Finally, to control for
property rights we use the property rights index of Bae and Goyal (2009), who document that loan
maturity and the spread on bank loans are significantly associated with the degree of property rights
across countries. Table VI reports the results; to save space, the table presents only the coefficients
on creditor rights. All of the estimated coefficients indicate that the significant negative effect of
creditor rights on long-term debt continues to hold, regardless of which country characteristics are
used as additional controls.
The above robustness checks consistently suggest that creditor rights have a significantly
negative effect on the long-term debt ratio across countries. These results reinforce the view that the
effect of creditor rights on corporate leverage is driven by demand-side forces, that is, by the
reluctance of managers and shareholders to raise debt in the face of strong creditor protection, rather
than by supply-side forces.
In our third set of robustness checks, we ask whether the negative effect of creditor rights
on leverage persists even when we use alternative measures of leverage, namely, the change in long-
term debt, the market debt ratio and the total debt ratio.
Panel A of Table VII reports the results of regressions that evaluate the effect of creditor
rights on the change in long-term debt (defined as the change in the amount of long-term debt from
year t to year t+1 scaled by total assets in year t). The usual control variables are included in the
regression as well as the total debt ratio (TD/TA), which accounts for the possibility that highly
levered firms are less likely to increase debt due to concerns about debt capacity or bankruptcy risk.
The regression results show that creditor rights have a significantly negative effect on the change in
long-term debt in all model specifications. Hence, it appears that firms are less willing to issue long-
term debt when facing strong creditor protection. This finding reinforces the view that creditor
protection has a negative effect on the use of debt.
Panels B and C consider the total debt ratio (defined as the sum of short-term debt and
long-term debt scaled by total assets) and the market debt ratio (defined as long-term debt scaled by
the market value of assets) and as the dependent variable, respectively. The results in both panels
6 We also consider stock market development scores (STKMKT) and debt market development scores
(DEBTMKT) separately as our measure of financial market development but find that the results remain
essentially unchanged (in unreported results). We also use other financial market development measures such
as bond market capitalization, but doing so makes no difference to our conclusions.
16
suggest that creditor rights have a negative effect on the use of debt, given that the coefficients for
creditor rights are consistently negative in all model specifications. Thus, our main finding of the
negative effect of creditor rights on the use of debt is quite robust to the choice of alternative
leverage measures.
III. Further Evidence for the Demand-Side View
Thus far, our results consistently suggest that creditor rights have a negative effect on firms’ use of
debt across countries, which is consistent with the demand-side view (vs. the supply-side view). In
this subsection, we seek further (and more conclusive) evidence that the demand-side forces are
responsible for this negative effect.
A. Effects of Creditor Rights’ Components
To analyze what lies behind the negative effect of creditor rights on long-term leverage, we use four
components of the creditor rights index—NO_AUTOSTAY, SECURED_FIRST,
RESTRICT_REORG, and MGMT_NOT_STAY—as explanatory variables in our leverage
regression. Each of these dummy variables is equal to one if a country’s bankruptcy code grants
creditors protection in terms of a specific aspect of creditor rights, and zero otherwise. In our view,
among these four components, MGMT_NOT_STAY is most likely to capture the demand-side
forces related to managers’ concerns about retaining control, given that this variable reflects the
ability of the creditors or courts to fire managers in case of bankruptcy. In contrast,
SECURED_FIRST is least likely to capture the demand-side forces because this variable pertains to
priority granted to secured creditors’ claims over the claims of the government and employees and
thus has little to do with concerns of managers and shareholders.
The regression results, reported in Table VIII, show that the coefficients on
NO_AUTOSTAY, RESTRICT_REORG and MGMT_NOT_STAY are significantly negative, while
the coefficient on SECURED_FIRST takes a positive sign. In particular, MGMT_NOT_STAY—the
component that best captures demand-side forces—has the most negative impact on long-term
leverage in terms of the magnitude of its coefficient (-0.0549). The supply-side view predicts
positive coefficients on NO_AUTOSTAY, RESTRICT_REORG and MGMT_NOT_STAY as these
components reflect strong creditor protection and/or a better chance of recovering investments. The

17
negative estimated coefficients on these variables thus support the demand-side view rather than the
supply-side view. Overall, these findings further suggest that the negative relation between creditor
rights and long-term debt is driven by demand-side forces, that is, the desire of managers and
shareholders to avoid losing control under strong creditor protection.
It is worth noting that the positive estimated coefficient on SECURED_FIRST could be
seen as support for the supply-side view, which posits that better protection of secured creditors
increases the willingness of those creditors to provide credit and hence gives rise to increased use of
debt. However, the positive effect of SECURED_FIRST does not appear to be large, given that the
overall relation between the creditor rights index and long-term debt is significantly negative.
B. Quantile Regression
To shed further light on the demand-side forces that drive the relation between creditor rights and
corporate leverage, we use quantile regression analysis to examine whether the effect of creditor
protection on leverage varies systematically with different leverage levels. Quantile regressions
allow one to estimate the effect of explanatory variables on the dependent variable at different
points of the dependent variable’s distribution (see, e.g., Koenker and Hallock, 2001). We
hypothesize that if the demand-side view is valid, the negative effect of creditor rights on leverage
is more pronounced for high leverage firms than for low leverage firms. The rationale is that firms
with high leverage face a higher probability of bankruptcy and thus their managers and shareholders
are likely to be more concerned about losing control under strong creditor protection. The supply-
side view does not allow for a similar prediction concerning whether the effect of creditor
protection varies based on the level of leverage.
Table IX reports the results of quantile regressions for our pooled sample of 51 countries
where the long-term debt ratio is the dependent variable and the creditor rights index is the
explanatory variable of interest. For illustration purposes, we report regression results for nine long-
term leverage quantiles (from 0.1 to 0.9). The results show that the slope coefficients on creditor
rights are negative in all reported leverage quantiles, with these coefficients becoming more
negative as we move from low (e.g., 0.1) to high (e.g., 0.9) quanitles. For example, the creditor
rights coefficient is -0.0105 at the relatively low leverage quantile of 0.3, whereas it is -0.0293 at
the relatively high leverage quantile of 0.7. At the highest leverage quantile reported in the table

18
(0.9), the creditor rights coefficient is even more negative at -0.0400, which suggests that a one-unit
increase in the creditor rights index is associated with a decrease in the long-term debt ratio of as
much as 4% at high leverage levels.
In sum, the quantile regression results reveal that the responsiveness of leverage to the
degree of creditor protection is indeed more negative for high leverage firms than for low leverage
firms, which provides further support to the view that the empirical relation between creditor rights
and leverage is driven by demand-side forces in the debtor-creditor relation.
C. The Impact of Creditor Protection on Shareholders’ Equity
Our results consistently suggest that firms tend to avoid using long-term debt when facing strong
creditor protection because managers and shareholders seek to insulate themselves from the risk of
losing control in the case of bankruptcy. We now ask whether strong creditor protection induces
firms to use equity capital more relative to long-term debt, given that equity is safe capital free of
the problems posed by strong creditor protection. Specifically, we examine whether the proportion
of shareholders’ equity in long-term capital (i.e., the sum of long-term debt and shareholders’ equity)
is positively associated with the degree of creditor protection.
Figure 4 plots the median ratio of shareholders’ equity to long-term capital for five groups
of countries as classified by their creditor rights scores (0 to 4). The graph clearly shows that the use
of shareholders’ equity tends to increase with creditor rights: the median ratio of shareholders’
equity to long-term capital is around 75% for the bottom two groups of countries (CR=0 and CR=1),
while it is as high as approximately 85% for the top group of countries (CR=4). The figure therefore
suggests that firms increase the use of equity vs. long-term debt when facing strong creditor
protection.
Table X reports regression results that test whether the proportion of shareholders’ equity
in long-term capital increases with creditor rights after controlling for key firm and country
characteristics. The dependent variable is the ratio of shareholders’ equity to long-term capital. The
estimated coefficients on creditor rights are consistently positive, ranging from 0.0250 to 0.0320,
and statistically significant. This result is consistent with the pattern in Figure 4 and further suggests
that firms tend to substitute equity for long-term debt as creditor protection becomes stronger.
In summary, creditor rights have a positive effect on the use of equity vs. long-term debt,

19
lending further support to the demand-side view. This evidence is consistent with the view that
under strong creditor protection, firms raise more safe capital (i.e., equity) and less risky capital (i.e.,
long-term debt) due to managers and shareholders’ desire to avoid losing control in the case of
financial distress.
IV. Subgroup Regressions
In our final set of analyses, we explore whether the effect of creditor rights on leverage differs with
information sharing, the rule of law, and financial market development. Specifically, we ask
whether these institutional characteristics affect the importance of the demand-side and supply-side
forces in shaping corporate leverage across countries.
Panel A of Table XI reports the results of leverage regressions estimated separately for two
groups of countries: those with a public credit registry or private credit bureau and those without
such institutions. Djankov et al. (2007) argue that information sharing and creditor protection may
be substitutes in shaping the size of credit markets. The presence of a public credit registry or a
private credit bureau indicates information sharing regarding borrowers’ creditworthiness. Therefore,
if information sharing increases creditors’ willingness to extend credit to corporations—that is, if
information sharing strengthens the supply-side forces—then the effect of creditor rights on
leverage should be less negative in countries with a public credit registry or private credit bureau.
The results, however, do not provide strong support for this prediction, as the estimated coefficients
on creditor rights are significantly negative with similar magnitudes—at -0.0233 and -0.0217,
respectively—for both groups of countries.
In Panel B of Table XI, we run regressions separately for the poor-rule-of-law and good-
rule-of-law countries. The poor-rule-of-the-law (good-rule-of-the-law) countries are those with the
below (above) median rule-of-law score from LLSV (1997). One possibility is that the negative
effect of creditor rights on leverage will be more pronounced in good-rule-of-law countries than in
poor-rule-of-the-law countries, if the rule of law heightens the demand-side concerns—that is, if the
high probability of law enforcement deters managers and shareholders from using debt to a greater
extent for fear of losing control. However, another possibility is that the rule of law could strengthen
the supply-side forces and thus weaken the negative effects of creditor rights, assuming the high
probability of law enforcement increases the willingness of creditors to extend credit to corporations.
20
The regression results do not provide strong evidence for either of these predictions, as the effect of
creditor rights on the long-term debt ratio is significantly negative with similar magnitudes—at -
0.0263 and -0.0229, respectively—for both samples of countries. In Panel C, we use contract
enforcement days as an alternative proxy for the rule of law. There is little evidence that the
negative effect of creditor rights on leverage is more or less pronounced in one subgroup of
countries relative to the other. The coefficient on creditor rights for countries with long enforcement
days is negative (at -0.0213) and the corresponding coefficient for countries with short enforcement
days is similarly negative (at -0.0228).
Finally, Panel D of Table XI estimates leverage regressions for financially developed and
underdeveloped countries. Financially developed (underdeveloped) countries are those with the
above (below) median financial market development score (FINMKT). Interestingly, we find that
the effect of creditor rights is positive, albeit not significant, among financially underdeveloped
countries, while it is significantly negative among financially developed countries. Our
interpretation of this result is that demand-side forces are relatively weak in financially
underdeveloped countries because firms are financially constrained and thus less able to reject
available debt capital despite the risk of their managers and shareholders losing control in the case
of financial distress. In contrast, the effect of creditor rights is significantly negative among
financially developed countries, which suggests that in those countries the demand-side concerns
outweigh the supply-side factors.
To summarize, we find little evidence that information sharing or the rule of law influences
the negative effect of creditor protection on the use of long-term debt. Interestingly, however, we
find that the negative effect of creditor protection disappears among financially underdeveloped
countries, which suggests that the demand-side forces are substantially weak in those countries.
V. Concluding Remarks
The primary contribution of the current study is the identification of creditor rights as an important
factor in shaping corporate capital structure across countries. To our knowledge, this is the first
study to document evidence that demand-side forces drive the relation between creditor rights and
capital structure. Our finding of the negative effect of creditor rights on leverage suggests that the
managers and shareholders’ risk-avoiding incentives influence the amount of debt financing across

21
countries. In a recent study, Acharya et al. (2011) document that strong creditor protection leads
managers to make risk-reducing decisions in mergers and acquisitions. Similarly, our study suggests
that strong creditor protection induces firms to engage in risk-reducing decisions in capital structure
policy due to the incentives of managers and shareholders to keep jobs and control over the firm.
The current study complements the growing literature on the role of creditor rights in
financial policy (e.g., Esty and Megginson, 2003; Billett et al., 2007; Davydenko and Franks, 2008;
Nini et al., 2009; Brockman and Unlu, 2009; Houston et al., 2010; Benmelech and Bergman, 2011;
Miller and Reisel, 2012). First, our results fit nicely with the recent evidence of the ability of
creditors to respond to weak legal protection by adjusting terms of contracts or covenants.
Specifically, the lack of explanatory power of the supply-side view in our study can arise from this
ability of creditors. This is because to the extent that creditors circumvent weak legal protection,
weak creditor protection may not dampen creditors’ desire to lend to firms, which in turn may
diminish or erase a potentially positive association between creditor rights and the amount of debt
financing. Second, our results draw attention to the incentive and ability of self-interested managers
and shareholders to modify financial policy when they find themselves at a disadvantage (vs.
creditors) under the bankruptcy code. Thus, in addition to creditors—as recent research
documents—managers and shareholders could respond to the level of rights granted by law. These
observations suggest that it is crucial to understand the nuanced interplay between creditors and
managers to effectively analyze the effects of institutions, such as creditor rights, on financial policy.
Although our overall evidence of suggests that demand-side forces shape firms’ capital
structures across countries, some of our findings suggest that supply-side forces may be also at
work. Specifically, the positive effect of SECURED_FIRST on the long-term debt ratio may
indicate that better protection of secured creditors increases those creditors’ willingness to provide
credit and in turn firms’ use of debt. In the literature, Djankov et al. (2007) find that creditor
protection has a positive effect on the size of credit markets, which is consistent with the supply-
side view. Interestingly, these authors state (on p. 316) that, among the components of creditor
protection, SECURED_FIRST (in our view, the best component that captures the supply-side forces
because it is least related to the demand-side forces) has a positive effect on the size of credit
markets, while MGMT_NOT_STAY (in our view, the best component that captures the demand-
side forces) has a relatively weak effect. However, while creditor protection likely increases both

22
the willingness of creditors to provide credit and the reluctance of corporations to use debt, our
results suggest that the latter (demand-side forces) outweighs the former (supply-side forces) in
shaping corporate capital structure across countries.

23
REFERENCES
Acharya, Viral V., Yakov Amihud and Lubomir Litov, 2011, Creditor rights and corporate risk-
taking. Journal of Financial Economics 102, 150-166. Bae, Kee-Hong, and Vidhan K. Goyal, 2009, Creditor rights, enforcement and bank loans. Journal
of Finance 64, 823-861. Barclay, Michael J. and Clifford W. Smith, 1995, The maturity structure of corporate debt. Journal
of Finance 50, 609-631. Berger, Philip G., Eli Ofek and David L. Yermack, 1997, Managerial entrenchment and capital
structure decisions. Journal of Finance 52, 1411-1438. Benmelech, Efraim and Nittai K. Bergman, 2011, Vintage capital and creditor protection. Journal
of Financial Economics 99, 308-332. Billett, Matthew T., Tao-Hsien D. King and David C. Mauer, 2007, Growth opportunities and the
choice of leverage, debt maturities and covernants. Journal of Finance 62, 697-729. Booth, Laurence, Varouj Aivazian, Asli Demirguc-Kunt and Vojislav Maksimovic, 2001, Capital
structures in developing countries. Journal of Finance 56, 87-130. Botero, Juan, Simeon Djankov, Rafael La Porta, Florencio Lopez-de-Silanes, and Andrei Shleifer,
2004, The regulation of labor. Quarterly Journal of Economics 119, 1339-1382. Brockman Paul and Emre Unlu, 2009, Dividend policy, creditor rights and the agency costs of debt.
Journal of Financial Economics 92, 276-299. Carlin, Wendy and Colin Mayer, 2003, Finance, investment and growth. Journal of Financial
Economics 69, 191-226. Davydenko, Sergei A. and Julian R. Franks, 2008, Do bankruptcy codes matter?: A study of
defaults in France, Germany and the U.K. Journal of Finance 63, 565-608. DeAngelo, Harry and Richard Roll, 2011, How stable are corporate capital structures. Working
Paper, available at: http://ssrn.com/abstract=1784204. Demirguc-Kunt, Asli and Vojislav Maksimovic, 1996, Stock market development and firm
financing choices. World Bank Economic Review 10, 341-369. Demirguc-Kunt, Asli and Vojislav Maksimovic, 1998, Law, finance and firm growth. Journal of
Finance 53, 2107-2137. Demirguc-Kunt, Asli and Vojislav Maksimovic, 1999, Institutions, financial markets and firm debt
maturity. Journal of Financial Economics 54, 295-336. Demirguc-Kunt, Asli and Vojislav Maksimovic, 2001, Firms as financial intermediaries: Evidence
from trade credit data. Working Paper, World Bank and the University of Maryland. Djankov, Simeon, Caralee McLiesh and Andrei Shleifer, 2007, Private credit in 129 countries.
Journal of Financial Economics 84, 299-329.

24
Djankov, Simeon, Rafael La Porta, Florencio Lopez-de-Silanes and Andrei Shleifer, 2008, The law and economics of self-dealing. Journal of Financial Economics 88, 430-465.
Djankov, Simeon., Oliver Hart, Caralee McLiesh and Andrei Shleifer, 2008, Debt enforcement
around the world. Journal of Political Economy 116, 1105-1149. Epstein, David G., 2005. Bankruptcy and related law in a nutshell (Thomson-West, St. Paul, MN.) Esty, Benjamin and William Megginson, 2003, Creditor rights, enforcement and debt ownership
structure. Journal of Financial and Quantitative Analysis 38, 37-59. Fan, Joseph P. H., Sheridan Titman and Garry Twite, 2010, An international comparison of capital
structure and debt maturity choices. Journal of Financial and Quantitative Analysis forthcoming.
Friend, Irwin and Larry H. P. Lang, 1988, An empirical test of the impact of managerial self-
interest. Journal of Finance 43, 271-281. Flannery, Mark J., 1998, Asymmetric information and risky debt maturity choice. Journal of
Finance 41, 19-37. Giannetti, Mariassunta, 2003, Do better institutions mitigate agency problems? Evidence form
corporate finance choices. Journal of Financial and Quantitative Analysis 38, 185-212. Harvey, Campbell R., Karl V. Lins and Andrew H. Roper, 2004, The effect of capital structure
when expected agency costs are extreme. Journal of Financial Economics 74, 3-30. Houston, Joel F., Chen Lin, Ping Lin and Yue Ma, 2010, Creditor rights, information sharing and
bank risk taking. Journal of Financial Economics 96, 485-512. Jensen, Michael C. and William H. Meckling, 1976, Theory of the firm: managerial behavior,
agency costs, and ownership structure. Journal of Financial Economics 3, 305-360. John, Kose, Lubomir Litov and Bernard Yeung, 2008, Corporate governance and risk-taking.
Journal of Finance 58, 1679-1728. Johnson, Shane A., 2003, Debt maturity and the effects of growth opportunities and liquidity risk on
leverage. Review of Financial Studies 16, 209-236. Koenker, Roger and Kevin F. Hallock, 2001, Quantile regression. Journal of Economic Perspective
15, 143-156. La Porta, Rafael, Florencio Lopez-de-Silanes, Andrei Shleifer, and Robert W. Vishny, 1997, Legal
determinants of external finance. Journal of Finance 52, 1131-1150. La Porta, Rafael, Florencio Lopez-de-Silanes, Andrei Shleifer, and Robert W. Vishny, 1998, Law
and finance. Journal of Political Economy 106, 1113-1155. Lemmon, Michael L., Michael R., Roberts and Jame F. Zender, 2008, Back to the beginning:
Persistence and the cross-section of corporate capital structure. Journal of Finance 63, 1-37. Mackay, Peter and Gordon M. Phillips, 2005, How does industry affect firm financial structure?
Review of Financial Studies 18, 1433-1466.

25
McLean, David R., Tianyu Zhang and Mengxin Zhao, 2012, Why does the law matter? Investor protection and its effects on investment, finance and growth. Journal of Finance 67, 313-350.
Miller, Darius P. and Natalia Reisel, 2012, Do country-level investor protections affect security-
level contract design?: Evidence from foreign bond covenants. Review of Financial Studies 25, 408-438.
Myers, Stewart C., 1977, Determinants of corporate borrowing. Journal of Financial Economics 5,
147-175. Myers, Stewart C., 1984, The capital structure puzzle. Journal of Finance 39, 575-592. Myers, Stewart C., 1993, Still searching for the optimal capital structure. Journal of Applied
Corporate Finance 6, 4-14. Myers, Stewart C. and Nicholas S. Majluf, 1984, Corporate financing and investment decisions
when firms have information that investors do not have. Journal of Financial Economics 13, 187-221.
Nini, Greg, David C. Smith and Amir Sufi, 2009, Creditor control rights and firm investment policy.
Journal of Financial Economics 92, 400-420. Oztekin, Ozde and Mark J. Flannery, 2012, Institutional determinants of capital structure
adjustment speeds. Journal of Financial Economics 103, 88-112. Petersen, Mitchell A., 2009, Estimating standard errors in finance panel data sets: Comparing
approaches. Review of Financial Studies 22, 435-480. Qian, Jun and Philip E. Strahan, 2007, How laws and institutions shape financial contracts: The
case of bank loans. Journal of Finance 52, 2803-2834. Rajan, Raghuram G. and Luigi Zingales, 1995, What do you know about capital structure? Some
evidence from international data. Journal of Finance 50, 1421-1460. Roberts, Michael R. and Amir Sufi, 2007, Control rights and capital structure: An empirical
investigation, Working Paper, University of Chicago. Smith, Clifford Jr. and Jerold B. Warner, 1979, On financial contracting: An analysis of bond
covenants. Journal of Financial Economics 7, 117-161. Stohs, Mark H. and David C. Mauer, 1996, The determinants of corporate debt maturity structure.
Journal of Business 69, 279-312 Titman, Sheridan and Roberto Wessels, 1988, The determinants of capital structure choice. Journal
of Finance 43, 1-19.

26
Appendix
Table AI: Variable Description
Variables Descriptions
Firm-level variables
LT debt Long-term debt. (Source: Worldscope)
Total debt (TD) The sum of long-term debt and short-term debt. (Source: Worldscope)
Shareholders’ equity (SE) Shareholders’ equity in book value (Source: Worldscope)
TA Total assets. (Source: Worldscope)
Sales Net sales. (Source: Worldscope)
PPE Net property, plant, and equipment scaled by total assets (Source: Worldscope)
Profitability (ROA) Equal to earnings before interest and tax to total asset. (Source: Worldscope)
Market-to-Book (M/B) Equal to market value of equity to book value of equity. (Source: Worldscope)
Country-level variables
Creditor rights (CR) The sum of four 0-1 indicator variables that evaluate whether there is no
automatic stay on assets (NO_AUTOSTAY), whether secured creditor paid
first (SECURED_FIRST), whether there are restrictions on going into
reorganization (RESTRICT_REORG), and whether management stays in the
reorganization (MGMT_NOT_STAY) (measured at the country level)
(Source: Djankov et al., 2007)
Shareholder rights (AD) Anti-director rights. Equal to the sum of six subindices at the country level
that assess the possibility of proxy voting by mail, blocking shares before a
shareholder meeting, cumulative voting, oppressed minority, preemptive
rights, and the percentage of share capital required to call an extraordinary
shareholder meeting (measured at the country level, time invariant) (Source:
Djankov et al., 2008)
Per capita GDP (GDP) Equal to logarithm of GDP per capita in 1997. (Source: Botero et al., 2004)
Rule of law Assessment of the law and order tradition in the country. Computed by
averaging of the months of April and October of the monthly index between
1982 and 1995. Scale from 0 to 10, with lower scores for less tradition for law
and order. (Source: La Porta et al., 1997)
Property rights A measure of the extent to which a country respects private property rights,
which is the sum of three country risk variables that measure corruption, the
risk of expropriation of private property, and the risk that contracts may be
repudiated. (Source: Bae and Goyal, 2009)
Common An indicator variable equal to one if legal origin is common law. (Source:
Djankov et al., 2007)
Socialist An indicator variable equal to one if legal origin is socialist law. (Source:
Djankov et al., 2007)
French An indicator variable equal to one if legal origin is French civil law. (Source:
Djankov et al., 2007)

27
German An indicator variable equal to one if legal origin is German code. (Source:
Djankov et al., 2007)
Scandinavian An indicator variable equal to one if legal origin is Nordic or Scandinavian.
(Source: Djankov et al., 2007)
STKMKT Measures stock market development and is computed by averaging
standardized values of market capitalization to GDP, total value traded to
GDP, and total value traded to market capitalization ratios. (Source: Brockman
and Unlu, 2009)
DEBTMKT Measures financial intermediary development and equals the average of
standardized values of liquid liabilities to GDP and domestic credit for private
firms to GDP ratios. (Source: Brockman and Unlu, 2009)
FINMKT Measures total financial market development and is computed by averaging
standardized values of STKMKT and DEBTMKT. (Source: Authors’ own
calculation)
Information sharing The variable equals one if either a public registry or private bureau operates in
the country, zero otherwise (Source: Djankov et al., 2007).
Contract enforcement days The number of days to resolve a payment dispute through courts (Source:
Djankov et al. (2007)).

28
Table I: Summary Statistics for Long-term Debt for Sample Countries
The table reports the number of firm-year observations and key statistics for the long-term debt to total assets
ratio (LT debt/TA), along with shareholder rights and creditor rights scores, for each of the 51 countries in the
sample over 1991-2007.
N. of
ob.
Shlder
rights
Creditor
rights
LT debt/TA
Mean Median Q1 Q3
Australia 3,351 4.0 3 0.1556 0.1294 0.0277 0.2460
Canada 3,611 4.0 1 0.1885 0.1658 0.0557 0.2847
Hong Kong 3,646 5.0 4 0.1026 0.0641 0.0174 0.1552
India 4,571 5.0 2 0.2071 0.1831 0.0768 0.3133
Ireland 325 5.0 1 0.2110 0.2074 0.0875 0.3121
Israel 453 4.0 3 0.2033 0.1797 0.0678 0.3203
Kenya 13 2.0 4 0.2073 0.1197 0.1005 0.3383
Malaysia 4,237 5.0 3 0.1085 0.0627 0.0160 0.1640
New Zealand 382 4.0 4 0.2257 0.2145 0.0998 0.3235
Nigeria 16 4.0 4 0.0650 0.0472 0.0016 0.1235
Singapore 2,770 5.0 3 0.1048 0.0632 0.0143 0.1605
South Africa 1,314 5.0 3 0.0976 0.0695 0.0186 0.1380
Sri Lanka 157 4.0 2 0.1136 0.1077 0.0522 0.1640
Thailand 2,168 4.0 2 0.1686 0.1220 0.0370 0.2570
United Kingdom 6,410 5.0 4 0.1270 0.0944 0.0267 0.1891
United States 29,893 3.0 1 0.1965 0.1626 0.0497 0.2994
Zimbabwe 96 4.0 4 0.0365 0.0069 0.0022 0.0416
Common law median 2,168 4.0 1 0.1299
Austria 363 2.5 3 0.1296 0.1094 0.0663 0.1702
Belgium 673 3.0 2 0.1517 0.1243 0.0573 0.2209
Brazil 1,060 5.0 1 0.1587 0.1347 0.0581 0.2403
Chile 822 4.0 2 0.1612 0.1519 0.0657 0.2342
China 4,332 1.0 2 0.0884 0.0526 0.0201 0.1174
Croatia 11 2.5 3 0.0810 0.1058 0.0017 0.1483
Czech Republic 23 4.0 3 0.1624 0.1253 0.0751 0.2107
Denmark 964 4.0 3 0.1591 0.1382 0.0637 0.2310
Egypt 111 3.0 2 0.1639 0.1275 0.0451 0.2577
Finland 978 3.5 1 0.1787 0.1615 0.0723 0.2588
France 4,013 3.5 0 0.1321 0.1049 0.0388 0.1895
Germany 4,036 3.5 3 0.1340 0.1042 0.0389 0.1962
Greece 1,294 2.0 1 0.1516 0.1175 0.0433 0.2282
Hungary 141 2.0 1 0.0961 0.0665 0.0159 0.1638
Indonesia 1,430 4.0 2 0.2132 0.1797 0.0447 0.3381
Italy 1,378 2.0 2 0.1330 0.1071 0.0412 0.1965

29
Japan 27,529 4.5 2 0.1320 0.1097 0.0418 0.1944
Jordan 51 1.0 1 0.1603 0.1432 0.0967 0.2242
Korea 2,570 4.5 3 0.1376 0.1032 0.0365 0.2008
Lithuania 26 4.0 2 0.1719 0.1098 0.0269 0.2838
Mexico 769 3.0 0 0.1935 0.1728 0.0856 0.2833
Morocco 51 2.0 1 0.0637 0.0177 0.0008 0.1078
Netherlands 963 2.5 3 0.1513 0.1339 0.0568 0.2308
Norway 620 3.5 2 0.2497 0.2211 0.1020 0.3827
Philippines 592 4.0 1 0.1801 0.1408 0.0668 0.2610
Portugal 349 2.5 1 0.2168 0.2085 0.1113 0.3169
Russian Federation 216 4.0 2 0.1642 0.1128 0.0445 0.2532
Slovak Republic 19 3.0 2 0.1416 0.1475 0.0427 0.2307
Slovenia 43 . 3 0.1272 0.1073 0.0782 0.1573
Spain 819 5.0 2 0.1395 0.1049 0.0483 0.2027
Sweden 1,392 3.5 1 0.1622 0.1304 0.0471 0.2443
Switzerland 1,477 3.0 1 0.1664 0.1418 0.0663 0.2448
Taiwan 4,878 3.0 2 0.1213 0.0992 0.0387 0.1790
Venezuela 94 1.0 3 0.0940 0.0683 0.0302 0.1275
Civil law median 794 4.0 2 0.1096
Sample median 822 4.0 2 0.1181

30
Table II: Leverage Regression Results
The table reports leverage regression results for our sample of 51 countries over the period 1991-2007. The
dependent variable is the long-term debt to total assets ratio. The definitions of the independent variables are
provided in Table AI. The numbers in the parentheses are clustered standard errors (clustered by two-digit SIC
industries in each country). *, ** and *** indicate two-tailed significance at the 10%, 5% and 1% levels,
respectively.
Independent var. Dependent variable = LT debt/TA
(1) (2) (3) (4)
Intercept 0.1939 0.0938 0.0939 0.1855
(0.0073)*** (0.0144)*** (0.0144)*** (0.0096)***
Log(Sales) 0.0011 0.0011 0.0010
(0.0006)* (0.0006)* (0.0005)**
PPE 0.2107 0.2100 0.1790
(0.0096)*** (0.0097)*** (0.0076)***
ROA 0.0003 -0.0020 -0.0061
(0.0091) (0.0093) (0.0097)
M/B 0.0039 0.0039 0.0037
(0.0004)*** (0.0004)*** (0.0003)***
Creditor rights -0.0210 -0.0234 -0.0230 -0.0230
(0.0027)*** (0.0020)*** (0.0020)*** (0.0018)***
Year fixed effects No No Yes Yes
Industry fixed effects No No No Yes
N. of observations 127,500 127,500 127,500 127,500
N. of countries 51 51 51 51
Adj. R2 0.0216 0.1281 0.1309 0.1636

31
Table III: Leverage Regression Results with Controls for Shareholder Rights and GDP
The table reports regression results for our sample of 51 countries over the period 1991-2007. The dependent
variable is the long-term debt to total assets ratio. The definitions of the independent variables are provided in
Table AI. The numbers in the parentheses are clustered standard errors (clustered by two-digit SIC industries
in each country). *, ** and *** indicate two-tailed significance at the 10%, 5% and 1% levels, respectively.
Independent var. Dependent variable = LT debt/TA
(1) (2) (3) (4) (5) (6)
Intercept 0.1842 0.1998 0.1938 0.0305 0.0388 0.1367
(0.0121)*** (0.0770)** (0.0267) *** (0.0289) (0.0293) (0.0235)***
Log(Sales) 0.0009 0.0009 0.0008
(0.0007) (0.0007) (0.0005)
PPE 0.2164 0.2153 0.1835
(0.0095)*** (0.0095)*** (0.0069)***
ROA 0.0061 0.0037 -0.0007
(0.0089) (0.0093) (0.0100)
M/B 0.0039 0.0039 0.0038
(0.0004)*** (0.0004)*** (0.0003)***
Creditor rights -0.0228 -0.0211 -0.0231 -0.0238 -0.0234 -0.0236
(0.0031)*** (0.0071)*** (0.0031) *** (0.0025)*** (0.0024)*** (0.0022)***
Shareholder rights 0.0035 0.0037 0.0023 0.0018 0.0022
(0.0035) (0.0035) (0.0031) (0.0031) (0.0028)
GDP -0.0006 -0.0010 0.0059 0.0053 0.0047
(0.0078) (0.0026) (0.0024)** (0.0025)** (0.0024)**
Year fixed effects No No No No Yes Yes
Industry fixed effects No No No No No Yes
N. of observations 127,457 127,500 127,457 127,457 127,457 127,457
N. of countries 50 51 50 50 50 50
Adj. R2 0.0221 0.0217 0.0221 0.1309 0.1330 0.1653

32
Table IV: Country-Level Leverage Regression Results
The table reports country-level leverage regression results for our pooled sample of 51 countries over the
period 1991-2007. The dependent variable (the country-level leverage) is the average long-term debt ratio for
firms of a given country in each individual year; thus the dependent variable is allowed to vary from year to
year. The definitions of the independent variables are provided in Table AI. Firm-level variables—log(Sales),
PPE, ROA and M/B—are yearly means for all firms of a given country. Creditor rights, shareholder rights and
GDP are country-level variables. The numbers in the parentheses are clustered standard errors (clustered by
country). *, ** and *** indicate two-tailed significance at the 10%, 5% and 1% levels, respectively.
Independent var. Dependent variable = country mean of LT debt/TA
(1) (2) (3) (4)
Intercept 0.1564 0.1434 0.1331 -0.0159
(0.0230)*** (0.0522)*** (0.0533)** (0.1081)
Log(Sales)_mean -0.0016
(0.0039)
PPE_mean 0.1466
(0.0750)*
ROA_mean 0.3809
(0.2882)
M/B_mean -0.0009
(0.0047)
Creditor rights -0.0132 -0.0121 -0.0131 -0.0162
(0.0065)** (0.0063)* (0.0064)** (0.0056)***
Shareholder rights 0.0048 0.0044 0.0060
(0.0056) (0.0058) (0.0063)
GDP 0.0031 0.0028 0.0144
(0.0057) (0.0057) (0.0082)*
Year fixed effects Yes Yes Yes Yes
N. of observations 755 762 755 755
N. of countries 50 51 50 50
Adj. R2 0.0586 0.0579 0.0615 0.1539

33
Table V: Robustness Checks
The table reports regression results for our sample of 51 countries over the period 1991-2007. The dependent
variable is the long-term debt to total assets ratio. Panel A reports the results of weighted least squares
regressions for which the weights are the reciprocal of the number of observations for a given country. The
following two panels report the results of the ordinary least squares regressions for our sample firm-years
after removing the U.S. (in Panel B) and the U.S. and Japan (in Panel C). The definitions of the independent
variables are provided in Table AI. The numbers in the parentheses are clustered standard errors (clustered by
two-digit SIC industries in each country). *, ** and *** indicate two-tailed significance at the 10%, 5% and 1%
levels, respectively.
Panel A: Weighted least squares regressions
Independent var. Dependent variable = LT debt/TA
(1) (2) (3) (4) (5) (6)
Intercept 0.1532 0.1226 0.1105 -0.1323 -0.1338 0.9190
(0.0109)*** (0.0493)** (0.0291) *** (0.0370)*** (0.0364) *** (214.7530)
Log(Sales) 0.0037 0.0037 0.0046
(0.0011)*** (0.0011) *** (0.0010)***
PPE 0.1959 0.1972 0.1689
(0.0150)*** (0.0156) *** (0.0126)***
ROA -0.0700 -0.0686 -0.0778
(0.0155)*** (0.0158) *** (0.0151)***
M/B 0.0041 0.0040 0.0039
(0.0007)*** (0.0007) *** (0.0007)***
Creditor rights -0.0148 -0.0122 -0.0137 -0.0162 -0.0164 -0.0167
(0.0042)*** (0.0065)* (0.0040) *** (0.0036)*** (0.0035) *** (0.0031)***
Shareholder rights 0.0079 0.0067 0.0053 0.0054 0.0068
(0.0035)** (0.0034) ** (0.0033) (0.0033) (0.0030)**
GDP 0.0060 0.0051 0.0153 0.0157 0.0157
(0.0053) (0.0029) * (0.0027)*** (0.0026) *** (0.0023)***
Year fixed effects No No No No Yes Yes
Industry fixed effects No No No No No Yes
N. of observations 127,457 127,500 127,457 127,457 127,457 127,457
N. of countries 50 51 50 50 50 50
Adj. R2 0.0145 0.0147 0.0173 0.1267 0.1279 0.1746
Panel B: Without the U.S.
Independent var. Dependent variable = LT debt/TA
(1) (2) (3) (4) (5) (6)
Intercept 0.1382 0.2048 0.1883 -0.0072 0.0014 0.1635

34
(0.0088)*** (0.0730)*** (0.0219) *** (0.0246) (0.0253) (0.0261)***
Log(Sales) 0.0028 0.0027 0.0028
(0.0006)*** (0.0006) *** (0.0005)***
PPE 0.2160 0.2153 0.1816
(0.0101)*** (0.0101) *** (0.0077)***
ROA -0.0469 -0.0501 -0.0569
(0.0098)*** (0.0101) *** (0.0099)***
M/B 0.0049 0.0048 0.0045
(0.0004)*** (0.0004) *** (0.0004)***
Creditor rights -0.0147 -0.0111 -0.0151 -0.0147 -0.0145 -0.0149
(0.0028)*** (0.0044)** (0.0027) *** (0.0020)*** (0.0019) *** (0.0017)***
Shareholder rights 0.0085 0.0106 0.0082 0.0078 0.0079
(0.0026)*** (0.0027) *** (0.0026)*** (0.0025) *** (0.0024)***
GDP -0.0042 -0.0061 0.0001 -0.0004 -0.0013
(0.0072) (0.0023) *** (0.0022) (0.0022) (0.0020)
Year fixed effects No No No No Yes Yes
Industry fixed effects No No No No No Yes
N. of observations 97,564 97,607 97,564 97,564 97,564 97,564
N. of countries 49 50 49 49 49 49
Adj. R2 0.0111 0.0091 0.0148 0.1409 0.1424 0.1770
Panel C: Without the U.S. and Japan
Independent var. Dependent variable = LT debt/TA
(1) (2) (3) (4) (5) (6)
Intercept 0.1353 0.1915 0.1613 -0.1377 -0.1328 0.0074
(0.0087)*** (0.0808)** (0.0210) *** (0.0238)*** (0.0241) *** (0.0291)
Log(Sales) 0.0066 0.0066 0.0064
(0.0007)*** (0.0007) *** (0.0006)***
PPE 0.1991 0.1992 0.1738
(0.0096)*** (0.0097) *** (0.0083)***
ROA -0.0475 -0.0488 -0.0536
(0.0088)*** (0.0089) *** (0.0088)***
M/B 0.0042 0.0042 0.0041
(0.0004)*** (0.0004) *** (0.0004)***
Creditor rights -0.0180 -0.0120 -0.0176 -0.0180 -0.0179 -0.0183
(0.0031)*** (0.0052)** (0.0030) *** (0.0020)*** (0.0020) *** (0.0017)***
Shareholder rights 0.0127 0.0131 0.0119 0.0117 0.0114
(0.0024)*** (0.0026) *** (0.0022)*** (0.0022) *** (0.0021)***

35
GDP -0.0023 -0.0031 0.0067 0.0067 0.0057
(0.0085) (0.0024) (0.0022)*** (0.0022) *** (0.0020)***
Year fixed effects No No No No Yes Yes
Industry fixed effects No No No No No Yes
N. of observations 70,035 70,078 70,035 70,035 70,035 70,035
N. of countries 48 49 48 48 48 48
Adj. R2 0.0203 0.0112 0.0212 0.1438 0.1443 0.1765

36
Table VI: Additional Country Characteristics as Control Variables
The table reports the estimated coefficients for creditor rights (CR) from five regression models for our
sample of 51 countries over the period 1991-2007. The dependent variable is the long-term debt to total assets
ratio. For brevity, the table presents only the coefficients for CR. All regression models include CR and
respective country variables listed in the first column (labeled “Country variables included”) along with the
following independent variables: four firm characteristics (log(Sales), PPE, ROA and M/B) and two country
characteristics (shareholder rights and GDP). Legal origins are a set of dummy variables that cover five
families of legal origin: Anglo-Saxon, French, German, Scandinavian, and Socialite. The rule of law is an
index of the law and order tradition in the country from La Porta et al. (2007). Financial development is total
financial market development (B_TOTALMKT) which is the average of stock market and credit market
development. The definitions of these independent variables are provided in Table AI. The numbers in the
parentheses are clustered standard errors (clustered by two-digit SIC industries in each country). *, ** and
*** indicate two-tailed significance at the 10%, 5% and 1% levels, respectively.
Country variables included Dependent var. = LT debt/TA
(1) (2)
Legal origins only -0.0147 -0.0160
(0.0020)*** (0.0017) ***
N. of countries 50 50
Rule of law only -0.0125 -0.0129
(0.0026)*** (0.0020) ***
N. of countries 42 42
Financial development only -0.0107 -0.0120
(0.0020)*** (0.0017) ***
N. of countries 47 47
Property rights only -0.0197 -0.0206
(0.0027)*** (0.0020) ***
N. of countries 33 33
All of the above added -0.0142 -0.0161
(0.0024)*** (0.0017) ***
N. of countries 32 32
Year fixed effects Yes Yes
Industry fixed effects No Yes

37
Table VII: Alternative Leverage Measures
The table reports the regression results for our sample countries over the period 1991-2007. In Panel A, the
dependent variable is d(LT debt)—the change in the amount of long-term debt from year t to year t+1—
deflated by total assets at year t. The independent variables, including the total debt to total assets ratio
(TD/TA), are measured on the basis of year t values. In Panel B, the dependent variable is the ratio of total
debt (i.e., the sum of short-term debt and long-term debt) to total assets. In Panel C, the dependent variable is
the ratio of long-term debt to market assets (i.e., book assets plus market equity less book equity). The
definitions of the independent variables are provided in Table AI. The numbers in the parentheses are
clustered standard errors (clustered by two-digit SIC industries in each country). *, ** and *** indicate two-
tailed significance at the 10%, 5% and 1% levels, respectively.
Panel A: d(LT debt)/TA
Independent var. Dependent var. = d(LT debt)/TA
(1) (2) (3) (4) (5) (6)
Intercept 0.0538 0.0361 0.0475 0.0872 0.0957 0.1012
(0.0054)*** (0.0105)*** (0.0093)*** (0.0102)*** (0.0103)*** (0.0095)***
Log(Sales) -0.0049 -0.0050 -0.0047
(0.0004)*** (0.0004)*** (0.0004)***
PPE 0.0648 0.0636 0.0618
(0.0060)*** (0.0059)*** (0.0061)***
ROA 0.1860 0.1837 0.1852
(0.0094)*** (0.0092)*** (0.0093)***
M/B 0.0066 0.0065 0.0062
(0.0003)*** (0.0003)*** (0.0003)***
TD/TA 0.0047 0.0144 0.0157
(0.0050) (0.0057)** (0.0055)***
Creditor rights -0.0034 -0.0070 -0.0032 -0.0054 -0.0055 -0.0050
(0.0013)** (0.0013)*** (0.0013)** (0.0012)*** (0.0012)*** (0.0010)***
Shareholder rights -0.0069 -0.0070 -0.0013 -0.0010 -0.0014
(0.0014)*** (0.0014)*** (0.0011) (0.0011) (0.0010)
GDP -0.0002 0.0007 0.0012 0.0021 0.0016
(0.0011) (0.0010) (0.0010) (0.0010)** (0.0010)*
Year fixed effects No No No No Yes Yes
Industry fixed effects No No No No No Yes
N. of observations 127,457 127,500 127,457 127,457 127,457 127,457
N. of countries 50 51 50 50 50 50
Adj. R2 0.0029 0.0017 0.0030 0.0888 0.0927 0.0974
Panel B: Total debt/TA
Independent var. Dependent var. = Total debt/TA
(1) (2) (3) (4) (5) (6)
Intercept 0.2890 0.4319 0.4285 0.1299 0.1610 0.3017
(0.0157)*** (0.0455)*** (0.0218)*** (0.0258)*** (0.0258)*** (0.0199)***
Log(Sales) 0.0086 0.0085 0.0074
(0.0008)*** (0.0007)*** (0.0006)***
PPE 0.2227 0.2171 0.1991
(0.0128)*** (0.0124)*** (0.0093)***

38
ROA -0.1005 -0.1205 -0.1269
(0.0216)*** (0.0223)*** (0.0231)***
M/B 0.0039 0.0037 0.0042
(0.0005)*** (0.0004)*** (0.0004)***
Creditor rights -0.0064 -0.0090 -0.0101 -0.0083 -0.0070 -0.0087
(0.0041) (0.0065) (0.0036)*** (0.0025)*** (0.0024)*** (0.0018)***
Shareholder rights -0.0014 0.0021 -0.0067 -0.0084 -0.0071
(0.0038) (0.0031) (0.0023)*** (0.0022)*** (0.0019)***
GDP -0.0148 -0.0150 -0.0081 -0.0121 -0.0114
(0.0048)*** (0.0023)*** (0.0018)*** (0.0018)*** (0.0016)***
Year fixed effects No No No No Yes Yes
Industry fixed effects No No No No No Yes
N. of observations 127,457 127,500 127,457 127,457 127,457 127,457
N. of countries 50 51 50 50 50 50
Adj. R2 0.0016 0.0112 0.0113 0.0997 0.1729 0.1964
Panel C: LT-debt/Market assets
Independent var. Dependent var. = LT-debt/Market Assets
(1) (2) (3) (4) (5) (6)
Intercept 0.1212 0.1782 0.1610 0.0465 0.0472 0.1363
(0.0108)*** (0.0736)** (0.0225) *** (0.0261) * (0.0262)* (0.0203) ***
Log(Sales) 0.0014 0.0014 0.0010
(0.0006) ** (0.0006)** (0.0005) **
PPE 0.1876 0.1853 0.1609
(0.0094) *** (0.0094)*** (0.0063) ***
ROA -0.0490 -0.0467 -0.0508
(0.0104) *** (0.0105)*** (0.0108) ***
M/B -0.0053 -0.0052 -0.0051
(0.0003) *** (0.0003)*** (0.0002) ***
Creditor rights -0.0173 -0.0127 -0.0184 -0.0196 -0.0191 -0.0200
(0.0028)*** (0.0035)*** (0.0027) *** (0.0022) *** (0.0021)*** (0.0019) ***
Shareholder rights 0.0096 0.0106 0.0060 0.0058 0.0063
(0.0028)*** (0.0029) *** (0.0028) ** (0.0027)** (0.0024) ***
GDP -0.0030 -0.0043 0.0017 0.0009 0.0008
(0.0071) (0.0023) * (0.0021) (0.0021) (0.0020)
Year fixed effects No No No No Yes Yes
Industry fixed effects No No No No No Yes
N. of observations 127,457 127,500 127,457 127,457 127,457 127,457
N. of countries 50 51 50 50 50 50
Adj. R2 0.0136 0.0103 0.0152 0.1485 0.1542 0.1878

39
Table VIII: Leverage Regression Results with Components of Creditor Rights
The table reports the regression results for our sample of 51 countries over the period 1991-2007. The
dependent variable is the long-term debt to total assets ratio. The definitions of the independent variables are
provided in Table AI. The numbers in the parentheses are clustered standard errors (clustered by two-digit SIC
industries in each country). *, ** and *** indicate two-tailed significance at the 10%, 5% and 1% levels,
respectively.
Independent var. Dependent variable = LT debt/TA
(1) (2) (3) (4)
Intercept 0.1222 0.1059 0.1909 -0.0107
(0.0272)*** (0.0293)*** (0.0276)*** (0.0228)
Log(Sales) -0.0003 0.0014 0.0003 0.0042
(0.0006) (0.0005)*** (0.0006) (0.0005)***
PPE 0.1817 0.1780 0.1773 0.1829
(0.0069)*** (0.0068)*** (0.0068)*** (0.0070)***
ROA 0.0053 -0.0015 0.0032 -0.0136
(0.0100) (0.0097) (0.0098) (0.0096)
M/B 0.0037 0.0038 0.0039 0.0036
(0.0003)*** (0.0003)*** (0.0003)*** (0.0003)***
NO_AUTOSTAY -0.0331
(0.0052)***
SECURED_FIRST 0.0104
(0.0054)*
RESTRICT_REORG -0.0333
(0.0045)***
MGMT_NOT_STAY -0.0549
(0.0044)***
Shareholder rights -0.0034 -0.0112 -0.0074 -0.0003
(0.0033) (0.0031)*** (0.0029)** (0.0027)
GDP 0.0070 0.0071 0.0006 0.0121
(0.0026)*** (0.0030)** (0.0029) (0.0023)***
Year fixed effects Yes Yes Yes Yes
Industry fixed effects Yes Yes Yes Yes
N. of observations 127,457 127,457 127,457 127,457
N. of countries 50 50 50 50
Adj. R2 0.1540 0.1470 0.1525 0.1701
Sample distribution for components of creditor rights
NO_ SECURED_ RESTRICT_ MGMT_

40
AUTOSTAY FIRST REORG NOT_STAY
N. of observations with value=0 94,339 10,060 98,134 60,884
% of observations with value=0 74.02% 7.89% 76.99% 47.77%
N. of observations with value=1 33,118 117,397 29,323 66,573
% of observations with value=1 25.98% 92.11% 23.01% 52.23%

41
Table IX: Quantile Regression Results
The table reports the quantile regression results for our sample of 51 countries over the period 1991-2007. The dependent variable is LT debt/TA. The
explanatory variable of interest is creditor rights. The regression controls for four firm characteristics: Log(Sales), PPE, ROA and M/B. The
definitions of these are provided in Table AI. For brevity, the table reports coefficient estimates at nine quantiles of LT debt/TA from 0.1 to 0.9. The
standard errors in quantile regression are computed using the MCMB resampling method of He and Hu (2002). *, ** and *** indicate two-tailed
significance at the 10%, 5% and 1% levels, respectively.
Dependent var.
= LT debt/TA
Quantiles of LT debt/TA
0.1 0.2 0.3 0.4 0.5 0.6 0.7 0.8 0.9
Log(Sales) 0.0006 0.0019 0.0030 0.0036 0.0037 0.0032 0.0017 -0.0011 -0.0061
(0.0000)*** (0.0001)*** (0.0001) *** (0.0001) *** (0.0001)*** (0.0001)*** (0.0002) *** (0.0002)*** (0.0003) ***
PPE 0.0438 0.1059 0.1584 0.2017 0.2373 0.2621 0.2815 0.2954 0.3001
(0.0008)*** (0.0014)*** (0.0015) *** (0.0019) *** (0.0021)*** (0.0027)*** (0.0030) *** (0.0031)*** (0.0038) ***
ROA -0.0027 -0.0066 -0.0093 -0.0103 -0.0081 -0.0059 -0.0058 -0.0149 -0.0060
(0.0005)*** (0.0009)*** (0.0017) *** (0.0023) *** (0.0028)*** (0.0049) (0.0060) (0.0085)* (0.0088) ***
M/B 0.0001 0.0002 0.0006 0.0012 0.0025 0.0043 0.0064 0.0085 0.0105
(0.0000)** (0.0000)*** (0.0001) *** (0.0001) *** (0.0002)*** (0.0002)*** (0.0003) *** (0.0003)*** (0.0003) ***
Creditor rights -0.0027 -0.0065 -0.0105 -0.0151 -0.0206 -0.0255 -0.0293 -0.0331 -0.0400
(0.0001)*** (0.0002)*** (0.0002) *** (0.0003) *** (0.0004)*** (0.0004)*** (0.0006) *** (0.0006)*** (0.0008) ***
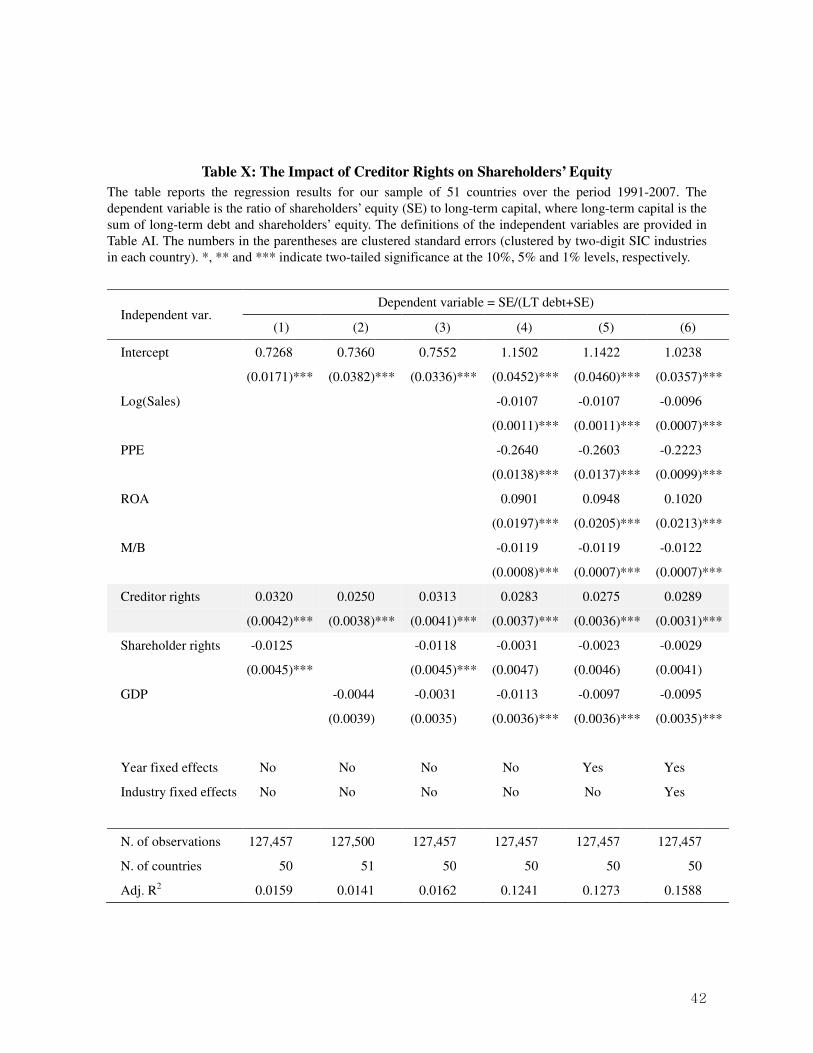
42
Table X: The Impact of Creditor Rights on Shareholders’ Equity
The table reports the regression results for our sample of 51 countries over the period 1991-2007. The
dependent variable is the ratio of shareholders’ equity (SE) to long-term capital, where long-term capital is the
sum of long-term debt and shareholders’ equity. The definitions of the independent variables are provided in
Table AI. The numbers in the parentheses are clustered standard errors (clustered by two-digit SIC industries
in each country). *, ** and *** indicate two-tailed significance at the 10%, 5% and 1% levels, respectively.
Independent var. Dependent variable = SE/(LT debt+SE)
(1) (2) (3) (4) (5) (6)
Intercept 0.7268 0.7360 0.7552 1.1502 1.1422 1.0238
(0.0171)*** (0.0382)*** (0.0336)*** (0.0452) *** (0.0460)*** (0.0357) ***
Log(Sales) -0.0107 -0.0107 -0.0096
(0.0011) *** (0.0011)*** (0.0007) ***
PPE -0.2640 -0.2603 -0.2223
(0.0138) *** (0.0137)*** (0.0099) ***
ROA 0.0901 0.0948 0.1020
(0.0197) *** (0.0205)*** (0.0213) ***
M/B -0.0119 -0.0119 -0.0122
(0.0008) *** (0.0007)*** (0.0007) ***
Creditor rights 0.0320 0.0250 0.0313 0.0283 0.0275 0.0289
(0.0042)*** (0.0038)*** (0.0041)*** (0.0037) *** (0.0036)*** (0.0031) ***
Shareholder rights -0.0125 -0.0118 -0.0031 -0.0023 -0.0029
(0.0045)*** (0.0045)*** (0.0047) (0.0046) (0.0041)
GDP -0.0044 -0.0031 -0.0113 -0.0097 -0.0095
(0.0039) (0.0035) (0.0036) *** (0.0036)*** (0.0035) ***
Year fixed effects No No No No Yes Yes
Industry fixed effects No No No No No Yes
N. of observations 127,457 127,500 127,457 127,457 127,457 127,457
N. of countries 50 51 50 50 50 50
Adj. R2 0.0159 0.0141 0.0162 0.1241 0.1273 0.1588

43
Table XI: Subgroup Leverage Regression Results
The table reports regression results for our sample of 51 countries over the period 1991-2007. The dependent
variable is the long-term debt to total assets ratio. The definitions of the independent variables are provided in
Table AI. In Panel A, information sharing (no information sharing) countries are those with (without) either a
public credit registry or a credit bureau. In Panel B, good-rule-of-law (poor-rule-of-law) countries are those
with the above (below) median rule-of-the-law score. In Panel C, countries with long (short) contract
enforcement days are those with the above (below) contract enforcement days. In Panel D, financially
developed (underdeveloped) countries are those with the above (below) median financial market development
score (FINMKT). The numbers in the parentheses are clustered standard errors (clustered by two-digit SIC
industries in each country). *, ** and *** indicate two-tailed significance at the 10%, 5% and 1% levels,
respectively. The numbers in the parentheses are clustered standard errors (clustered by two-digit SIC
industries in each country). *, ** and *** indicate two-tailed significance at the 10%, 5% and 1% levels,
respectively.
Panel A: Information sharing
Independent var. Dependent variable = LT debt/TA
No information sharing Information sharing
Intercept -0.2020 0.1932
(0.0577)*** (0.0097)***
Log(Sales) 0.0078 0.0007
(0.0024)*** (0.0005)
PPE 0.2473 0.1710
(0.0217)*** (0.0071)***
ROA -0.0102 -0.0005
(0.0426) (0.0104)
M/B -0.0006 0.0041
(0.0008) (0.0003)***
Creditor rights -0.0233 -0.0217
(0.0071)*** (0.0017)***
Year fixed effects Yes Yes
Industry fixed effects Yes Yes
N. of observations 14,187 113,313
N. of countries 8 43
Adj. R2 0.2523 0.1646
Panel B: Rule of law
Independent var. Dependent variable = LT debt/TA
Poor rule of law Good rule of law
Intercept 0.2899 0.2150
(0.0262)*** (0.0096)***
Log(Sales) 0.0091 -0.0006
(0.0008)*** (0.0005)
PPE 0.1870 0.1821
(0.0167)*** (0.0075)***
ROA -0.1521 0.0144
(0.0189)*** (0.0100)
M/B 0.0054 0.0038

44
(0.0009)*** (0.0003)***
Creditor rights -0.0263 -0.0229
(0.0033)*** (0.0018)***
Year fixed effects Yes Yes
Industry fixed effects Yes Yes
N. of observations 22,962 99,676
N. of countries 21 21
Adj. R2 0.1936 0.1813
Panel C: Contract enforcement days
Independent var. Dependent variable = LT debt/TA
Long enforcement days Short enforcement days
Intercept 0.2652 0.2082
(0.0289)*** (0.0099)***
Log(Sales) 0.0104 -0.0004
(0.0010)*** (0.0005)
PPE 0.1617 0.1810
(0.0182)*** (0.0070)***
ROA -0.1262 0.0060
(0.0199)*** (0.0103)
M/B 0.0047 0.0034
(0.0009)*** (0.0003)***
Creditor rights -0.0231 -0.0228
(0.0037)*** (0.0019)***
Year fixed effects Yes Yes
Industry fixed effects Yes Yes
N. of observations 22,794 104,706
N. of countries 26 25
Adj. R2 0.1873 0.1712
Panel D: Financial market development
Independent var. Dependent variable = LT debt/TA
Fin. undeveloped countries Fin. developed countries
Intercept 0.2912 0.1985
(0.0311)*** (0.0096)***
Log(Sales) 0.0049 0.0004
(0.0013)*** (0.0005)
PPE 0.2304 0.1746
(0.0222)*** (0.0074)***
ROA -0.1928 0.0054
(0.0316)*** (0.0102)
M/B 0.0039 0.0040
(0.0009)*** (0.0003)***
Creditor rights 0.0093 -0.0244
(0.0060) (0.0018)***
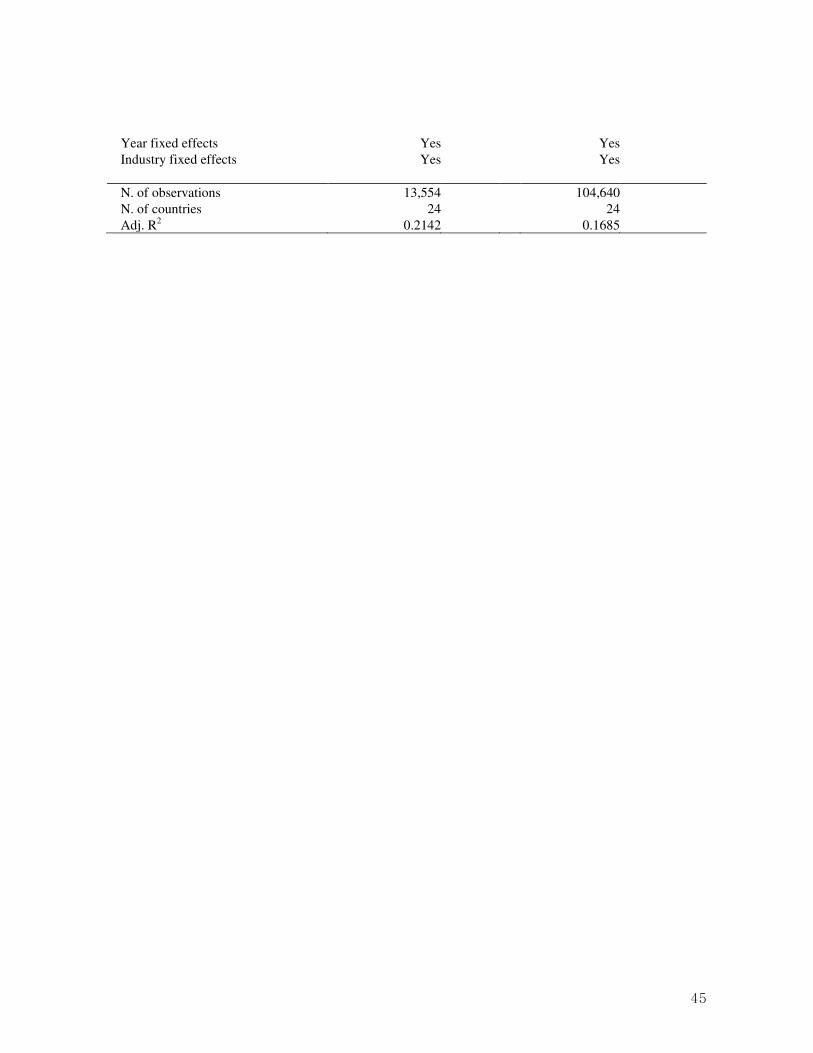
45
Year fixed effects Yes Yes
Industry fixed effects Yes Yes
N. of observations 13,554 104,640
N. of countries 24 24
Adj. R2 0.2142 0.1685

46
Figure 1: Median long-term debt ratio for groups of countries classified by creditor rights
The graph plots the median long-term debt ratio for five groups of countries classified by the creditor rights
index (CR). Long-term debt ratio is defined as the ratio of long-term debt to total assets. The median long-
term debt ratio for each CR group is the median of country-level medians that is obtained in the following
two-step approach: We first calculate the median long-term debt ratio for firm-years of each country in our 51
country sample over the period 1991-2007 and we then calculate the median of these median country-level
ratios for a given CR group. N is the number of countries that belong to a given CR group.
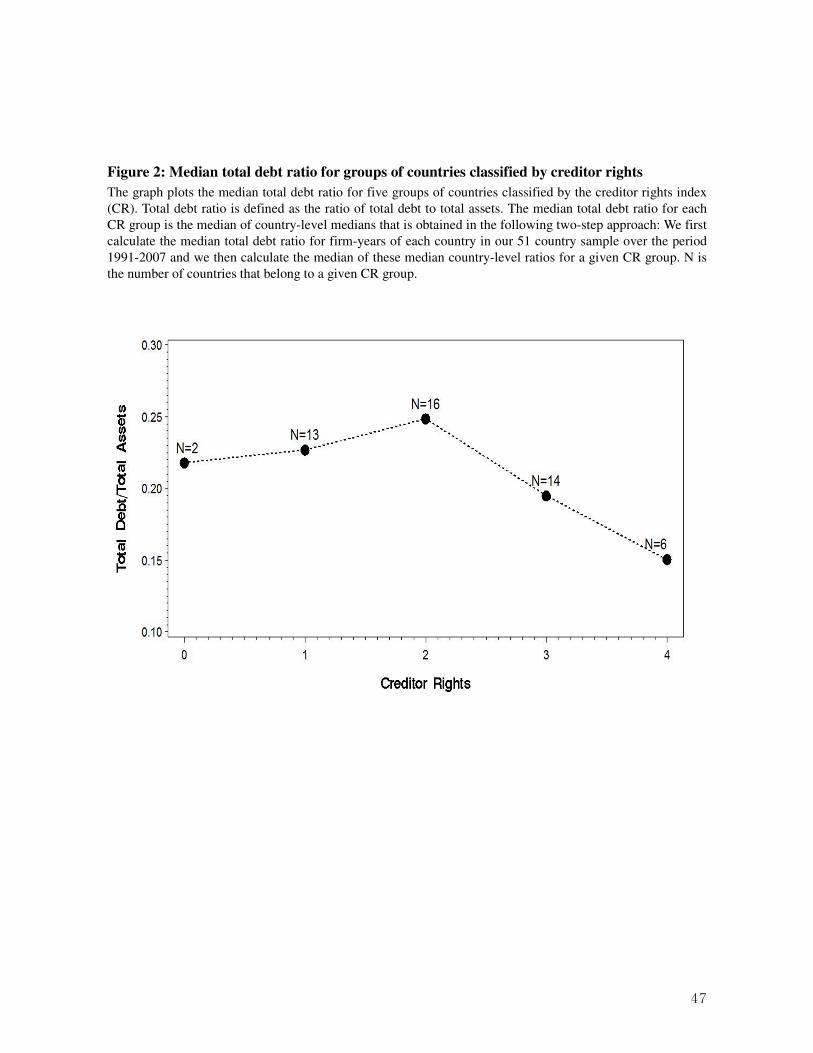
47
Figure 2: Median total debt ratio for groups of countries classified by creditor rights
The graph plots the median total debt ratio for five groups of countries classified by the creditor rights index
(CR). Total debt ratio is defined as the ratio of total debt to total assets. The median total debt ratio for each
CR group is the median of country-level medians that is obtained in the following two-step approach: We first
calculate the median total debt ratio for firm-years of each country in our 51 country sample over the period
1991-2007 and we then calculate the median of these median country-level ratios for a given CR group. N is
the number of countries that belong to a given CR group.

48
Figure 3: Median long-term debt ratio for groups of countries classified by shareholder rights
The graph plots the median long-term debt ratio for five groups of countries classified by the shareholder
rights index (AD). Long-term debt ratio is defined as the ratio of long-term debt to total assets. The median
long-term debt ratio for each AD group is the median of country-level medians that is obtained in the
following two-step approach: We first calculate the median long-term debt ratio for firm-years of each country
in our 51 country sample over the period 1991-2007 and we then calculate the median of these median
country-level ratios for a given AD group. N is the number of countries that belong to a given AD group.

49
Figure 4: Median ratio of shareholder’s equity to long-term capital for groups of countries
classified by creditor rights
The graph plots the median ratio of shareholder’s equity (SE) to long-term capital (LTC) for five groups of
countries classified by the creditor rights index (CR). Long-term capital is the sum of long-term debt and
shareholders’ equity. The median ratio of SE to LTC for each CR group is the median of country-level
medians that is obtained in the following two-step approach: We first calculate the median SE-to-LTC ratio
for firm-years of each country in our 51 country sample over the period 1991-2007 and we then calculate the
median of these median country-level ratios for a given CR group. N is the number of countries that belong to
a given CR group.