Embed Size (px)
Citation preview

SUMMARY1 - DIFFERENT INSURERS AND THEIR MARKET SHARE ........................... 2
Global market shares ........................................................................... 2
2 - FINANCIAL RESULTS OF THE LEADING PLAYERS IN 2014................ 3
Revenue (€m) ...................................................................................... 3
Net Profit (€m) ..................................................................................... 4
Loss Ratio and Combined Ratio (%) .................................................... 5
Net Equity (€m) .................................................................................... 6
Staff .................................................................................................... 6
Reinsurance ........................................................................................ 6
3 - FINANCIAL RATINGS ....................................................................................... 7
1 DIFFERENT INSURERS AND THEIR MARKET SHARE
Two main categories of insurers can be distinguished :
«Global» insurers, characterised by : • a strong international presence• detailed information on enormous numbers of buyers in their global databases• global capabilities in providing credit management servicesLeading insurers in this category: Atradius, Coface, Euler Hermes, QBE (for Asia and some other selected countries),
«Niche» insurers, characterised by expertise in :• particular products: excess of loss cover, top-up, single risk (e.g.: ACE, AIG, Equinox, Lloyd’s, Markel,
QBE, TCRe etc.)• certain geographical areas (e.g.: Credimundi, FCIA etc.)• differenttypesofrisk:politicalrisk,nontransfer(e.g.:Garant, Liberty Mutual, Lloyd’s etc.)
GLOBAL MARKET SHARES
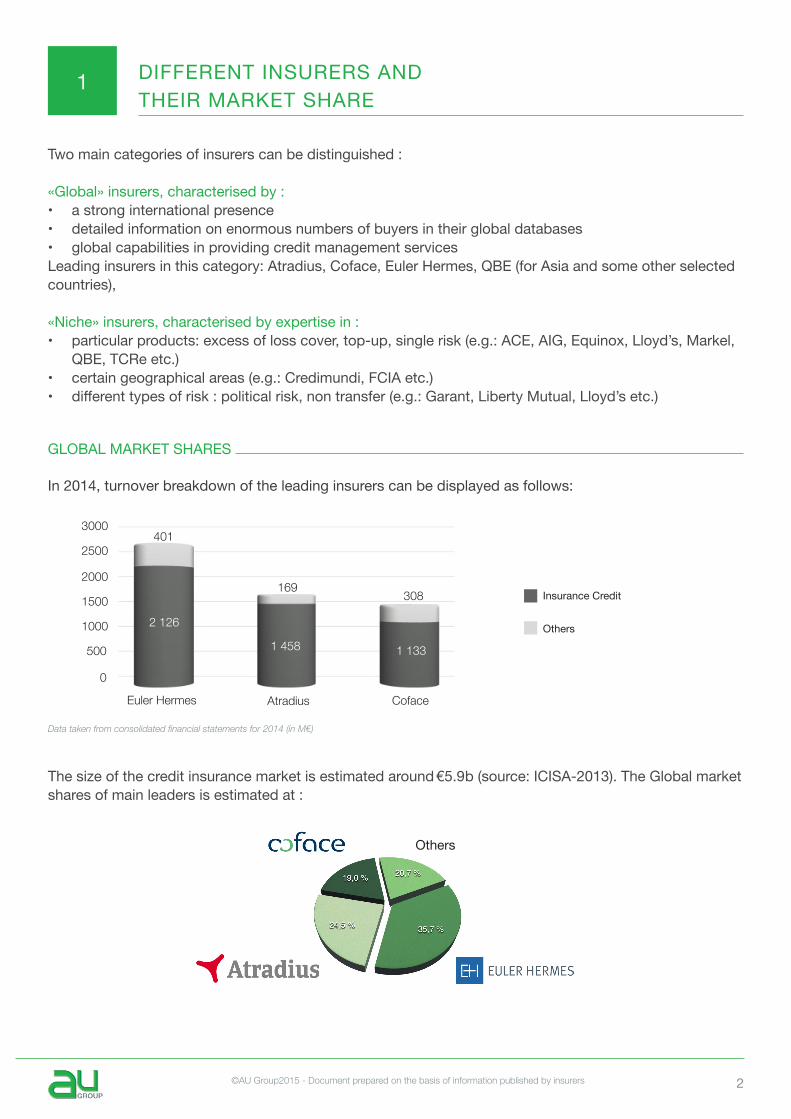
In 2014, turnover breakdown of the leading insurers can be displayed as follows:
Thesizeofthecreditinsurancemarketisestimatedaround € 5.9 b (source: ICISA-2013). The Global market shares of main leaders is estimated at :
Others
2 ©AU Group2015 - Document prepared on the basis of information published by insurers
Insurance Credit
Others
Data taken from consolidated financial statements for 2014 (in M€)
3000
2500
2000
1500
500
0
1000
Euler Hermes CofaceAtradius
401
169 308
2 126
1 458 1 133

2 FINANCIAL RESULTS OF THE LEADING PLAYERS IN 2014
REVENUE (€m)
Once again, Euler Hermes sales have increased on a regular basis (since 6 years), reaching € 2.5 bn. Atradius posted the best growth in turnover (+3 %) reaching in excess of € 1.6 bn. Coface performance remain stable around € 1.4 bn revenue.
In a challenging economic environment, credit insurers have seen their overall performance deeply impacted by the global economic slowdown, as insurance premiums are often calculated on a rate applicable on sales.
(Please note that revenue includes premiums earned through credit insurance activity and, in some cases, sales from factoring, bonding and intelligence as well as enquiry and monitoring fees)
Thoseevolutionshidesomelargegeographicaldisparities,andimportantdifferencesinperformancesamong players.
3 ©AU Group2015 - Document prepared on the basis of information published by insurers
Euler Hermes CofaceAtradius

NET PROFIT (€m)
Insurers“NetProfitAfterTax”reflectstheeconomiccycles.Earningswereseriouslyhurtbythefinancialcrisis of 2 008 and 2009. Atradius and Coface posted heavy losses during these years.
Wenoticethatleadingplayersshowstableprofitsfor5yearsinarow :
• EulerHermesNetprofitslightlyfellfrom € 314 m to € 302 m ;• meanwhileAtradiuspostedasignificantincreaseinitsresultsof19%reaching € 161 m (against €135 m
in 2013).• Coface, that successfully achieved its IPO in 2014, showed results in line with last years : € 129 m in
2012, € 127 m in 2013, €125 m in 2014.
4 ©AU Group2015 - Document prepared on the basis of information published by insurers
Euler Hermes CofaceAtradius
2008
2009
2010
2011
2012
2013
2014
400
300
200
100
(100)
(200)
(300)
-
302
161
125

LOSS RATIO and COMBINED RATIO (%)
Aninsurer’sprofitabilityisdeterminedbytheLossRatio(claims/premiums)andtheCombinedRatio(Lossratioplusoverheadexpenses).Duringthefinancialcrisis,insurers(includingEulerHermes)wereshakenbyincreased payments defaults and bankruptcies and the resulting claims to be paid to their insureds.
The theoretical break-even point of this ratio is 70 % (above which Insurers consider that their operations generate a loss).
The theoretical break-even point of the combined ratio is an estimated 100 % (above which Insurers consider that their operations generate a loss).
Euler Hermes Atradius Coface Euler Hermes Atradius Coface
For both ratios, we notice a convergence in 2014 of all the underwriters, improving their cost structure as well as their risk appetite policy.
100
90
80
70
60
50
40
30
2008 2009 2010 2011 2012 2013 20142008 2009 2010 2011 2012 2013 2014
130
120
110
100
90
80
70
60
50
5 ©AU Group2015 - Document prepared on the basis of information published by insurers

NET EQUITY (€m)
Further to changes in the financial regulations (Solvency II), insurance and reinsurance companies arerequired to increase the weight of capital equity. Thus, the level of credit insurer’s net equity must be in line with the risks they carry.
Since 2009, credit insurers kept on strengthening their equity. For instance, Euler Hermes and Coface report an equity higher than their annual turnover.
STAFF
Employees are some measure of an insurer’s capacity to provide quality service anywhere in the world. The staff cost to revenue ratio reflects thecompany’s productivity.
REINSURANCE
Reinsurance contributes materially to the solvency of insurance companies. Its role becomes more essential as credit insurance becomes more important with the growth of trade credit and the tighteningoftraditionalfinancingacrosstheworld.
Euler Hermes, Atradius and Coface, which currently cover 80 % of credit insurance risks, would be unable to maintain growth without reinsurance.
These insurance companies use reinsurance treaties.
Atradius is the company presenting the best turnover per capita.
Headcount Euler Hermes Atradius Coface
Numbers employed
6 411 3 298 4 440
Turnover per capita
394 166 493 329 324 550
6 ©AU Group2015 - Document prepared on the basis of information published by insurers
Euler Hermes CofaceAtradius

3 FINANCIAL RATINGS
To provide the most realistic view of the ratings of the leading insurers, we have analysed those issued by the major rating agencies.
The major insurers are currently rated as follows :
There have been no changes since our last study in May 2014.This gives the following positions in the rating scales :
7 ©AU Group2015 - Document prepared on the basis of information published by insurers
Standard & Poorsrating scale
Moody’s ratingscale
Fitch’ratingscale
A.M. Bestsrating scale

Document prepared on the basis of information published by insurers
This document is the exclusive property of AU Group.Itshallnotbeused, reproduced, represented,modifiedorcommunicated intoanyother formatwithout AU Group’s prior and explicit authorisation.
AU GROUP [email protected] - WWW.AU-GROUP.COM
ABOUT
AU GROUP Supports its clients in structuring, negotiating and implementing solutions for the :
PROTECTION AGAINST CUSTOMER’S PAYMENT DEFAULT - by transfering the risk to the most suitable market
MANAGEMENT OF THE TRADE RECEIVABLES - by optimising credit management tools & techniques with the use of IT solutions
FINANCING AND WORKING CAPITAL SECURITISATION-bypledgingtradereceivablestoappropriatefinancecompanies
AU GROUP Is the leading global broker specialised in these areas
1929DATE OF CREATION
100 %PRIVATELY OWNED
+ 2500CLIENTS
37OFFICES
26COUNTRIES
250A TEAM OF 250 STAFF
WORLDWIDE
€ 300 b.MORE THAN € 300 BILLION OF TRADE COVERED PER YEAR