Embed Size (px)
Citation preview
CREDIT ANALYSIS
INSURANCE SEPTEMBER 30, 2010
Table of Contents:
SUMMARY RATING RATIONALE 1 GROUP OVERVIEW 2 ANALYSIS OF RATING CONSIDERATIONS 3
Discussion of Business Profile Drivers 3 Discussion of Financial Profile Drivers 7
COMPANY ANNUAL STATISTICS 15 MOODY’S RELATED RESEARCH 17
Analyst Contacts:
NEW YORK 1.212.553.1653
Ann G. Perry 1.212.553.4607 Vice President-Senior Credit Officer [email protected] Marc Abusch 1.212.553.1484 Associate Analyst [email protected] Robert Riegel 1.212.553.4663 Managing Director-Insurance [email protected]
This Credit Analysis provides an in-depth discussion of credit rating(s) for New York Life Insurance Company and should be read in conjunction with Moody’s most recent Credit Opinion and rating information available on Moody's website.
New York Life Insurance Company New York, New York, United States
Summary Rating Rationale
Moody's rates New York Life Insurance Company (NYLIC; and collectively with its subsidiaries, New York Life), and its wholly owned subsidiary, New York Life Insurance and Annuity Corporation (NYLIAC), Aaa for insurance financial strength (IFS). The rating is based upon New York Life's leading position in the U.S. life insurance market, and significant financial flexibility and operational scale. In addition, the rating also reflects the group's earnings diversity, very strong liquidity, and outstanding capitalization.
With the demutualization of some of its key competitors in the past decade, New York Life is the largest mutual life insurer in the U.S. The company has been able to capitalize on this unique position by underscoring the difference in its form of corporate ownership and focus on policyholder value, with that of its stock company competitors. The company also has a large block of in-force life insurance business with risk-bearing liabilities that contains a significant amount of embedded profitability that should benefit the company over many years.
The rating also incorporates several other notable credit strengths including the company’s stable and productive career-agency distribution system; a well-recognized and highly regarded brand name, and a strong national presence.
New York Life's sensitivity to equity market declines is manageable because the company is not a significant participant in the variable annuity market, although it does have a moderate direct equity and limited partnership investment portfolio. However, similar to the rest of the Industry, New York Life is exposed to industry-wide pressures on its capital and profitability over the medium-term from investment losses related to the still fragile economy and volatile capital markets. Higher than historical investment losses are expected in 2010 and 2011 from the company's real estate-related holdings (i.e. RMBS, CMBS, commercial mortgage loans, etc.).
New York Life also faces a long-run challenge and opportunity with its fast growing New York Life International (NYL International) operation. While the developing markets that NYL International targets engender greater risk than New York Life's domestic market, they also offer significant upside potential.

INSURANCE
2 SEPTEMBER 30, 2010
CREDIT ANALYSIS: NEW YORK LIFE INSURANCE COMPANY
Group Overview
Founded in 1845, New York Life is one of the oldest life insurance companies operating in the U. S. and is the largest mutual. New York Life operates in four divisions, which are summarized below:
U.S. Life & Agency: This is New York Life’s largest division in terms of operating earnings. This division markets its life insurance product line — which includes whole life, universal life, variable universal life, term life, and COLI and BOLI products — to the middle and advanced markets, and corporations through career agents and brokers.
Career agency remains New York Life’s core distribution channel. The group also utilizes supplemental channels, such as brokers in its Advanced Markets Network (AMN), to capitalize on opportunities in the COLI, BOLI, and advanced market retail marketplaces. AMN sales accounted for 11% of New York Life’s individual life sales in 2009. In addition, this line includes NYL’s affinity markets, which represents New York Life’s niche markets. Through an exclusive endorsement from AARP, the New York Life Tampa Operation directly markets life insurance, immediate annuities (Guaranteed Lifetime Income) and fixed annuities to AARP’s 38 million members. Finally, Group Membership Association markets through brokers mostly life insurance with ancillary products of disability and a runoff block of major medical coverage to professional associations.
Retirement Income Security: This division markets the annuity, long term care insurance and mutual funds product lines. The annuity line consists of variable and fixed deferred annuities and immediate annuities (fixed period and Guaranteed Lifetime Income) — to middle and advanced markets through career agents, banks and external broker/dealers. This segment markets long-term care insurance products which are sold predominantly on an individual basis to the middle market through career agents and retail mutual funds to individuals through career agents and financial advisors.
Investment Management: This division focuses on the manufacturing of retail and institutional mutual funds, full service defined benefit and defined contribution plan services, and separately managed accounts to individuals, corporations, retirement plan sponsors and other institutions. In addition, it offers GIC and funding agreements. These products are sold through the New York Life Investment Management LLC sales force, New York Life career agents, specialty brokers, and financial advisors.
International: NYL International sells life insurance and annuities through career agents, bancassurance, and supplemental distribution channels in Asia, India and Latin America.
As of December 31, 2009, New York Life reported consolidated GAAP assets of approximately $208 billion and total equity (excluding minority interest) of about $19.4 billion. For 2009, GAAP revenue was approximately $22 billion, net income was about $1.3 billion and operating earnings were approximately $1.2 billion.

INSURANCE
3 SEPTEMBER 30, 2010
CREDIT ANALYSIS: NEW YORK LIFE INSURANCE COMPANY
Analysis of Rating Considerations
Discussion of Business Profile Drivers
Market Position and Brand
Top Tier Position in the Domestic Individual Life Insurance Business is Key Strength
In Moody’s view, New York Life has one of the most well-recognized and respected brands in the U.S. Moreover, the company has an excellent market position in a number of important segments. According to LIMRA1, as of year-end 2009, the company ranked #1 in U.S. life insurance sales, #2 in fixed annuity sales through banks, and #1 in fixed immediate annuity sales. Also, New York Life is the leading direct marketer of life insurance, the #6 provider of long-term care insurance, and the largest underwriter of professional association insurance programs in the U.S. For these reasons, we see the company's market position and brand to be in line with expectations for Aaa insurers.
Moody’s believes that New York Life’s leading position in the individual life insurance business is the key strength underlying New York Life’s high credit ratings. For many years, the group has consistently ranked in the top tier for U.S. life insurance sales. Moody’s believes that New York Life’s well-recognized brand name, productive career agency distribution force, focus on the middle market, and broad product offering are important factors that have enabled it to maintain its leading market position.
1 LIMRA International. US life insurance sales survey based on new periodic premium, plus 100% of single premium. The life insurance survey compiles data from
among 74 of the largest life insurers, representing over 75% of the industry. The U.S. Individual Annuity Sales survey compiles data from among 59 major companies, representing over 90% of the industry.
New York Life Insurance
Company * (NY)
New York Life Investment Management Holdings LLC
(DE)
New York Life International LLC (DE)
New York Life Insurance and Annuity Corp. *
(DE)
NYLIFE Insurance Company of Arizona *
(AZ)
New York Life Capital Corporation
(DE)
NYLIFE LLC (DE)
Unrated Company
Rated Company
Life Insurer*
As of June 30, 2010

INSURANCE
4 SEPTEMBER 30, 2010
CREDIT ANALYSIS: NEW YORK LIFE INSURANCE COMPANY
CHART 1
New York Insurance Company Insurance Sales (in $ Millions)
1,571
1,876
2,117
2,396
2,655
-
500
1,000
1,500
2,000
2,500
3,000
2005 2006 2007 2008 2009
Distribution
Productive and Well-Established Career Agency Distribution Force Supplemented by Affinity Programs, AMN Distribution and Banks
The company's significant distribution channels include career agents, independent agents, banks, external broker/dealers, direct/sponsored distribution (e.g. AARP), and an institutional sales force. Notably, one of the company's key strengths is its large and productive career agency force, which remains its primary channel for distributing life insurance products. The company's proprietary career agency channel contributes to New York Life's strong business retention rates.
Career Agency: New York Life’s well-established career agency force has long been a competitive strength of the company and remains the cornerstone of the company’s distribution capabilities and Moody’s expects that it will remain a bedrock of its continued credit strength. Moody’s believes that career agency distribution can lead to better policy persistency, as compared to other forms of distribution, and we expect that this will continue in the future.
In the mid- to late-1990s, New York Life’s career agency distribution system underwent a major rebuilding effort that emphasized increased training and productivity. We feel that this effort has borne fruit in recent years with improvements in agent productivity and retention. Notably, in 2009 for the 55th consecutive year (confirm with company), New York Life had the largest number of agents qualifying for Million Dollar Round Table (MDRT) membership, a statistic that underscores the depth and quality of its field force.
Advanced Markets Network: AMN is New York Life’s term for its life insurance brokerage business where the company accepts life insurance business from independent producers serving very affluent individuals and corporate and bank customers. In many cases, these products are sold to companies to fund employee benefit plans or for other similar corporate purposes and in other cases it is a retail product sold to a sophisticated individual purchaser. In either case, producers in this market require of insurers both the capacity to accept very large amounts of business and strong credit quality, two attributes found in New York Life . Moody’s views AMN sales as less predictable than those from the career agency, as sales from this channel are subject to substantial year to year volatility since these
INSURANCE
5 SEPTEMBER 30, 2010
CREDIT ANALYSIS: NEW YORK LIFE INSURANCE COMPANY
producers typically shop the market for the most financially attractive product to the consumer and producer at any point in time.
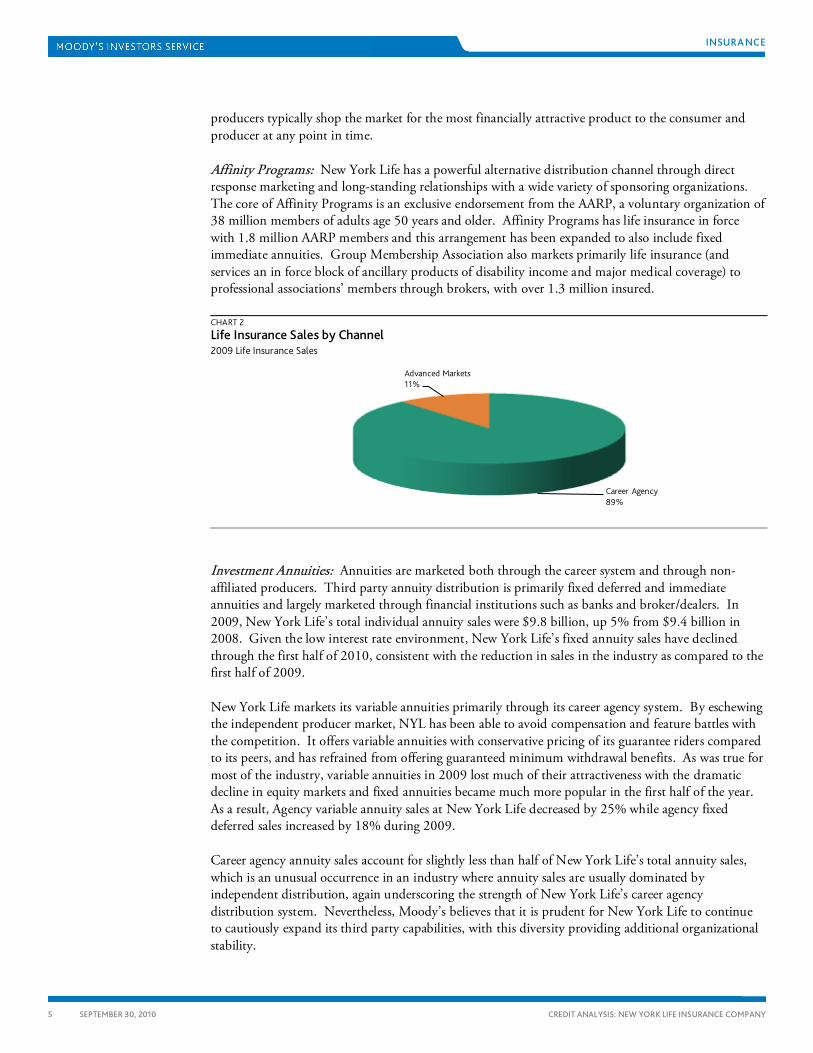
Affinity Programs: New York Life has a powerful alternative distribution channel through direct response marketing and long-standing relationships with a wide variety of sponsoring organizations. The core of Affinity Programs is an exclusive endorsement from the AARP, a voluntary organization of 38 million members of adults age 50 years and older. Affinity Programs has life insurance in force with 1.8 million AARP members and this arrangement has been expanded to also include fixed immediate annuities. Group Membership Association also markets primarily life insurance (and services an in force block of ancillary products of disability income and major medical coverage) to professional associations’ members through brokers, with over 1.3 million insured.
CHART 2
Life Insurance Sales by Channel 2009 Life Insurance Sales
Career Agency89%
Advanced Markets11%
Investment Annuities: Annuities are marketed both through the career system and through non-affiliated producers. Third party annuity distribution is primarily fixed deferred and immediate annuities and largely marketed through financial institutions such as banks and broker/dealers. In 2009, New York Life’s total individual annuity sales were $9.8 billion, up 5% from $9.4 billion in 2008. Given the low interest rate environment, New York Life’s fixed annuity sales have declined through the first half of 2010, consistent with the reduction in sales in the industry as compared to the first half of 2009.
New York Life markets its variable annuities primarily through its career agency system. By eschewing the independent producer market, NYL has been able to avoid compensation and feature battles with the competition. It offers variable annuities with conservative pricing of its guarantee riders compared to its peers, and has refrained from offering guaranteed minimum withdrawal benefits. As was true for most of the industry, variable annuities in 2009 lost much of their attractiveness with the dramatic decline in equity markets and fixed annuities became much more popular in the first half of the year. As a result, Agency variable annuity sales at New York Life decreased by 25% while agency fixed deferred sales increased by 18% during 2009.
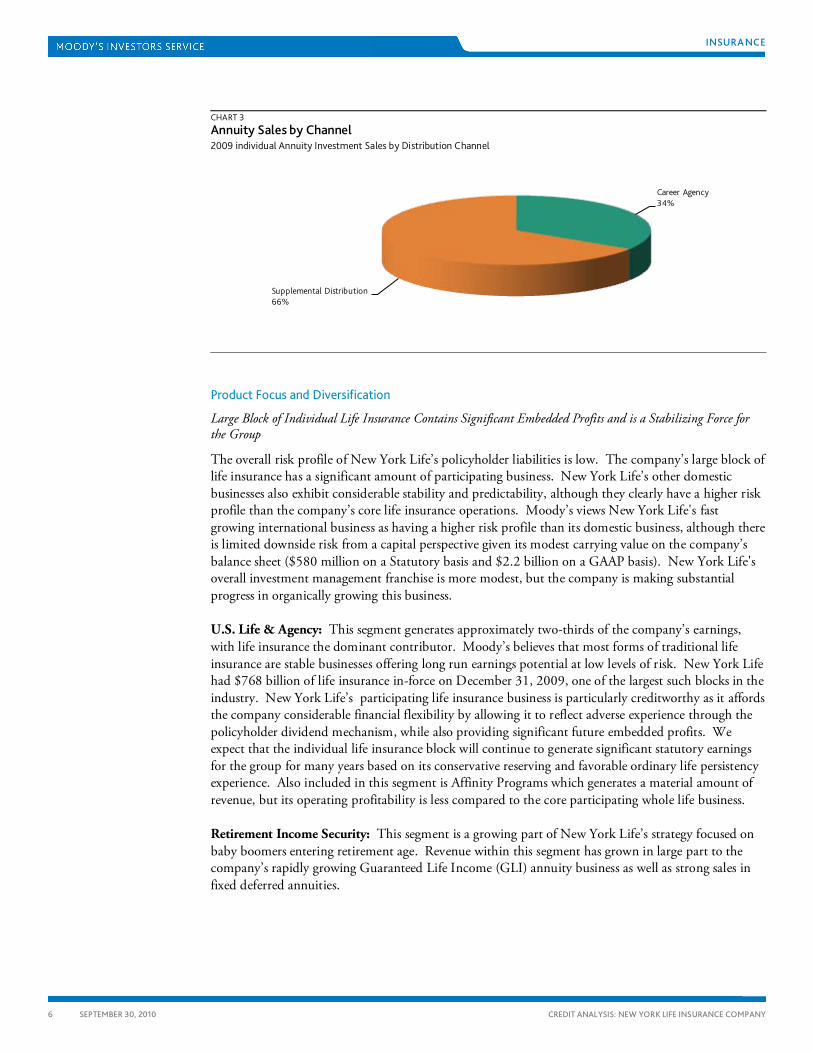
Career agency annuity sales account for slightly less than half of New York Life’s total annuity sales, which is an unusual occurrence in an industry where annuity sales are usually dominated by independent distribution, again underscoring the strength of New York Life’s career agency distribution system. Nevertheless, Moody’s believes that it is prudent for New York Life to continue to cautiously expand its third party capabilities, with this diversity providing additional organizational stability.
INSURANCE
6 SEPTEMBER 30, 2010
CREDIT ANALYSIS: NEW YORK LIFE INSURANCE COMPANY
CHART 3
Annuity Sales by Channel 2009 individual Annuity Investment Sales by Distribution Channel
Career Agency34%
Supplemental Distribution66%
Product Focus and Diversification
Large Block of Individual Life Insurance Contains Significant Embedded Profits and is a Stabilizing Force for the Group
The overall risk profile of New York Life’s policyholder liabilities is low. The company’s large block of life insurance has a significant amount of participating business. New York Life’s other domestic businesses also exhibit considerable stability and predictability, although they clearly have a higher risk profile than the company’s core life insurance operations. Moody’s views New York Life's fast growing international business as having a higher risk profile than its domestic business, although there is limited downside risk from a capital perspective given its modest carrying value on the company’s balance sheet ($580 million on a Statutory basis and $2.2 billion on a GAAP basis). New York Life's overall investment management franchise is more modest, but the company is making substantial progress in organically growing this business.
U.S. Life & Agency: This segment generates approximately two-thirds of the company’s earnings, with life insurance the dominant contributor. Moody’s believes that most forms of traditional life insurance are stable businesses offering long run earnings potential at low levels of risk. New York Life had $768 billion of life insurance in-force on December 31, 2009, one of the largest such blocks in the industry. New York Life’s participating life insurance business is particularly creditworthy as it affords the company considerable financial flexibility by allowing it to reflect adverse experience through the policyholder dividend mechanism, while also providing significant future embedded profits. We expect that the individual life insurance block will continue to generate significant statutory earnings for the group for many years based on its conservative reserving and favorable ordinary life persistency experience. Also included in this segment is Affinity Programs which generates a material amount of revenue, but its operating profitability is less compared to the core participating whole life business.
Retirement Income Security: This segment is a growing part of New York Life’s strategy focused on baby boomers entering retirement age. Revenue within this segment has grown in large part to the company’s rapidly growing Guaranteed Life Income (GLI) annuity business as well as strong sales in fixed deferred annuities.
INSURANCE
7 SEPTEMBER 30, 2010
CREDIT ANALYSIS: NEW YORK LIFE INSURANCE COMPANY
International: In 1997, New York Life began to put more emphasis on its international business, and NYL International has grown steadily ever since. Despite that growth, NYL International’s contribution was less than 5% of total enterprise core earnings in 2009. Over time, however, Moody’s believes that NYL International’s profitability should continue to increase as it gains economies of scale.
Moody's believes that NYL International's growth strategy is sound and the business is well managed. Its focus remains in Mexico, India and Asian markets, which offer attractive growth potential. Over the long-term, Moody's expects NYL International's business to further add to the diversity of the group's earnings and grow more rapidly.
However, with significant growth and earnings potential comes added risk given the volatile nature of many of these markets. These risks include currency fluctuations, potential political instability, and regulatory risk. NYL International is carried on NYLIC’s books on a statutory basis at about $580 million as of year-end 2009 with a GAAP carrying value of approximately $2.2 billion. Moody’s believes the risk to New York Life embedded in this business is quite manageable and that, on a statutory basis, there is substantial hidden value in this business.
Investment Management: Moody’s believes that New York Life has a strong and expanding presence in the asset accumulation business, a top tier position in some sub-sectors of this business, such as stable value and retirement services for small and mid-size company employee plans. Nevertheless, its overall investment management franchise is relatively modest and does not enjoy the economies of scale and brand recognition that New York Life does in its life insurance segment.
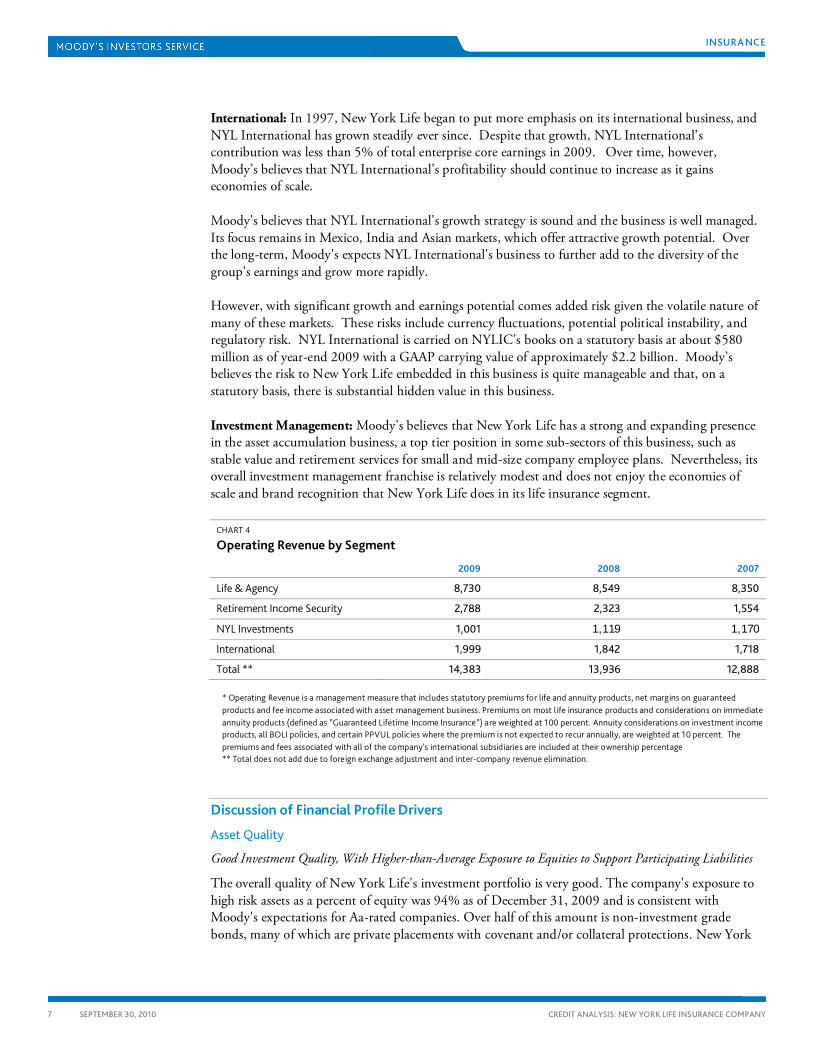
CHART 4
Operating Revenue by Segment
2009 2008 2007
Life & Agency 8,730 8,549 8,350
Retirement Income Security 2,788 2,323 1,554
NYL Investments 1,001 1,119 1,170
International 1,999 1,842 1,718
Total ** 14,383 13,936 12,888
* Operating Revenue is a management measure that includes statutory premiums for life and annuity products, net margins on guaranteed products and fee income associated with asset management business. Premiums on most life insurance products and considerations on immediate annuity products (defined as “Guaranteed Lifetime Income Insurance”) are weighted at 100 percent. Annuity considerations on investment income products, all BOLI policies, and certain PPVUL policies where the premium is not expected to recur annually, are weighted at 10 percent. The premiums and fees associated with all of the company’s international subsidiaries are included at their ownership percentage ** Total does not add due to foreign exchange adjustment and inter-company revenue elimination.
Discussion of Financial Profile Drivers
Asset Quality
Good Investment Quality, With Higher-than-Average Exposure to Equities to Support Participating Liabilities
The overall quality of New York Life's investment portfolio is very good. The company's exposure to high risk assets as a percent of equity was 94% as of December 31, 2009 and is consistent with Moody's expectations for Aa-rated companies. Over half of this amount is non-investment grade bonds, many of which are private placements with covenant and/or collateral protections. New York

INSURANCE
8 SEPTEMBER 30, 2010
CREDIT ANALYSIS: NEW YORK LIFE INSURANCE COMPANY
Life's exposure to non-investment grade bonds is slightly above the industry average, but the performance of this portfolio has been considerably better than average for this asset class. Most of the remainder of high risk assets are various forms of alternative investments such as partnership interests in investment funds that are designed to take advantage of longer term investment opportunities. The results of these investments are largely shared with participating policyholders, thereby substantially reducing the risk to New York Life of owning these investments. Moody’s believes that this exposure is well within the company’s tolerance level given the company’s investment track record, capital position, and the participating nature of most of the company’s liabilities.
The company’s bond portfolio is highly diversified with its 10 largest investments representing only 1.5% of its total cash and invested assets. The company also has a below average exposure to the financial sector.
The largest holdings of structured securities at year-end 2009 were commercial mortgage-backed securities (7% of fixed-income assets), agency residential mortgage-backed securities (16%) and other forms of asset-backed securities (4%%).The company's non-agency residential mortgage-backed security (RMBS) exposure as of December 31, 2009 was relatively modest at 5% of invested assets. The vast majority of the collateral are fixed rate loans, which generally perform better than floating rate loans. The $11 billion CMBS portfolio is of high quality with 90% of it rated Aaa as of December 31, 2009. The company also has a good quality $15.3 billion direct mortgage loan portfolio, but it remains subject to challenging market forces in today's economic environment, and we expect credit losses on these investments to increase over the next few years.
New York Life’s other-than-temporary impairments (OTTI) and AVR losses were $589 million in 2009, down from $738 million reported in 2008, a modest amount for a $158 billion portfolio. Portfolio results in 2010 have held up quite well with only $94 million of OTTI and AVR losses reported through the first six months of 2010 in a very difficult market. Moody’s expects New York Life’s investment portfolio will continue to perform well and compare favorably to the industry as a whole.
As of December 31, 2009, fixed maturities had a gross unrealized loss of $4.6 billion offset by a gross unrealized gain of $5.2 billion. As of 6/30/2010, the company’s net unrealized gain on fixed maturities was $6.3 billion. New York Life’s consolidated statutory net realized capital gains/(losses) were $(83) million in the first six months of 2010, compared with $(465) million in the same period in 2009. The improvement between periods primarily resulted from the moderation of write-downs on investments in 2010.
Goodwill and other intangibles are equal to 47% of capital on a GAAP accounting basis. Virtually all of these intangibles are deferred acquisition costs (DAC) that are highly likely to be recovered from future profits to be earned on the associated policies due to the high persistency of New York Life's in-force policies.

INSURANCE
9 SEPTEMBER 30, 2010
CREDIT ANALYSIS: NEW YORK LIFE INSURANCE COMPANY
CHART 5
High Risk Assets as a % Shareholder’s Equity
74%85% 86%
124%
94%
0%
20%
40%
60%
80%
100%
120%
140%
2005 2006 2007 2008 2009
Capital Adequacy
Capital Position is Excellent, Supported by Retained Earnings and Supplemented by Surplus Note Issuance
While New York Life's equity-to-total asset ratio (9.0% at year-end 2009) suggests levels equal to Moody’s “Aa” expectations, we believe that the NAIC risk-based capital (RBC) ratio is a better indicator of the company's capital adequacy. NYLIC's year-end 2009 NAIC RBC ratio was 433%, a level consistent with Aaa-rated companies. Notably, excluding surplus notes from NYLIC’s capital base, the company’s NAIC RBC ratio still remains high and consistent with a high Aa rating. Because New York Life’s investment in its international operations ($580 million) is held as a subsidiary of the main operating company, it is subject to a 100% required capital charge, which depresses the group’s RBC ratio by approximately 40 percentage points. Except for potential acquisitions, which Moody’s would not expect to be significant in size, we believe there’s little risk of NYLIC's RBC ratio declining a substantial amount over a 12-month period given the stability of both sides of the company’s balance sheet and the financial flexibility it possesses in adjusting policyholder dividends to reflect investment performance.
Although New York Life’s statutory capital did decline in 2008 by more than $1.8 billion to approximately $12.8 billion, its RBC ratio still remained solid at 429%. In 2009, the company’s statutory capital increased over $2.1 billion to $15.0 billion, with about half of the increase generated organically and the balance from a $1billion surplus note issuance. This increased to $15.9 billion as of June 30, 2010. Moody’s believes New York Life historically remained well capitalized even during the financial crisis, in large part because the company increased its surplus position through organic growth by $6 billion from 2002 through 2007.
Moody’s believes that New York Life’s capital adequacy is enhanced by its good quality investment portfolio, very strong liquidity, and significant block of par whole life business.

INSURANCE
10 SEPTEMBER 30, 2010
CREDIT ANALYSIS: NEW YORK LIFE INSURANCE COMPANY
CHART 6
NAIC Risk Based Capital Ratio
432%
438%
407%
429%
433%
390%
395%
400%
405%
410%
415%
420%
425%
430%
435%
440%
445%
2005 2006 2007 2008 2009
Profitability
Solid Profitability for a Mutual Insurance Company
New York Life's historical profitability performance as measured by its five year average return on capital (ROC) of about 4.4% is in line with A-rated companies. This is driven, in large part, by New York Life's outstanding capital position (which depresses reported return on equity measures) and also by an emphasis on superior policyholder value, which reduces profitability through policyholder dividends that are treated as operating expenses. Since these policyholder dividends are considered expenses, they serve to depress the company's reported ROC, whereas shareholder dividends would not impact ROC.
Consolidated statutory net income in 2009 was $683 million, up substantially from the $950 million net loss reported for 2008. Moody’s expects that New York Life will continue to realize higher than normal investment losses for the remainder of 2010 and into 2011, but we anticipate that the rate of these losses should slow substantially from the 2009 pace ($94M through the first half of 2010), thereby helping improve 2010 statutory net income ($372 million through June 30th 2010).
Moody's does expect to see New York Life operating earnings and return on capital relatively flat in the near term, both due to the overall general economic environment, as well as the company’s expenditures related to its international and investment management businesses. Moody’s expects that continued growth in these expanding businesses, coupled with statutory strain related to growth in the company’s core life insurance business, could serve to moderate statutory operating profitability in the near term.
The U.S. Life & Agency business continues to be the cornerstone of New York Life’s profitability, with this business line accounting for 57% of the company’s 2009 consolidated core earnings, the same as 2008. The other top business lines were NYL Investments (11%) and Retirement Income Security (24%).

INSURANCE
11 SEPTEMBER 30, 2010
CREDIT ANALYSIS: NEW YORK LIFE INSURANCE COMPANY
CHART 7
2009 Core Earning by Segment
U.S. Life & Angency57%Retirement Income
Security24%
NYL Investments11%
International4%
SMA4%
Liquidity and Asset/Liability Management (ALM)
Good Liquidity Complements Stable, Long-Term Liabilities
ALM at New York Life is greatly enhanced by the large amount of very stable and predictable participating business on the company's books, which effectively allows the company to share some of its inherent risks with its participating policyholders. This also serves to benefit the company's liquidity profile. Overall, liquidity is excellent at New York Life given the fact that, as a mutual insurer, the company's ultimate holding company is also its principal operating company. As such, the liquidity resident in NYLIC is available to service any non-policyholder obligations in the organization. The company's liquidity profile is further bolstered by a relatively liquid general account investment portfolio and large positions of U.S. Treasury and agency securities prior to the recent market dislocations.
Both NYLIC and NYLIAC produce substantial positive operating cash flow, providing the foundation for the group’s very strong liquidity. In addition, the investment portfolio has very strong liquidity. As of year-end 2009 on a consolidated basis, New York Life had approximately $14 billion in cash and short-term investments (including long-term bonds maturing within 12 months), $83 billion of publicly traded investment grade bonds, including approximately $49 billion of securities with market values at or above book value - highly liquid government bonds, agency bonds, mortgage-backed securities, and public investment grade bonds - and other sources such as the company’s commercial paper program and its equity portfolio totaling $55 billion. These sources of liquidity compare quite favorably to the company’s $2 billion of annuity and deposit liabilities that were subject to discretionary withdrawal at book value with minimal or no surrender charge as of December 31, 2009 and should substantially exceed any reasonably foreseeable cash demands on the company.
During the financial crisis, New York Life, like other life insurers, experienced significant disruptions in the fixed income markets including sharp declines in the market values of investments. Although market values throughout the industry have, in general, recovered, Moody’s believes that the stability and long-term nature of the New York Life’s liability structure makes it highly unlikely that the company would be forced to sell assets at an inopportune time to satisfy liability demands.
INSURANCE
12 SEPTEMBER 30, 2010
CREDIT ANALYSIS: NEW YORK LIFE INSURANCE COMPANY
Financial Flexibility
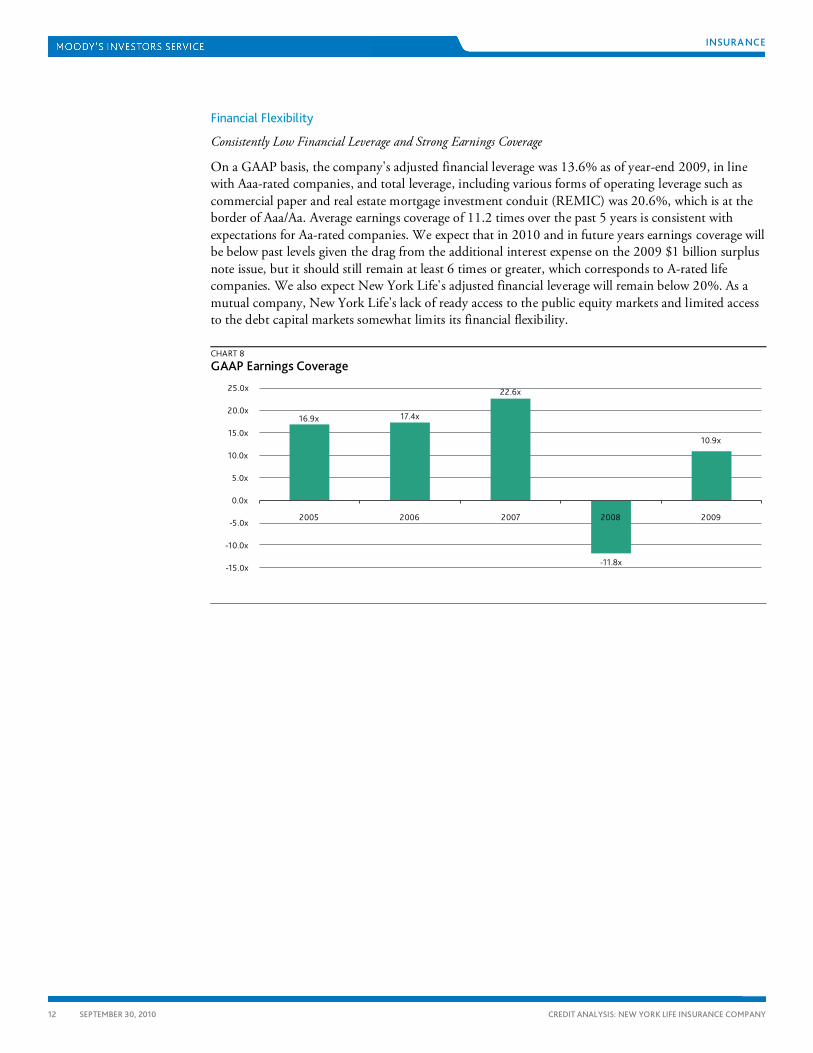
Consistently Low Financial Leverage and Strong Earnings Coverage
On a GAAP basis, the company's adjusted financial leverage was 13.6% as of year-end 2009, in line with Aaa-rated companies, and total leverage, including various forms of operating leverage such as commercial paper and real estate mortgage investment conduit (REMIC) was 20.6%, which is at the border of Aaa/Aa. Average earnings coverage of 11.2 times over the past 5 years is consistent with expectations for Aa-rated companies. We expect that in 2010 and in future years earnings coverage will be below past levels given the drag from the additional interest expense on the 2009 $1 billion surplus note issue, but it should still remain at least 6 times or greater, which corresponds to A-rated life companies. We also expect New York Life's adjusted financial leverage will remain below 20%. As a mutual company, New York Life's lack of ready access to the public equity markets and limited access to the debt capital markets somewhat limits its financial flexibility.
CHART 8
GAAP Earnings Coverage
16.9x 17.4x
22.6x
-11.8x
10.9x
-15.0x
-10.0x
-5.0x
0.0x
5.0x
10.0x
15.0x
20.0x
25.0x
2005 2006 2007 2008 2009

INSURANCE
13 SEPTEMBER 30, 2010
CREDIT ANALYSIS: NEW YORK LIFE INSURANCE COMPANY
CHART 9
GAAP Financial Leverage
9.1%8.3%
7.0%
13.3% 13.6%
0.0%
2.0%
4.0%
6.0%
8.0%
10.0%
12.0%
14.0%
16.0%
2005 2006 2007 2008 2009
CHART 10
GAAP Total Financial Leverage
15.6% 15.5%
14.1%
18.4%
20.6%
0.0%
5.0%
10.0%
15.0%
20.0%
25.0%
2005 2006 2007 2008 2009
Other Considerations Moody's believes that the mutual form of organization for an insurance company, in and of itself, has a net neutral impact on a company's credit profile relative to a publicly-traded stock ownership form. This is the case because many of Moody's eight rating factors are already directly or indirectly influenced by a company's implementation of its chosen form of ownership structure. For example, mutual companies often have higher capital adequacy metrics than public companies, and these insurers receive direct recognition for their strong capital positions in the capital adequacy rating factor.
Transparency and governance are two areas in which mutual companies tend to under-perform their public company counterparts. However, New York Life exhibits outstanding external transparency compared to many of its peers. New York Life voluntarily publishes an annual GAAP financial statement and makes it readily available to the public via the company's web site. In addition, New York Life makes readily available to the public its quarterly statutory financial statements. Also, New York Life has voluntarily developed an extensive due diligence process to support a CEO/CFO type

INSURANCE
14 SEPTEMBER 30, 2010
CREDIT ANALYSIS: NEW YORK LIFE INSURANCE COMPANY
certification of section 302 of the Sarbanes-Oxley Act of 2002 while very few companies that are not required to do so have chosen to do so.
New York Life’s company culture and business strategy focus on the policyholders, and it effectively uses it as a marketing differentiator in assisting the sale of value added products. New York Life's branding and consumer marketing is tightly linked with its mutual ownership and commitment to policyholder value and financial strength. New York Life continues to emphasize and actively write participating whole life insurance (which constitutes a significant portion of the company’s liabilities), which we view as the most creditworthy product in the industry today, and permits New York Life to take longer-term views towards markets and investments than many other companies can.
In summary, although some aspects of the company’s credit profile are directly captured by the key rating factors, the company’s deeply engrained focus on financial strength, policyholder value, and conservative management philosophy results in the company’s IFS rating of Aaa.

INSURANCE
15 SEPTEMBER 30, 2010
CREDIT ANALYSIS: NEW YORK LIFE INSURANCE COMPANY
Company Annual Statistics
The following is parent only data excluding subsidiaries:
New York Life Insurance Company
2009 2008 2007 2006 2005
Company Fundamentals ($mil):
General account assets 111,227 111,431 116,142 107,588 101,961
Total assets 117,836 117,306 122,753 113,704 107,882
Surplus 13,686 11,793 11,959 11,300 10,549
Investment reserve (AVR & MRVR) 832 649 2,257 2,087 1,877
Total capital 14,518 12,442 14,216 13,387 12,426
Insurance revenues 11,162 11,286 9,752 9,301 9,273
Net investment income 5,035 5,149 5,595 5,282 4,751
Total revenues 16,717 16,841 15,802 15,194 14,647
Gain fr ops pre - tax & div. 2,231 1,909 2,338 2,281 2,095
Gain before real. capital gains 794 433 577 494 719
Net Income 455 (564) 856 794 1,198
Segment analysis (as % of policy res. & liabs):
Individual life 59.2% 56.0% 54.2% 54.7% 55.3%
Individual health 1.9% 1.7% 1.6% 1.7% 1.6%
Individual annuities 8.4% 7.9% 7.7% 7.9% 8.0%
Group life 1.9% 1.6% 1.4% 1.3% 1.2%
Group health 0.5% 0.5% 0.5% 0.5% 0.5%
Group pension 10.9% 10.4% 9.9% 11.9% 13.0%
Deposit-type contracts 17.1% 21.9% 24.6% 22.1% 20.3%
Segment analysis (as % of premiums & deposits):
Individual life 35.1% 28.5% 30.8% 30.4% 29.5%
Individual health 1.1% 0.8% 0.8% 0.7% 0.7%
Individual annuities 3.5% 1.7% 2.1% 2.3% 3.7%
Group life 9.7% 6.9% 7.3% 6.7% 5.9%
Group health 2.0% 1.7% 1.9% 2.0% 2.3%
Group pension 18.0% 17.2% 12.3% 11.6% 12.1%
Deposit-type contracts 30.6% 43.2% 44.9% 46.2% 46.0%
Investment Profile (as % cash & inv. assets):
Public bonds (Qtr is Total Bonds) 49.0% 49.2% 47.5% 48.9% 49.6%
Private bonds 17.0% 16.7% 16.1% 17.6% 17.0%
Affiliated common stock (Qtr is all comm stk) 6.7% 5.3% 5.5% 4.6% 5.0%
Unaffiliated common stock 0.4% 1.1% 2.8% 3.7% 3.4%
Preferred stock 0.1% 0.2% 0.2% 0.3% 0.4%
Total Mortgage Loans 9.7% 9.8% 8.7% 8.3% 8.4%
Real estate 0.5% 0.4% 0.4% 0.6% 0.5%

INSURANCE
16 SEPTEMBER 30, 2010
CREDIT ANALYSIS: NEW YORK LIFE INSURANCE COMPANY
New York Life Insurance Company
2009 2008 2007 2006 2005
Policy loans 7.6% 7.1% 6.3% 6.5% 6.5%
Cash & short term investment 1.3% 2.3% 4.4% 3.0% 3.4%
Other invested assets 7.8% 7.8% 8.1% 6.5% 5.8%
Asset Quality:
High Risk Asset/inv assets 23.0% 22.7% 23.1% 22.8% 22.3%
High Risk Assets/Capital 156.6% 180.7% 170.0% 164.6% 164.5%
Below inv grade bonds/Inv. assets 5.9% 5.0% 4.5% 4.9% 5.0%
Residential MBS/inv. Assets 14.9% 13.1% 12.4% 13.4% 14.1%
Commercial MBS & ABS/Inv. Assets 6.5% 6.6% 5.9% 5.1% 4.5%
Capital Adequacy/Capital Growth:
Capital/Assets 12.3% 10.6% 11.6% 11.8% 11.5%
Capital/general account assets 13.1% 11.2% 12.2% 12.4% 12.2%
Growth in Capital (%) 16.7% -12.5% 6.2% 7.7% 8.5%
Change in capital % Net Income 455.9% 314.3% 96.8% 121.0% 80.9%
Dividends to stockholders during the year 0.0% 0.0% 0.0% 0.0% 0.0%
Paid-in capital and surplus during the year 0.0% 0.0% 0.0% 0.0% 0.0%
Profitability:
Net income /avg assets 0.4% -0.5% 0.7% 0.7% 1.1%
Net Income/avg capital 3.4% -4.2% 6.2% 6.2% 10.0%
Operating return on avg assets 0.7% 0.4% 0.5% 0.4% 0.7%
Operating return on avg capital 5.9% 3.3% 4.2% 3.8% 6.0%
Renewal premium persistency 93.5% 94.9% 96.1% 95.0% 94.6%
Indiv. annuity persistency ratio 94.3% 93.7% 93.0% 94.2% 97.1%
Net investment yield 5.2% 5.2% 5.8% 5.8% 5.6%
General exp & Commissions & Depsit-Type funds 12.7% 10.2% 11.3% 11.5% 10.7%
Total general expenses/Avg assets 1.4% 1.3% 1.3% 1.4% 1.4%
Gain ( loss ) from operations ($mil):
Individual life 552 233 426 215 471
Individual health (12) (2) (95) 8 (4)
Individual annuities 80 38 67 82 94
Group life 56 52 49 50 40
Group health 10 17 13 11 0
Group pension 105 90 113 124 115
Other 3 6 5 4 4
Liquidity and ALM:
Liquidity Assets/policyholder reserves 70.3% 72.9% 81.0% 80.1% 80.2%

INSURANCE
17 SEPTEMBER 30, 2010
CREDIT ANALYSIS: NEW YORK LIFE INSURANCE COMPANY
Moody’s Related Research
Credit Opinion:
» New York Life Insurance Company
Liquidity Risk Assessment:
» New York Life Capital Corporation
Industry Outlook:
» U.S. Life Insurance: Outlook Returns to Stable, May 2010 (125085)
Special Comments:
» Moody's Global Liquidity Stress Test for Life Insurance Operating Companies , March 2010 (121220)
» Are Insurers and Investment Managers on the Road to Recovery?, August 2009 (119256)
» Moody’s Approach to Stress Testing Life Insurers, May 2009 (117454)
Rating Methodology:
» Moody’s Global Rating Methodology for Life Insurers, May 2010 (98207)
To access any of these reports, click on the entry above. Note that these references are current as of the date of publication of this report and that more recent reports may be available. All research may not be available to all clients.

INSURANCE
18 SEPTEMBER 30, 2010
CREDIT ANALYSIS: NEW YORK LIFE INSURANCE COMPANY
Report Number: 127974
Author Ann G. Perry
Associate Analyst Marc Abusch
Production Associate
Amanda Ealla
© 2010 Moody’s Investors Service, Inc. and/or its licensors and affiliates (collectively, “MOODY’S”). All rights reserved.
CREDIT RATINGS ARE MOODY'S INVESTORS SERVICE, INC.'S (“MIS”) CURRENT OPINIONS OF THE RELATIVE FUTURE CREDIT RISK OF ENTITIES, CREDIT COMMITMENTS, OR DEBT OR DEBT-LIKE SECURITIES. MIS DEFINES CREDIT RISK AS THE RISK THAT AN ENTITY MAY NOT MEET ITS CONTRACTUAL, FINANCIAL OBLIGATIONS AS THEY COME DUE AND ANY ESTIMATED FINANCIAL LOSS IN THE EVENT OF DEFAULT. CREDIT RATINGS DO NOT ADDRESS ANY OTHER RISK, INCLUDING BUT NOT LIMITED TO: LIQUIDITY RISK, MARKET VALUE RISK, OR PRICE VOLATILITY. CREDIT RATINGS ARE NOT STATEMENTS OF CURRENT OR HISTORICAL FACT. CREDIT RATINGS DO NOT CONSTITUTE INVESTMENT OR FINANCIAL ADVICE, AND CREDIT RATINGS ARE NOT RECOMMENDATIONS TO PURCHASE, SELL, OR HOLD PARTICULAR SECURITIES. CREDIT RATINGS DO NOT COMMENT ON THE SUITABILITY OF AN INVESTMENT FOR ANY PARTICULAR INVESTOR. MIS ISSUES ITS CREDIT RATINGS WITH THE EXPECTATION AND UNDERSTANDING THAT EACH INVESTOR WILL MAKE ITS OWN STUDY AND EVALUATION OF EACH SECURITY THAT IS UNDER CONSIDERATION FOR PURCHASE, HOLDING, OR SALE.
ALL INFORMATION CONTAINED HEREIN IS PROTECTED BY LAW, INCLUDING BUT NOT LIMITED TO, COPYRIGHT LAW, AND NONE OF SUCH INFORMATION MAY BE COPIED OR OTHERWISE REPRODUCED, REPACKAGED, FURTHER TRANSMITTED, TRANSFERRED, DISSEMINATED, REDISTRIBUTED OR RESOLD, OR STORED FOR SUBSEQUENT USE FOR ANY SUCH PURPOSE, IN WHOLE OR IN PART, IN ANY FORM OR MANNER OR BY ANY MEANS WHATSOEVER, BY ANY PERSON WITHOUT MOODY’S PRIOR WRITTEN CONSENT. All information contained herein is obtained by MOODY’S from sources believed by it to be accurate and reliable. Because of the possibility of human or mechanical error as well as other factors, however, all information contained herein is provided “AS IS” without warranty of any kind. MOODY'S adopts all necessary measures so that the information it uses in assigning a credit rating is of sufficient quality and from sources Moody’s considers to be reliable, including, when appropriate, independent third-party sources. However, MOODY’S is not an auditor and cannot in every instance independently verify or validate information received in the rating process. Under no circumstances shall MOODY’S have any liability to any person or entity for (a) any loss or damage in whole or in part caused by, resulting from, or relating to, any error (negligent or otherwise) or other circumstance or contingency within or outside the control of MOODY’S or any of its directors, officers, employees or agents in connection with the procurement, collection, compilation, analysis, interpretation, communication, publication or delivery of any such information, or (b) any direct, indirect, special, consequential, compensatory or incidental damages whatsoever (including without limitation, lost profits), even if MOODY’S is advised in advance of the possibility of such damages, resulting from the use of or inability to use, any such information. The ratings, financial reporting analysis, projections, and other observations, if any, constituting part of the information contained herein are, and must be construed solely as, statements of opinion and not statements of fact or recommendations to purchase, sell or hold any securities. Each user of the information contained herein must make its own study and evaluation of each security it may consider purchasing, holding or selling. NO WARRANTY, EXPRESS OR IMPLIED, AS TO THE ACCURACY, TIMELINESS, COMPLETENESS, MERCHANTABILITY OR FITNESS FOR ANY PARTICULAR PURPOSE OF ANY SUCH RATING OR OTHER OPINION OR INFORMATION IS GIVEN OR MADE BY MOODY’S IN ANY FORM OR MANNER WHATSOEVER.
MIS, a wholly-owned credit rating agency subsidiary of Moody’s Corporation (“MCO”), hereby discloses that most issuers of debt securities (including corporate and municipal bonds, debentures, notes and commercial paper) and preferred stock rated by MIS have, prior to assignment of any rating, agreed to pay to MIS for appraisal and rating services rendered by it fees ranging from $1,500 to approximately $2,500,000. MCO and MIS also maintain policies and procedures to address the independence of MIS’s ratings and rating processes. Information regarding certain affiliations that may exist between directors of MCO and rated entities, and between entities who hold ratings from MIS and have also publicly reported to the SEC an ownership interest in MCO of more than 5%, is posted annually at www.moodys.com under the heading “Shareholder Relations — Corporate Governance — Director and Shareholder Affiliation Policy.”
Any publication into Australia of this document is by MOODY’S affiliate, Moody’s Investors Service Pty Limited ABN 61 003 399 657, which holds Australian Financial Services License no. 336969. This document is intended to be provided only to “wholesale clients” within the meaning of section 761G of the Corporations Act 2001. By continuing to access this document from within Australia, you represent to MOODY’S that you are, or are accessing the document as a representative of, a “wholesale client” and that neither you nor the entity you represent will directly or indirectly disseminate this document or its contents to “retail clients” within the meaning of section 761G of the Corporations Act 2001.