Embed Size (px)
Citation preview

Mahindra & Mahindra
March, 2012

India - Fast, Sustained and Stable Growth Story
GDP growth
F10 – 8.4%8.4%
F11 - 8.4%
F12E – 6.9% <GOI’s first GDP estimate for FY12>
22
Mahindra & Mahindra
An exponential increase in the consumer class
Maturing Economy
Shift from Agriculture & Manufacturing to Services
Stable: Forex reserves at US$ 293.75 billion (As on Feb. 3,‘12 – RBI)

The Indian Story
PositivesPositives
2011 Rainfall 102% of LPA– Best in last 5 years in terms of Spatial Distribution– Food grain production at all time high
Political stability
ConcernsConcerns
Recent Developments
33
Mahindra & Mahindra
ConcernsConcerns
Steadily deteriorating global macro environment
Policy inaction
Slowing growth
Business confidence

Mahindra Group : A USD 14.4 bn Conglomeratewith interests across the economic spectrum
44
AutomotiveSector
Systems &Technologies
Sector
IT ServicesSector
FarmEquipment
Sector
Mahindra & Mahindra
Real Estate &Infrastructure
Sector
HospitalitySector
FinancialServicesSector
Steel Trading& Processing
Sector
Others

Mahindra GroupBusiness Leadership
55
Market leader in Utility Vehicles in India
Market leader in Agricultural Tractors in India.
– Number One global manufacturer (Single legal
entity)
Mahindra Finance : Leader in rural financing
Mahindra & Mahindra
Mahindra Finance : Leader in rural financing
Tech Mahindra : Leader in Telecom Software
Mahindra Holidays : Leader in ‘Time Share’
“Mahindra” – amongst India’s most innovative companies- Robert Tucker, Innovation Guru & President of The Innovation Resource (TIR)
June 2011

Mahindra & Mahindra Ltd.Company at a Glance
66
Equity Structure 26.9% Promoter & Promoter Group, 73.1% Public (35.9%Foreign)As at Sept 30, 2011
Gross Revenue FY11 – US$5.7 bn, 9MFY12 – US$ 5.3 bn
Net Profit FY11 – US$585 mn, 9MFY12 – US$ 446 mn
Sales (incl exports), vol. FY11 4W+3W–364,8341(27.21%) Tractors–213,653 (22.3%)
Mahindra & Mahindra
Sales (incl exports), vol. FY11 4W+3W–364,8341(27.21%) Tractors–213,653 (22.3%)
9MFY12 4W+3W–305,476 (26.8%) Tractors–173,519 (19.3%)
Market Share FY11 – Passenger UV – 52.6%, Tractors – 41.4%H1FY12 Passenger UV – 56.0%,Tractors – 42.4%
Plants Auto – 6, Tractors – 6
Manpower Around 26,000
Subsidiaries As of Dec. ‘11 – Total – 131, Operational – 70

Financials
For translation of ` to US$ a convenience translation at
average of closing exchange rates for 12 months period
ended 31st December 2011 has been applied.
77
Mahindra & Mahindra
ended 31st December 2011 has been applied.

Financials
M&M + MVML Q3F12 9MF12
Gross Revenue (incl. other income) ` 9011 Cr. 34% ` 24,609 Cr. 31%
US$ 1.9 bn US$ 5.3 bn
Profit after Tax ` 706 Cr. 16% ` 2,086 Cr. 10%
US$ 151 mn US$ 446 mn
Operating margin 13.8% 13.7%
88
Mahindra & Mahindra
Operating margin 13.8% 13.7%
Gearing Ratio Debt : Equity 0.28 0.28
Mahindra GroupGross Revenue ` 16,488 Cr 61% ` 45,995 Cr 63%
US$ 3.55 bn US$ 9.8 bn
PAT after Minority Interest ` 832 Cr - 0.26% ` 2,176 Cr 1.5%
US$ 178 mn US$ 466 mn

99
Automotive Sector
Mahindra & Mahindra
Automotive Sector
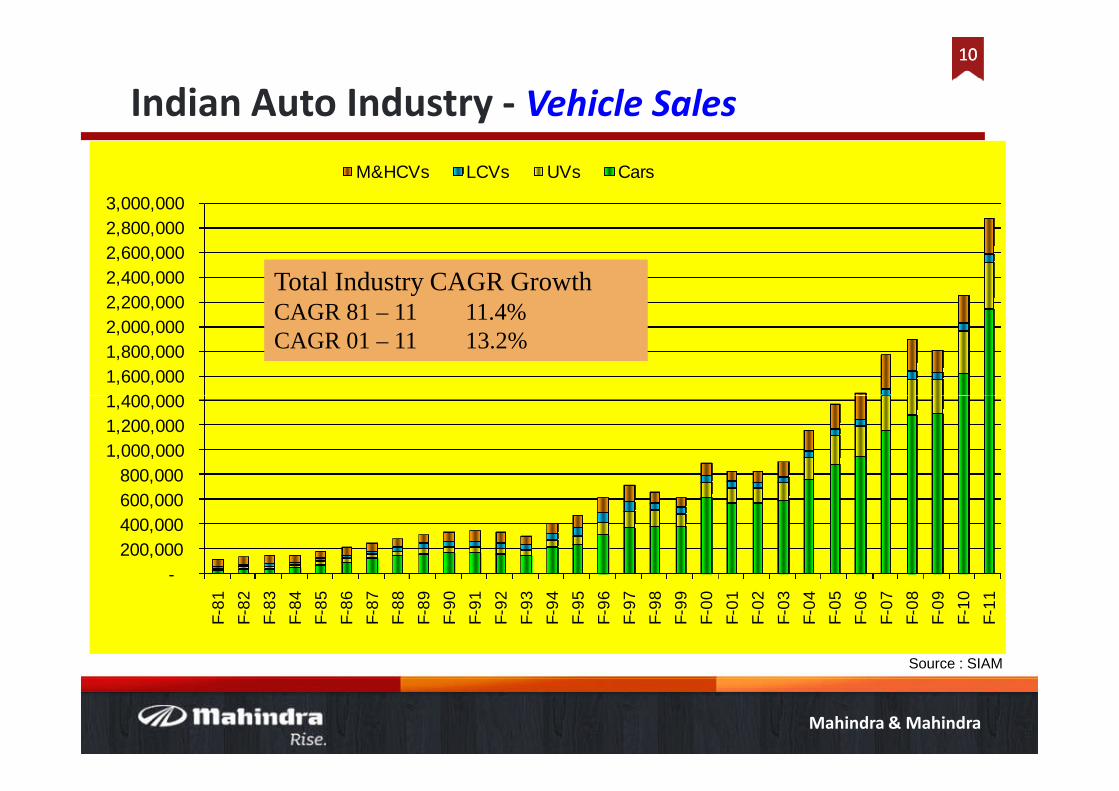
Indian Auto Industry - Vehicle Sales
1010
1,400,000
1,600,000
1,800,000
2,000,000
2,200,000
2,400,000
2,600,000
2,800,000
3,000,000
M&HCVs LCVs UVs Cars
Total Industry CAGR GrowthCAGR 81 – 11 11.4%CAGR 01 – 11 13.2%
Mahindra & Mahindra
-
200,000
400,000
600,000
800,000
1,000,000
1,200,000
1,400,000
F-8
1
F-8
2
F-8
3
F-8
4
F-8
5
F-8
6
F-8
7
F-8
8
F-8
9
F-9
0
F-9
1
F-9
2
F-9
3
F-9
4
F-9
5
F-9
6
F-9
7
F-9
8
F-9
9
F-0
0
F-0
1
F-0
2
F-0
3
F-0
4
F-0
5
F-0
6
F-0
7
F-0
8
F-0
9
F-1
0
F-1
1
Source : SIAM

1111
Utility
Vehicle
Mahindra & Mahindra
*M&M Ltd. is the largest utility vehicle company in IndiaSIAM data
Player in
India

M&M Auto sales – Domestic + Export
1212
178
231 230
298
377TotalTotal AS SalesAS Sales (‘000)(‘000)
22%
Mahindra & Mahindra
6587
117
145 149
178
F02 F03 F04 F05 F06 F07 F08 F09 F10 F11

9M – FY12 M&M – Industry Performance1313
9M F12 Growth 9M F12 9M F11 Growth
UVs 256,485 12.7% 143,632 122,527 17.2% 56.0% 53.8%
MPVs 168,681 7.7% 18,381 76 NM 10.9% 0.0%
LCV < 2T 180,083 33.5% 39,745 29,625 34.2% 22.1% 22.0%
LCV > 2T and < 3.5T 75,507 30.7% 52,604 44,271 18.8% 69.7% 76.6%
3W 383,101 -0.1% 51,114 44,471 14.9% 13.3% 11.6%
AD Total 1,063,857 10.8% 305,476 240,970 26.8% 28.7% 25.1%
LCVs > 3.5T 72,174 13.7% 7,580 8,028 -5.6% 10.5% 12.6%
M&M Participating
Segments
Industry M&M Market Share
Mahindra & Mahindra
LCVs > 3.5T 72,174 13.7% 7,580 8,028 -5.6% 10.5% 12.6%
MHCV (Goods) 211,153 12.2% 1,926 247 NA 0.9% NA
Cars (Super Compact) 125,781 29.5% 12,915 6,720 NA 10.3% 6.9%
AS (Domestic) 1,472,965 12.5% 327,897 255,965 28.1% 22.3% 19.6%
Non Participating 1,286,503 -4.7%
Total Industry (Dom) 2,759,468 3.8% 327,897 255,965 28.1% 11.9% 9.6%
AD (Exports) 20,543 11,980 71.5%
Logan (Exports) - - NA
AS Total 348,440 267,945 30.0%

International Markets Outperformance
1414
1240010600
17150
11980
20543
4343 % CAGR (% CAGR (F03F03 toto F11)F11)
Mahindra & Mahindra
1000 16003050
55008000
12400
850010600
11980
F03 F04 F05 F06 F07 F08 F09 F10 F11 9M F11 9M F12
No. of units exported

1515
GENIO DC NEW BOLEROXYLORefresh
Mahindra & Mahindra
XUV500 hasalreadybagged 20awardssince launchin Oct ‘11 …

1616
Products Time Line
Maximmo – Passenger Van Q1 FY2013
Compact SUV Q3 FY2013
Mahindra & Mahindra
Rexton <Ssangyong> Q3 FY2013
REVA – NXR Q3 FY2013
Verito – Sub 4m Q4 FY2013

Financial Performance – AD + MVML1717
Nine Months ending 31st Dec. 2011
• Segment Revenue
Rs. 13,386 crores (US$ 2.86 bn) 38%
• Segment Results (EBIT)
Rs. 1,470 crores (US$ 314 mn) 10%
Mahindra & Mahindra
Rs. 1,470 crores (US$ 314 mn) 10%

Going Forward…1818
• General Sentiment about economy
– High inflation
– High financing rates
– Fall in IIP
• Uncertainly of global environment
Key Challenges
Mahindra & Mahindra
• Uncertainly of global environment
– Volatility of Crude prices
– Commodity prices
• Fuel price hikes
• Fuel policy of Government
• Currency movements

Going Forward…1919
New launches
Synergies with Ssangyong
Ramp up MHCV
M&M Initiatives - Auto
Mahindra & Mahindra
Ramp up MHCV
Mahindra Reva
Customer satisfaction
Cost management initiatives

SIAM F13 Outlook2200
Segment F13 Growth
Cars 11 – 13%
UVs 13 – 15%
Vans 10 – 12%
PV Total 11 – 13%
LCV Goods 16-18%
MHCV Goods 5-7%
Mahindra & Mahindra
PassengerBuses*
4 – 6%
Total CV 12 – 14%
2W 11 – 14%
3 W Goods 3 – 5%
3W Passenger 7 - 9%
3W Total 6 – 9%
Auto Total 10 – 12%

Farm Equipment SectorFarm Equipment Sector
2121
Mahindra & Mahindra
Farm Equipment SectorFarm Equipment Sector

Domestic Industry Historical Volumes2222
318427
400203
480377
400000
500000
600000
CAGR : 15.0%
(F73-F82) (F86-F92) (F94-F00) (F03-F11)
No. of tractors
CAGR: 8.5%
Mahindra & Mahindra
22484 31964
41782
5925077636
64703
81629
72106
89631
148219
136376
187675
212732
246404258674
228262214255
160052175475
226105
262621
318427
302241
303783
0
100000
200000
300000
F73
F75
F77
F79
F81
F83
F85
F87
F89
F91
F93
F95
F97
F99
F01
F03
F05
F07
F09
F11
+ 20% growth in F11

2323
Mahindra & Mahindra
M&M Ltd. is the largest tractor company in the world, byvolume
*

2424
Market Share
23.5 22.3 22.0 20.4 22.5
14.7 13.5 13.3 13.2 11.2
9.8 8.9 8.7 8.6 8.4
3.6 3.1 2.8 2.7 2.5
5.3 5.3 4.8 5.1 5.1
4.4 6.0 7.0 8.0 7.9
JD
FNH
OTHERS
400,203302,241 303,921 480,377 409521Total no. of Tractors
Mahindra & Mahindra
38.9 40.8 41.4 42.0 42.4
F-08 F-09 F-10 F-11 9M F-12
SONALIKA
ESCORTS
TAFE+EIC
M&M
Source : TMA

Combined ‘Mahindra & Swaraj’2525
1300 Dealers2200+
Service points
Mahindra & Mahindra
7 Mfg. Plants• 6 tractor plants• 1 foundry
6350 employees

New Launch2626
Mahindra & Mahindra

Customer Satisfaction Index2727
85
90
95
Mahindra & Mahindra
70
75
80
85
F04 F05 F06 F07 F08 F09 F10
*Taylor Nelson Sofres

M&M Export Performance2828
4,769 5,3856,981 7,525
8,5336,933
8,837
11,812
8,7339,850
13.8 % CAGR (F04 to F11)
Mahindra & Mahindra
F04 F05 F06 F07 F08 F09 F10 F11 9MF11 9MF12
No. of units exported

Beyond Agriculture….2929
Mahindra & Mahindra

3030
Range Expansion: 5kVA to 320 kVA
5kVA Nano DG set320 kVA DG set
Mahindra & Mahindra

3131
Financial Performance – FESNine Months ending 31st Dec. 2011
• Segment Revenue
Rs. 8,939 crores (US$ 1.91 bn) 29%
• Segment Results (EBIT)
Mahindra & Mahindra
Rs. 1,398 crores (US$ 299 mn) 13%

F12 Outlook - Tractor Industry3232
250208 226
263
318 302 304
400
480
13-14%7 % CAGR
Mahindra & Mahindra
250208
160 175
226
F01 F02 F03 F04 F05 F06 F07 F08 F09 F10 F11 F12
F13 Outlook: Higher single digit growth

Going Forward…3333
M&M Initiatives
• New launches & product upgrades coupled withwide portfolio of mechanization solutions
• Growing the Agri business
Mahindra & Mahindra
• Growing the Agri business
• Construction Equipment gathering momentum
• Building capacities for future growth

3434
M&M GroupM&M Group
Mahindra & Mahindra
Key Sectors

3535
Building a Global Business
Mahindra & Mahindra
Building a Global Business

3636
Mahindra Systech: OriginFormed in 2004 - objective of becoming a global auto-component player
Around 2004-2005, European and US auto component manufacturers were going through tough times –
– 35+ auto part makers filed for bankruptcy protection; S&P downgraded 25 US-based auto component suppliers
Auto components was increasingly being looked at as a global business out of low-cost countries
– Rapid increase in exports from India and China with India being recognized for expertise in engine components
Background
M&A to fill in strategic gaps
Mahindra & Mahindra
Key Considerations Acquisitions
• Technology
• Market Access
• Quality of Management
• Location: Europe
• Complementary product portfolio
• No auction
• Optimal size: 75-100 mn Euros
Casting
Gears MES

3737
Mission Statement– To Become Global “Art to Part” Player
To create India’s most Valuable, Innovative,To create India’s most Valuable, Innovative,
“Art to Part” auto component entity that“Art to Part” auto component entity that
partners with its global customers to meet &partners with its global customers to meet &
surpass their business needssurpass their business needs
Mahindra & Mahindra
surpass their business needssurpass their business needs

3838
Mahindra Systech: OverviewSnapshot of key verticals
KeyBusinesses
ForgingsForgings
MahindraForgings (Listed)
CastingsCastings
MahindraHinoday (IVF –PE)
Mahindra Gearsand TransmissionPvt. Ltd.
MetalcastelloS.r.l. (I-Ven –PE)
MUSCO (Listed)
EngineeringServices
EngineeringServices
MahindraEngineeringDesign andDevelopment Co
EnginesEngineering
PlexionTechnologies
CompositesComposites
MahindraComposites(Listed)
GearsGears Stampings &Steel
Stampings &Steel
Mahindra & Mahindra
One of theleading forgingscompany in theworld*
Market leader inCV forgings inEurope
Market leader inforgedcrankshafts inIndia
magnets in India
Leading ductileiron foundry inIndia
Market leader inIndia in axle &transmissionhousings
Largest producerof ferritemagnets in India
One of thehighestEBITDA% inEurope
Leadingmanufacturer ofalloy steel inIndia
One of thelowest coststampingsmanufacturer
Among the top 10 Among the top 10Indianengineeringservicesoutsourcingcompanies
Key player inthe Indianmarket
BriefDescription
Combined Systech offers single window offering to clients, superior cost efficiencies and high bargaining power

3939
Mahindra Systech: OverviewDiversified presence across products, customers & geographies
Products (% ofRevenue – FY11)Products (% of
Revenue – FY11)Key CustomersKey Customers Plant LocationsPlant Locations
DAIMLERIndiaIndia GermanyGermany
Engg Services4%
Others2%
Gears11%
Mahindra & Mahindra
UKUK ItalyItalyForgings
45%
Steel &Stampings
29%
Castings &Ferrites 9%
11%
Note: 1. Others include businesses like Mahindra Composites2. % of revenue calculated without considering intercompany transfer & HQ costs
100%= US$929 mn

4040
Mahindra Systech : Vertical wise Focus
Business Product/Service Focus Segment Focus
Steel Specialty Microalloy Steels Automotive, Oil &Gas, Mining, Engineering
Castings Turbocharger Housings (Global), Axle andTransmission Components (India)
Automotive, Construction Engg
Forgings Crankshafts (IN), Truck Forgings(EU) Automotive, Rail, Defence
Stampings Skin Panels and value added products like FuelTanks, Pedal Box
Automotive
Gears Higher Precision Gears like CWP & Synchros, Sub- Off Road, Construction
Mahindra & Mahindra
Gears Higher Precision Gears like CWP & Synchros, Sub-Assemblies, Product Development Capability
Off Road, Construction
Composites Pipes/Sheets, CNG Tanks, Automotive Parts,Windmill Parts
Infrastructure & Cold Chain, Electrical,Automotive & Alternative Energy
Magnetics Magnets for auto industry; Forward integrate(lighting, cooktops)
Automotive (P/M); Industrial/Retail (NewProducts)
Engineering Services Increase domain knowledge in auto engg; diversifyoutsourcing services into aero & defence
Automotive, Construction, Aero, Defence(India)

4141
SYSTECH Sector Results
9MFY12 9MFY11 %YoY
Segment Rev 827 639 29
(US$ Mn)
Mahindra & Mahindra
Segment Result 26 15 72

4242
Financial Services SectorFinancial Services Sector
Mahindra & Mahindra
Financial Services SectorFinancial Services Sector

4343
RuralNBFCin
FinanceFinance
Mahindra & Mahindra
*MMSFL. is the largest rural NBFC company in India, bynumber of rural branches and being largest financier ofUVs & Tractors in India
inIndia

4444
Introduction
MMFSL is one of India’s leading non-bank finance companies focusedon the rural and semi-urban sector
MMFSL is primarily in the business of financing purchase of new &pre-owned auto & utility vehicles, tractors, cars and commercial vehicles
M&MFSL’s goal is to be the preferred provider of financing services inthe rural and semi-urban areas of India
Mahindra & Mahindra
The Company has 592 offices covering 24 states and 4 union territoriesin India with over 1.9 million vehicle finance customer contracts sinceinception, as of December 31, 2011
CRISIL has assigned a AA+/Stable rating and FITCH has assignedAA+(ind)/Stable rating and Brickwork has assigned AA+/ Positive ratingto the Company’s long term and subordinated debt

4545
Segment wise - Break down of AUM
Segments9M ended
Dec – 11
9M ended
Dec – 10
As on
March-11
Auto/ Utility vehicles(M&M)
30% 30% 31%
Tractors (M&M) 20% 23% 23%
Mahindra & Mahindra
Cars and other (includingnon M&M vehicles)
31% 33% 31%
Commercial vehicles andConstruction equipments
12% 8% 9%
Pre-owned vehicles andothers
7% 6% 6%

MMFSL Consolidated Results4646
(US$ Mn)
9MFY12 9MFY11 %YoY
Income from Operations 432 306 41
PAT 86 70 23
Mahindra & Mahindra
# After Minority interest
PAT 86 70 23

4747
Ratio Analysis
9M ended
Dec – 11
9M ended
Dec – 10
Year endedMarch – 11
PBT/Total Income 29.5% 32.5% 34.9%
PBT/Total Assets 4.4% 4.8% 5.2%
RONW (Avg. Net Worth) 19.2% 20.9% 22.0%
Figures on standalone basis
Mahindra & Mahindra
RONW (Avg. Net Worth) 19.2% 20.9% 22.0%
Overheads/Total Assets 3.3% 3.7% 3.6%
Debt / Equity 4.69:1 4.44:1 3.88:1
Capital Adequacy 17.5% 17.4% 20.3%

4848
IT Services Sector
Mahindra & Mahindra
IT Services Sector

4949
In
Telecom
Software
Mahindra & Mahindra
Tech Mahindra is the largest Telecom focused IT services& Solutions provider in India – by “Voice & Data 2009”
SoftwareinIndia*

5050
India’s one of the leading Telecom Focused IT Services and
Solutions Provider for global communication industry– Presence across Telecom value chain
– Leading provider of integrated services to the global
Tech Mahindra Overview
Leadership position in Outsourcing services to the TelecomIndustry
Mahindra & Mahindra
telecom ecosystem
Global presence with 17 regional offices and 15 delivery
centers
Long term relationship with marquee customers
Talent pool of approx 38,000 professionals and growing
TM is a focused play on the Telecom sector and is the largest offshore pureplay

5151
Comprehensive Coverage of the Telecom Space Application Development & Management
End to End Business Results
Application Development & Management
System Integration
Program and Delivery Management
Process Consulting
BPO
Managed Services
Remote Infrastructure Management
End to End Business Results
Product Engineering Product sustenance
Telecom ServiceProviders (TSP)
Telecom EquipmentVendors (TEM)
(TM having largest TSPpractice among offshorepure plays)
Mahindra & Mahindra
Product sustenance Technology Transformation Product Testing and certification Joint Go-to-market
Vendors (TEM)
Product Development Engineering services Solution Integration services Partnering system Integration
Expertise across the Telecom value chain
Independent Softwarevendors (ISV)
(Strategic relationship with ISVsexpands portfolio of and positionedTM for winning large SI deals)

5252
Acquisition of Satyam
Service Offerings
• Application Development andMaintenance
• Infrastructure ManagementServices
• IT Enabled Services
• Consulting and Enterprise Business
• Application Development andMaintenance
• Infrastructure ManagementServices
• IT Enabled Services
• Business Process Management
Mahindra & Mahindra
Verticals
• Consulting and Enterprise BusinessSolution
• Extended Engineering Solutions
• Security Services
• CRM
• Billing
• BFSI*
• Manufacturing
• Retail, Travel,Logistics
• Healthcare
• Telecom
*Banking, Financial Services and Insurance

5353
Tech Mahindra Consolidated Results
(US$ Mn)
9MFY12 9MFY11 %YoY
Income from Operations 871 830 5
Mahindra & Mahindra
# After Minority interest and after share of profit in Associate
PAT 170 118 44

5544
Hospitality, Real Estate &Hospitality, Real Estate &Infrastructure SectorInfrastructure Sector
Mahindra & Mahindra
Infrastructure SectorInfrastructure Sector

5555
Hospitality, Real Estate &Infrastructure Sector
Leading leisure hospitality providerLeading leisure hospitality provider
Fully Integrated Vacation Ownership (VO) CompanyFully Integrated Vacation Ownership (VO) Company
Multi Product for Multiple customerMulti Product for Multiple customer
Mahindra Holidays & Resorts India LimitedMahindra Holidays & Resorts India Limited
Mahindra & Mahindra
Mahindra Lifespace Developers LimitedMahindra Lifespace Developers Limited
Building Destinations thru’Building Destinations thru’
Integrated DevelopmentsIntegrated Developments -- SEZ, Industrial Parks.SEZ, Industrial Parks.
Residential & Commercial developmentsResidential & Commercial developments

5656
India’s
Holiday
HolidaysHolidays
Mahindra & Mahindra
*Mahindra Holidays has the largest member base as time-share holiday provider in India
Holiday
Company

5577
Mahindra Holidays &
Mahindra & Mahindra
Mahindra Holidays &Resorts India Limited
With around 138,000 Vacation ownership members ason Dec. 31, 2011

5858
Performance: Milestones
Leading Industry position
– Over 138,000 Vacation Ownership (VO) members as at Dec. 31, 2011
– Operates 36 resorts across India & Thailand
12 RCI Gold Crown Resorts for the year 2010 – 2011, making the company one
having the largest number of Gold Crown resorts in the Country
Mahindra & Mahindra
10 consecutive years of RCI Gold Crown for Munnar and Goa
In Q3 F12, Company acquired 100% shareholding of Bell Tower Resorts Pvt Ltd
which owns a resort comprising of 106 rooms in Goa .The company has also signed
an agreement for acquisition of property on long term lease at Kanatal in
Uttarkhand.

5959
(US$ Mn)
9MFY12 9MFY11 %YoY
Income from Operations 93 76 21
Mahindra Holidays Standalone Results
Mahindra & Mahindra
Income from Operations 93 76 21
PAT 14 13 8

6600
MLDL: Pre-eminent Real Estate Corporate
Destination building SEZ, Industrial parks,
logistics zones, etc
Standalone Real Estate
Focus on Tier I/II cities Residential and
Commercial Derive Brand Premium
Company with TransparentBusiness Systems
Promoter of India’s FirstIntegrated Business City
Corporate India’s FirstOperational SEZ
Promoter of the Two Largest IT
Mahindra & Mahindra
Integrated Development
logistics zones, etc Multi-format
development (land, BTS,MTB)
Promoter of the Two Largest ITSEZs in India
Over 7.02 million sq. ft of residential and commercial projects completed in Mumbai, Pune, NCR, Chennai, and Bangalore8.99 million sq. ft of new projects under construction / to be launched in the near term and 12.59 million sq ft of land bank
across Mumbai, NCR, Chennai, Pune, Nasik and Nagpur
Standalone real estate development undertaken by Mahindra Lifespaces; Integrated developmentundertaken through Mahindra World Cities ( Subsidiaries/SPVs)

6161
9MFY12 9MFY11 %YoY
Income from Operations 92 84 10
PAT 16 15 7
(US$ mn)
MLDL Consolidated Results
Mahindra & Mahindra
PAT 16 15 7

Mahindra Group : A USD 14.4 bn Conglomeratewith interests across the economic spectrum
6262
AutomotiveSector
Systems &Technologies
Sector
IT ServicesSector
FarmEquipment
Sector
Mahindra & Mahindra
Real Estate &Infrastructure
Sector
HospitalitySector
FinancialServicesSector
Steel Trading& Processing
Sector
Others

Commitment to Society6363
The Mahindra Group
has pledged to dedicate
Mahindra & Mahindra
has pledged to dedicate
1% of its Profit after Tax to CSR initiatives

Disclaimer
Mahindra & Mahindra herein referred to as M&M, and its subsidiary companies provide a wide array of presentationsand reports, with the contributions of various professionals. These presentations and reports are for informationalpurposes and private circulation only and do not constitute an offer to buy or sell any securities mentioned therein.They do not purport to be a complete description of the markets conditions or developments referred to in thematerial. While utmost care has been taken in preparing the above, we claim no responsibility for their accuracy. Weshall not be liable for any direct or indirect losses arising from the use thereof and the viewers are requested to use theinformation contained herein at their own risk. These presentations and reports should not be reproduced, re-circulated, published in any media, website or otherwise, in any form or manner, in part or as a whole, without theexpress consent in writing of M&M or its subsidiaries. Any unauthorized use, disclosure or public dissemination ofinformation contained herein is prohibited. Unless specifically noted, M&M or any of its subsidiary companies is notresponsible for the content of these presentations and/or the opinions of the presenters. Individual situations and local
6464
Mahindra & Mahindra
responsible for the content of these presentations and/or the opinions of the presenters. Individual situations and localpractices and standards may vary, so viewers and others utilizing information contained within a presentation are freeto adopt differing standards and approaches as they see fit. You may not repackage or sell the presentation. Productsand names mentioned in materials or presentations are the property of their respective owners and the mention ofthem does not constitute an endorsement by M&M or its subsidiary companies. Information contained in apresentation hosted or promoted by M&M is provided “as is” without warranty of any kind, either expressed orimplied, including any warranty of merchantability or fitness for a particular purpose. M&M or its subsidiary companiesassume no liability or responsibility for the contents of a presentation or the opinions expressed by the presenters. Allexpressions of opinion are subject to change without notice.

Thank youVisit our website at www.mahindra.com
Mahindra & Mahindra
Visit our website at www.mahindra.com