Embed Size (px)
Citation preview

Experimental Design,
Reliability And Validity Zulkarnain Lubis

• Experimental Design • Principles of Experimental Design
• Randomization • Completely Randomized Design
• Randomized (Complete) Block Design
• Factorial Designs

PRINCIPLES OF EXPERIMENTAL DESIGN
• Control the effects of lurking variables on the response with a plan for collecting the sample.
• We use experimental data instead of observational data
• Randomize
• Replicate

KEY TERMS
• Experiment: Process of collecting sample data
• Design of Experiment: Plan for collecting the sample
• Response Variable: Variable measured in experiment (outcome, y)
• Experimental Unit: Object upon which the response is measured
• Factors: Independent Variables
• Level: The value assumed by a factor in an experiment
• Treatment: A particular combination of levels of the factors in an experiment

STEPS IN AN EXPERIMENT (EFFECTS OF BRAND AND SHELF LOCATION ON COFFEE SALES)
• Select factors to be included
• brand and shelf location
• Choose the treatments
• brand (2) and shelf location (3) combinations
• Determine the number of observations to be made for each treatment
• sales are recorded once a week for 18 weeks
• Plan how the treatments will be assigned to the experimental units

VOLUME AND “NOISE”
• Volume: quantity of information in an experiment
• Increase with larger sample size, selection of treatments such that the observed values (y) provide information on the parameters of interest
• Noise: experimental error
• Reduce by assigning treatments to experimental units

EXPERIMENTAL DESIGN
Advantages
• Most powerful
• Controlling properties
• Greater corroboration – independent variable affects the dependent variable
Disadvantages
• Number of variables are not amenable to manipulation
• Many variables could technically be manipulated but not ethically
• Not feasible due to environmental aspects

RANDOMIZATION
• The use of chance to divide experimental units into groups is called randomization.
• Comparison of effects of several treatments is valid only when all treatments are applied to similar groups of experimental units.

HOW TO RANDOMIZE?
• Flip a coin or draw numbers out of a hat
• Use a random number table
• Use a statistical software package or program
• Minitab, SPSS, SAS, etc

COMPLETELY RANDOMIZED DESIGN
• The CRD is the simplest of all designs. • Replications of treatments are assigned completely at
random to independent experimental subjects.
• Adjacent subjects could potentially have the same treatment
• Sample layout: There are 4 (A – D) treatments with 3 replications (1 – 3) each.
A1 B1 C1 A2
D1 A3 D2 C2
B2 D3 C3 B3

RANDOMIZED (COMPLETE) BLOCK DESIGN
• The RCB is the standard design for ‘agricultural’ experiments. The field is divided into units to account
for any variation in the field. Treatments are then assigned at random to the subjects in the blocks-once
in each block.
• Treatments are assigned at random within blocks of adjacent subjects, each treatment once per block.
• The number of blocks is the number of replications.
• Any treatment can be adjacent to any other treatment, but not to the same treatment within the
block.

RANDOMIZED (COMPLETE) BLOCK DESIGN
• Used to control variation in an experiment by accounting for spatial effects.
• Sample Layout: Each horizontal row represents a block. There are 4 blocks (I-IV) and 4
treatments (A-D) in this example.
Block I A B C D
Block II D A B C
Block III B D C A
Block IV C A B D

FACTORIAL DESIGNS
• Careful selection of the combinations of factor levels in the experiment
• Provide information on factor interaction
• Regression model includes: • Main effects for each of the k factors
• Two-way interaction terms for all pairs of factors
• Three-way interaction terms for all pairs of factors
• …
• K-way interaction terms of all combinations of k-factors.

Validity & Reliability

WHAT IS RELIABILITY?
• Reliability is: • the consistency of your
measurement instrument
• the degree to which an instrument measures the same way each time it is used under the same condition with the same subjects
What do I mean by…?

RELIABILITY
• Reliability
• Consistency, stability, or repeatability
• Your ruler… • was consistent • measured the same way each time it was
used under the same condition with the same object
The book did not change and therefore the
ruler reported back the same measurement Your ruler is RELIABLE

RELIABILITY • Every time the water begins to boil the kettle
whistles
• Every time it is 6:30 my alarm clock goes off
• Every time I use the little plastic up I have 2 tablespoons of medicine
All of these tools of
measurement are reliable given
the same temperature, time
and volume, they measure the
same consistently.

RELIABILITY
• Reliability alone does not mean that you have a good instrument however.
• Imagine the following reliable instrument:
165
Every morning Margie gets on the scale
and every morning it reads 165 lbs. It
seems pretty reliable since Margie
hasn’t gained or lost any weight.
One day an elephant got on Margie’s
scale and it still read 165 lbs.!
How is this scale reliable? It does measure
the same way
under the same
conditions
(Margie’s) – but a
lot of other
conditions too (the
elephant and who
knows what else).
165

WHAT IS VALIDITY?
• Validity asks • if an instrument
measures what it is supposed to
• how “true” or accurate the measurement is
• Validity
• The correctness or truthfulness of an inference

RELIABLE BUT NOT VALID
But, neither
measures what it is
supposed to:
• The scale is not
really measuring
weight
This NOT VALID
What about the clock, is it
measuring time ?
This clock reads 6:15
If nothing changes – if time stands still, will the
clock still say the same thing?
YES! It’s very reliable. You always know exactly
what it is going to say.
The problem is, even if time doesn’t stand still, the
clock will not move…but it Is still reliable.
This instrument is very RELIABLE
This reports consistently – too consistently

PUTTING RELIABILITY AND VALIDITY TOGETHER
• Every instrument can be evaluated on two dimensions:
• Reliability • How consistent it is given the same
conditions
• Validity • If it measures what it is supposed to and
how accurate it is

Unreliable and Not
Valid Unreliable but Valid
Reliable but Not
Valid Reliable and Valid

• An instrument is valid if measures what it purpose to measure
• Validity concerns: • the form of the instrument
• the purpose of the instrument
• the population for whom it is intended
• Validity asks • if an instrument measures what it is supposed to
• how “true” or accurate the measurement is
• Therefore, we cannot ask the general question “Is this a
valid instrument?”.
• The question to ask is “how valid is this instrument for the
decision that I need to make?” or “how valid is the
interpretation I propose for the instrument?”

THINKING MORE ABOUT VALIDITY
Validity is whether or not the instrument measures what it is designed to measure.
Below are three constructs that you can use to evaluate the validity of a measure:
• Face Validity
• Predictive Validity
• Concurrent Validity

THREE VALIDITIES
• Face Validity -- Do the questions look like measure what they are supposed to?
• Predictive Validity
• Do you imagine that this measure would predict something that it logically should?
• The extent to which a procedure allows accurate predictions about a subject’s future behavior
• Concurrent Validity
• Do you think this measure correlates strongly with something that it logically should?
• The extent to which a procedure correlates with the current behavior of subjects

FACE VALIDITY (A PART OF CONTENT VALIDITY)
Do the questions look like they measure what they are supposed to?
• What does the question below look like it
would measure?
Choose the item that best describes you:
(0) I do not feel sad.
(1) I feel sad.
(2) I am sad all the time and I can't snap out of it.
(3) I am so sad or unhappy that I can't stand it.
If you said depression you
would be correct. It looks like
an item from a depression
scale – and it is!
It has face validity
If someone said this was from
a parental attachment scale,
then you could say that it lacks
face validity.

PREDICTIVE VALIDITY
Does the measure predict something that it logically should?
The SAT
According to their website, “the SAT is the one test that shows colleges what you know”. College admissions officers use this test to determine who will do well in college.
What future measures do you expect that the SAT would be correlated with?
If you said grades in college you would be right, and the SAT IS correlated with that! – somewhat…
It has predictive validity

CONCURRENT VALIDITY
Does this measure correlate strongly with something that it logically should right now?
Unlike predictive validity, concurrent validity compares measures taken at the same time
What current measures do you imagine that GPA should correlate with?
If you said current test scores and teacher ratings you would be correct.
GPA has some concurrent validity

CONSTRUCT VALIDITY
• The degree to which a test measures an intended hypothetical construct
• The extent to which a test measures a theoretical construct or attribute
• CONSTRUCT: abstract concepts such as intelligence, self-concept, motivation, aggression and creativity that can be observed by some type of instrument.

CRITERION RELATED VALIDITY
• validation of an instrument by comparing it to other measurement instruments that are valid and reliable in a way to calculate the coefficient correlation, if the correlation is significant, the instrument is considered has criterion oriented validity.
• Can be divided into :
• Concurrent validity
• Predictive validity

CONCEPT VALIDITY
• Categorized into :
• convergent validity
• discriminant validity
• Convergent validity is met if the scores obtained by two different instruments that measure the same concept shows a high correlation
• Discriminant validity is met if by the theory, two variables are predicted no correlated , and the scores obtained really empirically prove it.

VALIDITY
• In General, we can divide the types of validity into logical and empirical.
• Logical validity: the instrument is valid because it has already designed well, based on the theory, and in accordance to the existing provisions
• Empirical validity: the instrument considered valid based on experiences

VALIDITY
• Logical validity • construct validity: The degree to which a test measures
an intended hypothetical construct
• content validity: When we find out that the entire content of the behavior/construct/area is represented in the measurement
• Empirical Validity: • concurrent validity: The degree to which the scores on
an instrument are related to the scores on another, already established, an instrument administered at the same time, or to some other valid criterion available at the same time
• criterion-oriented or predictive validity : When you are expecting a future performance based on the scores obtained currently by the measure
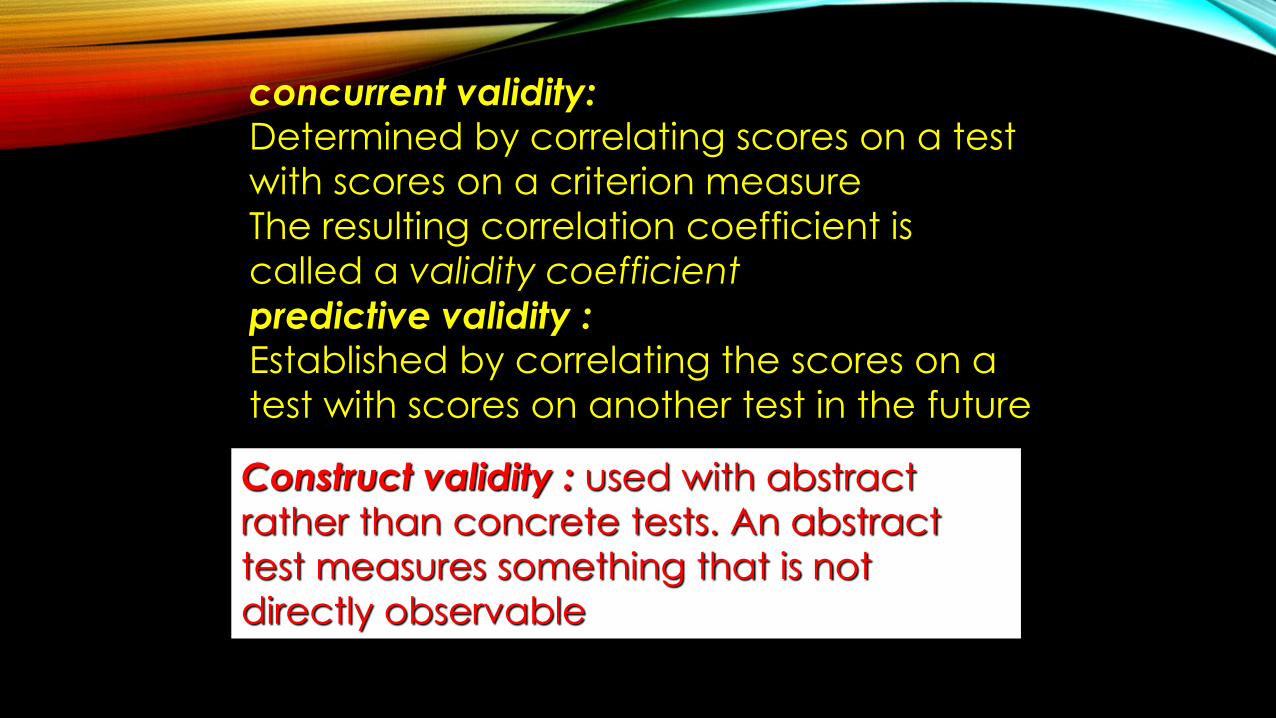
concurrent validity: Determined by correlating scores on a test
with scores on a criterion measure
The resulting correlation coefficient is
called a validity coefficient
predictive validity : Established by correlating the scores on a
test with scores on another test in the future
Construct validity : used with abstract rather than concrete tests. An abstract
test measures something that is not
directly observable

VALIDITY TEST
• Validity test is used to determine the level of validity of the instrument (questionnaire) for collecting data
• Product Moment Correlation: A statistical tool usually used to test the validity of and instrument (construct validity)
• The level of validity is measured by the coefficient of correlation between the scores of each indicator / item questions (Xi) with a total score / factor (X). It can be determined by any computer software; MINITAB, SPSS
• Using SPSS: Analyze, Correlate, Bivariate, Variables, Total Variable

WHAT ARE SOME WAYS TO IMPROVE VALIDITY?
• Make sure your goals and objectives are clearly defined and operationalized.
• Match your assessment measure to your goals and objectives.
• Get students involved; have the students look over the assessment for troublesome wording, or other difficulties.
• If possible, compare your measure with other measures, or data that may be available.

Reliability

• Reliability of the instrument can be tested in two ways,
• External reliability test; measure or criteria are outside the instrument
• Internal reliability test; measure or criteria based on data obtained from the instrument
• External reliability is tested by using parallel technique (double test double trial)
• To test the internal reliability can be done in several ways Alpha formula is one among them

TYPES OF RELIABILITY
• Test-retest reliability (external)
• Parallel forms reliability (external)
• Inter-rater reliability
• Internal consistency reliability
• Average inter-item correlation
• Split-half reliability (external)

TEST-RETEST RELIABILITY
• Test-retest reliability is a measure of reliability obtained by administering the same test twice over a period of time to a group of individuals. The scores from Time 1 and Time 2 can then be correlated in order to evaluate the test for stability over time
• The degree to which scores are consistent over time. It indicates score variation that occurs from testing session to testing session as a result of errors of measurement.

PARALLEL FORMS RELIABILITY
• Parallel forms reliability is a measure of reliability obtained by administering different versions of an assessment tool (both versions must contain items that probe the same construct, skill, knowledge base, etc.) to the same group of individuals. The scores from the two versions can then be correlated in order to evaluate the consistency of results across alternate versions.
• Parallel-forms reliability is gauged by comparing two different tests that were created using the same content
• The two tests should then be administered to the same subjects at the same time.
• The scores on the two test forms are correlated in order to determine how similarly the two test forms function

INTER-RATER RELIABILITY • Inter-rater reliability is a measure of reliability used to assess the degree to
which different judges or raters agree in their assessment decisions. Inter-rater reliability is useful because human observers will not necessarily interpret answers the same way; raters may disagree as to how well certain responses or material demonstrate knowledge of the construct or skill being assessed
• By using SPSS, to run this analysis in the menus, specify Analyze>Descriptive Statistics>Crosstabs, specify one rater as the row variable, the other as the column variable, click on the Statistics button, check the box for Kappa, click Continue and then OK.
• RELIABILITY offers a set of intra class correlation coefficients (ICCs) designed for two or more raters rating objects, normally on an interval scale.
• Specify Analyze>Scale>Reliability Analysis. Specify the raters as the variables, click on Statistics, check the box for Intra class correlation coefficient, choose the desired model, click Continue, then OK.

INTERNAL CONSISTENCY RELIABILITY
• Internal consistency reliability is a measure of reliability used to evaluate the degree to which different test items that probe the same construct produce similar results
• Average inter-item correlation; It is obtained by taking all of the items on a test that probe the same construct, determining the correlation coefficient for each pair of items, and finally taking the average of all of these correlation coefficients. This final step yields the average inter-item correlation
• Split-half reliability; It is begun by “splitting in half” all items of a test that are intended to probe the same area of knowledge in order to form two “sets” of items. The entire test is administered to a group of individuals, the total score for each “set” is computed, and finally the split-half reliability is obtained by determining the correlation between the two total “set” scores.

SPLIT-HALF RELIABILITY
• The process of obtaining split-half reliability is begun by “splitting in half” all items of a test that are intended to probe the same area of knowledge.
• The entire test is administered to a group of individuals, the total score for each “set” is computed, and finally the split-half reliability is obtained by determining the correlation between the two total “set” scores.
• Gutman Split-Half Coefficient as a reliability coefficient derived from correlation coefficient between the two total “set” scores, by using the formula:
• Split-half reliability can be calculated by using SPSS
𝟐𝒓𝟏𝟐𝟏 + 𝒓𝟏𝟐
r =

CRONBACH'S ALPHA
• Cronbach's alpha was developed by Cronbach's alpha coefficient (1951) as a general measure of the internal consistency of multi-item scale
• Cronbach's alpha is calculated by using the formula :
• If cronbach’s alpha > rtable(α, n-1) , considered the instrument reliable
• Items which have “corrected item-total correlation” <rtable(α, n-1) considered unreliable
• Using Cronbach's alpha to test reliability can be performed by SPSS as the following: Analyze, Scale, Reliability Analysis, select items, statistics, descriptive for, item, scale, scale if item deleted, continue, OK
))(
1)(1
(2
2
t
b
k
k

SOME METHODS TO CALCULATE INTERNAL RELIABILITY BESIDES ALFA CRONBACH
• Spearman Brown (split half)
• Flanagant
• Rulon
• KR 20
• KR 21
• Analyisis of Variance Hyot)