Embed Size (px)
Citation preview
Enrichment Analysis
Prat Thiru
1
Outline • Overview and Goals of Enrichment Analysis • Databases for Gene Set Annotations • Statistics for Enrichment • Enrichment Tools • Practicalities • Supplementary Information on Statistics
2

Overview
3
Microarrays
Epigenomics
RNA-Seq
Gene Log Ratio p-value
Abcg1 -2.09614 4.72E-07 Adamts5 2.483321 1.33E-07 Alox12b -2.41347 3.59E-07 Arg1 -2.27214 3.06E-07 AU018091 2.048711 4.62E-07 Bex1 2.591349 4.08E-07 Degs2 -2.46253 1.54E-07 Klk7 -2.18902 3.77E-07 Krt78 -2.89916 2.18E-07 Ly6c1 3.085592 9.41E-08 Ly6g6c -2.55108 3.62E-07 Sdr16c6 -2.16277 4.05E-07 Sdr9c7 -2.25984 2.63E-07 Sept5 -2.08797 6.31E-07 Kprp -2.34542 6.77E-07 Ly6a 2.839925 6.04E-07 Slc2a3 2.199118 6.52E-07 Sprr2i -2.22872 5.67E-07 Mxd1 -1.77522 9.66E-07 Cidea -1.93749 1.20E-06 Krt16 -1.91642 1.24E-06 Krt8 2.057569 1.22E-06 Trex2 -1.71243 1.29E-06 Aldh3b2 -1.7556 2.63E-06 Asprv1 -1.56796 2.35E-06
?
: :
Long List of Genes

Goals of Enrichment Analysis • Identifying the differences in a set of genes will give
more biological insight than an individual gene • Functional annotations that are over-represented
in the gene list • Find related genes, for eg. by metabolic pathways,
cell signaling pathways, type of kinase, targets of miRNA, etc.
4
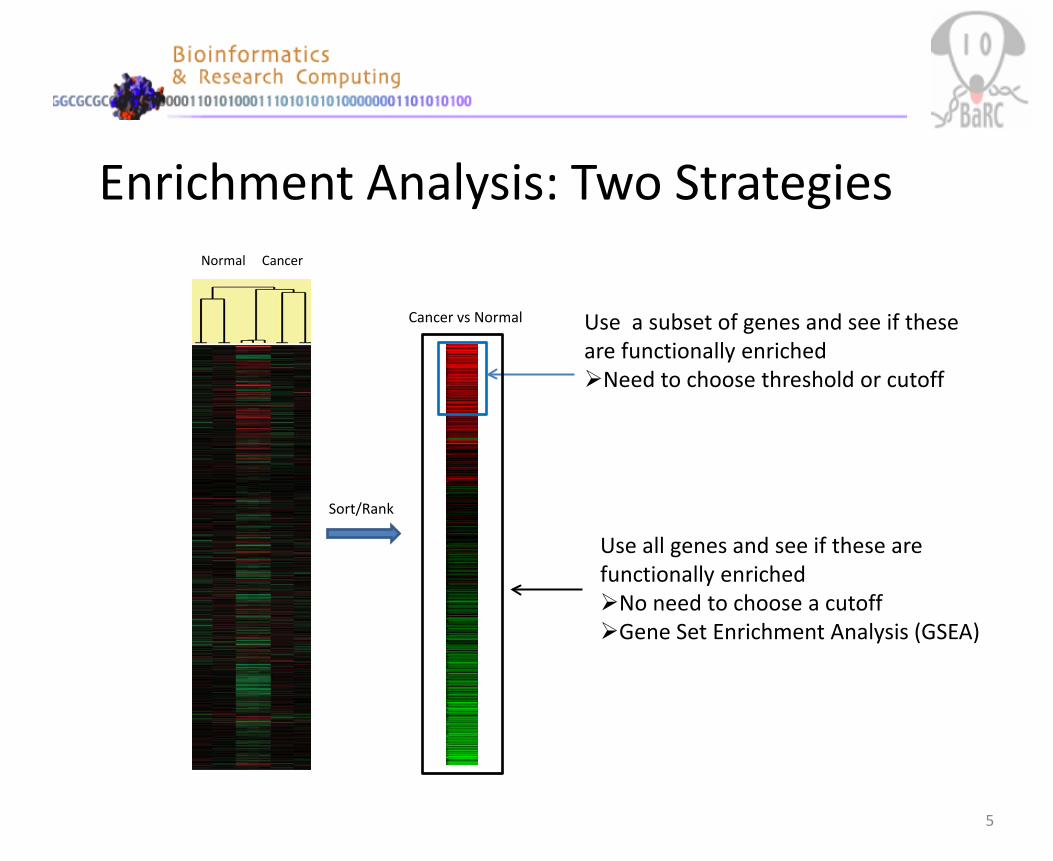
Enrichment Analysis: Two Strategies
5
Use a subset of genes and see if these are functionally enriched Need to choose threshold or cutoff
Use all genes and see if these are functionally enriched No need to choose a cutoff Gene Set Enrichment Analysis (GSEA)
Normal Cancer
Sort/Rank
Cancer vs Normal
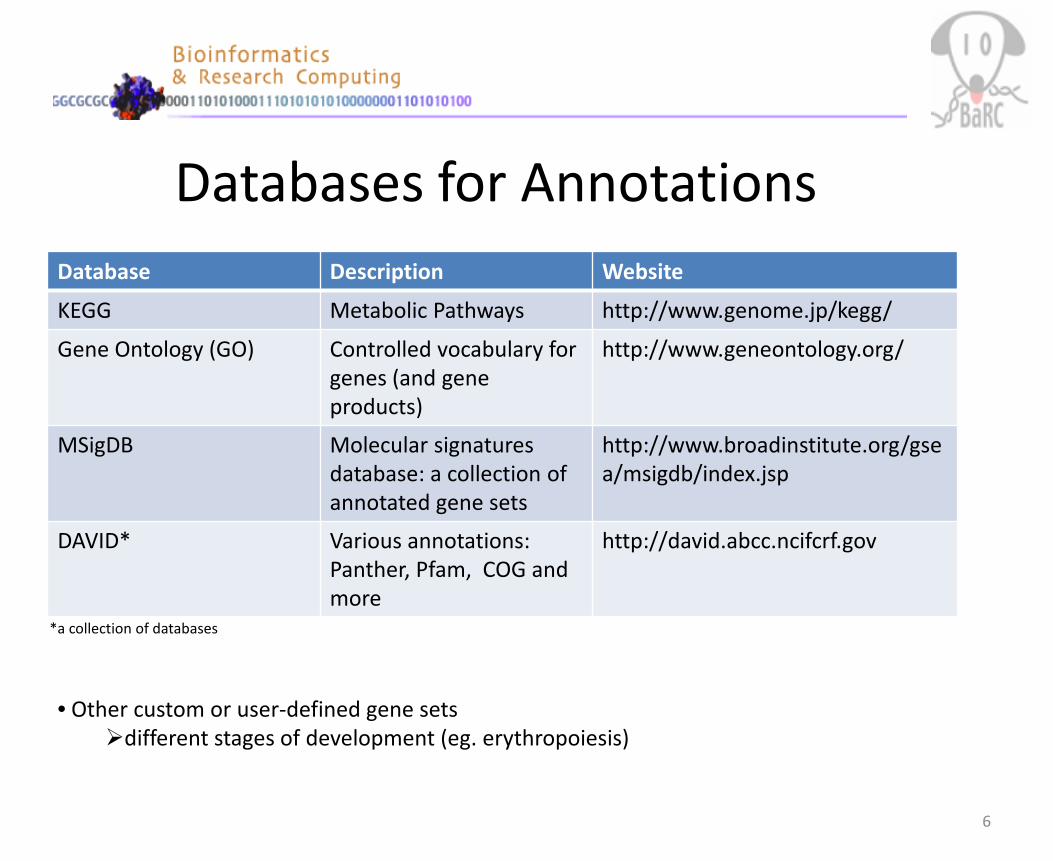
Databases for Annotations
6
Database Description Website
KEGG Metabolic Pathways http://www.genome.jp/kegg/
Gene Ontology (GO) Controlled vocabulary for genes (and gene products)
http://www.geneontology.org/
MSigDB Molecular signatures database: a collection of annotated gene sets
http://www.broadinstitute.org/gsea/msigdb/index.jsp
DAVID* Various annotations: Panther, Pfam, COG and more
http://david.abcc.ncifcrf.gov
• Other custom or user-defined gene sets different stages of development (eg. erythropoiesis)
*a collection of databases

Gene Ontology (GO) • Collection of gene sets with controlled vocabulary • Cellular Component: parts of a cell (eg. nucleus,
ER) • Molecular Function: activity of a gene product (eg.
binding, catalysis) • Biological Process: series of events accomplished
by one or more ordered assemblies of molecular functions (eg. pyrimidine metabolic process) Function vs Process: the process must have more than
one distinct steps.
7 http://www.geneontology.org/GO.doc.shtml
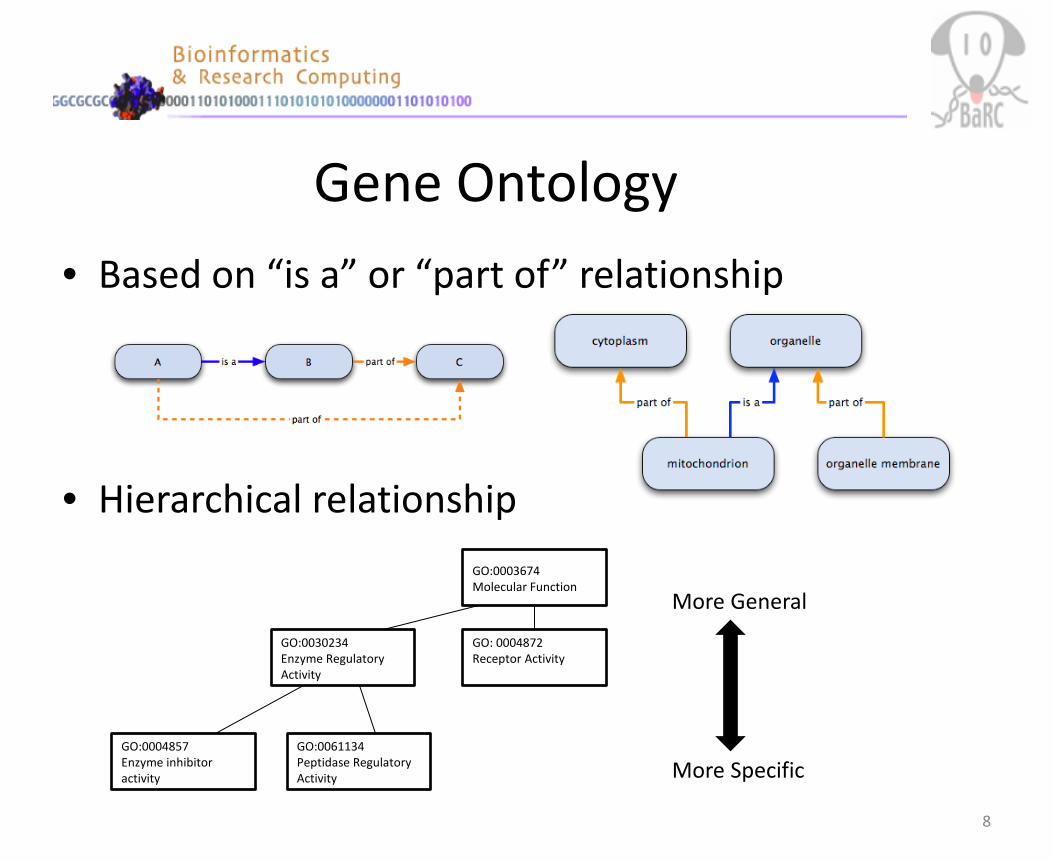
Gene Ontology • Based on “is a” or “part of” relationship
• Hierarchical relationship
8
GO:0003674 Molecular Function
GO:0030234 Enzyme Regulatory Activity
GO:0004857 Enzyme inhibitor activity
GO:0061134 Peptidase Regulatory Activity
GO: 0004872 Receptor Activity
More General
More Specific

GO Enrichment
9
All Genes (eg. 25,000) GO:0000988
GO:0000990
GO Term Enriched
Selected Genes (eg. 25)
GO:0045174 (eg. 20)
GO:0005488 (eg. 40)

Assessing Significance of Enrichment Fisher’s Exact Test (Hypergeometric Test)
Kolmogorov-Smirnov (KS) Test
10
Gene Score
Cum
ulat
ive
Prob
abili
ty
What is the probability of getting 7 or more black balls?
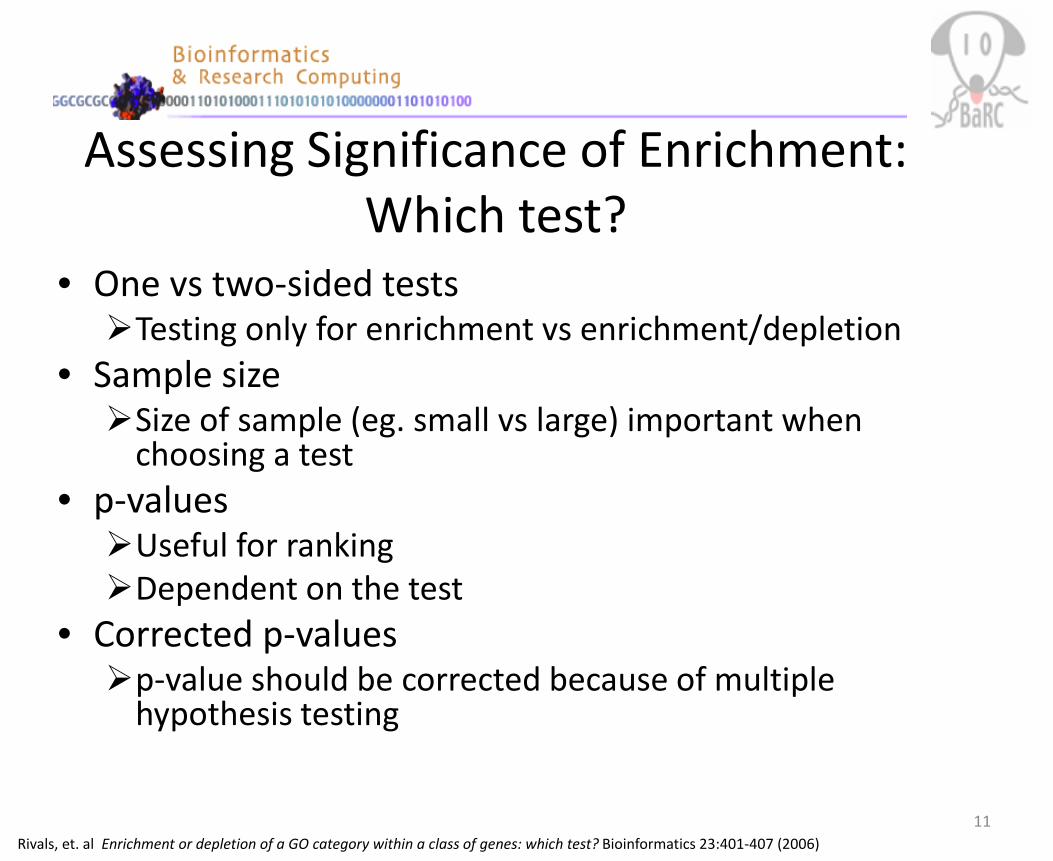
Assessing Significance of Enrichment: Which test?
• One vs two-sided tests Testing only for enrichment vs enrichment/depletion
• Sample size Size of sample (eg. small vs large) important when
choosing a test • p-values Useful for ranking Dependent on the test
• Corrected p-values p-value should be corrected because of multiple
hypothesis testing
11 Rivals, et. al Enrichment or depletion of a GO category within a class of genes: which test? Bioinformatics 23:401-407 (2006)

Enrichment Analysis Tool Infrastructure
12 Huang, D.W., et al. Bioinformatics enrichment tools: paths toward the comprehensive functional analysis of large gene lists NAR 37:1-13 (2008)

Enrichment Analysis Tools
13
Tool Statistical Method Website
DAVID Fisher http://david.abcc.ncifcrf.gov
GSEA KS Test http://www.broadinstitute.org/gsea
BiNGO (Cytoscape Plugin) Hypergeometric; Binomial http://www.psb.ugent.be/cbd/papers/BiNGO/Home.html
GeneGO* Hypergeometric http://www.genego.com
GoMiner Fisher http://discover.nci.nih.gov/gominer/index.jsp
*commercial

Enrichment Analysis: Factors to Consider
• Gene list • Background gene list • Statistical test • Gene set annotations (including user-defined) • p-value Correction
14
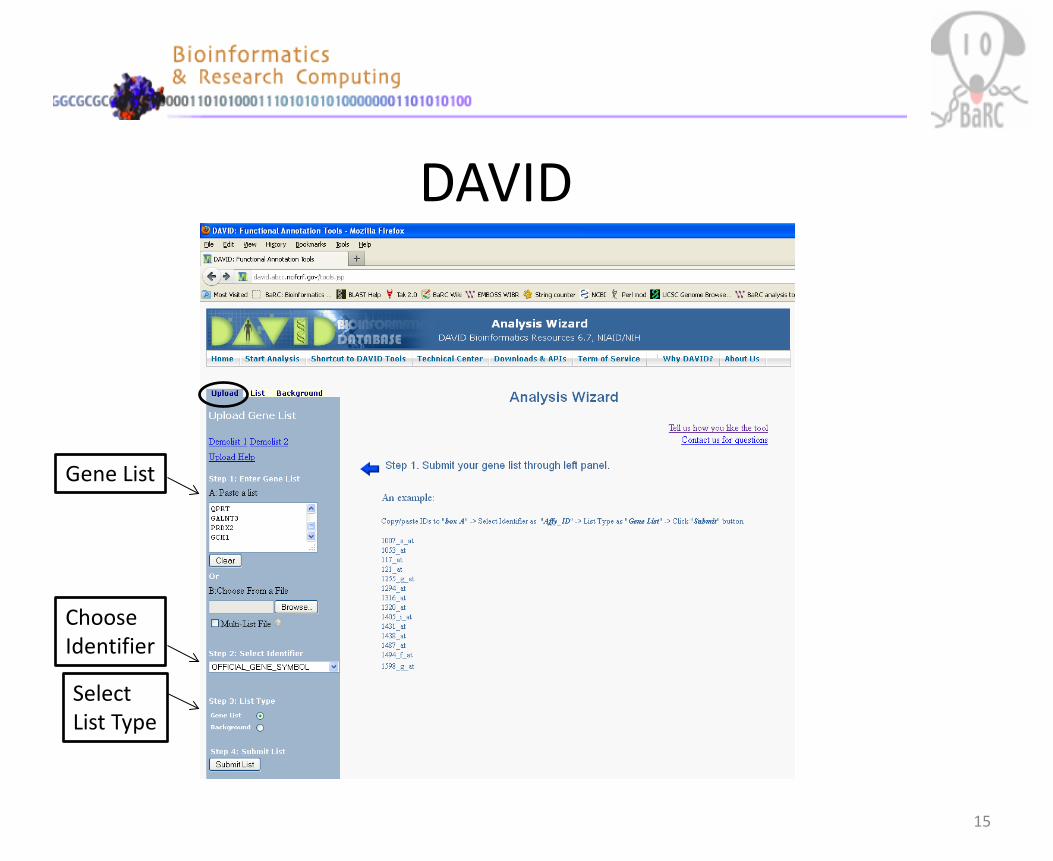
DAVID
15
Gene List
Choose Identifier
Select List Type

DAVID: Output
16
Expand “Options” to change parameters: eg. p-value correction by FDR or Benjamini
Select Database: eg. GO, Panther, etc. to expand

Gene Set Enrichment Analysis (GSEA)
17 Mootha, V.K., et al. PGC-1α responsive genes involved in oxidative phosphorylation are coordinately downregulated in human diabetes Nature Genetics 34(3):267-273 (2003)

GSEA
18
KO Ctrl
Gene
Set
1
Gene
Set
2
Gene
Set
3
Rank
ed b
y En
richm
ent S
core
(ES)
Gene Set 1 enriched in KO
Gene Set 3 enriched in Ctrl
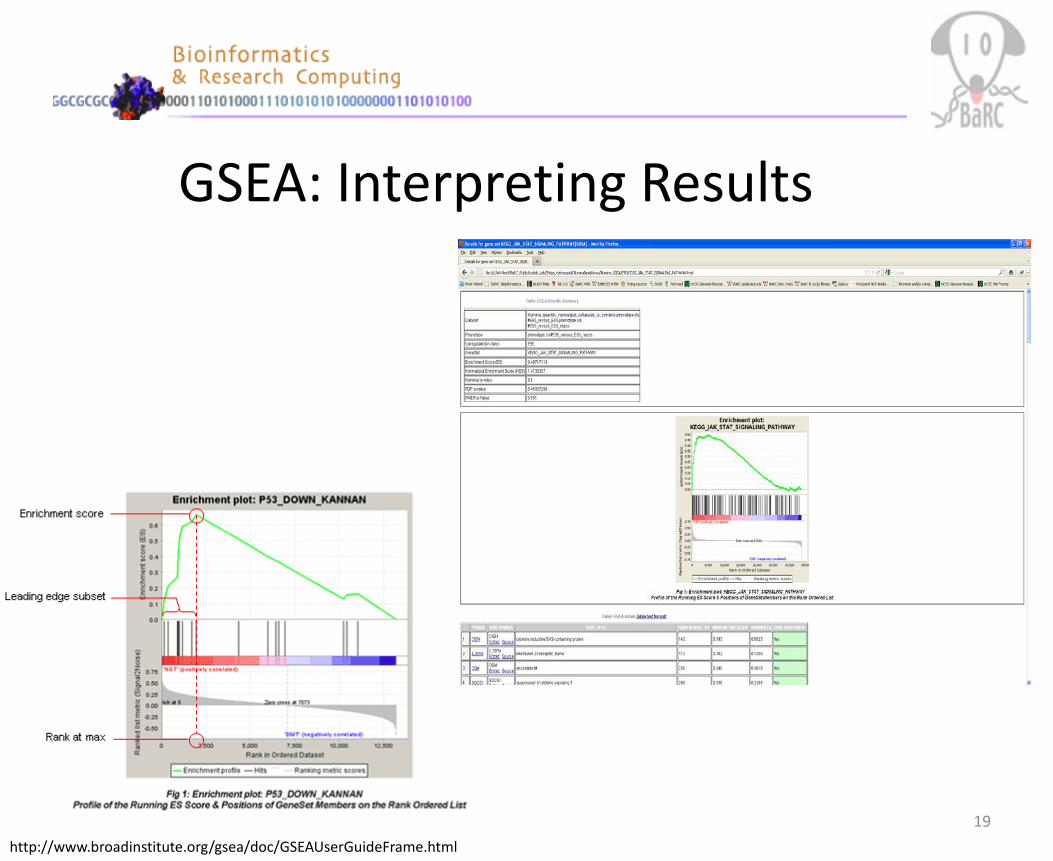
GSEA: Interpreting Results
19 http://www.broadinstitute.org/gsea/doc/GSEAUserGuideFrame.html
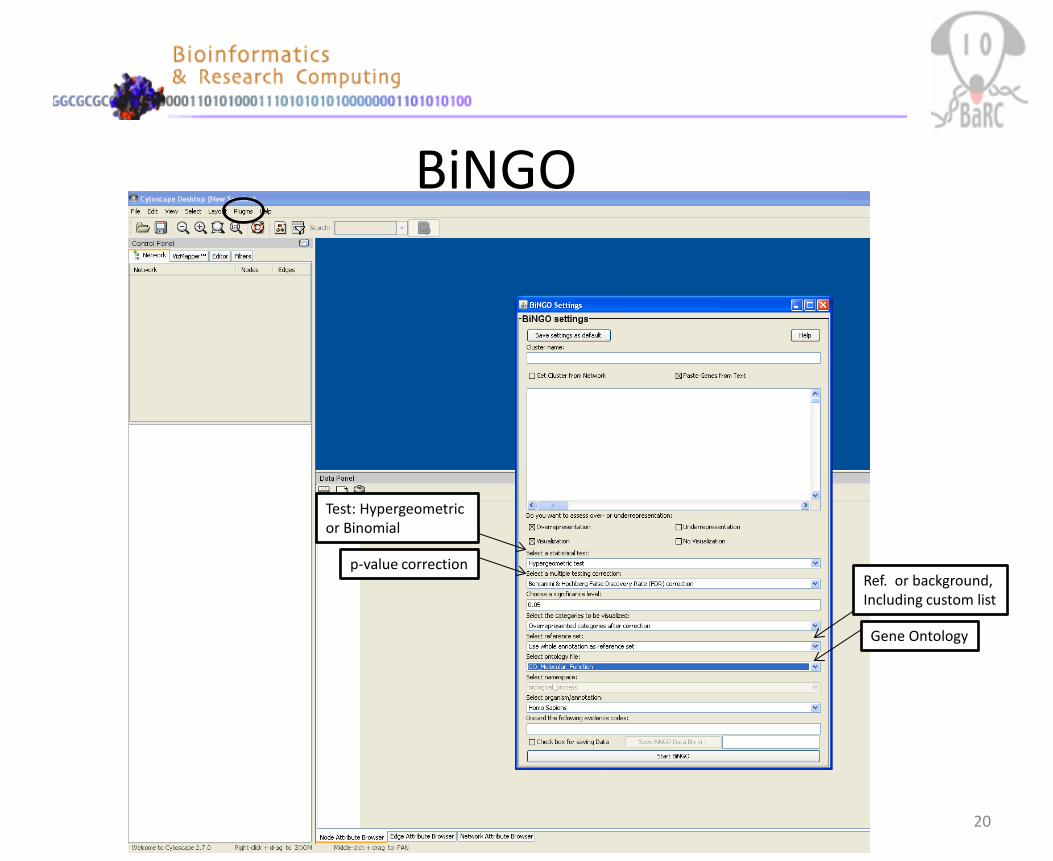
BiNGO
20
Test: Hypergeometric or Binomial
Ref. or background, Including custom list
Gene Ontology
p-value correction

BiNGO: Output
21
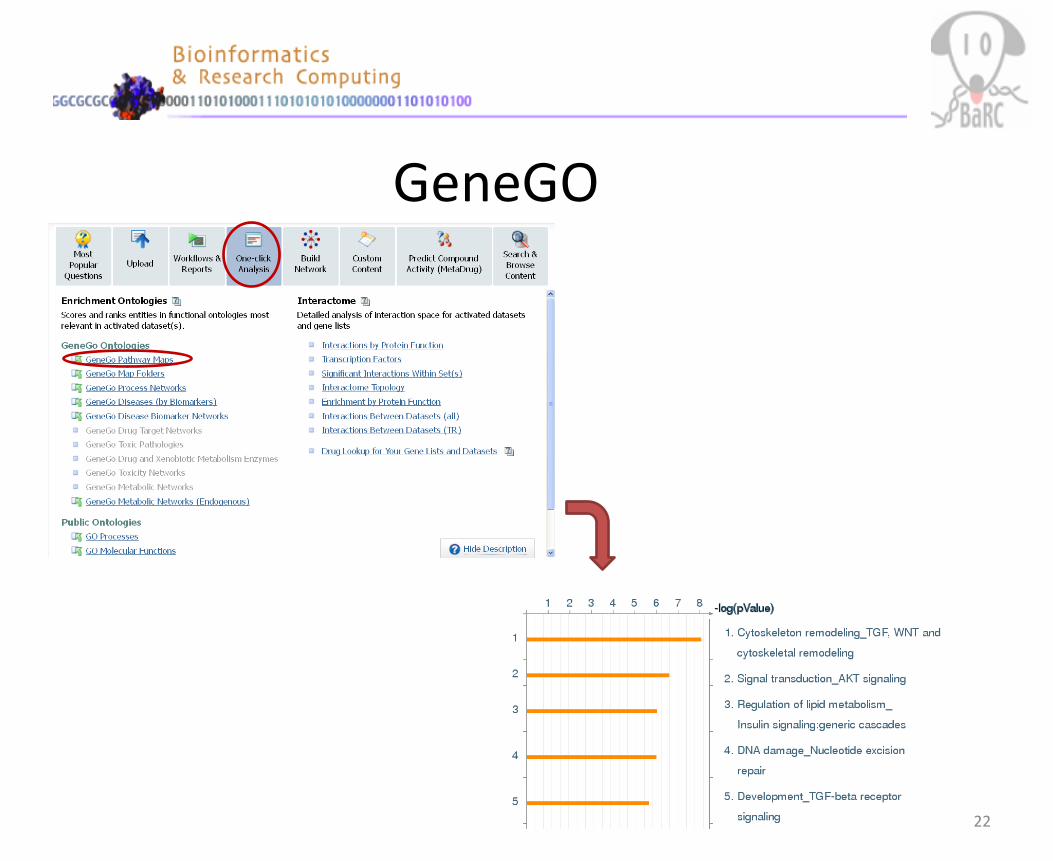
GeneGO
22

BaRC SOP https://gir.wi.mit.edu/trac/wiki/barc/SOPs/go_annotation
23

Enrichment Analysis: Practicalities
• Choose a tool that includes your species includes your genes or identifiers has up-to-date annotation allows user-defined background
• Try a few tools • Use gene lists with varying lengths (ie. different thresholds) • Ignore enriched categories which, contain very few genes highly overlap with other categories
• Graphical or text summary
24 http://jura.wi.mit.edu/bio/education/hot_topics/enrichment/Gene_list_enrichment_Mar10.pdf

Further Reading • Clark, N.R., and Ma’ayan, A. Introduction to
Statistical Methods for Analyzing Large Data Sets: Gene-Set Enrichment Analysis Science Signaling 4:190 (2011)
• Huang, D.W., et al. Bioinformatics enrichment tools: paths toward the comprehensive functional analysis of large gene lists NAR 37:1-13 (2008)
• Rivals, et. al Enrichment or depletion of a GO category within a class of genes: which test? Bioinformatics 23:401-407 (2006) 25

Supplementary: Fisher’s Exact Test in R
26
All Tissues Adipose Amino Acid 35 Bile Acid 6 Carbohydrate Storage 13 2 Cholesterol 14 CoA 14 Cofactor 24 Creatine 5 Cysteine 9 1 Detox 28 2 Fatty Acid 120 7 Folate 11 Glutamate 10 Glycan Degradation 46 Glycan Sulfate 20 1
Are the genes in my list from adipose tissue enriched for fatty acid (FA) cycle?
Urea 6 Vitamin A 16 1 Vitamin B6 4 Total 1663 27
:
Number of Genes in Gene Set
Number of Genes not in Gene Set
Total
Genes in (my) Gene List
a c a+c
All Genes b d b+d
Total a+b c+d a+b+c+d
2x2 contingency table

Supplementary: Fisher’s Exact Test in R
27
FA cycle Metabolic
Adipose 7 27
All Tissues 120 1663
FA cycle Non-FA pathway (Row) Total
Adipose 7 20 27
Non-adipose 113 1523 1636
(Column) Total 120 1543 1663
R session: > myData <-matrix(c(7,113,20,1523),nr=2) > fisher.test(myData, alternative="greater") Fisher's Exact Test for Count Data data: myData p-value = 0.002253

Supplementary: Hypergeometric Distribution
28
What is the probability of observing 10 selected/significant genes in the GO Term?
8.5x10⁻²⁰
Hypergeometric Null Distribution
#R Commands #null hypergeometric distribution >dhyper(0:25,60,19940,25) #see fig. on right >sum(dhyper(10:25,60,19940,25)) #p-value: 8.459171e-20 #Alternative using Fisher's Exact Test # In GO Not in GO # Sig. 10 15 # Non-Sig. 50 19925 # >myContingencyTable<-matrix(c(10,50,15,19925),nr=2) >fisher.test(myContingencyTable) #p-value: 8.459171e-20
All Genes (eg. 20,000)
Selected Genes (eg. 25)
GO:0045174 (eg. 60 )