Embed Size (px)
Citation preview
Creating maps and other geographical
visualizations from census data
UK Data Service Census Support census geography courseUniversity of Edinburgh6th June 2013
Carol BlackwoodUK Data ServiceEDINA

The power of maps
• Mapping census data reveals patterns hidden in tabular data
• Using GIS allows you to be creative and flexible
• Highlight the features that are important to your research

Types of maps
• Common maps used when looking at census data
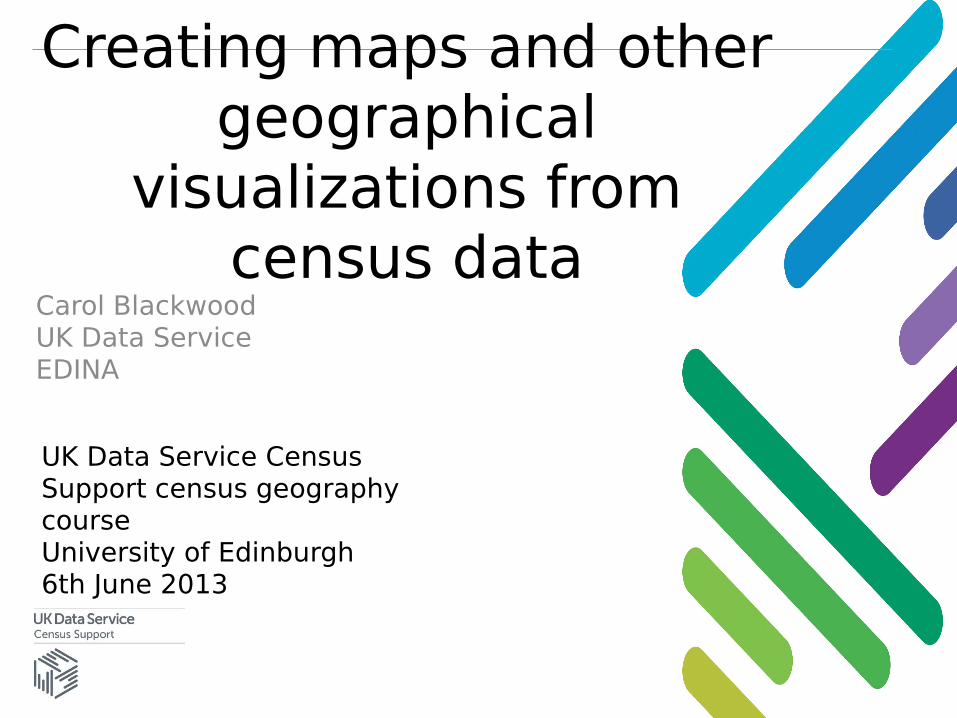
• Choropleth map• A thematic map shaded according to a variable e.g.
population, age
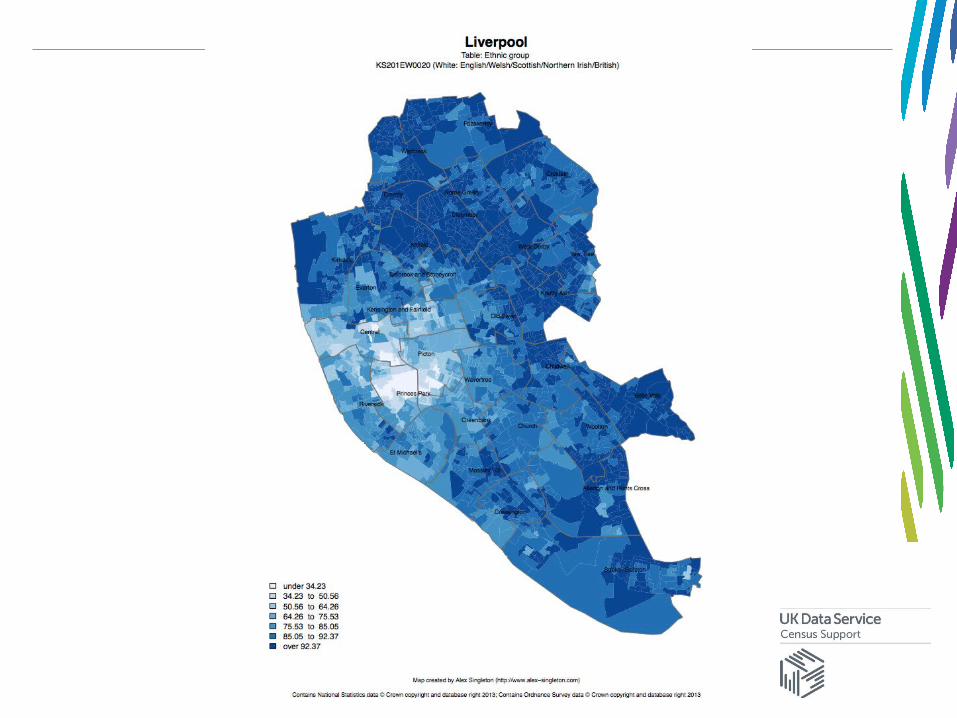
• Cartogram• A thematic map where land area is shown in proportion to
the variable of interest

District outlines
DIGITAL BOUNDARY DATA
Census Aggregate Statisticse.g. Population by district of SW England
=
Map displaying population of SW England
Choropleth map- A thematic shaded map

edin_oa_no_heating
percent
0.000000 - 6.250000
6.250001 - 15.710000
15.710001 - 29.270000
29.270001 - 47.620000
47.620001 - 82.350000

http://casa.oobrien.com/booth/?zoom=10&lat=55.90441&lon=-3.84683&layers=B000FFTT#

http://www.viewsoftheworld.net/?p=1508
http://www.bbc.co.uk/news/uk-20713380
Local authority areas drawn by population size

Creating your own maps
• Many options for creating thematic maps including…
• Create choropleth maps using GIS
• Thematic Mapper - http://thematic.edina.ac.uk/thematic/map
• Cartogrammar - http://cartogrammar.edina.ac.uk

CAS postcode sectors sized by 2001 population