Embed Size (px)
Citation preview

(Front and Back)
Hilda has collected several measurements and wants to record them in a double line graph.
If she will plot the masses along the vertical (�) axis, which of the following scales would be most appropriate for that axis?
(a) between 10 and 35 grams
(b) between 0 and 60 grams
(c) between 0 and 120 grams
(d) between 50 and 60 grams
Name ________________________________________ Done Together In Class
Creating Line Graphs
�

Which of the line graphs below correctly represents the data in the table for sales at McNally’s Shoe Store?
(A)
(B)
(C)
(D)
�
McNally’s Shoe Sales
May 50
June 55
July 50
August 45
September 59
October 50
(Front and Back)
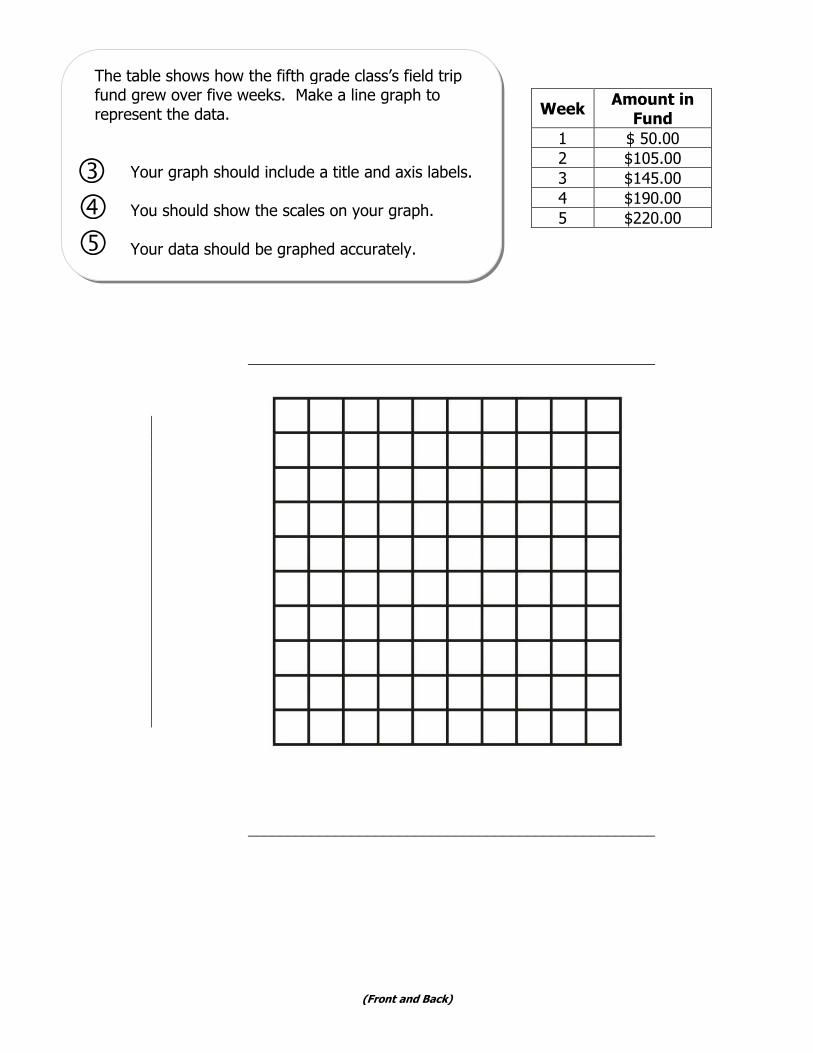
The table shows how the fifth grade class’s field trip fund grew over five weeks. Make a line graph to represent the data.
Your graph should include a title and axis labels.
You should show the scales on your graph. Your data should be graphed accurately.
_______________________________________
___________________________________________________
___________________________________________________
�
�
Week Amount in Fund
1 $ 50.00
2 $105.00
3 $145.00
4 $190.00
5 $220.00 �
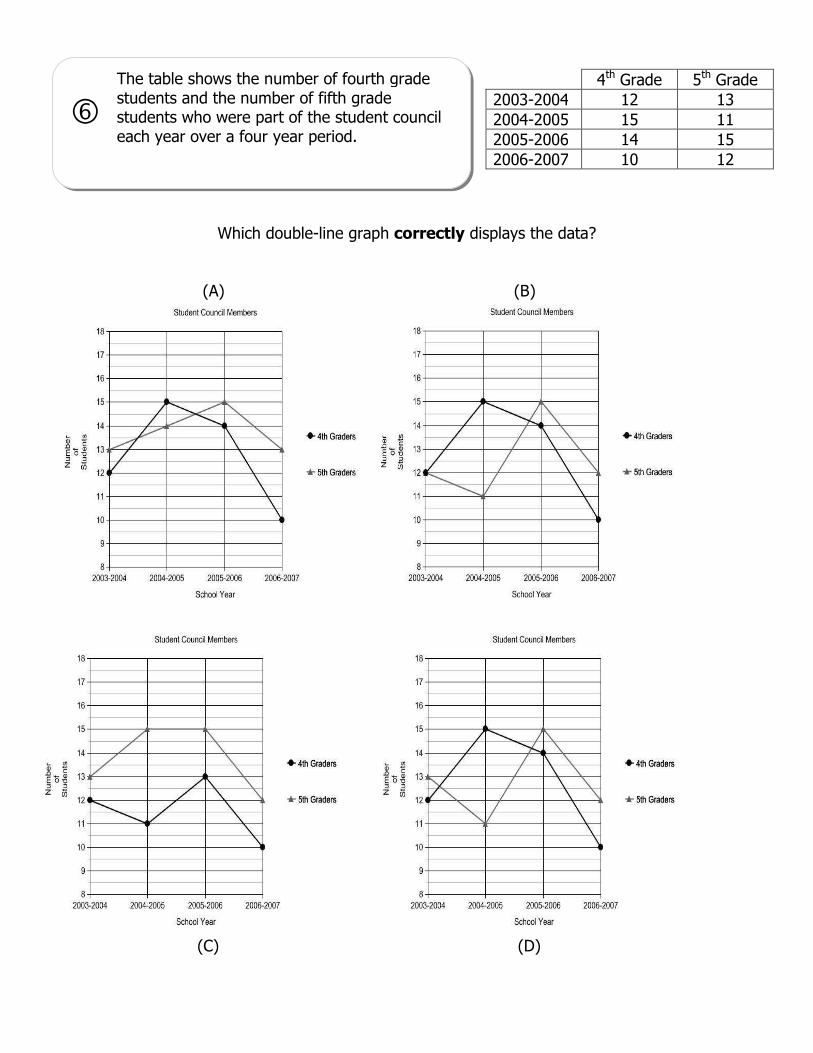
The table shows the number of fourth grade students and the number of fifth grade students who were part of the student council each year over a four year period.
�
Which double-line graph correctly displays the data?
(A) (B)
(C)
(D)
4th Grade 5th Grade
2003-2004 12 13
2004-2005 15 11
2005-2006 14 15
2006-2007 10 12

(Front and Back)
Paul and his brother Alex put part of their allowance in their savings account each month. The table shows how much money was in each boy’s account for four months.
Your graph should include a title and axis labels. You should show the scales on your graph. Your data should be graphed accurately.
_______________________________________
___________________________________________________
___________________________________________________
�
Paul Alex
January $10.00 $ 8.00
February $16.00 $18.00
March $22.00 $24.00
April $30.00 $28.00

The table below shows the percent of households with television sets over a period of years. The line graph was created to represent the data in the table.
Percent of Households with TV Sets
Year 1940 1950 1960 1970 1980 1990 2000
Percent of Total
Households 0 12 88 96 98 98 98
What error was made in creating the line graph? ________________________________________________________________
�
�

(Front and Back)
This table shows the number of bags of cat food and dog food sold each month at Pets-R-Us.
Which scale is the most reasonable to use on the vertical axis to make a double-line graph?
(a) 0-50 (b) 0-55 (c) 0-75 (d) 0-100
Name ________________________________________ Done With Partners
Creating Line Graphs
�

Roberta’s class keeps a record of the number of compliments they receive from other teachers throughout the week. The chart below is the data that was collected.
Number of Compliments Received This Week Day of The Week
Monday Tuesday Wednesday Thursday Friday
Number of Compliments
10 5 4 8 12
Roberta used the chart to make the following line graph, but unfortunately she made an error in her line graph.
What error was made in creating the line graph? _________________________________________________________________
�

(Front and Back)
Paula participated in a walk-a-thon in her neighborhood. She started at 9:00 am. Every 30 minutes, she stopped to take a drink of water and record her total distance. The table shows the total number of blocks she had walked each time she stopped. Make a line graph using the data in the table. Your graph should include a title and axis labels.
You should show the scales on your graph. Your data should be graphed accurately.
_______________________________________
___________________________________________________
___________________________________________________
�
�
�
TIME
Total Blocks Walked
9:00 am 0
9:30 am 25
10:00 am 40
10:30 am 55
11:00 am 65

The table to the right shows the number of victories that two professional baseball teams had over the last four
seasons.
�
Which double-line graph best displays the data?
(A) (B)
Victory Totals
Tigers Marlins
2009 86 87
2008 74 84
2007 88 71
2006 95 78

(Front and Back)
Two Mackinac Island boat companies, Arnold and Shepler, make 6 round trips to the island each day. Make a double-line graph to show the data in the table.
Your graph should include a title and axis labels. You should show the scales on your graph. Your data should be graphed accurately.
_______________________________________
___________________________________________________
___________________________________________________
�
(C) (D)
Trip Number
Passengers on Arnold
Passengers on Shepler
1 240 200
2 235 180
3 210 195
4 190 185
5 200 220
6 260 240

Pedro drives his car 70 miles per hour on the highway. The table below shows his data for a 6 hour ride at that speed. Which of the following graphs best represents Pedro’s data?
�
(A) (B)
(C) (D)
Hours Miles
1 70
2 140
3 210
4 280
5 350
6 420
(Front and Back)
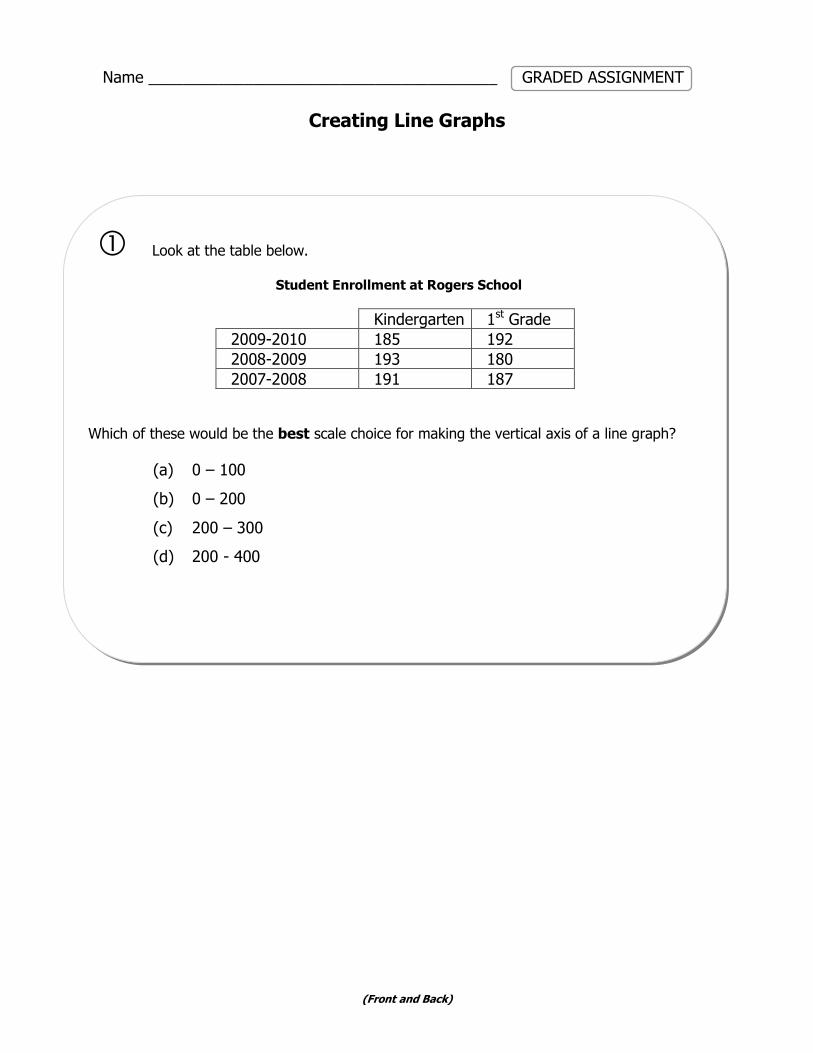
Look at the table below.
Student Enrollment at Rogers School
Kindergarten 1st Grade
2009-2010 185 192
2008-2009 193 180
2007-2008 191 187
Which of these would be the best scale choice for making the vertical axis of a line graph?
(a) 0 – 100
(b) 0 – 200
(c) 200 – 300
(d) 200 - 400
Name ________________________________________ GRADED ASSIGNMENT
Creating Line Graphs
�
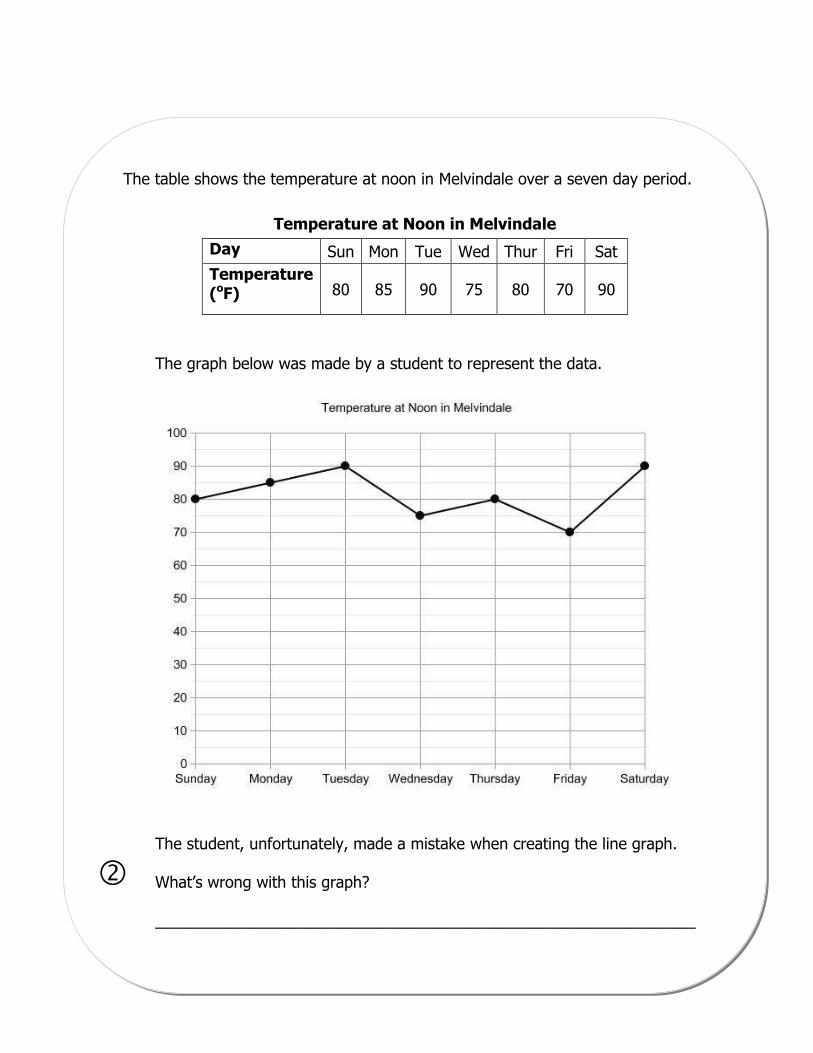
The table shows the temperature at noon in Melvindale over a seven day period.
Temperature at Noon in Melvindale
Day Sun Mon Tue Wed Thur Fri Sat
Temperature (oF) 80 85 90 75 80 70 90
The graph below was made by a student to represent the data.
The student, unfortunately, made a mistake when creating the line graph. What’s wrong with this graph? ______________________________________________________________
�

(Front and Back)
A scientist spent many years studying the height of a tree. The table at the right shows the height of the tree at different ages. Make a line graph to represent the data in the table. Your graph should include a title and axis labels.
You should show the scales on your graph. Your data should be graphed accurately.
_______________________________________
___________________________________________________
___________________________________________________
� �
�
Tree’s Age
(in years)
Tree’s Height (in feet)
2 10
4 50
6 80
8 95

The table at the right shows ticket sales for two different movies at the Allen Park Cinema.
�
Which double-line graph best displays the data?
(A) (B)
(C) (D)
Number of Tickets Sold
Comedy Action Movie
Week 1 400 375
Week 2 338 311
Week 3 302 380
Week 4 298 301
(Front and Back)
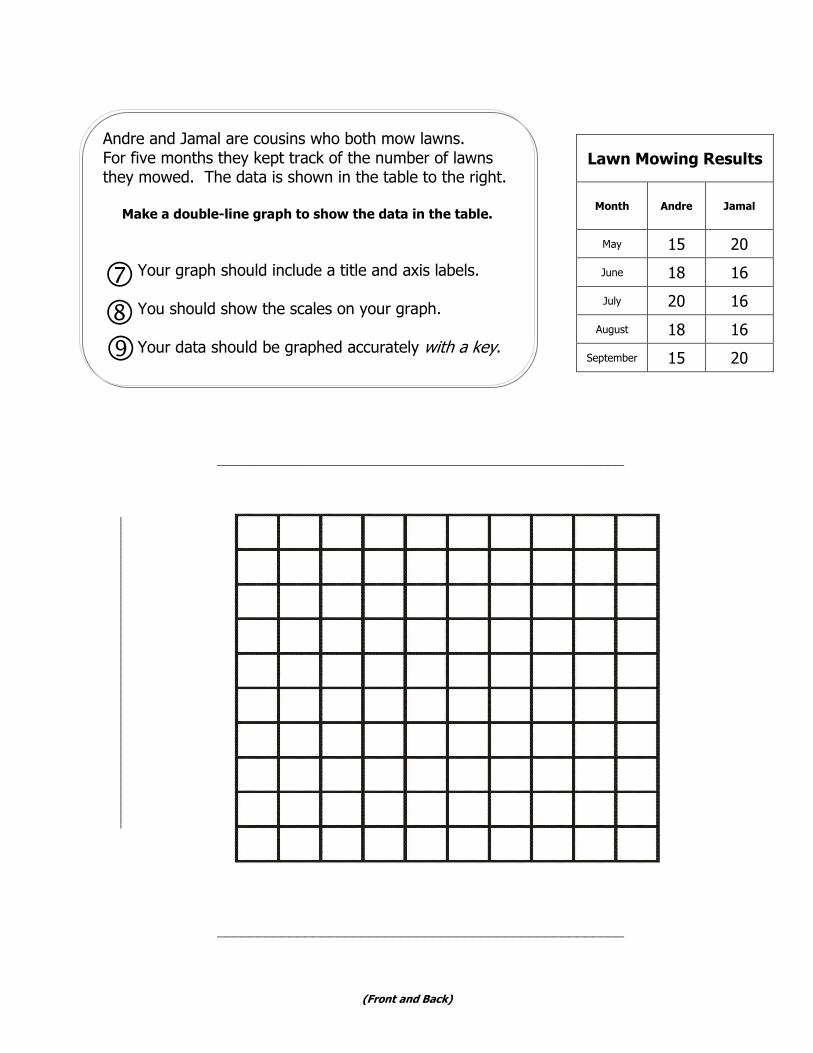
Andre and Jamal are cousins who both mow lawns. For five months they kept track of the number of lawns they mowed. The data is shown in the table to the right. Make a double-line graph to show the data in the table.
Your graph should include a title and axis labels. You should show the scales on your graph. Your data should be graphed accurately with a key.
_______________________________________
___________________________________________________
___________________________________________________
�
Lawn Mowing Results
Month Andre Jamal
May 15 20
June 18 16
July 20 16
August 18 16
September 15 20

A portion of Jason’s report card is shown in the chart at the right. He wants to turn this chart into a line graph.
Which of the following graphs best represents Jason’s data?
�
(A) (B)
(C) (D)
Card Marking
Math Grade
(%)
1st 76
2nd 83
3rd 87
4th 91

(Front and Back)
Name ________________________________________ Homework #1
Creating Line Graphs
Use the data in each table to complete the line graphs.
A vendor at the farmers’ market counted the number of bread loaves sold each day. Use the data in the table to complete the line graph.
An investor tracked the daily price of his favorite stock.
In trying to calculate how much money could be saved by packing lunch Enrique recorded the amount he spent on lunch each day.
Day
Day
Day
Loaves Sold
Amount Spent
Price
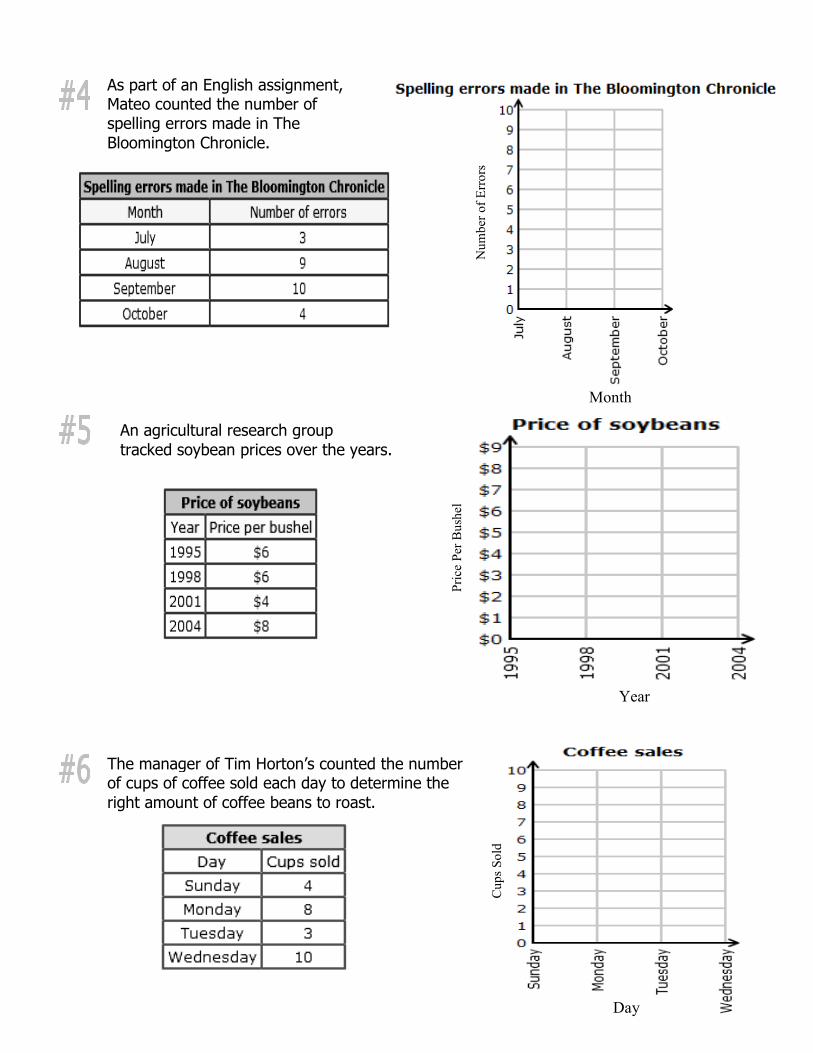
The manager of Tim Horton’s counted the number of cups of coffee sold each day to determine the
right amount of coffee beans to roast.
An agricultural research group
tracked soybean prices over the years.
As part of an English assignment, Mateo counted the number of spelling errors made in The
Bloomington Chronicle.
Month
Year
Day
Number of Errors
Price Per Bushel
Cups Sold
(Front and Back)
Name ________________________________________ Homework #2
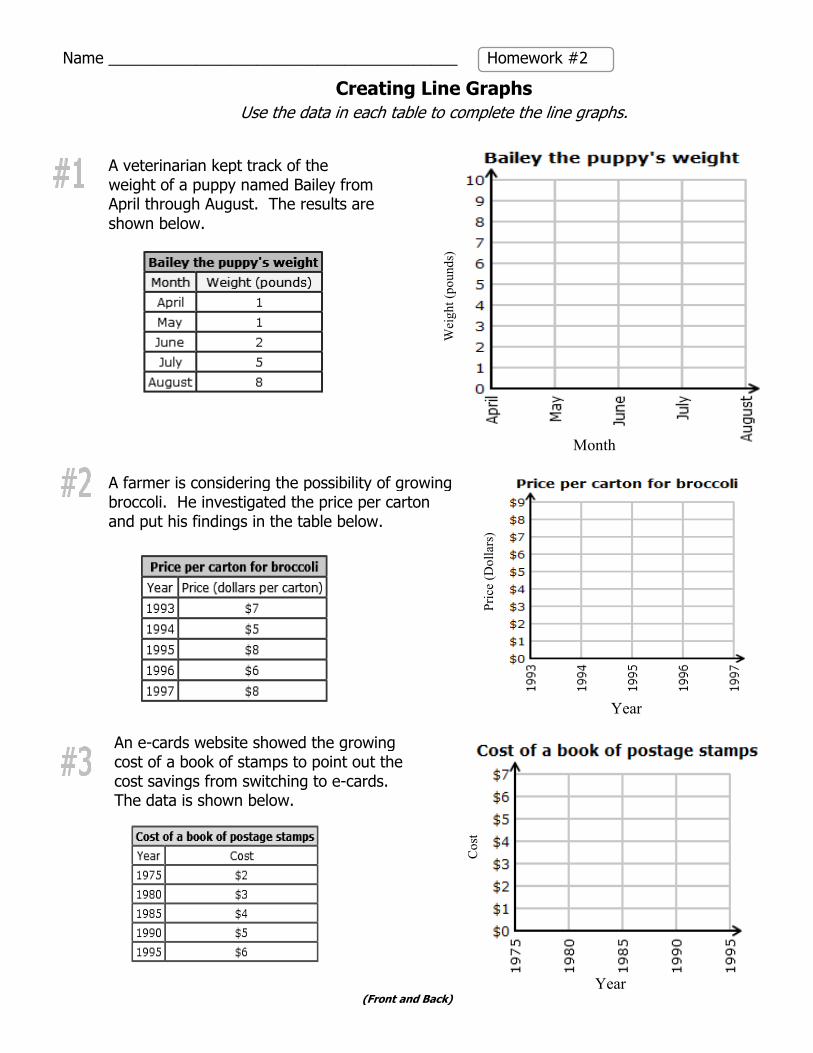
Creating Line Graphs
Use the data in each table to complete the line graphs.
A veterinarian kept track of the weight of a puppy named Bailey from April through August. The results are
shown below.
A farmer is considering the possibility of growing broccoli. He investigated the price per carton and put his findings in the table below.
An e-cards website showed the growing cost of a book of stamps to point out the cost savings from switching to e-cards. The data is shown below.
Month
Year
Year
Weight (pounds)
Price (Dollars)
Cost

A baseball fan monitored how many games were in the World Series each year from 2001
to 2005. The results are shown below.
Jackie, a doctor’s office receptionist, tracked the average wait time at the office each
month. The minutes are shown in the table.
Before scheduling a family vacation, the Moran family looked at the rainfall in Seattle
each month. Their findings are shown below.
Year
Month
Month
Number of Games
Waiting Time (minutes)
Rainfall (inches)

(Front and Back)
Name ________________________________________ Homework #3
Creating Line Graphs
Use the data in each table to complete the line graphs.
Stanley's parents kept track of the number of times the attendance office called to report that he had been late
for school.
Fans of the Hamilton baseball team compared the number of games won
by the team each year.
Terrence, a film student, kept track of the number of movies he watched
each month.
Year
Month
Month
Number of Tardies
Games Won
Movies Watched

Before deciding which variety of lettuce to grow, a farmer considered the price per
carton for Western head lettuce.
In a report about the history of the Olympics, Jacqueline reported the number of Olympic medals won by several countries, including Finland.
Leslie looked over her old calendars to figure out how many days of vacation she had taken each year.
Year
Year
Year
Price (dollars)
Number of Days
Number of Medals


![On Products and Line Graphs of Signed Graphs, their Eigenvalues and … · 2018-11-04 · arXiv:1010.3884v1 [math.CO] 19 Oct 2010 On Products and Line Graphs of Signed Graphs, their](https://img.dokumen.tips/doc/110x75/5f05ebb97e708231d41562b8/on-products-and-line-graphs-of-signed-graphs-their-eigenvalues-and-2018-11-04.jpg)