Embed Size (px)
Citation preview

Creating great
everyday experiences

Re-structuring
Accelerating innovation and growth
2016 -
2018
2012
2022
Consistently creating value to all stakeholders
2
2014
2019
Orientingfor growth
Digital Experience acceleration
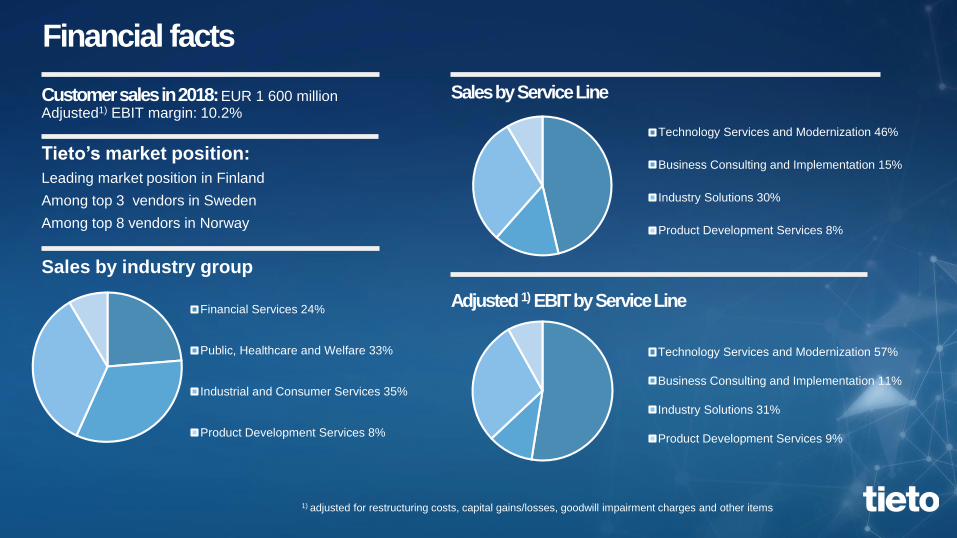
Financial Services 24%
Public, Healthcare and Welfare 33%
Industrial and Consumer Services 35%
Product Development Services 8%
Technology Services and Modernization 46%
Business Consulting and Implementation 15%
Industry Solutions 30%
Product Development Services 8%
Technology Services and Modernization 57%
Business Consulting and Implementation 11%
Industry Solutions 31%
Product Development Services 9%
Adjusted 1) EBIT by Service Line
Customer sales in 2018: EUR 1 600 millionAdjusted1) EBIT margin: 10.2%
Tieto’s market position:
Leading market position in Finland
Among top 3 vendors in Sweden
Among top 8 vendors in Norway
Sales by Service Line
Sales by industry group
1) adjusted for restructuring costs, capital gains/losses, goodwill impairment charges and other items
Financial facts

2018 as a continuation of our multi-year performance improvement
-5%
0%
5%
10%
15%
-100
-50
0
50
100
150
200
2014 2015 2016 2017 2018
EBIT, EUR million EBIT %
-6%
-4%
-2%
0%
2%
4%
-1000
-500
0
500
1000
1500
2000
2014 2015 2016 2017 2018
Net Sales, EUR million Growth %
2015 2016 2017 2018
2015 2016 2017 2018
CUSTOMER EXPERIENCE / NPS
EMPLOYEE ENGAGEMENT SCORE
REVENUE GROWTH, %
OPERATING MARGIN, %
0,0
0,2
0,4
0,6
0,8
1,0
1,2
1,4
1,6
2014 2015 2016 2017 2018
DIVIDEND/SHARE, EUR
Base dividend Additional dividend
-0,6
-0,4
-0,2
0,0
0,2
0,4
0,6
0,8
1,0
2014 2015 2016 2017 2018
NET DEBT / EBITDA

Market opportunity and
strategy 2019
5

Personalized
experiences
Data-driven value
Cross-industry
ecosystems
Agile and adaptive
TIME
VALUE
CREATIONTODAY
Omnichannel
Industry 4.0
Servitization
Realtime
payments
Predictive
healthcare
Smart cities
Sustainability
IoT
Digital
citizen
services
Connected
vehicles
Industry
clouds
Connected
consumer
products
Designed experiences and data-driven services
Agile business models, services and ways of working
Make my product / service better, faster and cheaper
Definite products, processes and technologies
Customer agenda for driving competitiveness
Changing industry paradigm with new data-driven experiences
and business models
6

Data at the core of innovation and value creation
Adaptenterprise
architecture
Data and insights
Design and experience
Renewapplications
Agile
Hybrid Infrastructure
Cloud first Connected products Agile
AI Ecosystems Platforms
Cyber security
ML/NLP/RPA
Automation
Microservices
Agile sprints
co-creating
business
outcomes for
customers
Active innovation agenda
in the market
Design and data led
Agility driving both
innovation and efficiency
Faster time to market
7

Services enabling
customers’
competitiveness
Networked ways
of working
and leadership
Context-rich
customer
engagement
Leading CX in the market
Most engaging workplace
Upgraded financial ambition
We aim to make customers more competitiveStrategy 2019 choices and ambition
8

Digital
Experience
Hybrid Infra
Industry
Software
Product
Development
Services
Enable new business models and
experiences for customers.
Capability uplift
Agile at scale
Ensure customer’s business continuity,
efficiency and unified service experience.
Multi-cloud and scale
Automation and quality
Drive customer’s business critical
processes and functions.
Common R&D practices
Expansion
Making customers products connected with
world-class engineering.
New industry segments
Global expansion
Services enabling customers’ competitivenessTieto Service portfolio
9

© Tieto Corporation
Key markets: Finland, Sweden and Norway
Building on strong global delivery capabilities and long term
off-shore development
Focus on Nordic enterprises and the public sector
Selective international expansion of Industry Software
Longer term ambition for broader Tieto expansion
in European markets
PDS continues to grow its global customer base -
focusing on software R&D
Global delivery capabilities:China, Czech, India and Poland
Nordic focus, serving customers globally – with a global Tieto team
10Employing 15 000+
experts globally Serving customers in over
90 countries world-wide
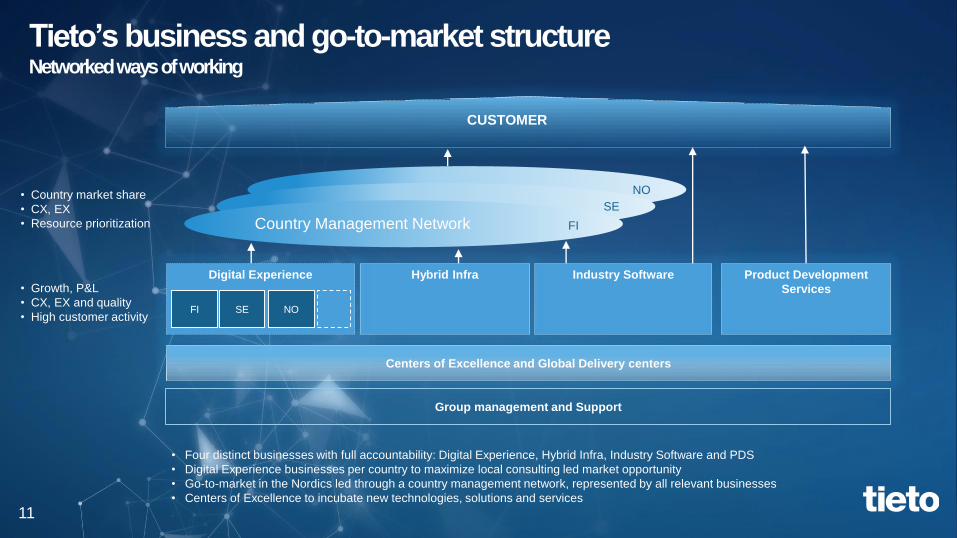
Country Management Network
Industry SoftwareHybrid Infra Product Development
Services
Digital Experience
CUSTOMER
• Country market share
• CX, EX
• Resource prioritization
• Growth, P&L
• CX, EX and quality
• High customer activity
FI
SE
NO
Group management and Support
Centers of Excellence and Global Delivery centers
• Four distinct businesses with full accountability: Digital Experience, Hybrid Infra, Industry Software and PDS
• Digital Experience businesses per country to maximize local consulting led market opportunity
• Go-to-market in the Nordics led through a country management network, represented by all relevant businesses
• Centers of Excellence to incubate new technologies, solutions and services
FI SE NO
Tieto’s business and go-to-market structureNetworked ways of working
11
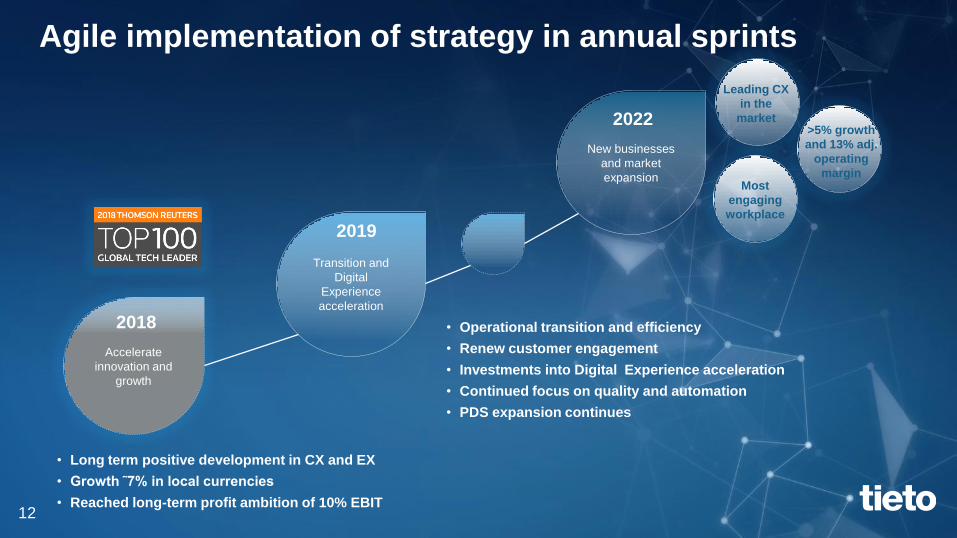
Agile implementation of strategy in annual sprints
• Operational transition and efficiency
• Renew customer engagement
• Investments into Digital Experience acceleration
• Continued focus on quality and automation
• PDS expansion continues
Transition and
Digital
Experience
acceleration
2019
New businesses
and market
expansion
2022
Accelerate
innovation and
growth
Leading CX
in the
market
Most
engaging
workplace
>5% growth
and 13% adj.
operating
margin
2018
• Long term positive development in CX and EX
• Growth ˜7% in local currencies
• Reached long-term profit ambition of 10% EBIT12

Value creation
13
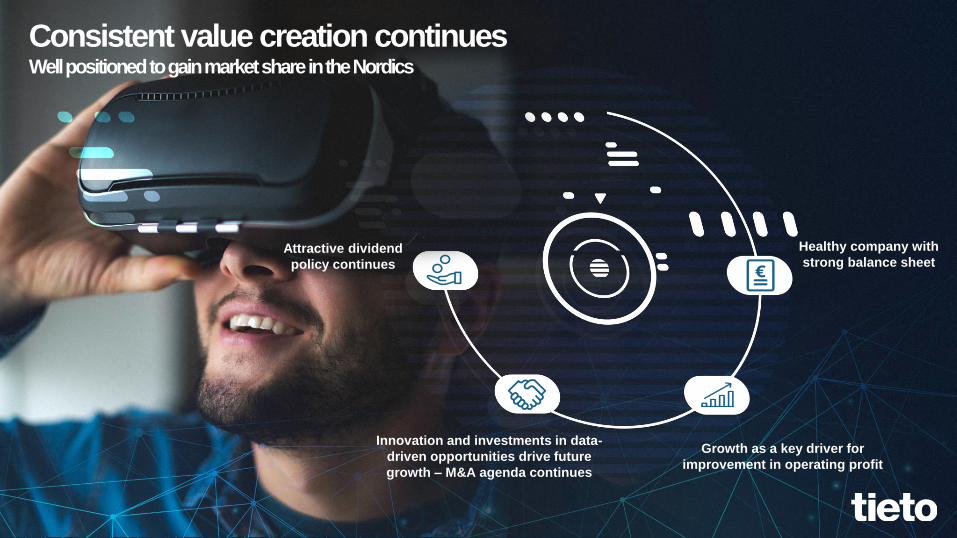
Consistent value creation continuesWell positioned to gain market share in the Nordics
Healthy company with
strong balance sheet
Innovation and investments in data-
driven opportunities drive future
growth – M&A agenda continues
Growth as a key driver for
improvement in operating profit
Attractive dividend
policy continues

Higher growth and profit ambitions while maintaining attractive dividend policy
Ambition 2022
Growth over 5% (CAGR 2019–2022)
Adjusted operating margin (EBIT) 13%1)
1) Adjusted for amortization of acquisition-related intangible assets, restructuring costs, capital
gains/losses, goodwill impairment charges and other items affecting comparability
In accordance with IFRS 16, taking effect on 1 Jan 2019 2) In accordance with IFRS 16, taking effect on 1 Jan 2019 – equals to around 1.5 prior to IFRS 16
Aim is to increase base dividend
annually in absolute terms
Net debt/EBITDA below 2.0
in the long term2)
• Temporarily may exceed 2.0 during the period
• CAPEX expected to remain below 4% of sales
• Strong cash flow driving attractive dividend profile
• Continued active M&A in addition to organic growth
• Main drivers include growth, simplified operations
and automation
15
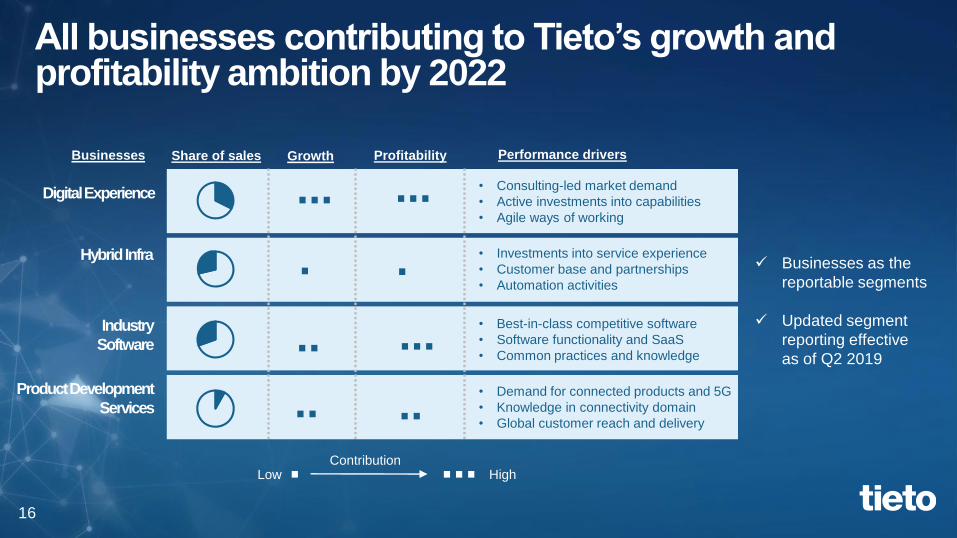
Profitability
Product Development
Services
Industry
Software
Hybrid Infra
Growth
Digital Experience• Consulting-led market demand
• Active investments into capabilities
• Agile ways of working
Share of sales
... ...
...
.
Performance drivers
..
..
..
.
All businesses contributing to Tieto’s growth and profitability ambition by 2022
• Investments into service experience
• Customer base and partnerships
• Automation activities
• Best-in-class competitive software
• Software functionality and SaaS
• Common practices and knowledge
• Demand for connected products and 5G
• Knowledge in connectivity domain
• Global customer reach and delivery
. ...ContributionLow High
✓ Businesses as the
reportable segments
✓ Updated segment
reporting effective
as of Q2 2019
Businesses
16

Investments focusing on accelerating digital capabilities and
software business expansion
Investment focus
• Accelerate digital capabilities e.g. Design, AI, Public cloud
• Incubate future technologies e.g. Blockchain
• Solution accelerators, data assets and platforms
• Ongoing renewals in Healthcare, Utilities and Payments
• Expand functionality to drive competitiveness
• Selective international expansion and SaaS models
• Infra service experience and multi-cloud orchestration
• Enable PDS customer base expansion
• Skill renewal and learning as a Lifestyle
Investment drivers
Total investment level
to be maintained at
˜5% of revenues
Digital Experience
Industry Software
Other
70-80% of
investments
17

Summary
• Strategy to make customers more competitive focusing on• Digital Experience
• Renewed customer engagement
• Simplified operations
• Digital Experience as the main growth driver, while all businesses expected to grow above market
• Investments to build data-driven services and capabilities - addition of 2500-3000 people during the
strategy period to drive growth
• Operational simplification potentially impacting ˜700 roles globally, resulting in annualized savings
of 30-35M€
• Upgraded financial ambition growth >5%, adjusted operating margin 13%, attractive dividend policy
maintained
• Gradual transition to the new structures during Q2’19
18

Q4, 2018 and
outlook for 2019
19

2018 key figures
Full-year net sales up by 4%› EUR 1 600 (1 543) million› Growth in local currency 7%› Organic growth in local currencies 4%
Full-year EBIT› EBIT EUR 154.7 (139.1) million, 9.7% (9.0%)› Adjusted1) EBIT EUR 162.8 (161.4) million, 10.2%
(10.5%)› Investments in offering development up by
EUR 6 million, of which EUR 3.6 million capitalized
› Currency impact EUR 8 million› Includes EUR 5.2 (4.3) million in amortization
of acquisition-related intangible assets
Dividend proposal› Proposed dividend EUR 1.45 per share
› Base dividend EUR 1.25 (1.20) › Additional dividend EUR 0.20 (0.20)
› Dividend yield 6.1%
3) Base dividend
2) Additional dividend
1,00 1,10 1,15 1,20 1,25
0,30 0,25 0,22 0,20 0,20
0,0
0,5
1,0
1,5
2014 2015 2016 2017 2018
Dividend/share, EUR
3)
2)
1) adjusted for restructuring costs, capital gains/losses,
goodwill impairment charges and other items
© Tieto Corporation
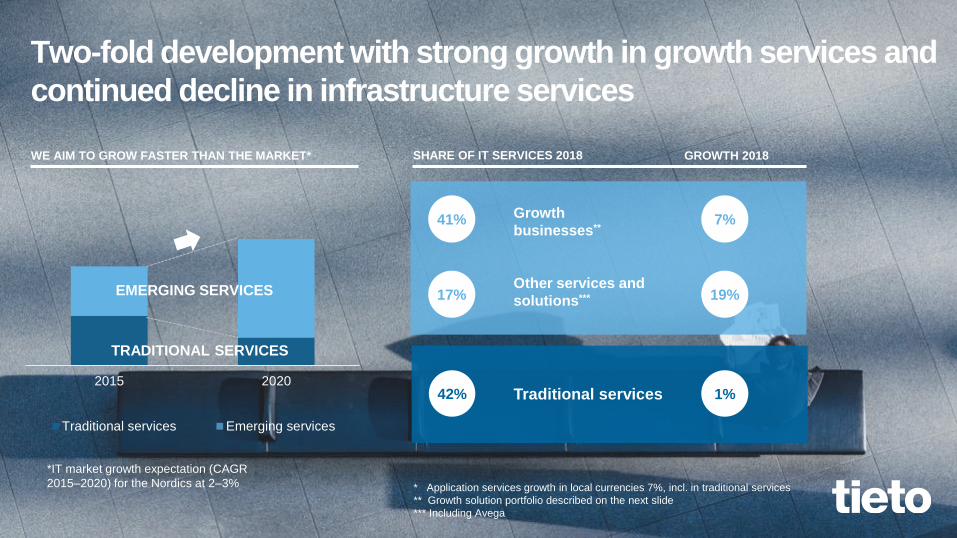
2015 2020
Traditional services Emerging services
Two-fold development with strong growth in growth services and
continued decline in infrastructure services
WE AIM TO GROW FASTER THAN THE MARKET*
*IT market growth expectation (CAGR
2015–2020) for the Nordics at 2–3%
SHARE OF IT SERVICES 2018
Growth
businesses**
Other services and
solutions***
Traditional services42%
GROWTH 2018
7%
19%
1%
* Application services growth in local currencies 7%, incl. in traditional services
** Growth solution portfolio described on the next slide
*** Including Avega
41%
17%EMERGING SERVICES
TRADITIONAL SERVICES

© Tieto Corporation
Selected industry solutions
Customer Experience
ManagementData-Driven Businesses Cloud services Security services
Investments supporting continuous renewal and growthUp by 7% in local currencies in 2018
+16% +15% +16%+120%
+3%
Lifecare
Payments
Credit solutions
Case management
Production excellence
SmartUtilities
Hydrocarbon
management

392 384 353 408 393 392 358 411
1 22
2 13 129
11
9,0 9,2
11,612,0
9,08,6
11,311,8
0
2
4
6
8
10
12
14
0
100
200
300
400
500
Q1/17 Q2/17 Q3/17 Q4/17 Q1/18 Q2/18 Q3/18 Q4/18
Net of divestment and acquisitions
Customer sales adjusted
Adjusted1) EBIT, %
Q4 2018 key figures
Net sales up by 3%› EUR 421.9 (409.6) million› Growth in local currencies 5%› Organic growth in local currencies 3%
EBIT margin 10.8% (11.7%)› EBIT EUR 45.7 (47.9) million› Adjusted1) EBIT EUR 49.8 (49.2) million,
11.8% (12.0%)› Includes EUR 1.2 (1.2) million in amortization of
acquisition-related intangible assets› EUR 1.9 million of offering development costs
capitalized
Order backlog EUR 1 698 (1 849) million› Negative currency impact› Order backlog provides support for the 2019
growth ambition› Book-to-bill 1.3 (1.3)
MEUR %
1) adjusted for restructuring costs, capital gains/losses,
goodwill impairment charges and other items

79,7
-6,110,8
66,6 61,5 12,3 18,7 81,7
-9,3-16,9
-9,1 -11,6 -8,2 -11,4 -8,7 -16,7
-25
-5
15
35
55
75
95
Q1/17 Q2/17 Q3/17 Q4/17 Q1/18 Q2/18 Q3/18 Q4/18
Net cash flow from operations and capital expenditure
Net cash from operations Capital expenditure
13822 13754 13851 14329 14581 14956 15109 15190
48,6 49,0 49,6 48,7 49,4 49,8 50,6 50,6
0
10
20
30
40
50
60
0
5000
10000
15000
20000
Q1/17 Q2/17 Q3/17 Q4/17 Q1/18 Q2/18 Q3/18 Q4/18
Number of full-time employees and offshore ratio
Number of personnel Offshore ratio
Quarterly development
Number of personnel up by a net amount of 861
Offshore ratio: IT services 48.2% (46.2%) PDS 71.5% (69.8%)
%
MEUR
Employees
MEUR
392 384 353 408 393 392 358 411
1 2 22 13 12 9
11
0100200300400500
Q1/17 Q2/17 Q3/17 Q4/17 Q1/18 Q2/18 Q3/18 Q4/18
Net sales
Net of divestment and acquisitionsCustomer sales adjusted
0,2
0,90,8 0,8
0,5
1,0 1,0
0,7
0
0,5
1
1,5
Q1/17 Q2/17 Q3/17 Q4/17 Q1/18 Q2/18 Q3/18 Q4/18
Net debt/EBITDA
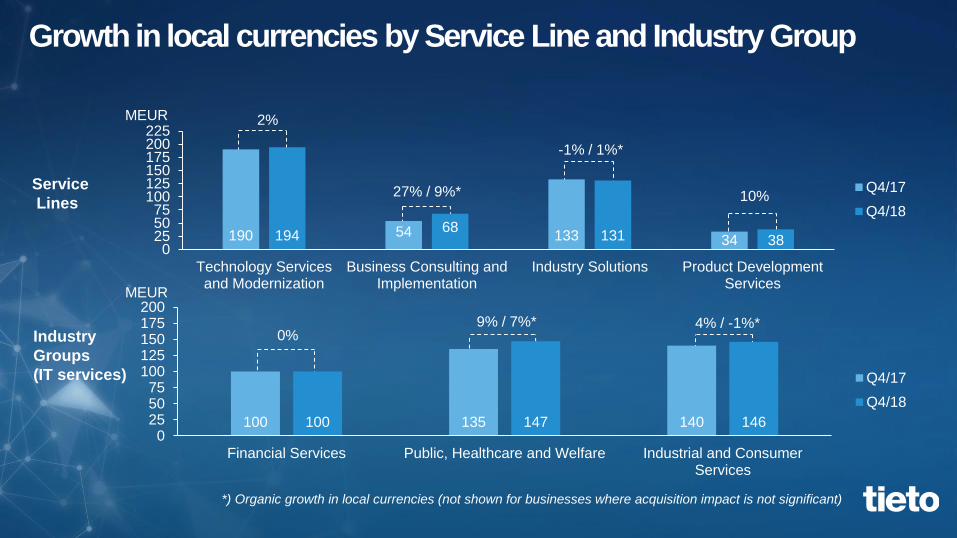
Growth in local currencies by Service Line and Industry Group
4% / -1%* 9% / 7%*0%
10%
-1% / 1%*
27% / 9%*
2%
Service
Lines
Industry
Groups
(IT services)
*) Organic growth in local currencies (not shown for businesses where acquisition impact is not significant)
MEUR
MEUR
100 135 140100 147 1460
255075
100125150175200
Financial Services Public, Healthcare and Welfare Industrial and ConsumerServices
Q4/17
Q4/18
190 54 133 3419468
131 380
255075
100125150175200225
Technology Servicesand Modernization
Business Consulting andImplementation
Industry Solutions Product DevelopmentServices
Q4/17
Q4/18

Service Lines
Technology Services and Modernization
Industry Solutions
Industrial and
Consumer ServicesPublic, Healthcare
and WelfareFinancial Services
Product Development Services
New
data-driven
businesses *)
*) Reported in Industry Solutions
Business Consulting and Implementation
Support Functions

Technology Services and Modernization
189 186 172 190 189 187 173 190
1110,4
11,7
13,512,8
11,012,3
13,813,0
0
2
4
6
8
10
12
14
16
0
50
100
150
200
250
Q1/17 Q2/17 Q3/17 Q4/17 Q1/18 Q2/18 Q3/18 Q4/18
%MEUR
Net of divestment and acquisitions
Customer sales adjusted
Adjusted1) EBIT, %
Customer sales in Q4› EUR 190 (190) million, growth at Q4 2017 level, or
+2% in local currencies
EBIT› Adjusted1) EBIT EUR 24.8 (24.3) million, 13.0%
(12.8)
Q4 highlights› Growth (in local currencies) driven by infrastructure
cloud and application services – up by 15% and 7% in full year, respectively
› Decline in traditional infrastructure services continued, down by 3% in full year
› Operating margin somewhat improved, mainly owing to good Application Services development
› Q1 adjusted operating margin is anticipated to be below Q1/2018 level, which was supported by the efficiency programme
1) adjusted for restructuring costs, capital gains/losses,
goodwill impairment charges and other items

Business Consulting and Implementation
Customer sales Q4› EUR 67 (54) million, +24%, or +27% in local currencies› Organic growth in local currencies +9%
EBIT› Adjusted1) EBIT EUR 5.5 (4.3) million, 8.2% (8.1)
Q4 highlights› Growth supported by the acquisition of Avega and
Meridium› Organic growth driven by CEM› Adjusted operating profit improved, mainly due to good
volume development and the acquisitions› Q1 adjusted operating margin is anticipated to be at or
above Q1/2018 level
1) adjusted for restructuring costs, capital gains/losses,
goodwill impairment charges and other items
51 49 42 54 49 52 44 57
13 12
8
99,2
7,78,2 8,1
8,79,8
2,8
8,2
0
2
4
6
8
10
12
0
10
20
30
40
50
60
70
Q1/17 Q2/17 Q3/17 Q4/17 Q1/18 Q2/18 Q3/18 Q4/18
%MEUR
Net of divestment and acquisitions
Customer sales adjusted
Adjusted1) EBIT, %

Industry Solutions
1) adjusted for restructuring costs, capital gains/losses,
goodwill impairment charges and other items
Customer sales Q4› EUR 129 (133) million, -3%, or -1% in local
currencies› Organic growth in local currencies 1%
EBIT› Adjusted1) EBIT EUR 20.4 (20.8) million, 15.8%
(15.7)
Q4 highlights› Strong growth in Hydrocarbon Management and
Payments solutions› Architectural renewal continued to affect
SmartUtilities› Lifecare growth somewhat affected by the reform in
the Finnish healthcare segment and the solution renewal
› Technology renewal continues in selected solutions
› Offering development costs up by EUR 3 million as planned
› EUR 1.9 million related to platform development capitalized
› Q1 adjusted operating margin expected to be close to Q1/2018 level
121 118 110 131 121 119 110 129
1 22
2
8,19,4
14,115,7
7,5
4,9
14,315,8
0
2
4
6
8
10
12
14
16
18
0
50
100
150
Q1/17Q2/17Q3/17Q4/17Q1/18Q2/18Q3/18Q4/18
%MEUR
Net of divestment and acquisitions
Customer sales adjusted
Adjusted1) EBIT, %

Product Development Services
Customer sales Q4› EUR 36 (34) million, +6%, or +10% in local
currencies
EBIT› Adjusted1) EBIT EUR 3.7 (3.5) million, 10.1%
(10.1)
Q4 highlights› Strong volume development with the largest key
customers and good development in automotive› EBIT margin remained at a healthy level while
improvement somewhat curbed by negative currency effects
› Q1 adjusted operating margin is anticipated to be below Q1/2018 level
32 31 29 34 34 34 32 36
13,4
8,07,2
10,1
12,7
8,79,9 10,1
0
2
4
6
8
10
12
14
16
0
5
10
15
20
25
30
35
40
Q1/17Q2/17Q3/17Q4/17Q1/18Q2/18Q3/18Q4/18
%MEUR
Net of divestment and acquisitions
Customer sales adjusted
Adjusted1) EBIT, %
1) adjusted for restructuring costs, capital gains/losses,
goodwill impairment charges and other items

Industry Groups
Business Consulting
& Implementation
Technology Services and Modernization
Industry Solutions
Product Development Services
New
data-driven
businesses *)
Public, Healthcare
and WelfareFinancial Services
Industrial and
Consumer Services
*) Reported in Industry Solutions
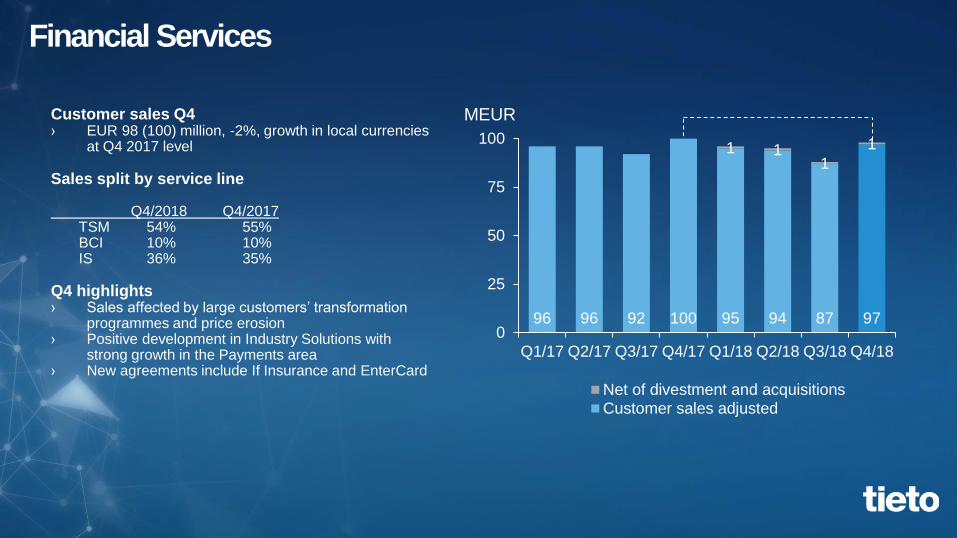
Financial Services
Customer sales Q4› EUR 98 (100) million, -2%, growth in local currencies
at Q4 2017 level
Sales split by service line
Q4/2018 Q4/2017TSM 54% 55%BCI 10% 10%IS 36% 35%
Q4 highlights› Sales affected by large customers’ transformation
programmes and price erosion› Positive development in Industry Solutions with
strong growth in the Payments area› New agreements include If Insurance and EnterCard
96 96 92 100 95 94 87 97
1 11
1
0
25
50
75
100
Q1/17 Q2/17 Q3/17 Q4/17 Q1/18 Q2/18 Q3/18 Q4/18
MEUR
Net of divestment and acquisitions
Customer sales adjusted
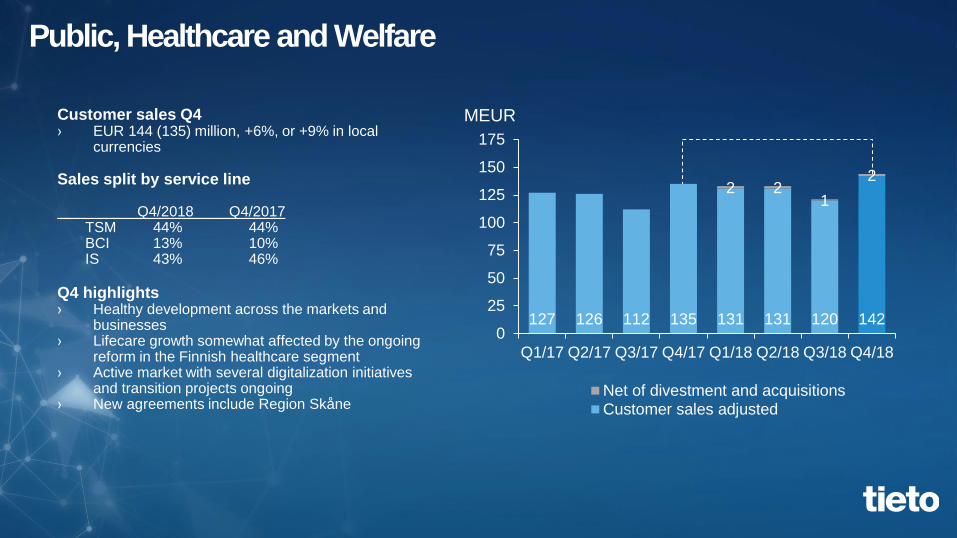
Public, Healthcare and Welfare
Customer sales Q4› EUR 144 (135) million, +6%, or +9% in local
currencies
Sales split by service line
Q4/2018 Q4/2017TSM 44% 44%BCI 13% 10%IS 43% 46%
Q4 highlights› Healthy development across the markets and
businesses› Lifecare growth somewhat affected by the ongoing
reform in the Finnish healthcare segment› Active market with several digitalization initiatives
and transition projects ongoing › New agreements include Region Skåne
127 126 112 135 131 131 120 142
2 21
2
0
25
50
75
100
125
150
175
Q1/17 Q2/17 Q3/17 Q4/17 Q1/18 Q2/18 Q3/18 Q4/18
MEUR
Net of divestment and acquisitionsCustomer sales adjusted

Industrial and Consumer Services
Customer sales Q4› EUR 144 (140) million, +3%, or +4% in local
currencies› Organic growth in local currencies -1%
Sales split by service line
Q4/2018 Q4/2017TSM 52% 54%BCI 26% 21%IS 22% 25%
Q4 highlights› Growth supported by the acquisition of Avega› Healthy growth especially in Hydrocarbon
Management whereas sales development in SmartUtilities negative due to the ongoing large-scale renewal
› New agreements include SSAB and Volvo Car Dealers
137 130 121 139 133 133 119 136
11
1
1 10 97
8
0
25
50
75
100
125
150
175
Q1/17 Q2/17 Q3/17 Q4/17 Q1/18 Q2/18 Q3/18 Q4/18
MEUR
Net of divestment and acquisitionsCustomer sales adjusted

Performance drivers in 2019
› Growth above the market
› Offering development costs around 5% of Group sales
› Efficiency and productivity improvement measures,
incl. automation, optimized subcontracting, offshoring,
management of competence pyramid
› Salary inflation over EUR 30 million
› New strategy to enhance competitiveness launched
› Operational simplification anticipated to affect
around 700 roles globally
› Annualized gross savings of EUR 30–35 million,
partially affecting performance in 2019

© Tieto Corporation
Guidance for 2019
› Tieto expects its full-year adjusted1)
operating profit (EBIT) to increase
from the previous year’s level
(EUR 168.0 million2) in 2018)
1) adjusted for amortization of acquisition-related intangible
assets, restructuring costs, capital gains/losses, goodwill
impairment charges and other items affecting comparability
2) not restated for IFRS 16

Appendix
© Tieto Corporation
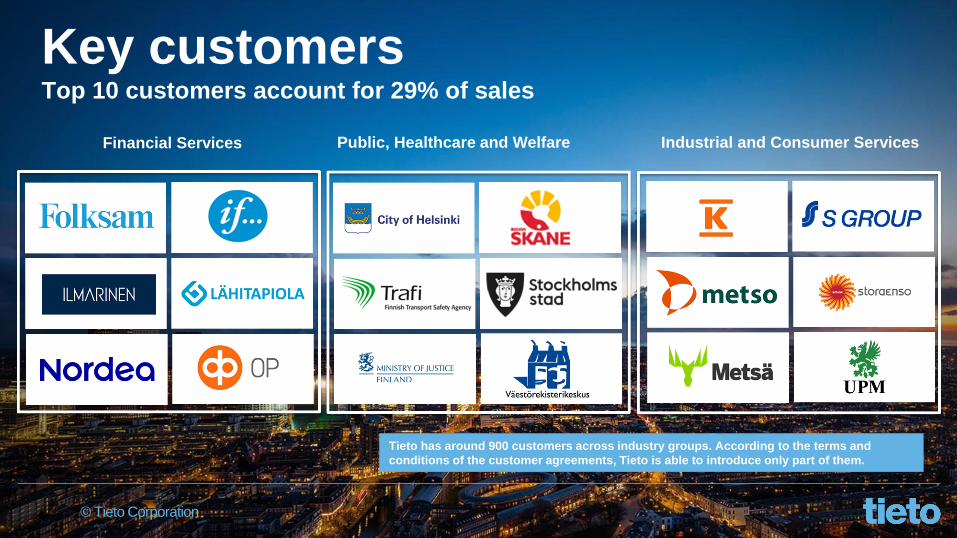
Key customersTop 10 customers account for 29% of sales
Financial Services Public, Healthcare and Welfare Industrial and Consumer Services
Tieto has around 900 customers across industry groups. According to the terms and
conditions of the customer agreements, Tieto is able to introduce only part of them.
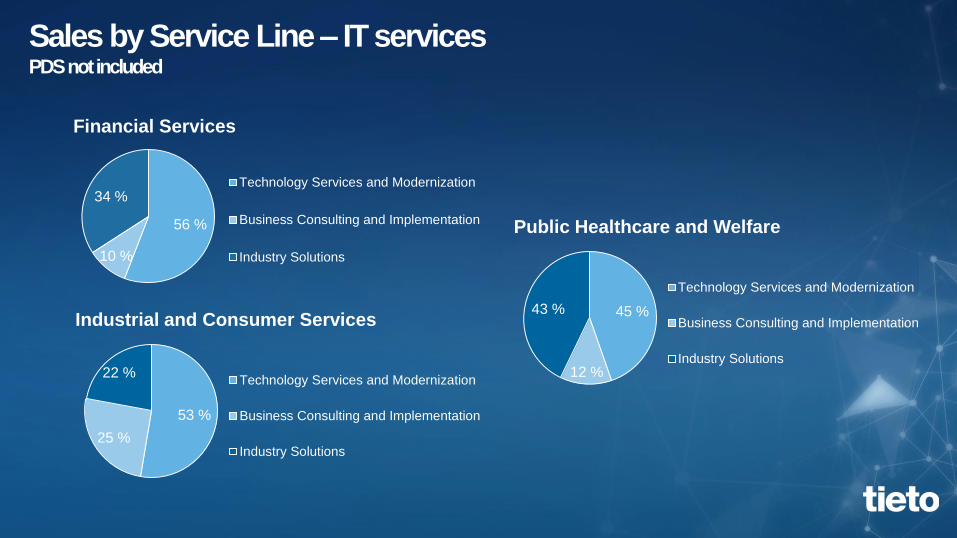
Sales by Service Line – IT services PDS not included
56 %
10 %
34 %
Financial Services
Technology Services and Modernization
Business Consulting and Implementation
Industry Solutions
45 %
12 %
43 %
Public Healthcare and Welfare
Technology Services and Modernization
Business Consulting and Implementation
Industry Solutions
53 %
25 %
22 %
Industrial and Consumer Services
Technology Services and Modernization
Business Consulting and Implementation
Industry Solutions

Sales by Industry Group – IT servicesPDS not included
29 %
32 %
39 %
Technology Services and Modernization
Financial Services
Public, Healthcare & Welfare
Industrial and Consumer Services
27 %
47 %
26 %
Industry Solutions
Financial Services
Public, Healthcare & Welfare
Industrial and Consumer Services
16 %
27 %57 %
Business Consulting and Implementation
Financial Services
Public, Healthcare & Welfare
Industrial and Consumer Services

Sales by Service Line
46 %
15 %
30 %
9 %Tieto
Technology Services and Modernization
Business Consulting and Implementation
Industry Solutions
Product Development Services39 %
17 %
28 %
16 %
Sweden
Technology Services and Modernization
Business Consulting and Implementation
Industry Solutions
Product Development Services
67 %
15 %
17 %1 %
Finland
Technology Services and Modernization
Business Consulting and Implementation
Industry Solutions
Product Development Services

Sales by Industry Group
24 %
33 %
35 %
8 %Tieto
Financial Services
Public Healthcare and Welfare
Industrial and Consumer Services
Product Development Services
25 %
35 %
39 %
1 %Finland
Financial Services
Public Healthcare and Welfare
Industrial and Consumer Services
Product Development Services
22 %
36 %
26 %
16 %
Sweden
Financial Services
Public Healthcare and Welfare
Industrial and Consumer Services
Product Development Services

All information in this material is for informational purposes only.
The opinions and viewpoints regarding, inter alia, the future of the
company and markets are of Tieto and may not actually materialize.
This information should not be construed as an investment recommendation or
investment advice. All information expressed herein is subject to change without
notice. Neither Tieto nor its officers nor employees shall have any liability for any loss
sustained by anyone who has relied on the information provided.