Embed Size (px)
Citation preview

CREATING AND EVALUATING STANDARDS OF RESPONSE COVERAGE FOR F IRE DEPARTMENTS ©
4 T H E D I T I O N
Commission on Fire Accreditation International, Inc. Chantilly, VA
Commission on Fire Accreditation International, Inc. 4500 Southgate Place, Suite 100, Chantilly, VA 20105
703.691.4620
www.cfainet.org
CFAI Front Matter_cx 10/17/03 12:59 AM Page 1

Public Entity Risk Institute
The Public Entity Risk Institute's mission is to serve public, private, and nonprofit organizations as a dynamic, forwardthinking resource for the practical enhancement of risk management. PERI pursues its mission by:
• Facilitating the development and delivery of education and training on all aspects of risk management, particularlyfor public entities, small nonprofit organizations, and small businesses.• Serving as a resource center and clearinghouse for risk management, environmental liability management, and dis-aster management information.• Operating an innovative, forward-looking grant and research program in risk management, environmental liabilitymanagement, and disaster management.
For complete information on PERI's programs and information services, visit our Web site at www.riskinstitute.org.
To access a wealth of risk management intelligence, please visit the Risk Management Resource Center, at www.erisk-center.org, a collaborative Web site operated by PERI, the Public Risk Management Association (PRIMA), and theNonprofit Risk Management Center (NRMC).
Public Entity Risk Institute11350 Random Hills Road, Suite 210Fairfax, VA 22030Phone: 703.352.1846FAX: 703.352.6339
Gerard J. HoetmerExecutive Director
Published with a grant from the Public Entity Risk Institute
CFAI Front Matter_cx 10/17/03 12:59 AM Page 2

ACKNOWLEDGMENTS
4th Edition adapted from:The IAFC Fire Service Accreditation Manual, First Edition - Standards of Response Cover Appendix
First Edition Contributors:Ronny J. Coleman, retired chief deputy director, Department of Forestry and Fire Protection
and the California State Fire MarshalRandy R. Bruegman, fire chief, Clackamas County Fire Protection District #1, Milwaukie, Ore.
Patrick Coughlin, prior director, Operation Life Safety - IAFC, Fairfax, Va.Charles Rule, retired fire chief, Manteca Fire Department, Calif.
Ray Picard, retired fire chief, Huntington Beach Fire Department, Calif. Chris Maxwell, division chief, Union City, Calif.
4th Edition Editors:Stewart Gary, fire chief, Livermore-Pleasanton Fire Department, Calif.
Ronny J. Coleman, chairman, CFAI Board of TrusteesConsiderable input was provided by others that have been working with the material,
teaching the classes or conducting research on the topic.
Additional 4th Edition contributions by:Gene Begnell, battalion chief, Orange County Fire Authority, Calif.
Rick Black, director of public safety, SOC Instructor, Southlake, TexasGeoff Cady, EMS consultant and author, Health Analytics LLC
Welling Clark, operations/research analyst, ICARE, Colorado Springs, Colo.Rob Carnahan, assistant chief, Clackamas County Fire District #1, Milwaukie, Ore.
Jeff Clet, fire chief, City of Gilroy, Calif.Russ Johnson, ESRI public safety manager
Paul La Sage, assistant chief, Tualatin Valley Fire and Rescue, Aloha, Ore.Lou LaVecchia, fire chief, Milford Fire Department, Milford, Conn.
Don Oliver, fire chief, Wilson Fire Department, Wilson, N.C.Martel Thompson, retired fire chief, CFAI Training and Education chairman, Henderson, Nev.
CFAI Front Matter_cx 10/17/03 12:59 AM Page 3

When the concepts contained in this text were originallycreated, the work was designed as an assignment to theaccreditation task force of the International Association ofFire Chiefs (IAFC) to look into methods of fire stationlocation. When the task force was then turned into acommission, the material was further enhanced by themembers of the various committees charged withresearching and improving upon the concept.
This material was originally included in the Commissionon Fire Accreditation International, Inc. accreditationmanual, Fire and Emergency Service Self-AssessmentManual, because this body of knowledge was not ade-quately explained in other contemporary fire servicetexts. It was noted in the original work that this concepthad been developed in other industrial nations, but thatit had never been widely accepted in the United States.One of the major issues the fire service has struggledwith in the past decades is defining levels of service.
In order for a self-assessment program to work, it wasessential to determine whether a fire agency was pre-pared to provide a level of service commensurate with itsresponsibilities and risks. The concept that evolved withthe development of this self-assessment model is amethodology to develop standards of response coverage.Standards of response coverage are defined as thosewritten procedures that determine the distribution andconcentration of fixed and mobile resources of an organ-ization. This text is the fourth edition of the material andhas now been produced as a freestanding document.
If creating a standards of coverage has been problematicin the past, a major issue the fire service will be strugglingwith in the next few decades is defining levels of serviceas communities grow and change over time. There havebeen many attempts to create a standard methodologyfor determining how many firefighters, fire stations or fireinspectors a community needs. However, the diversity offire service challenges in each community has defiedefforts to create a one-size-fits-all solution. Therefore it isnot surprising that national or state consensus has neverbeen reached. To address this situation, the InternationalCity/County Management Association (ICMA) and the
International Association of Fire Chiefs (IAFC) formed theCommission on Fire Accreditation International, Inc. (CFAI).
One requirement for a fire agency to receive accreditationis to prepare a standards of response cover plan duringthe self-assessment phase of accreditation. Standards ofresponse coverage are those written procedures deter-mining the distribution and concentration of fixed andmobile resources. This process includes reviewing com-munity expectations, setting response goals and estab-lishing a system of measuring performance. This planencompasses everything an agency should understandto prepare and determine resource deployment.
This process uses a systems approach to deploymentrather than a one-size-fits-all prescriptive formula. In acomprehensive approach, each agency should be ableto match local need (risks and expectations) with thecosts of various levels of service. In an informed publicpolicy debate, each city council or governing board “pur-chases” the fire and EMS protection (insurance) thecommunity needs and can afford.
If resources arrive too late or are under staffed, the emer-gency will continue to escalate—drawing more of theagency’s resources into a losing battle. What fire compa-nies must do, if they are to save lives and limit propertydamage, is arrive within a short period of time with ade-quate resources to do the job. To control a fire before ithas reached its maximum intensity requires geographicdispersion (distribution) of technical expertise and cost-effective clustering (concentration) of apparatus for max-imum effectiveness against the greatest number andtypes of risk. Matching arrival of resources with a specif-ic point of fire growth or medical problem severity is oneof the toughest challenges for chief fire officers today.
Some medical emergencies such as multiple car colli-sions or industrial accident rescues require speedy arrivalof multiple crews to control the scene, perform rescueoperations, and provide medical care. A high-risk arearequires timely arrival of fire companies for several rea-sons. More resources are required to rescue peopletrapped in a high-risk building with a high occupancy
INTRODUCTION
CFAI Front Matter_cx 10/17/03 12:59 AM Page 4

load than in a low-risk building with a low occupancyload. More resources are required to control fires in large,heavily loaded structures than are needed for fires insmall buildings with limited contents.
Most emergency medical incidents require the quickresponse of single fire crews to limit suffering and to rap-idly intervene in life-threatening emergencies. Small,incipient fires need the prompt response of a local firecompany to mitigate and terminate the emergencyquickly without additional help. For these typical, daily sit-uations, all areas of the city with similar hazards and risksshould receive equal service. This is why distributionplanning strives for equity and timely service objectives.
Therefore, creating a standards of response coverage planconsists of decisions made regarding distribution and con-centration of field resources in relation to the potentialdemand placed on them by the type of risk and historicalneed in the community. Furthermore, if a standards of coveris to be meaningful to the community, the outcomes mustdemonstrate that lives are saved and property is protected.
To clearly define standards of response coverage, agenciesshould have a policy statement (see appendix F) regard-ing how risks are categorized within the context of theirown jurisdiction. Because of the wide range of complexissues for which individual agencies are held accountable,it is necessary that there is a method for identifying risksand expected outcomes. Based upon that risk assessmentand anticipated workload, a standard of response cover-age is developed for fire fighting and EMS functions. It isrecognized within the fire service profession that this eval-uation must take into account both the frequency andseverity of the most common types of incidents.
The purpose of this manual is to provide a standardizedmethodology for the development, or review of a stan-dards of coverage plan based upon several factors, all ofwhich are essential in the design of an effective responseforce. Utilizing the standards of coverage concept mayhelp to define a more in-depth approach to requiredcrew and staffing needs, which takes into account notonly what would be required on the first arriving compa-ny, but also the additional companies necessary toensure an effective response force for fire suppression,emergency medical services and specialty response situ-ations such as hazardous materials incidents.
The element that must be considered in an overallassessment of fire delivery systems is the ability to pro-vide adequate resources for fire combat, EMS and spe-cialty response situations. In order to translate the effortsof a fire service agency into terms that the public andpolicy makers in the community can evaluate, the effortsmust be defined in expectations and outputs that can bedescribed, measured and benchmarked.
Each fire emergency requires a variable amount ofstaffing and water or fire stream application rates. This iscommonly called “fire flow.” Properly trained andequipped fire companies must arrive, be deployed, andattack the fire within specific time frames if specific fire-ground strategies and tactical objectives are to be met.Similarly, EMS or specialty incidents require a prescribedlevel of effort to achieve a given measurable outcome.
Given an objective to control a fire before it has reachedits maximum intensity requires a distribution ofresources and a cost-effective concentration of resourcesfor maximum effectiveness for the type of risks encoun-tered. A high-risk area could require a more timely con-centration of fire companies for several reasons. Moreresources are required for the possible rescue of personstrapped within a high-risk building with a high occupan-cy load than for a low-risk building with a low occupan-cy load. More resources are required to control fires inlarge, heavily loaded structures than are needed forsmall buildings with limited contents.
Therefore, creating a level of service frequently consists ofthe decisions made regarding the distribution and con-centration of resources in relation to the potential demandplaced upon them by the risk level in the community.
There are usually three reasons to redo or challengeexisting levels of service – expansion, contraction of serv-ice areas and change in risk expectations. Contraction istypically the result of a reduction in service area, adecline in risk or value, or a decline in available fire pro-tection funding. Regardless of the reasons, elected offi-cials should base changes in levels of service on empir-ical evidence and rational discussion leading to effective,informed policy choices. The purpose of the standards ofresponse coverage process is to prepare fire serviceleaders to conduct just such an analysis and then leadan informed policy discussion.
CFAI Front Matter_cx 10/17/03 12:59 AM Page 5

TABLE OF CONTENTS
Acknowledgements
Introduction
Chapter One – What does the term "Standard of Response Coverage” mean?History of fire station locations . . . . . . . . . . . . . . . . . . . . . . . . . . . . . . . . . . . . . . . . . . . . . . . . . . . . . . . . . . . . . . . . 1Influence of the Insurance Industry . . . . . . . . . . . . . . . . . . . . . . . . . . . . . . . . . . . . . . . . . . . . . . . . . . . . . . . . . . . . 1Role of Public Technology, Incorporated . . . . . . . . . . . . . . . . . . . . . . . . . . . . . . . . . . . . . . . . . . . . . . . . . . . . . . . . 2European Practices . . . . . . . . . . . . . . . . . . . . . . . . . . . . . . . . . . . . . . . . . . . . . . . . . . . . . . . . . . . . . . . . . . . . . . . . . . 2Role of International Association of Fire Chiefs . . . . . . . . . . . . . . . . . . . . . . . . . . . . . . . . . . . . . . . . . . . . . . . . . . . 2International City/County Management Association. . . . . . . . . . . . . . . . . . . . . . . . . . . . . . . . . . . . . . . . . . . . . . . 3Contemporary Method. . . . . . . . . . . . . . . . . . . . . . . . . . . . . . . . . . . . . . . . . . . . . . . . . . . . . . . . . . . . . . . . . . . . . . . 3Definitions and Overview of Terms . . . . . . . . . . . . . . . . . . . . . . . . . . . . . . . . . . . . . . . . . . . . . . . . . . . . . . . . . . . . 3Systems Thinking . . . . . . . . . . . . . . . . . . . . . . . . . . . . . . . . . . . . . . . . . . . . . . . . . . . . . . . . . . . . . . . . . . . . . . . . . . . 3Existing Deployment Policies . . . . . . . . . . . . . . . . . . . . . . . . . . . . . . . . . . . . . . . . . . . . . . . . . . . . . . . . . . . . . . . . . . 4Building Risk Identification and Assessment . . . . . . . . . . . . . . . . . . . . . . . . . . . . . . . . . . . . . . . . . . . . . . . . . . . . . 4Building Risk Assessment. . . . . . . . . . . . . . . . . . . . . . . . . . . . . . . . . . . . . . . . . . . . . . . . . . . . . . . . . . . . . . . . . . . . . 4Risk Expectations. . . . . . . . . . . . . . . . . . . . . . . . . . . . . . . . . . . . . . . . . . . . . . . . . . . . . . . . . . . . . . . . . . . . . . . . . . . . 5Service Level expectations . . . . . . . . . . . . . . . . . . . . . . . . . . . . . . . . . . . . . . . . . . . . . . . . . . . . . . . . . . . . . . . . . . . . 5Deployment measures. . . . . . . . . . . . . . . . . . . . . . . . . . . . . . . . . . . . . . . . . . . . . . . . . . . . . . . . . . . . . . . . . . . . . . . 5Performance and Reliability . . . . . . . . . . . . . . . . . . . . . . . . . . . . . . . . . . . . . . . . . . . . . . . . . . . . . . . . . . . . . . . . . . . 6Overall Evaluation . . . . . . . . . . . . . . . . . . . . . . . . . . . . . . . . . . . . . . . . . . . . . . . . . . . . . . . . . . . . . . . . . . . . . . . . . . . 7Stakeholder Participation and Expectations . . . . . . . . . . . . . . . . . . . . . . . . . . . . . . . . . . . . . . . . . . . . . . . . . . . . . . 7Summary . . . . . . . . . . . . . . . . . . . . . . . . . . . . . . . . . . . . . . . . . . . . . . . . . . . . . . . . . . . . . . . . . . . . . . . . . . . . . . . . . . 8
Chapter Two – The Concept of Risk ManagementRisk Analysis is Where to Start. . . . . . . . . . . . . . . . . . . . . . . . . . . . . . . . . . . . . . . . . . . . . . . . . . . . . . . . . . . . . . . . . 1Consequences . . . . . . . . . . . . . . . . . . . . . . . . . . . . . . . . . . . . . . . . . . . . . . . . . . . . . . . . . . . . . . . . . . . . . . . . . . . . . 1Building (Occupancy) Risk Assessment. . . . . . . . . . . . . . . . . . . . . . . . . . . . . . . . . . . . . . . . . . . . . . . . . . . . . . . . . 3Do We Plan for High Risk or Average Risk? . . . . . . . . . . . . . . . . . . . . . . . . . . . . . . . . . . . . . . . . . . . . . . . . . . . . . . 3RHAVE Materials and Methods . . . . . . . . . . . . . . . . . . . . . . . . . . . . . . . . . . . . . . . . . . . . . . . . . . . . . . . . . . . . . . . . 5RHAVE Results. . . . . . . . . . . . . . . . . . . . . . . . . . . . . . . . . . . . . . . . . . . . . . . . . . . . . . . . . . . . . . . . . . . . . . . . . . . . . . 5Use of Existing Databases . . . . . . . . . . . . . . . . . . . . . . . . . . . . . . . . . . . . . . . . . . . . . . . . . . . . . . . . . . . . . . . . . . . . 7Community Risk Matrix . . . . . . . . . . . . . . . . . . . . . . . . . . . . . . . . . . . . . . . . . . . . . . . . . . . . . . . . . . . . . . . . . . . . . . 7ISO Risk Layers . . . . . . . . . . . . . . . . . . . . . . . . . . . . . . . . . . . . . . . . . . . . . . . . . . . . . . . . . . . . . . . . . . . . . . . . . . . . . 8Risks by Typification . . . . . . . . . . . . . . . . . . . . . . . . . . . . . . . . . . . . . . . . . . . . . . . . . . . . . . . . . . . . . . . . . . . . . . . . . 8Emergency Medical Responses . . . . . . . . . . . . . . . . . . . . . . . . . . . . . . . . . . . . . . . . . . . . . . . . . . . . . . . . . . . . . . . 9EMS Risk Assessment . . . . . . . . . . . . . . . . . . . . . . . . . . . . . . . . . . . . . . . . . . . . . . . . . . . . . . . . . . . . . . . . . . . . . . . 9Wildland Risk Assessment . . . . . . . . . . . . . . . . . . . . . . . . . . . . . . . . . . . . . . . . . . . . . . . . . . . . . . . . . . . . . . . . . . . 11I-Zone Defensible Space . . . . . . . . . . . . . . . . . . . . . . . . . . . . . . . . . . . . . . . . . . . . . . . . . . . . . . . . . . . . . . . . . . . . 11I-Zone Enforcement/Education. . . . . . . . . . . . . . . . . . . . . . . . . . . . . . . . . . . . . . . . . . . . . . . . . . . . . . . . . . . . . . . 12I-Zone Hazard Assessment Process . . . . . . . . . . . . . . . . . . . . . . . . . . . . . . . . . . . . . . . . . . . . . . . . . . . . . . . . . . . 13Areas Without Hydrants . . . . . . . . . . . . . . . . . . . . . . . . . . . . . . . . . . . . . . . . . . . . . . . . . . . . . . . . . . . . . . . . . . . . . 14Abandoned Buildings . . . . . . . . . . . . . . . . . . . . . . . . . . . . . . . . . . . . . . . . . . . . . . . . . . . . . . . . . . . . . . . . . . . . . . . 14Mapping Risk. . . . . . . . . . . . . . . . . . . . . . . . . . . . . . . . . . . . . . . . . . . . . . . . . . . . . . . . . . . . . . . . . . . . . . . . . . . . . . 15Summary . . . . . . . . . . . . . . . . . . . . . . . . . . . . . . . . . . . . . . . . . . . . . . . . . . . . . . . . . . . . . . . . . . . . . . . . . . . . . . . . . 18
CFAI Front Matter_cx 10/17/03 12:59 AM Page 6

TABLE OF CONTENTS — c o n t i n u e d
Chapter Three – Use of Risk InformationOverview . . . . . . . . . . . . . . . . . . . . . . . . . . . . . . . . . . . . . . . . . . . . . . . . . . . . . . . . . . . . . . . . . . . . . . . . . . . . . . . . . . 1Staffing Configuration . . . . . . . . . . . . . . . . . . . . . . . . . . . . . . . . . . . . . . . . . . . . . . . . . . . . . . . . . . . . . . . . . . . . . . . . 1Community Size and Scope . . . . . . . . . . . . . . . . . . . . . . . . . . . . . . . . . . . . . . . . . . . . . . . . . . . . . . . . . . . . . . . . . . 3Community Expectation. . . . . . . . . . . . . . . . . . . . . . . . . . . . . . . . . . . . . . . . . . . . . . . . . . . . . . . . . . . . . . . . . . . . . . 4Sample Expectation Statements . . . . . . . . . . . . . . . . . . . . . . . . . . . . . . . . . . . . . . . . . . . . . . . . . . . . . . . . . . . . . . . 4EMS Expectations . . . . . . . . . . . . . . . . . . . . . . . . . . . . . . . . . . . . . . . . . . . . . . . . . . . . . . . . . . . . . . . . . . . . . . . . . . . 6Summary . . . . . . . . . . . . . . . . . . . . . . . . . . . . . . . . . . . . . . . . . . . . . . . . . . . . . . . . . . . . . . . . . . . . . . . . . . . . . . . . . . 6
Chapter Four – Desired OutcomesSetting Performance Measures . . . . . . . . . . . . . . . . . . . . . . . . . . . . . . . . . . . . . . . . . . . . . . . . . . . . . . . . . . . . . . . . 1The Relationship Between Fire Behavior and Response Time . . . . . . . . . . . . . . . . . . . . . . . . . . . . . . . . . . . . . . 1Dynamics of Fire Growth and Flashover . . . . . . . . . . . . . . . . . . . . . . . . . . . . . . . . . . . . . . . . . . . . . . . . . . . . . . . . 1Flashover . . . . . . . . . . . . . . . . . . . . . . . . . . . . . . . . . . . . . . . . . . . . . . . . . . . . . . . . . . . . . . . . . . . . . . . . . . . . . . . . . . 2Fire Behavior Factors. . . . . . . . . . . . . . . . . . . . . . . . . . . . . . . . . . . . . . . . . . . . . . . . . . . . . . . . . . . . . . . . . . . . . . . . . 2EMS Time Benchmarks and Expectations . . . . . . . . . . . . . . . . . . . . . . . . . . . . . . . . . . . . . . . . . . . . . . . . . . . . . . . 4Nontraditional EMS response . . . . . . . . . . . . . . . . . . . . . . . . . . . . . . . . . . . . . . . . . . . . . . . . . . . . . . . . . . . . . . . . . 8Public Access to Defibrillation Program . . . . . . . . . . . . . . . . . . . . . . . . . . . . . . . . . . . . . . . . . . . . . . . . . . . . . . . . . 8Overall Time and Performance Expectations. . . . . . . . . . . . . . . . . . . . . . . . . . . . . . . . . . . . . . . . . . . . . . . . . . . . . 9EMS Time Issues . . . . . . . . . . . . . . . . . . . . . . . . . . . . . . . . . . . . . . . . . . . . . . . . . . . . . . . . . . . . . . . . . . . . . . . . . . 10Emergency Scene Predictability . . . . . . . . . . . . . . . . . . . . . . . . . . . . . . . . . . . . . . . . . . . . . . . . . . . . . . . . . . . . . . 12Vehicle Accident—EMS Heavy Rescue . . . . . . . . . . . . . . . . . . . . . . . . . . . . . . . . . . . . . . . . . . . . . . . . . . . . . . . . . 18Secondary Support . . . . . . . . . . . . . . . . . . . . . . . . . . . . . . . . . . . . . . . . . . . . . . . . . . . . . . . . . . . . . . . . . . . . . . . . . 19Effective Response Force. . . . . . . . . . . . . . . . . . . . . . . . . . . . . . . . . . . . . . . . . . . . . . . . . . . . . . . . . . . . . . . . . . . . 19Integrated Time and Performance Objective Standards . . . . . . . . . . . . . . . . . . . . . . . . . . . . . . . . . . . . . . . . . . 20Structure Fire, Maximum Risk . . . . . . . . . . . . . . . . . . . . . . . . . . . . . . . . . . . . . . . . . . . . . . . . . . . . . . . . . . . . . . . . 20Structure Fire, Significant Risk . . . . . . . . . . . . . . . . . . . . . . . . . . . . . . . . . . . . . . . . . . . . . . . . . . . . . . . . . . . . . . . . 20Structure Fire, Moderate Risk . . . . . . . . . . . . . . . . . . . . . . . . . . . . . . . . . . . . . . . . . . . . . . . . . . . . . . . . . . . . . . . . 21Structure Fire, Low Risk . . . . . . . . . . . . . . . . . . . . . . . . . . . . . . . . . . . . . . . . . . . . . . . . . . . . . . . . . . . . . . . . . . . . . 21Wildland Interface Zone, Significant Risk . . . . . . . . . . . . . . . . . . . . . . . . . . . . . . . . . . . . . . . . . . . . . . . . . . . . . . . 21Target and Special Risks. . . . . . . . . . . . . . . . . . . . . . . . . . . . . . . . . . . . . . . . . . . . . . . . . . . . . . . . . . . . . . . . . . . . . 22Emergency Medical Service, Moderate Risk . . . . . . . . . . . . . . . . . . . . . . . . . . . . . . . . . . . . . . . . . . . . . . . . . . . . 22Summary . . . . . . . . . . . . . . . . . . . . . . . . . . . . . . . . . . . . . . . . . . . . . . . . . . . . . . . . . . . . . . . . . . . . . . . . . . . . . . . . . 22
Chapter Five – Defining the Elements of TimeThe importance of Time in Assessing Response . . . . . . . . . . . . . . . . . . . . . . . . . . . . . . . . . . . . . . . . . . . . . . . . . 1Cascade of Events – the response time continuum . . . . . . . . . . . . . . . . . . . . . . . . . . . . . . . . . . . . . . . . . . . . . . 1Time Measures . . . . . . . . . . . . . . . . . . . . . . . . . . . . . . . . . . . . . . . . . . . . . . . . . . . . . . . . . . . . . . . . . . . . . . . . . . . . . 1Time Points and the Cascade of Events . . . . . . . . . . . . . . . . . . . . . . . . . . . . . . . . . . . . . . . . . . . . . . . . . . . . . . . . 2Use of Time Information . . . . . . . . . . . . . . . . . . . . . . . . . . . . . . . . . . . . . . . . . . . . . . . . . . . . . . . . . . . . . . . . . . . . . 3Further Observation on Each Component . . . . . . . . . . . . . . . . . . . . . . . . . . . . . . . . . . . . . . . . . . . . . . . . . . . . . . 4Notification . . . . . . . . . . . . . . . . . . . . . . . . . . . . . . . . . . . . . . . . . . . . . . . . . . . . . . . . . . . . . . . . . . . . . . . . . . . . . . . . 7Turnout Time. . . . . . . . . . . . . . . . . . . . . . . . . . . . . . . . . . . . . . . . . . . . . . . . . . . . . . . . . . . . . . . . . . . . . . . . . . . . . . . 8Travel Time . . . . . . . . . . . . . . . . . . . . . . . . . . . . . . . . . . . . . . . . . . . . . . . . . . . . . . . . . . . . . . . . . . . . . . . . . . . . . . . . 8
CFAI Front Matter_cx 10/17/03 12:59 AM Page 7

Statistics that Relate to Time. . . . . . . . . . . . . . . . . . . . . . . . . . . . . . . . . . . . . . . . . . . . . . . . . . . . . . . . . . . . . . . . . 10Set-Up Time . . . . . . . . . . . . . . . . . . . . . . . . . . . . . . . . . . . . . . . . . . . . . . . . . . . . . . . . . . . . . . . . . . . . . . . . . . . . . . 13Summary. . . . . . . . . . . . . . . . . . . . . . . . . . . . . . . . . . . . . . . . . . . . . . . . . . . . . . . . . . . . . . . . . . . . . . . . . . . . . . . . . 15
Chapter Six – Deployment Capability MeasuresStation Location Study Tools . . . . . . . . . . . . . . . . . . . . . . . . . . . . . . . . . . . . . . . . . . . . . . . . . . . . . . . . . . . . . . . . . . 1Distribution. . . . . . . . . . . . . . . . . . . . . . . . . . . . . . . . . . . . . . . . . . . . . . . . . . . . . . . . . . . . . . . . . . . . . . . . . . . . . . . . . 2I-Zone Fire Fighting Resources for a Standard of Response Cover Plan . . . . . . . . . . . . . . . . . . . . . . . . . . . . . . 5Concentration . . . . . . . . . . . . . . . . . . . . . . . . . . . . . . . . . . . . . . . . . . . . . . . . . . . . . . . . . . . . . . . . . . . . . . . . . . . . . . 6Traffic Calming Measures . . . . . . . . . . . . . . . . . . . . . . . . . . . . . . . . . . . . . . . . . . . . . . . . . . . . . . . . . . . . . . . . . . . . . 8Trigger Point Thresholds . . . . . . . . . . . . . . . . . . . . . . . . . . . . . . . . . . . . . . . . . . . . . . . . . . . . . . . . . . . . . . . . . . . . . . 8Forecasting response Time Failure . . . . . . . . . . . . . . . . . . . . . . . . . . . . . . . . . . . . . . . . . . . . . . . . . . . . . . . . . . . . 12Equity in Mutual and/or Automatic Aid . . . . . . . . . . . . . . . . . . . . . . . . . . . . . . . . . . . . . . . . . . . . . . . . . . . . . . . . 15Summary . . . . . . . . . . . . . . . . . . . . . . . . . . . . . . . . . . . . . . . . . . . . . . . . . . . . . . . . . . . . . . . . . . . . . . . . . . . . . . . . . 18
Chapter Seven – Performance Measurements Using StatisticsFire Reporting Versus Performance Reporting. . . . . . . . . . . . . . . . . . . . . . . . . . . . . . . . . . . . . . . . . . . . . . . . . . . . 1Validity of Measures . . . . . . . . . . . . . . . . . . . . . . . . . . . . . . . . . . . . . . . . . . . . . . . . . . . . . . . . . . . . . . . . . . . . . . . . . 1Performance Standards—What Do They Really Mean? . . . . . . . . . . . . . . . . . . . . . . . . . . . . . . . . . . . . . . . . . . . . 1Fractile Measurements . . . . . . . . . . . . . . . . . . . . . . . . . . . . . . . . . . . . . . . . . . . . . . . . . . . . . . . . . . . . . . . . . . . . . . . 1Averages. . . . . . . . . . . . . . . . . . . . . . . . . . . . . . . . . . . . . . . . . . . . . . . . . . . . . . . . . . . . . . . . . . . . . . . . . . . . . . . . . . . 2Fractiles. . . . . . . . . . . . . . . . . . . . . . . . . . . . . . . . . . . . . . . . . . . . . . . . . . . . . . . . . . . . . . . . . . . . . . . . . . . . . . . . . . . . 3Measurements of Data and Central Tendency . . . . . . . . . . . . . . . . . . . . . . . . . . . . . . . . . . . . . . . . . . . . . . . . . . . 3Standard Deviation . . . . . . . . . . . . . . . . . . . . . . . . . . . . . . . . . . . . . . . . . . . . . . . . . . . . . . . . . . . . . . . . . . . . . . . . . . 4What Does It All Mean? . . . . . . . . . . . . . . . . . . . . . . . . . . . . . . . . . . . . . . . . . . . . . . . . . . . . . . . . . . . . . . . . . . . . . . 5Summary . . . . . . . . . . . . . . . . . . . . . . . . . . . . . . . . . . . . . . . . . . . . . . . . . . . . . . . . . . . . . . . . . . . . . . . . . . . . . . . . . . 5
Chapter Eight – Historical Deployment PerformanceOverview . . . . . . . . . . . . . . . . . . . . . . . . . . . . . . . . . . . . . . . . . . . . . . . . . . . . . . . . . . . . . . . . . . . . . . . . . . . . . . . . . . 1Use of Response Time Data . . . . . . . . . . . . . . . . . . . . . . . . . . . . . . . . . . . . . . . . . . . . . . . . . . . . . . . . . . . . . . . . . . 1Some Key Points to Keep in Mind . . . . . . . . . . . . . . . . . . . . . . . . . . . . . . . . . . . . . . . . . . . . . . . . . . . . . . . . . . . . . 1Data Analysis . . . . . . . . . . . . . . . . . . . . . . . . . . . . . . . . . . . . . . . . . . . . . . . . . . . . . . . . . . . . . . . . . . . . . . . . . . . . . . . 2Data Analysis Steps. . . . . . . . . . . . . . . . . . . . . . . . . . . . . . . . . . . . . . . . . . . . . . . . . . . . . . . . . . . . . . . . . . . . . . . . . . 5First Arrival Workload. . . . . . . . . . . . . . . . . . . . . . . . . . . . . . . . . . . . . . . . . . . . . . . . . . . . . . . . . . . . . . . . . . . . . . . . . 5Regression Analysis. . . . . . . . . . . . . . . . . . . . . . . . . . . . . . . . . . . . . . . . . . . . . . . . . . . . . . . . . . . . . . . . . . . . . . . . . . 8Evaluating First Arrival Response Reliability . . . . . . . . . . . . . . . . . . . . . . . . . . . . . . . . . . . . . . . . . . . . . . . . . . . . . 13Evaluating First Arrival Response (Out-of-Area Reliability) . . . . . . . . . . . . . . . . . . . . . . . . . . . . . . . . . . . . . . . . . 15Evaluating Effective Response Force Reliability . . . . . . . . . . . . . . . . . . . . . . . . . . . . . . . . . . . . . . . . . . . . . . . . . . 15Evaluating Structure Fire Reliability Because of High Call Volume . . . . . . . . . . . . . . . . . . . . . . . . . . . . . . . . . . 16Evaluating Response Times. . . . . . . . . . . . . . . . . . . . . . . . . . . . . . . . . . . . . . . . . . . . . . . . . . . . . . . . . . . . . . . . . . 16Evaluate First Responders Ability to Respond in Own Area . . . . . . . . . . . . . . . . . . . . . . . . . . . . . . . . . . . . . . . 17Evaluate Second Responder Ability to Fill in for Missing First Responder . . . . . . . . . . . . . . . . . . . . . . . . . . . . 17Evaluate Ability to Assemble Effective Response Force . . . . . . . . . . . . . . . . . . . . . . . . . . . . . . . . . . . . . . . . . . . 18Evaluate Apparatus Deployment . . . . . . . . . . . . . . . . . . . . . . . . . . . . . . . . . . . . . . . . . . . . . . . . . . . . . . . . . . . . . 19Summary . . . . . . . . . . . . . . . . . . . . . . . . . . . . . . . . . . . . . . . . . . . . . . . . . . . . . . . . . . . . . . . . . . . . . . . . . . . . . . . . . 22
TABLE OF CONTENTS — c o n t i n u e d
CFAI Front Matter_cx 10/17/03 12:59 AM Page 8

Chapter Nine – Evaluating Standards of Response CoverageIntegrating, Reporting, and Policy Decisions . . . . . . . . . . . . . . . . . . . . . . . . . . . . . . . . . . . . . . . . . . . . . . . . . . . . . 1Periodic review of Existing Standards of Cover Policies . . . . . . . . . . . . . . . . . . . . . . . . . . . . . . . . . . . . . . . . . . . . 2Use of GIS to Identify Specific Areas of Concern . . . . . . . . . . . . . . . . . . . . . . . . . . . . . . . . . . . . . . . . . . . . . . . . . 5Equivalency and Comparability . . . . . . . . . . . . . . . . . . . . . . . . . . . . . . . . . . . . . . . . . . . . . . . . . . . . . . . . . . . . . . . . 6Adoption by the Authority Having Jurisdiction . . . . . . . . . . . . . . . . . . . . . . . . . . . . . . . . . . . . . . . . . . . . . . . . . . . 6Summary . . . . . . . . . . . . . . . . . . . . . . . . . . . . . . . . . . . . . . . . . . . . . . . . . . . . . . . . . . . . . . . . . . . . . . . . . . . . . . . . . . 7
Appendix A: A Systems Approach to Staffing and Program Focus
Appendix B: Commission on Fire Accreditation, International Template
Appendix C: Staff Reports
Appendix D: Geographic Information Systems—A Powerful New Tool for Fire and Emergency Services
Appendix E: Computer Mapping Based Move-Up of Fire Resources During Disasters
Appendix F: Downers Grove Fire Department
Appendix G: Sample Resolution
Bibliography
TABLE OF CONTENTS — c o n t i n u e d
CFAI Front Matter_cx 10/17/03 12:59 AM Page 9

CFAI Front Matter_cx 10/17/03 12:59 AM Page 10

© 2 0 0 3 C O M M I S S I O N O N F I R E A C C R E D I T A T I O N I N T E R N A T I O N A L , I N C . C H A P T E R O N E • 1
CHAPTER ONE
WHAT DOES THE TERM “STANDARDS OF RESPONSE COVERAGE” MEAN?
History In the early days of the fire service there was not much reason to talk about response time. In the days of hose cartsand bucket brigades, fire stations were based more on the limitations of the fire truck and the means used of haul-ing the heavy equipment over distances. With hand-operated equipment, the distance was obviously limited. Whenthe steam engine came into service, horses were used to pull the equipment from the station to the scene. In areaswhere full-time departments were created, generally in the large communities, the placement of fire stations becamea public policy decision process. This was the first instance where time and distance were really given considerationin selecting the locations for stations. This required that fire stations be placed using some type of criteria. When theinternal combustion engine replaced the fire horse, the assessment continued.
Beginning around 1850, with the creation of full-time fire departments, fire stations were originally staffed according tothe existence of the earlier stations, which were essentially based upon neighborhoods and the location of volunteers.When new stations were required, one of the very first criterion to be applied was the idea that multiple fire stationsneeded to be spaced sufficiently far apart so that the overall community was covered, and yet close enough togetherto be able to support one another. Because this criterion was based upon the use of horses to haul the equipment, itwas natural to look to the capacity of these horse teams to arrive at an emergency in a relatively short time. Whether itwas by intent or by accident the numbers that were arrived at were fairly easy to understand: how far could a goodteam of fire horses haul a steamer in five minutes? At a gallop, horses pulled steamers about 1.5 miles in five minutes.
This practice was discussed in the fire literature at the time and was a widely accepted practice. For more than 40years the method of choice for responding was to continue to use horses. The fire service adopted automotive fireapparatus to replace the horses once the technology had been proven to be reliable. However, the transition was notshort, nor was it universal. There were many fire departments that operated horse-drawn apparatus for 25 years afterthe introduction of internal combustion engines. Therefore, the existing prevailing practice of site planning for fire sta-tions was based upon the common practice of the 1.5-mile radius as a rule of thumb. In fact, the practice was alsoinstitutionalized by fire agencies that continued to use the criterion in spite of upgrades of roadways and traffic circu-lation systems. While the authors of this text have not been able to identify any specific fire station location studies atthe turn of the century, there is evidence that as cities and towns grew, the 1.5-mile rule of thumb was applied.
Influence of the Insurance Industry With the creation of the fire grading system by the National Board of Fire Underwriters, the fire service was almostimmediately affected by that group’s establishment of an evaluation system that was somewhat based upon scienceand somewhat based on past practices. For example, the work that was done to create fire stream hydraulics wasbased upon very specific studies and considerable data. The fire flow figures that were developed for the various con-struction types were based upon studying actual fire losses. The data was not as scientifically verifiable, but it was sys-tematic. The grading schedule was designed to prevent urban conflagration, not to serve the day-to-day activities of afire agency. Among the concepts incorporated into this system was the assumption that the 1.5 mile fire station radiuswas appropriate for use in that context.
There is very little literature describing fire station siting studies from the early 1920s until the 1960s. At that time therewas an interest in the question of how to site and staff fire stations in the heavily urbanized and highly impacted fire
CFAI Chapter 1 10/17/03 2:18 AM Page 1

C H A P T E R O N E • 2 © 2 0 0 3 C O M M I S S I O N O N F I R E A C C R E D I T A T I O N I N T E R N A T I O N A L , I N C .
service agencies. Beginning in 1968, the Rand Institute developed a research project that began to study all of the vari-ables of fire station response. This included a review of the factors of both time and distance. The Rand studies werecomplex and difficult for local government or fire service personnel to fully understand. There was academic interestexpressed in these studies, but they had little impact either on the operational fire service or on the insurance industry.
One group that did pay attention to this research was the International City/County Management Association (ICMA).As a result of a series of exchanges between the organization and the insurance industry, there was a concernexpressed that the insurance industry’s criteria were antiquated and not consistent with contemporary issues facingthe fire service. Several documents were produced challenging the assumptions of the insurance industry relative tofire station locations and methodologies. These are listed in the bibliography.
Role of Public Technology, Incorporated. As a result of that activity an organization called Public Technology, Incorporated, (PTI), under the guidance of CostisToregas, developed a fire station location package that was based upon actual road networks. The project was loose-ly based upon the Rand studies methodology. It was first made available to local governments in 1971. This systemused a series of “links and nodes” to analyze the actual roadbed. The system required a fair amount of computingpower, which was not readily available at the time. Nonetheless, many communities subscribed to this service andconducted studies.
European PracticesWhen the Commission on Fire Accreditation International Inc. (CFAI) began its research into the concept of having astandardized model for reviewing fire department deployment, it discovered that this concept has been in practice inmany European fire departments since the end of World War II. With correspondence and interaction with fire offi-cials on an international basis, this methodology was adapted to meet the unique features of the American fire serv-ice. References to these studies are included in the bibliography.
Fire station location in other parts of the industrial world developed under slightly different conditions. In Europe, as aresult of more national involvement of the provision of fire services, especially in the aftermath of World War II, therewas a desire to set some standards. Right after World War II, the British fire service adopted a concept called “Standardsof Response Coverage.” Between 1950 and the early 1980s, the British fire service adopted a series of standards thatdealt with a wide variety of conditions ranging from rural to urban settings. These are outlined in the bibliography.
Role of International Association of Fire ChiefsIn 1985 Fire Chiefs Charlie Rule, Tom Hawkins and Warren Isman and IAFC Executive Director Garry Briese attendeda meeting with the general manager of the International City/County Management Association, Mr. Bill Hansell. Thetopic was creation of a better method to evaluate a fire department than to rely entirely upon existing ISO gradingschedule components. In 1986, the International Association of Fire Chiefs began the development of the conceptof fire department self-assessment after adopting a proposal established by Chief Ron Coleman, IAFC second vicepresident. The IAFC Executive Board adopted the creation of a task force to explore the concept. The intent of thisproject was to develop a more uniform method of evaluating fire defenses. The program was intended to result inthe development of a system of accreditation for organizations that had met all of the categories, criterion and per-formance indicators established within the system. The first members of that committee consisted of Chief CharlieRule, Chief Tom Hawkins, Chief Ron Coleman and Chief Bill Killen. The first meeting was held in Washington D.C. atthe annual conference of the IAFC. The committee eventually grew to more than 50 persons and was in the devel-opmental process until 1997, when the Commission on Fire Accreditation International Inc. was formed.
Members of the task force assigned to develop this concept were familiar with the PTI project and were also awareof the international implications of standards of response coverage. As a result, the Accreditation Task Force insti-
CFAI Chapter 1 10/17/03 2:18 AM Page 2

© 2 0 0 3 C O M M I S S I O N O N F I R E A C C R E D I T A T I O N I N T E R N A T I O N A L , I N C . C H A P T E R O N E • 3
tuted a study of the methodology, which was introduced in the first edition of its Fire and Emergency Service Self-Assessment Manual.
International City/County Management AssociationGerald Hoetmet, then a director of fire services within the ICMA, served as a committee member and implementedthe creation of a memorandum of agreement with the IAFC to more fully advocate the concept of self assessment.The CFAI Board of Trustees was established in 1997. The commission was created after nominations were receivedfrom agencies that were eligible to have a seat on the commission. The Fire and Emergency Service Self-AssessmentManual was published and copyrighted. The commission reviewed and granted accreditation to the first five agenciesthat had successfully completed the entire process.
Contemporary Method With the publication of the Fire and Emergency Service Self-Assessment Manual numerous fire agencies began to devel-op documentation for their departments in order to achieve accreditation. This resulted in more research into the method-ology. It soon became clear that the information in the self-assessment manual was not adequate for guidance for eitheragencies or peer assessors. The Commission on Fire Accreditation International, Inc. has worked with the members ofthis group to provide a more comprehensive and contemporary methodology for distribution to fire service practitioners.
The following chapter is an overview of the concept. Other chapters are devoted to the specifics of each concept.
Definitions and overview of termsThere are some key terms that will be used in explaining and defining standards of cover as defined in this text. Someof these terms are traditional to the fire service. Others are newly coined and have new meaning in the context ofthis area of policy development for fire agencies. Among these terms are:
■ Risk assessment■ Cascade of events■ Company distribution■ Company concentration■ Effective response force■ Response reliability■ Station location efficiency.
These are measures used by fire department staff to objectively and quantitatively analyze the relationship betweenexisting or new fire station locations, equipment, and the fire department's capacity and capabilities. Utilizing andunderstanding these terms are important to developing the concept within a fire agency.
Systems ThinkingThe Standards of Cover systems approach consists of the following eight components:
■ Existing deployment■ Risk identification■ Risk expectations■ Service level objectives■ Distribution■ Concentration■ Performance and reliability■ Overall evaluation.
CFAI Chapter 1 10/17/03 2:18 AM Page 3

C H A P T E R O N E • 4 © 2 0 0 3 C O M M I S S I O N O N F I R E A C C R E D I T A T I O N I N T E R N A T I O N A L , I N C .
Illustrated as a diagram, the process looks like:
Existing Deployment PoliciesAll agencies have an existing policy, even if it is undocumented or adopted by the locally responsible elected officials.Originally, stations and equipment were situated to achieve certain expectations. How and why they were sited needsto be historically understood, described and contrasted to proposed changes.
Building Risk Identification and Assessment—which consists of at least three elements:■ Fire Flow: The amount of water to control the emergency, which is based on structure, contents and exposures
■ Probability: The likelihood that a particular event will occur within a given period of time. An event that occursdaily is highly probable. An event that occurs only once in a century is very unlikely. Probability is an estimate thatan event will occur and a prediction that it will be very close by in time, or sometime off in the future
■ Consequence: Which has two components. Life safety (the amount of emergency personnel and equipment torescue or protect the lives of an occupancy from life-threatening situations). Economic impact (the losses of prop-erty, income or irreplaceable assets).
In order for a fire agency to make specific observations about the scope and complexity of its fire and EMS problems,it must have conducted a risk assessment. Among the key risk factors to be evaluated are the building fire problem,the mobile fire problem and the non-structural hazards and risks in the community.
Building Risk Assessment is performed at three levels of measure:■ Occupancy Risk: Which is defined as an assessment of the relative risk to life and property resulting in a fire inher-
ent in a specific occupancy or in a generic occupancy class.
■ Demand Zone: Which is an area used to define or limit the management of a risk situation. A demand zone canbe a single building or a group of buildings. It is usually defined with geographical boundaries and also can becalled fire management areas or fire management zones. Sometimes demand zones are a department’s datareporting areas from which historical workload can be defined, or demand zones could be a planning depart-ment data area that could be used to identify and quantify risks with the area.
Standards of Coverage Process
Identify Risks &Expectations
Existing(Proposed)Deployment
Identify Service Level
Objectives
Distribution &Concentration
Study
ReliabilityStudy
(Queuing)
PerformanceStudy
(Historical)
Display
Yes
No
Distribution and
Concentration
Affect Change
Stds ofCoverage
Display
Evaluation
Display Display Display
Policy Choices
CFAI Chapter 1 10/17/03 2:18 AM Page 4

© 2 0 0 3 C O M M I S S I O N O N F I R E A C C R E D I T A T I O N I N T E R N A T I O N A L , I N C . C H A P T E R O N E • 5
■ Community: Which is defined as the overall profile of the community based on the unique mixture of individualoccupancy risks, demand zone risk levels and the level of service provided to mitigate those risk levels.
EMS and specialty incident response risk assessment and outcome expectations also should be performed using thecriteria from those disciplines. For example, an EMS risk category could be trauma patients, with an expectation to sta-bilize and transport trauma patients to a designated trauma center within one hour of the accident occurring.
Risk ExpectationsAfter an agency knows what the risks are in a community, it must have a sense of what the community expects thedepartment to do about them: Respond to emergencies? Mitigate them? Deliver prevention and education programsto minimize these risks? Before an agency sets response expectations, the system should outline what it is currentlydoing and what it could do additionally to control risks. For those risks that cannot be controlled to a level below thatrequiring a response, the fire agency then must set outcome expectations for emergency response.
Service Level ExpectationsAfter understanding the risks present in the community, what control measures do the citizens and elected officialsexpect? For example, does the agency confine the fire to the compartment of origin, area of origin, floor of origin, or build-ing of origin? Some agencies in sparsely populated areas with long response times of 30 minutes or more might haveto accept (not like) an exposure level of service where the building fire does not spread to the adjoining forest and starta conflagration. In EMS we might expect to get a trauma patient to the designated trauma center within the first hour.Each risk category found in a community should have an outcome expectation developed for it. Risks other than struc-ture fires are typically EMS, special rescue such as confined space, hazardous materials, airports and airplanes, etc.
Deployment is measured and typified from two concepts, distribution and concentration, which are influenced byresponse time and create an effective response force for each risk category:
■ Distribution: The locating of geographically distributed, first-due resources, for all-risk initial intervention. These sta-tion location(s) are needed to assure rapid deployment to minimize and terminate average, routine emergencies.
Distribution is measured by the percentage of the jurisdiction covered by the first-due units within adopted public pol-icy response times. Policies shall include benchmarks for intervention, such as: arrival prior to or at flashover; arrivalon EMS incidents prior to brain death in cardiac arrest. From risk assessment and benchmark comparisons, the juris-diction will use critical task analysis to identify needed resource distribution and staffing patterns.
Distribution measures could be:percentage of square miles, orpercentage of equally sized analysis areas, orpercentage of total road miles in jurisdiction.
A sample distribution policy statement could be:“For 90 percent of all incidents, the first-due unit shall arrive within five minutes total reflex time.
The first-due unit shall be capable of advancing the first line for fire control or starting rescue orproviding basic life support for medical incidents.”
Distribution statements have some very specific grammar and structure. They must have a fractile performance meas-ure and a time measure—either total reflex or travel. The performance sentence should let the reader know that thefirst-due unit at a complicated emergency such as a structure fire cannot do every task by itself!
CFAI Chapter 1 10/17/03 2:18 AM Page 5

C H A P T E R O N E • 6 © 2 0 0 3 C O M M I S S I O N O N F I R E A C C R E D I T A T I O N I N T E R N A T I O N A L , I N C .
■ Concentration: The spacing of multiple resources arranged (close enough together) so that an initial “effectiveresponse force” can be assembled on scene within adopted public policy time frames. An “initial” effectiveresponse force is that which will most likely stop the escalation of the emergency for each risk type.
For example, in urban/suburban areas, an initial effective response force is typically three to four units, all arriving with-in 10 minutes or less travel time. Such a response can stop the escalation of the emergency, even in a high-risk area.An initial effective response force is not necessarily the total number of units or personnel needed if the emergencyescalated to the maximum potential.
For example, if a building pre-planned for a worst case scenario has a fire flow of 4,000 gpm, it is possible for thejurisdiction to plan an initial effective response force to provide the gpm necessary (say 1,500 gpm) to contain thefire to a reasonably sized compartment of origin for initial attack, but have further planned for multiple alarms to fill inthe remainder of the fire flow demands if initial attack is unsuccessful. Additional alarms or units could be planned onfrom farther away, including automatic and mutual aid.
If risk is well defined within areas smaller than a fire company first-due area (demand zone, run box, CAD responsegrid, etc.), then the initial effective response force should be planned for the predominant risk type found. Historicalfire data is used to match predicated response staffing to prior incident history and department standard operatingprocedures. This method is commonly called critical tasking.
Concentration is measured by risk category type—high-risk areas need second- and third-due units in shorter timeframes than in typical or low-risk areas.
Concentration measures could be:percentage of square miles, orpercentage of equally sized analysis areas, orpercentage of total road miles in jurisdiction.
A sample standards of cover policy statement on concentration could be:“That in a maximum risk area, an initial effective response force shall arrive within 10 minutestotal reflex time, 90 percent of the time and be able to provide 1,500 gpm for fire fighting, or beable to handle a five-patient emergency medical incident.”
Concentration statements, like distribution statements, have very specific grammar and structure. They must have afractile performance measure and a time measure—either total reflex or travel. The performance sentence should letthe reader know that the initial effective response force at a complicated emergency such as a structure fire may notfinish the job without additional help, but is designed to stop the escalation of the emergency. For example, the force(first alarm) is designed to stop fires historically found in each risk category, not the worst fire flow expected. The forcemay call for additional help to finish the tasks of overhaul and crew rest rotations.
Concentration pushes and pulls distribution, and there is no one perfect mathematical solution. Each agency after riskassessment and critical task analysis must be able to quantify and articulate why its resource allocation methodologymeets the governing body’s adopted policies for initial effective intervention on both a first-due and multiple-unit basis.
Performance and ReliabilityThis section of the study looks at actual incident history data to measure historical performance. If your agency statesit does something within X-minutes, Z percent of the time, does it? If not, why not? How reliable is your response sys-tem? Does the agency frequently see multiple calls for service (stacked, or queued calls), and do these degrade per-
CFAI Chapter 1 10/17/03 2:18 AM Page 6

© 2 0 0 3 C O M M I S S I O N O N F I R E A C C R E D I T A T I O N I N T E R N A T I O N A L , I N C . C H A P T E R O N E • 7
formance? Are there predictable times of the day, week or year when queued calls occur? Can these occurrences becontrolled or can peak hour staffing be used? For example, in some areas in the summer during extreme fire weath-er conditions, additional crews are placed into service for the worst part of the day. In a similar manner, EMS peakhour incident needs can be handled by additional, part-time units. In essence this section of the methodology looksat outcomes and determines if the standard of coverage is achieving the community’s expectations.
Overall EvaluationOnce all the individual standards of coverage factors are understood and measured, an overall, comprehensive eval-uation must be conducted. This is where the professional fire officer’s experience in his/her community is needed.We have all heard the term “garbage-in, garbage-out.” Well, all the statistics may say one thing, but they may totallydisagree with real world experience. If so, find out why and keep studying until the numbers come close to reality.Then based on good data, compare and contrast the study findings to community needs, expectations and the abil-ity to afford. All elected officials should be presented with a cost-benefit analysis, not just a demand for a change!
Stakeholder Participation and ExpectationsStandards of cover influence all stakeholders in an organization. The citizens within your community already havebeliefs and expectations related to service delivery, formed either through direct experience or from anecdotal infor-mation and stories they have heard over the years. Employees will be affected by changes in deployment strategy,facility location and a new emphasis on service delivery performance. Management will be held to the standards andguidelines set forth in the standard of cover and may be measured against the success of the new strategy.
Since all stakeholders have standing in the outcome, the process of developing your standard of cover should beinclusive, open and as objective as possible. You may elect to adopt some or all of the following suggestions relatedto developing an internal process, but keep in mind the overall intent is to provide all stakeholders with some prideof ownership while developing a deployment plan that will adequately serve the needs of your community.
Deployment Analysis Committee: Because the development of a standard of cover is not pure objective science buta combination of subjective risk analysis and application of objective data, conclusions will have both political and oper-ational ramifications. The team that analyzes your current deployment strategy and develops goals and objectivesshould include personnel with some expertise in data analysis, senior management staff with experience in labor andpublic communications, senior labor officials, and if possible, third-party expertise from the community (for instance,data analysts from a local university).
Consider developing a core team of five to eight individuals and augmenting this team with experienced personnelwho can assist with mapping, geo-analysis, dispatch issues, risk analysis, etc. The team should prepare to keep doc-umentation related to the subjective and objective criteria that are used to establish response goals and objectives.Future deployment decisions will be based on this historical data, and it is important to provide future teams with theproper context behind today’s decisions.
Identifying Objectives: Once established, the committee should clarify its primary objectives. Is there a previous stan-dard of cover that needs review? What are the current organizationally established response objectives? Are they inwriting, or were they based on any previous studies? Creating expectations related to building new infrastructure orobtaining additional staffing before the Deployment Committee has finished its work is inadvisable. The goal shouldbe producing a set of deployment objectives that enhance safety and customer service, that are fiscally responsible,and that provide a method for measurement.
Ground Rules: The Deployment Committee should openly discuss and agree upon ground rules before starting theprocess. Recommended changes will have both operational and political impacts, so expect areas where each
CFAI Chapter 1 10/17/03 2:18 AM Page 7

stakeholder will have his/her emotions and beliefs challenged. Develop mutual interests early in the process and avoidtaking positions. Mutual interests should be fairly specific but should not include detail. For example, mutual interestsamong stakeholders could be firefighter safety, improved response time performance, or meeting certain benchmarkswithin a determined period of time (e.g., NFPA, OSHA, or ANSI standards). Understanding the current and future finan-cial, resource, and political limitations early in the process is extremely important. All parties should be familiar withthe organization’s budget, funding sources and mission statement.
Finally, the committee should engage in an educational discussion with someone who can explain how to interpretdata, its limitations and the risks associated with using “objective” data to form conclusions in a business that is con-tinually dynamic and complex. Reporting lines and limits of authority also should be defined so every member under-stands his/her respective responsibility and has realistic expectations associated with the outcome.
Involving stakeholders may take longer than unilateral development of goals and objectives, but it creates ownershipand provides a forum for discussion and an exchange of ideas that would otherwise be impossible to achieve.
SummaryFire departments have been building fire stations and staffing them in this country for more than 250 years. BenjaminFranklin probably did not have much discussion about where to place his first fire company in Philadelphia. Todaythere are a wide variety of reasons to place emphasis on this methodology. Among the top contenders for the primereason is fire department performance in a contemporary fire service. Placement and staffing of fire companies is notas simple as it once was, but it is not as complicated as some would have it be. Standards of response coverage ismerely a rational and systematic way of looking at the basic service provided by a fire agency: emergency services.
C H A P T E R O N E • 8 © 2 0 0 3 C O M M I S S I O N O N F I R E A C C R E D I T A T I O N I N T E R N A T I O N A L , I N C .
CFAI Chapter 1 10/17/03 2:18 AM Page 8

© 2 0 0 3 C O M M I S S I O N O N F I R E A C C R E D I T A T I O N I N T E R N A T I O N A L , I N C . C H A P T E R T W O • 1
CHAPTER TWO
THE CONCEPT OF R ISK MANAGEMENT
Risk Analysis is Where to StartThe purpose of this chapter is to assist an agency in performing an analysis of its community and its problems usingreal world factors, specifically those that the agency and the community can both agree upon as representing thecommunity’s risk level.
Earlier on in the development of the standards of response coverage concept the Commission on Fire AccreditationInternational, Inc. worked with the U.S. Fire Administration (USFA) to create a software package called Risk, Hazardand Value Evaluation (RHAVE). The Commission on Fire Accreditation International, Inc., in cooperation with the U.S.Fire Administration, developed this standardized risk assessment methodology to assess fire risk in a communitybased upon local input.
That project has been completed and is moving into a new version as of the writing of this manual. Therefore, thismanual does not attempt to reproduce that conceptual framework in its entirety. However, certain principles that weredescribed in that text must be reproduced in this text to establish a framework for future discussion.
This software is available at no cost from the Federal Emergency Management Agency, U.S. Fire Administration,888/441-4330. Copies of RHAVE Software may be obtained from the Web site that currently provides response tofrequently asked questions on the risk assessment process. This Web site is www.rhave.com.
ConsequencesThe consequences chart below is representative of the considerations of risk assessment in each community. Thereis always a probability of an event occurring. That frequency ranges from low to high. There are always consequencesof that event occurring, and that ranges from low to high. Each creates different requirements in the community forcommitment of resources.
Consequences
Prob
abili
ty
High ProbabilityLow Consequence
High ProbabilityHigh Consequence
Moderate Routine
Distribution
WorstSevere
IsolatedRemote
KeyHigh
Hazard
Low ProbabilityLow Consequence
Low ProbabilityHigh Consequence
Con
cent
ratio
n

C H A P T E R T W O • 2 © 2 0 0 3 C O M M I S S I O N O N F I R E A C C R E D I T A T I O N I N T E R N A T I O N A L , I N C .
This creates four possible relationships between structures or conditions and the distribution and concentration ofresources:
■ Low probability, low consequences■ Low probability, high consequences■ High probability, low consequences■ High probability, high consequences
Key Points:Each quadrant of the chart therefore creates different requirements in the community for the commitment ofresources. For example:
■ You must have a distribution of resources to be able to reach a very large number of events, regardless of howinsignificant they are, over most of the jurisdiction you protect. This is an equity issue between neighborhoods.For example, low-income neighborhoods should not have any less protection than high-income neighborhoods,and high-income neighborhoods should not have any better level of service than low income ones. This conceptis reflected in the distribution of fire companies to assure a specific response time performance goal for a cer-tain fractile of the calls for service. In a perfect world, 100 percent of the community would have a fire compa-ny on scene within the response travel time goal. In the real world the distribution of fire companies is very goodif the fire companies can arrive at least 90 percent of the time within the stated time goal.
■ Concentration is a risk/cost issue and both of these factors are variables, thus:
Increased Risk = Increased Concentration
Concentration is the ability to place enough resources on any specific risk to keep the event from becoming a majoremergency.
For example, the risk assessment for a suburban community may include defining the differences between handlingan emergency in a detached single-family dwelling, a multiple-family dwelling, an industrial building and a high-rise byplacing each in a separate category for assessment in this model. Fire stations and apparatus must be equally dis-tributed in the community to provide an initial attack service to all of them. Conversely, the fire station locations andstaffing patterns must be prepared to respond to a worst-case scenario—to concentrate the staff and pump capacityto handle a major event.
There are many factors that make up the risk level that demands concentration: the ability of occupants to take self-preserving actions, construction features, built-in fire protection, fire flow, nature of the occupancy or its contents, etc.However, among the leading factors is the number of personnel needed to conduct the critical tasks necessary tocontain the event.
While risk factors all have some common thread, the rationale of placing an occupancy within any risk assessmentcategory is to assume the worst. Fire flow is one such factor used as a risk assessment criteria or requirement that isbased on defining the problem that will occur if the occupancy is totally involved, and therefore creates the maximumdemand upon fire suppression services.
The level of service provided by an agency should be based on the agency’s ability to cope with the various typesand sizes of emergencies that they can reasonably expect after conducting a risk assessment. This process starts withlooking at the most logical source of fire problems: buildings.

© 2 0 0 3 C O M M I S S I O N O N F I R E A C C R E D I T A T I O N I N T E R N A T I O N A L , I N C . C H A P T E R T W O • 3
Building (Occupancy) Risk AssessmentThe fire flow concept of occupancy risk assessment addresses one of the most important aspects of fire control: theassessment of water supplies needed once a structure has become fully involved. The fire flow method does notaddress other equally important issues such as occupant risk and content vulnerability to fire origin.
The following chart provides a model that relates the various elements of risk to the relationship between the com-munity as a whole, the frequency of events that occur, the severity of potential losses, and the usual distribution ofrisks. This chart demonstrates that the overall community may have a wide range of potential risks. If the communityis like most communities there will be an inverse relationship between risk and frequency. In short, the daily event isusually the routine or remote risk category.
As we move up the chart toward the highest risk levels, the events are less frequent. If the risk management systemis working in the community, a catastrophic loss should be an extraordinary event. In most communities the majorityof losses occur in the smallest percentage of emergencies that reach the significant, major or total destruction lossranges. The objective of risk assessment technique is to reduce the truly serious loss to a very unusual event in thecommunity. This involves trying to keep routine emergencies from becoming serious loss situations.
Do We Plan for High Risk or Average Risk?It is necessary for each community to assess risk by a method that is measurable if there is to be any commonalityamong risk-based deployment models. RHAVE is one system, but it is not the only one. This chapter will discuss sev-eral methods used by communities that have documented their standard of coverage as part of the self-assessmentactivity in pursuing accreditation by the Commission on Fire Accreditation International, Inc.
The desired outcome of the RHAVE process is an accurate and current description of the values-at-risk in the com-munity. Values-at-risk (VAR) is the inventory of a community’s potential fire problems arrayed from the most valuableand vulnerable risk to the least valuable and vulnerable risk that the fire protection agency is deployed to protect.
Potential of Loss
Com
mun
ity
as a
Who
le
Key Risk
Major Risk
Severity (Risks)
T o t a l D e s t r u c t i o n
M a j o r D e s t r u c t i o n
S i g n i f i c a n t L o s s
M i n o r L o s s
I n s i g n i f i c a n t L o s s
E x t r a o r d i n a r y E v e n t
R a r e E v e n t
A n n u a l E v e n t
M o n t h l y E v e n t
W e e k l y E v e n t
D a i l y E v e n t
H o u r l y E v e n t
Routine Risk
Co
nse
qu
en
ces
Frequency of Events(Rates)
Concentration($$)
Distribution(Sites)

C H A P T E R T W O • 4 © 2 0 0 3 C O M M I S S I O N O N F I R E A C C R E D I T A T I O N I N T E R N A T I O N A L , I N C .
RHAVE is covered in depth in its training manual and software users guide, available from the Commission on FireAccreditation International, Inc., and the U.S. Fire Administration.
RHAVE assumes the existence of five factors:
■ building (B)■ life safety (LS)■ water demand (WD)■ values (V)■ risk range (RR).
Data from these five factors is used to develop an occupancy vulnerability assessment profile (OVAP).
The benefits of using a standardized calculation tool such as RHAVE to identify risk are twofold. First, with all areas ofthe city scored, we can ascertain that all areas presenting a higher-than-average risk are properly represented in thedepartment’s response schedule.
Second, the spacing of fire stations for multiple company response (concentration) takes into account only higher riskareas, thus pulling only some of the community’s fire stations closer together for higher risks. Thus some economicsensitivity is gained: in typical or low-risk areas, fire station spacing can be spread out a little further. The risk-to-response schedule methodology can be visualized like this:
If needed personnel and equipment arrive too late, the fire will grow beyond the ability of the initial assignment (firstalarm) to stop the fire’s spread. The incident then grows to multiple alarms, draining the community’s resources. Thebalancing act is to have a deployment plan that does not allow frequent greater alarm fires.
RiskType
Quantity of F/F Water Needing to be Delivered
Calculated #of F/F's
# of Fire Trucks
Response Times
to AchieveObjective

© 2 0 0 3 C O M M I S S I O N O N F I R E A C C R E D I T A T I O N I N T E R N A T I O N A L , I N C . C H A P T E R T W O • 5
RHAVE Materials and MethodsThe goal over the long term for a RHAVE assessment is to have fire company personnel produce a RHAVE score foreach building type in the city. Another acceptable method is to RHAVE score sample areas of the city. This works par-ticularly well when an initial study has a tight time frame and a computer database of building statistics is not readilyavailable. In a sampling system approach, risk assessment is performed at three levels—individual buildings present-ing special challenges, small areas called demand zones (DZs) and citywide.
Demand zone areas are not the same size, but all are smaller than an individual fire company’s first-due area andallow a more precise evaluation of fire risk. A demand zone is usually only a few square miles, blocks or a specificarea (such as an airport). For example, a large fire department could have a workload of 1,304 demand zones toanalyze. Risk can then be categorized in each demand zone and counted as a percent of the city’s land area. Risktypes then can be summed and expressed as a percent of the citywide total.
To quickly score many demand zones, standards of cover study staff can review what is actually in every demandzone. This effort might use general plan zoning designations, fire department pre-incident plans, fire prevention bureauplans, and experience from actual emergencies. A spreadsheet and display map may then be developed to list eachdemand zone by a unique identification number, its RHAVE risk designation and its land area in square miles. Mostscoring can be done without follow-up field checks.
Once the initial scoring is completed, project staff and fire department senior staff should meet to review the initialresults. During this process a few demand zones might be re-classified to reflect more accurately risk values the staffhas historically experienced or that more closely match unique community expectations. Such deviations from theRHAVE scores should be kept to a minimum. The purpose of RHAVE is to obtain a standardized typing of risk acrossthe country in order to have a more common understanding of how communities respond to risk types.
One of the hardest concepts for personnel new to RHAVE to grasp is that average risk in one community should beaverage everywhere in America. Your average risk should not end up high in an adjoining community. Nor should atypical, diverse community have all high risk just because all their buildings are important to them.
RHAVE ResultsOnce the data elements are entered into the RHAVE program, a score for each building is calculated. These scoresare then banded into groups. This is necessary because realistically we can only vary deployment across a few grouptypes. It would be impossible to locate fire stations to cover dozens of different risk types. Also, by grouping like risktypes, communities can have a standardized viewpoint of risk, while having slightly different types of buildings withineach band.
The RHAVE categories are:
Maximum Risk — OVAP Score 60+Significant Risk — OVAP Score 40-59Moderate Risk — OVAP Score 15-39 (also known as typical or average)Low Risk — OVAP Score < 15
Generally speaking, it is not appropriate for the risk assessment model to include more than the four RHAVE cate-gories plus any special risks. These may be defined by using either the term offered by the RHAVE process for build-ings and/or by other specialty risk assessment systems in the fields of EMS or wildland fire fighting.

For example after completing the RHAVE analysis for each demand zone, it is possible to quantify by percent of totalland area how much of each type of risk is present in a city:
Risk Type . . . . . . . . DZ Count. . . . . . . . . . . . . Sq. Miles . . . . . . . . . . . . . Percent of AreaMaximum . . . . . . . . . . . . 71. . . . . . . . . . . . . . . . . . . . 10.5 . . . . . . . . . . . . . . . . . . . . . . . 5%Significant . . . . . . . . . . . 264 . . . . . . . . . . . . . . . . . . . 40.0 . . . . . . . . . . . . . . . . . . . . . . 19%Moderate . . . . . . . . . . . 958 . . . . . . . . . . . . . . . . . . 132.0 . . . . . . . . . . . . . . . . . . . . . . 63%Low . . . . . . . . . . . . . . . . . 11 . . . . . . . . . . . . . . . . . . . 26.5 . . . . . . . . . . . . . . . . . . . . . . 13%
In a major metropolitan area the diversity of risk shown above is expected. It is also normal for a large city to be 60percent or more typical risk. This number demonstrates the bulk of a diverse city is housing stock and smaller sup-porting businesses. On the other hand, if the maximum and significant categories are combined, a total of 24 per-cent, or almost one quarter of the sample city’s area, is above average risk, which also is typical of many large cities.
A map of the same data from a large city shows how risk can be displayed using different colors for each risk type.This allows an easy visualization of where risk is located and when combined with a mapping display of station loca-tions, shows if the concentration of stations is adequate where there is higher than moderate risk.
The above type of map graphic is best viewed in color and can be very powerful when transferred into PowerPointfor display in a briefing to decision makers. Even in grayscale, different patterns of risk are visible.
The requirement in risk assessment is for the agency to consciously discriminate in their community defining howmany different categories of risks must be addressed. The tables below are an example of a complete risk analysisfor a four-station department using building code types instead of the RHAVE process and displayed in a table formatinstead of a map.
C H A P T E R T W O • 6 © 2 0 0 3 C O M M I S S I O N O N F I R E A C C R E D I T A T I O N I N T E R N A T I O N A L , I N C .

© 2 0 0 3 C O M M I S S I O N O N F I R E A C C R E D I T A T I O N I N T E R N A T I O N A L , I N C . C H A P T E R T W O • 7
Use of Existing DatabasesMany communities have been collecting information to input into a fire inspection database to create risk assessment.
SAMPLE COMMUNITYA P P R O X I M A T E N U M B E R O F O C C U P A N C I E S W I T H I N E A C H C A T E G O R Y
DESCRIPTION DIST. 1 DIST. 2 DIST. 3 DIST. 4 TOTALS
* Group A . . . . . . . . . . . . . . . . . . . . 39. . . . . . . . . . . . . 31. . . . . . . . . . . . . 14 . . . . . . . . . . . . . 1. . . . . . . . . . . . 1.0 %
* Group B . . . . . . . . . . . . . . . . . . . . 94 . . . . . . . . . . . . 438 . . . . . . . . . . . . 45 . . . . . . . . . . . . . 7. . . . . . . . . . . . 4.0 %
* Group E . . . . . . . . . . . . . . . . . . . . 9 . . . . . . . . . . . . . 8 . . . . . . . . . . . . . . 4 . . . . . . . . . . . . . . 2 . . . . . . . . . . .0.001 %
* Group F. . . . . . . . . . . . . . . . . . . . . 0 . . . . . . . . . . . . . 10 . . . . . . . . . . . . . 1 . . . . . . . . . . . . . . 1 . . . . . . . . . . 0.001 %
* Group I . . . . . . . . . . . . . . . . . . . . . 0 . . . . . . . . . . . . . . 4 . . . . . . . . . . . . . 0 . . . . . . . . . . . . . . 0 . . . . . . . . . . 0.001 %
* Group M . . . . . . . . . . . . . . . . . . 32 . . . . . . . . . . . . 31. . . . . . . . . . . . . 15 . . . . . . . . . . . . . 0 . . . . . . . . . . 0.001 %
**Group R-1. . . . . . . . . . . . . . . . . . . 0 . . . . . . . . . . . . . . 3 . . . . . . . . . . . . . 0 . . . . . . . . . . . . . . 0 . . . . . . . . . . 0.001 %
**Group R-2 . . . . . . . . . . . . . . . . 640. . . . . . . . . . . 2,949. . . . . . . . . . . . 0 . . . . . . . . . . . . . . 0 . . . . . . . . . . . 22.0 %
**Group R-3. . . . . . . . . . . . . . . . . . 272 . . . . . . . . . . . 957 . . . . . . . . . . . 362. . . . . . . . . . . . . 0 . . . . . . . . . . . 10.0 %
**Group R-4. . . . . . . . . . . . . . . . . 3,649 . . . . . . . . . . 2,918 . . . . . . . . . . 3,807 . . . . . . . . . . . . 2 . . . . . . . . . . . 63.0 %
**Group S . . . . . . . . . . . . . . . . . . . . 0 . . . . . . . . . . . . . 8 . . . . . . . . . . . . . 2 . . . . . . . . . . . . . . 0 . . . . . . . . . . 0.001 %
TOTALS . . . . . . . . . . . . . . . . . . . . . 4,735 . . . . . . . . . . 7,357 . . . . . . . . . . 4,250 . . . . . . . . . . . 13 . . . . . . . . . . (16,355)29.0 % 45.0 % 26.0 % .001 % 100.00 %
Definitions are based upon BOCA * Represents Individual Businesses **Represents Individual Buildings
The above table demonstrates that without using the RHAVE scoring system, an agency could typify and quantify thebuilding risks found in its community and where they are located by first-due station area. The reader can easily dis-cern that district 2 has the most buildings and that citywide, the predominant building type is residential. The detailsfrom the above table can then be aggregated by risk type:
Community Risk MatrixBased upon evaluation, the following occupancies fall into each risk category:
Maximum Risk - . . . . . . . . . . . . . . . 1.0% Low Risk - . . . . . . . . . . . . . . . . . . . . . insignificantGroups A & M Groups Misc.
High Risk - . . . . . . . . . . . . . . . . . . . . 4.0% Remote Risk - . . . . . . . . . . . . . . . . . insignificant Groups S & B Group Forest
Typical Risk - . . . . . . . . . . . . . . . . . 95.0% Special Risk - . . . . . . . . . . . . . . . . . . insignificant Groups E, R-1 to 4 Groups I & F
While the above example did not use the RHAVE process, it did typify risk by building code classification and thenaggregated those amounts. A study could then easily take this data and ensure that the higher risk areas received ahigher concentration of fire company locations.

C H A P T E R T W O • 8 © 2 0 0 3 C O M M I S S I O N O N F I R E A C C R E D I T A T I O N I N T E R N A T I O N A L , I N C .
ISO Risk LayersIn conducting research to create this manual the contributors also have collected valuable information from one ofthe oldest data collections around: insurance industry data. A letter requesting a data file of all buildings that are ratedin your community is available by calling 800 444-4554. Ask to speak to the individual in charge of public fire pro-tection. This source can provide you with data on buildings and the needed fire flow in the community. Several agen-cies have been successful in putting this data on geographic information systems (GIS) maps to clearly illustrate thedistribution and concentration of risk and values in the community.
Risks by TypificationSome communities have developed charts or tables that provide a listing of types of calls that generate response bythe agency. These tables are usually based on review of the community’s historical response data and the judgmentof the senior fire officers within an organization.
The following table comes from an agency that has used this technique:The Anytown Fire Department Standards of Response Coverage
Types of RiskLowAutomobile firesCarbon monoxide callsGrass and low fuel typesSingle patient EMS callsAutomobile accidents or industrial accidentTractor trailer firesStorage shedsOut buildingDetached garages.

© 2 0 0 3 C O M M I S S I O N O N F I R E A C C R E D I T A T I O N I N T E R N A T I O N A L , I N C . C H A P T E R T W O • 9
MediumDetached, single-family dwellingsOlder multi-family dwellings easily reached with pre-connected attack linesRailroad facilitiesMobile homesIndustrial or commercial occupancies under 10,000 sq. feet, without high fire loadAircraft on airport propertyLoss of life or property value limited to occupancy.
HighConcentrations of older multi-family dwellings. Multi-family dwellings that are more than two stories tall and require major hose deployment to reachBuildings with low occupant load, but with high concentrations of fuel load or hazardous materialsAircraft off airport propertyMercantile facilitiesBuilt-up areas with high concentration of property with substantial risk of life loss, severe financial impact upon the
community or the potential for unusual damage to property or the environment.
Special RiskApartment complexes more than 25,000 square feetGovernment or infrastructure risksHospitalsNursing homesIndustrial complexes with fire flows of more than 3,500 gpmRefineriesWarehousesVacant/abandoned structuresAll buildings where available water supply is less than projected fire flow.
Emergency Medical ResponsesIn the previous section risk assessment focused on buildings and their contents, as well as built-up risks such as lum-beryards, fueling facilities and outside fire problems. This next section focuses on the impact of illness and suddeninjury. While the concept of risk assessment has been the topic of a variety of fire programs in the past, i.e. pre-fireplanning and fire flow, the study of risk for EMS is a much more limited area of study. Yet, fire agencies reporting that60 to 70 percent of the call workload is for EMS responsibility is becoming the norm. For this reason, this chapter hasa section that deals with risks of accidents and sudden illness.
EMS Risk AssessmentOne EMS goal, consistent with medical literature, is reducing response times to time-sensitive medical emergencies(i.e., cardiac arrest). However, achieving this goal will require innovative strategies. One strategy is to determine if clus-ters, specific areas, or areas/populations within a community experience greater numbers or higher percentages oftime-sensitive medical conditions.
While quantification of the value of shorter response times to all medical conditions is not possible, it is possible toquantify correlation between time-sensitive chief complaints and community characteristics. For example, communitieswith older populations are more likely to experience a greater number of heart attacks or cardiac arrests. By pinpoint-ing neighborhoods with more frequent occurrences of specific medical emergencies, the department can organize itsresources to respond more effectively to those medical conditions that benefit the most from rapid intervention.

C H A P T E R T W O • 1 0 © 2 0 0 3 C O M M I S S I O N O N F I R E A C C R E D I T A T I O N I N T E R N A T I O N A L , I N C .
For example, if a station’s volume of time-sensitive chief complaints is five percent of its total volume, then thereshould be the same relative percentage for each of the conditions analyzed. Thus, a station responding to five per-cent of the total medical calls should respond to five percent of the heart attacks. An engine responding to a higherpercentage of heart attacks than its station’s calculated percentage indicates the community it serves has proportion-ately more heart attacks than other parts of the city.
While cardiac arrest and choking are the most time-sensitive medical emergencies, there are other emergencies thatcan benefit from shorter response times. While admittedly there is little in the medical literature describing optimaltime-to-treatment intervals, pathology of disease processes supports the hypothesis that shorter intervention timesimprove outcomes.
One way to understand EMS responses is to look at computer-aided dispatch (CAD) data organized by station first-due areas. This allows an examination of the relative frequency of medical conditions that would benefit from short-er times to treatment.
The following data is from such a study in a large metropolitan fire department:‘This analysis eliminated call volume differences among stations; thus, observed percentages for each condition arecomparable. Although patient care reports were not examined, the emergency medical dispatch protocol (whereimplemented) used to classify the initial chief complaint is highly predictive of actual patient conditions. (Of note,and to be expected, is the relatively higher number of assaults, stabbings, and gunshot wounds found in the down-town area.) The table illustrates that some stations, based on community demographics, have higher percentagesof time-sensitive medical conditions than expected.’
The higher relative number of difficulty breathing in station 26’s area and chest pain in station 9’s area place a high-er priority on improving response time performance of ALS personnel. Difficulty breathing and chest pain are oftensymptoms of heart attack, which can rapidly degrade to cardiac arrest. In the same general location of the city liesstation 13, which had the highest relative number of falls and heart problems.
Chief Asslt Diff CPR Chest Choke Diab Drown Fall/ Heart Ind OD/ Stab/ UnkComplaint Breath Pain Prob Back Prob Acc Uncon Gun Prob
Count 515 4567 541 2704 331 1033 17 3123 282 28 3220 82 933
First 11.5% 6.2% 4.1% 5.6% 10.0% 4.0% 17.6% 6.4% 7.8% 14.3% 2.6% 14.6% 12.5%
Stn % 5.0% 5.1% 1.1% 4.8% 5.2% 1.8% 2.8% 4.6% 4.6% 3.5% 1.8% 3.8% 5.0%
Second 8.2% 3.9% 4.1% 3.3% 6.6% 5.9% 11.8% 4.9% 8.2% 14.3% 5.5% 15.9% 10.5%
Stn % 3.8% 2.8% 2.0% 2.8% 4.3% 4.2% 2.0% 3.8% 5.6% 5.0% 5.0% 6.1% 6.0%
Third 8.2% 4.9% 6.3% 3.9% 8.2% 7.0% 11.8% 3.2% 6.0% 14.3% 2.2% 9.8% 5.5%
Stn % 5.2% 4.3% 4.8% 3.1% 6.1% 5.6% 3.8% 2.8% 3.8% 5.1% 1.8% 5.0% 3.8%
Stn order 1,3,16 26,21,12 15,11,9 9,21,23 16,12,2 22,24,14 21,11,4 13,6,17 13,14,6 5,1,26 27,1,22 3,2,1 1,8,3

© 2 0 0 3 C O M M I S S I O N O N F I R E A C C R E D I T A T I O N I N T E R N A T I O N A L , I N C . C H A P T E R T W O • 1 1
Wildland Risk AssessmentWhile there are many publications and methods available for risk assessment in wildland fire areas, a brief overviewis needed here of the basic methods. Many agencies creating and evaluating a standard of response cover plan mayhave grasslands, forest areas and most importantly urban interface areas (I-Zone) where structures adjoin hazardousopen space areas.
As with any risk, it is important to understand in order to effectively deal with it. This next section may not apply to allorganizations, but is become a predominant factor in the western and southern parts of the United States.
Wildland fires produce heat from living and dead vegetation. The amount of heat energy released during a wildlandfire is a function of the amount, arrangement and rate of combustion of the fuels. In wildland fires, flame lengths canexceed 100 feet and the radiated heat can ignite materials from distances of 100 feet or more. Winds can carry livefirebrands (burning materials) for several miles.
The goal of any wildland fire defense planning program is to provide adequate protection in the interface betweenthe natural areas and the developed areas. This is accomplished by developing a comprehensive risk assessment planto reduce, eliminate and/or control fires in the wildland interface that present a danger to life and property.
The plan would consist of three parts:■ Design/Construction: Adequate ingress and egress, fire-resistant building and landscape construction, defensible
space and locations are centerpiece of this part.■ Enforcement/Education: Community education and enforcement of the codes and conditions established is the
most difficult of these parts but certainly the most important.■ Fire Fighting Resources: Having the resources to combat an interface fire in the early stages before it becomes a
potential catastrophic event is essential. This is the last line of defense.
Implementation of this type of program has had success in other communities with similar risks. Developing a cost-effective program that will increase the use of passive protection while still providing the resources needed to preventcatastrophic loss is the best solution available to communities today.
Jack Cohen, from the USDA Forest Service lab in Missoula, Mont., spoke to the issue of “The Wildland Fire Threat toStructures” at a meeting on the subject of wildland fires in the interface. Cohen reviewed the ignition factors in wildlandfires that caused so much damage, such as the Laguna Beach fire in 1993. Cohen stated that fire does not behave likea thing or a wave, but as a process. That process, Cohen continued, is dependent on heat and fuel, a plentiful supplyfound in homes often present to a wildland fire. After a review of the specific elements that often contribute to homeloss, Cohen concluded that residential areas are “part of the flame spread process, not victims of the fire.”
To understand the risk, it is necessary to understand how wildland fires interact with structures in the interface area.A wildland fire can ignite a structure through radiation, convection or direct contact of flames or burning materials (fire-brands). These three ignition sources need to be understood in order to change the interface environment, makingit less susceptible to damage or destruction.
I-Zone Defensible SpaceThe definition of defensible space: The areas within the perimeter of a parcel, development, neighborhood or commu-nity where basic wildland fire protection practices and measures are implemented, providing the key points of defensefrom an approaching wildland fire or defense against encroaching wildland fires or escaping structure fires. The perime-ter as used herein is the area encompassing the parcel or parcels proposed for construction and/or development, exclud-ing the physical structure itself. Establishment and maintenance of emergency vehicle access, emergency water reserves,street names and building identification and fuel modification measures characterize the area known as defensible space.

C H A P T E R T W O • 1 2 © 2 0 0 3 C O M M I S S I O N O N F I R E A C C R E D I T A T I O N I N T E R N A T I O N A L , I N C .
The concept is rather simple. It means giving the firefighters an area in which they have a reasonable chance of pro-tecting the structure from a wildland fire once they arrive. It starts with construction/design and continues with the fuelmodification and maintenance.
With all of this in mind, three zones can be created:■ A Zone: The area in the immediate vicinity of the structure. This is 30 feet to either side or uphill from the struc-
ture and 100 feet below the structure. Only fire-resistant vegetation should be allowed in this area. Fuels withinthe A zone can have a significant impact on the potential of a structure to burn. The size of the A zone will varydepending on the vegetation and characteristics of the land. Fuels within the zone should be fire-resistant andmaintained in fire-resistant condition. Ornamental vegetation is included in this area.
■ B Zone: The area from the end of the A zone to 30–100 feet (could be more depending on conditions) fromthe structure depending on topography and fuel types. The composition of this area should be considered whendesigning the structure and locating it on the property. Fuels in the B zone are those that surround the structurebut are not immediately adjacent to it. This area is often referred to as the “fuel modification” or “fuel mod” area.The concern here is the fuels’ ability to produce firebrands, which can indirectly cause ignition of the structure,and the fuels’ ability to produce long flame lengths and intense radiant energy. Fuels in this area should bereduced or eliminated to lower the fuel load and thus the heat potential for the structure. Fuels beyond the imme-diate vicinity of the structure should consist of fire-resistant ground cover and trees that are thinned and prunedto prevent ground fires from igniting the crowns, or tops, of trees.
■ C Zone: The area outside of the B zone. The primary issue in this zone is also its ability to produce firebrands. Theloading of the fuel, its age and condition should be monitored so it does not produce enough energy to preheat thefuel in the B zone causing a blowup (rapid fire acceleration) or fire storm (fire large enough to create and maintainits own wind and weather). These areas are normally not in the control of the property owner and become com-munity issues. This is an area where regional agencies such as state departments of forestry or the USDA ForestService can assist with vegetation management programs such as firebreaks, fuel breaks and controlled burns.
Each of the above zones is used to establish acceptable design, materials, location and clearances during the con-struction and remodeling process.
I-Zone Enforcement/EducationAfter achieving the measures listed above, it is important to maintain them. It is important to make sure that the fuelbreaks and defensible spaces are maintained and to monitor the fuel continuity and fuel loading.
As fuel beds mature and the fuel models change, it may be necessary to revisit the nature and conditions of the Bzone modifications and ensure that the distances have been maintained in the A zone.
Enforcement is one method of achieving success in the defensible space issue, but education tends to be a muchbetter tool. Once people living in the interface zone realize that without defensible space the fire department may noteven try to save the structure, they tend to be good about the establishing and maintaining of these areas. Additionally,when educated on the impacts of these zones, or lack of them, on adjoining property, they can accomplish a greatdeal more than the inspectors can in most cases.
Even with good education, it is necessary to have a fire professional take a look at these areas at least once prior to thestart of the wildland fire season. While the basic education is good for the citizens, it cannot replace the knowledge ofthe wildland defense planner. This professional firefighter will have the insight into the condition of fuel beds, the impactof season moisture and the changes in weather pattern that will have an effect the prevention measures that have beentaken. It is important to develop the skills necessary to inspect, modify and approve fuel modification plans and areas.

© 2 0 0 3 C O M M I S S I O N O N F I R E A C C R E D I T A T I O N I N T E R N A T I O N A L , I N C . C H A P T E R T W O • 1 3
I-Zone Hazard Assessment ProcessThe process, developed by the National Wildland/Urban Interface Fire Protection Program, has two purposes: to edu-cate homeowners and developers of the wildfire problem, and to show homeowners and developers simple stepsthey can take to make homes built in the wildland-urban interface safer and more likely to survive a wildland fire.
The hazard assessment process is presented as an overall approach that combines approaches taken by several juris-dictions throughout the United States. It was taken from the information distributed by Firewise.org on the Internet. Inreviewing each step, consider the extent each step contributes to a realistic assessment of the fire hazard in each area:
Step 1: Select the areas to be evaluated
Identify the interface boundary or boundaries on a map. Use a map (preferably a topographic map) of the jurisdic-tional area to define the known interface areas. After identifying the interface areas on the map, give each area a nameor number. Consider naming the areas after related geographic names or landmarks for easy reference.
Step 2: Select the hazard components to be considered in the assessment
The hazard components are divided into three categories—structure hazards, vegetative fuel hazards and other mis-cellaneous hazards. The structure hazards include the structure’s location, building materials and design. The vegeta-tive fuel hazards include the vegetation both within and beyond the vicinity of the structure. Miscellaneous hazardsincluded are the structure density (i.e., the number of structures in an area), slope, weather and fire occurrence.
Step 3: Rank the hazard components
Develop or use an existing system to define the significance of each hazard component. The system, though subjec-tive in nature, should be specific and consistent. For example, NFPA 299 Standard for the Protection of Life andProperty, 1997 edition, uses a numerical rating system to define the relative contributions of several components. Toobtain an overall rating for the interface, the NFPA 299 system requires simply adding the points from the individualcomponents. The numerical rating will be significant only considering the system from which it was derived. For exam-ple, under NFPA 299, a rating of 69 to 83 points indicates a high-hazard property.
Step 4: Compile the hazard rankings in a usable format
Compile the component hazard rankings in a format that will reveal the relationships between the individual hazardsand categories of hazards. Three methods are often used to analyze the data collected:
■ A geographic information system (GIS) can define the hazards components on a map of the assessment area.Displaying each hazard on transparent overlays, rather than on a single map, allows you to study various combi-nations of data.
■ A grid index system references specific points of interest on a map. The coordinates of the grid define the haz-ard rating of a specific property or area.
■ A matrix system describes the severity of each hazard for each area within the assessment.
Any or all of these data analysis methods can be used to understand the relationships between the various hazardcomponents and can also help to develop an overall hazard ranking of each area within the assessment.
Step 5: Develop action plans and programs
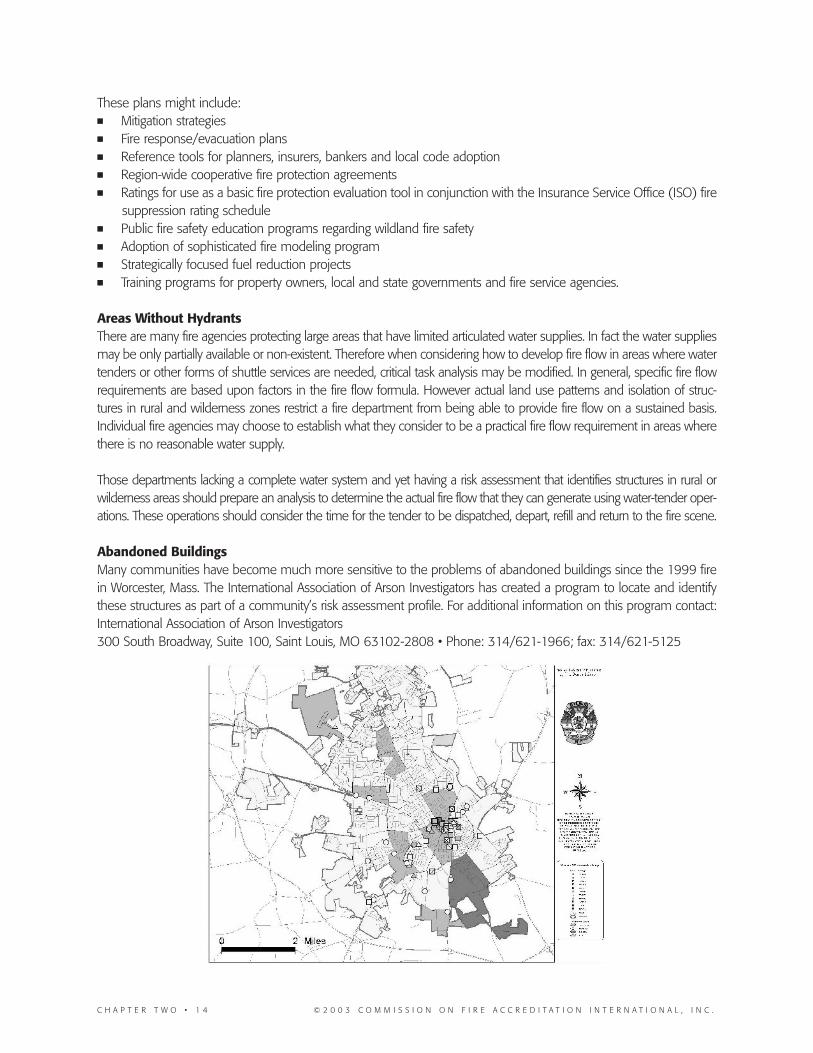
C H A P T E R T W O • 1 4 © 2 0 0 3 C O M M I S S I O N O N F I R E A C C R E D I T A T I O N I N T E R N A T I O N A L , I N C .
These plans might include:■ Mitigation strategies■ Fire response/evacuation plans■ Reference tools for planners, insurers, bankers and local code adoption■ Region-wide cooperative fire protection agreements■ Ratings for use as a basic fire protection evaluation tool in conjunction with the Insurance Service Office (ISO) fire
suppression rating schedule■ Public fire safety education programs regarding wildland fire safety■ Adoption of sophisticated fire modeling program■ Strategically focused fuel reduction projects■ Training programs for property owners, local and state governments and fire service agencies.
Areas Without HydrantsThere are many fire agencies protecting large areas that have limited articulated water supplies. In fact the water suppliesmay be only partially available or non-existent. Therefore when considering how to develop fire flow in areas where watertenders or other forms of shuttle services are needed, critical task analysis may be modified. In general, specific fire flowrequirements are based upon factors in the fire flow formula. However actual land use patterns and isolation of struc-tures in rural and wilderness zones restrict a fire department from being able to provide fire flow on a sustained basis.Individual fire agencies may choose to establish what they consider to be a practical fire flow requirement in areas wherethere is no reasonable water supply.
Those departments lacking a complete water system and yet having a risk assessment that identifies structures in rural orwilderness areas should prepare an analysis to determine the actual fire flow that they can generate using water-tender oper-ations. These operations should consider the time for the tender to be dispatched, depart, refill and return to the fire scene.
Abandoned BuildingsMany communities have become much more sensitive to the problems of abandoned buildings since the 1999 firein Worcester, Mass. The International Association of Arson Investigators has created a program to locate and identifythese structures as part of a community’s risk assessment profile. For additional information on this program contact:International Association of Arson Investigators300 South Broadway, Suite 100, Saint Louis, MO 63102-2808 • Phone: 314/621-1966; fax: 314/621-5125

© 2 0 0 3 C O M M I S S I O N O N F I R E A C C R E D I T A T I O N I N T E R N A T I O N A L , I N C . C H A P T E R T W O • 1 5
Mapping RiskWhen a fire department is attempting to define the risk, hazard and values that are at risk in the community, it mustconduct a comprehensive inventory of what it is protecting. In order to characterize risk, you need to discuss three dif-ferent levels. The first is underground risks to the community, i.e. pipelines, storm drains, etc. The second is what ison the ground that creates risk, i.e. ground covers, topography, geography and other elements that can either limit orexpedite response times.
Things such as traffic network design, topography, elevation, etc. can combine to create different forms of responsepatterns. The third characterization is structural and/or man-made environment that results in different kinds of prob-lems. This could be primarily the occupancies that are on the ground, but it would also include such things as utilitysystems, i.e. electrical power grids, as well as specific problems such as flammable liquid installations, lumber yardsand other types of outdoor exposure problems.
Risk characterization should move from simple to complex. The first paragraph should include defining the limitationsto the entity being evaluated. This would include borders, boundaries, contractual arrangements, etc. Using GIS, eachtheme should be kept separate from all other themes. This allows you to turn the themes off and on to describe dif-ferent characterizations of the problem. Another element of risk characterization is the experience that the communi-ty has faced in responding to calls for service. Once again the risk characterization should be broken down into typesof responses rather than treating them all as one. For example, there is a significant difference between the distribu-tions of public assists from emergency medical calls. For communities that still maintain fire alarm systems, perhapsthere is a need for a separate theme with respect to the activation of fire alarm systems.
Risk characterization is like using different colors to paint a picture on a canvas. If the risk characterization is overly sim-plified, it may result in an under estimation of the resource allocation required to protect it. On the other hand, if it isoverly complicated it may not allow policy makers to understand the relationship between resource allocation and riskmanagement in the community.
One point that needs to be defined clearly is that risk characterization does not mean you are predicting a loss. To thecontrary, risk characterization is designed to identify, display, and focus on specific types of risk so that it can be ade-quately protected. There are certain types of risk that cannot be entirely quantified. These might include aesthetics,loss of watershed, property depreciation and other forms of abstractions that emerge from a loss.

C H A P T E R T W O • 1 6 © 2 0 0 3 C O M M I S S I O N O N F I R E A C C R E D I T A T I O N I N T E R N A T I O N A L , I N C .
How many ways can GIS help in documenting and displaying information useful in mapping risk in a fire service agency?
1. Display of jurisdictional boundaries, including fire demand zones–GIS can display a theme (editable) with anunderlying database describing all of the appropriate information for each demand zone and jurisdictional area.
2. Layout of streets and local/state/federal highway network–GIS can display streets by type (streets are usually rep-resented by a line). These streets are accompanied by a data table with address ranges. Events or incidents,hydrants or other features can be added to the map display by entering an address. A point will be added alongthe street, which represents the address location.
3. Defining mutual and automatic aid zones–GIS can display a theme (editable) with an underlying table describ-ing all of the appropriate information for each mutual aid zone and/or automatic aid area.
4. Defining contract service areas–GIS can display a theme (editable) with an underlying database describing all ofthe appropriate information for contract for a service area.
5. Definitions of geographic planning zones–GIS can display all of the various land use areas, planning zones orother regulated use areas. These areas will contain tables with all of the appropriate information.
6. Locations of buildings and parcels–GIS can display all of the parcels within a jurisdiction along with all of the per-tinent ownership records in an associated table for each property–property values, ownership, property tax, etc.Building footprints can be displayed for each parcel. All of the appropriate information for each building can becontained in an associated table. Information and images such as blueprint drawings, building values, owners,etc., can all be associated with the building footprint on the GIS display.
7. Topographic features–Topographic features can be displayed in GIS. This can include slope, vegetation aspect,soils, rivers, earthquake faults, erosion zones, flood planes, etc.
8. Demographics–The demographics can be displayed by geographic area (block groups, ZIP code areas, etc.) Thiswould include income levels, ethnicity, age groups, etc.
9. Emergency responses–GIS can display emergency responses by placing a point on the address or geographic areawhere it occurred. The underlying table contains all of the associated information about each incident. By clicking on thepoint, information about the incident type, date and time, response units, damage, victims, etc., can all be accessed.
10. GIS can display travel times along a road network. The user can identify a point (station location) and determinethe shortest route to another location. GIS also can identify where a unit could travel within a specific time peri-od from a station in any direction.
11. Display of water systems–GIS can identify where a water system or network of pipes for petroleum or chemicalsreside within a geographic area. The pipeline can display valves, mains, shut-offs, supply points, etc. The under-lying table can contain information about pipe size, materials, directions of flow, etc.
12. Location of built-in fire protection devices–GIS can display all buildings and facilities that contain fire protectionsystems and devices. The underlying table can contain all of the information concerning the protection system—contact person, number of devices, types of devices by location within the facility, etc.
13. Locations of fully sprinklered buildings–GIS can display all of the buildings within a jurisdiction that contain sprin-klers. Blueprints can be linked to the building footprint with a complete diagram of the sprinkler system. The usercan easily access this information.
14. Locations of standpipe equipped buildings–GIS can display all buildings within a jurisdiction that contain stand-pipes. The user can display all of the relevant information concerning standpipes, including blueprints.
15. Local fire alarm buildings–GIS can display all of the alarm boxes or buildings with alarms within a jurisdiction. GIScan be linked to alarm systems and display the location of incoming alarm activation. Information about eachalarm, exact location, etc., can be contained in the underlying table.
16. Display of risk occupancy–GIS can display the locations of all types of risk occupancy including worst or maxi-mum, key or special, typical or routine, remote or isolated, along with all of the other important information asso-ciated with each occupancy.
17. Display of “hard to serve” areas–GIS can display all of the areas that are difficult to serve, because of factors such as one-way roads, long travel times, multiple addresses within a single building or other complications. The underlying table cancontain information describing why these areas are difficult to serve or actions necessary to reduce service time delays.

© 2 0 0 3 C O M M I S S I O N O N F I R E A C C R E D I T A T I O N I N T E R N A T I O N A L , I N C . C H A P T E R T W O • 1 7
18. Hazardous materials point locations–GIS can display locations where hazardous materials are present. Each loca-tion can be color-coded by degree of danger and underlying tables can contain all of the information about eachhazardous material, safety precautions and health hazards.
19. Hazardous materials transportation corridors–GIS can display (on top of the road systems/railroads or other topo-graphic features) where hazardous material transportation corridors exist. Pipelines that transport hazardous ortoxic materials also can be identified along with valves, direction of flow, etc. Underlying tables can contain all ofthe specific information concerning when a transportation corridor risk is highest, common types of materialstransported in each corridor, etc.
20. High EMS demand area–GIS can conduct an analysis of historic emergency EMS calls by geographic area. Thosegeographic areas with a high-call volume can be identified and compared to other important information demo-graphics, land use, etc., to determine possible relationships and mitigation strategies.
21. Assessed valuation (by category)–GIS can display assessed valuation classified by geographic areas, color-coded by valuation. Underlying tables can contain all of the information concerning the assessment, values,ownership, land use, etc.
22. Preplanned structure locations–GIS can identify by icon or color code those structures where preplans exist. Byclicking on the structure, all of the preplan information can be displayed. Floor plans, specific preplan actions, con-tacts, shut-offs, hazardous materials, etc., can all be accessed.
23. Fire prevention assignments–GIS can identify areas where specific fire prevention programs, compliance inspec-tions, fire prevention inspectors assigned by areas, etc. are in place. Underlying tables can identify specific pro-gram tasks, status of current program implementation, etc.
24. Arson/unknown fire locations–GIS can display known or historical arson areas, areas with criteria that meet arsonpotential, etc. Underlying tables can contain information concerning arson history, owners that have had multiplearson events, common arson devices, etc. GIS can also identify known arsonist address locations, method ofoperation and arson history.
25. Targeted occupancies for public education (by category)–GIS can display by color-coding or icons properties withoccupancy classifications that require particular fire prevention education programs. Underlying tables can iden-tify what programs have been completed, ownership of properties, etc.
26. EMS call demand by type–GIS can analyze and identify by area EMS call type and response time performanceaverages or response times for each call. Underlying tables can contain information about each EMS call, victim,date, time, etc.
27. Evacuation zone planning–GIS can analyze evacuation routes from specific areas, ideal shelter locations and other geo-graphic information about evacuation routes, shelters and maximum amount of traffic flow and shelter capacity.
28. Damage assessment modeling–GIS is ideal for conducting and displaying damage assessment related to disas-ters, fires or complex emergencies. After assessments are conducted, GIS can determine the total damage orloss by value, property type or other desired category.
29. Emergency inventory resource location–GIS can identify and display emergency supply locations by supplyneeds, distance, travel times, airport access, etc. Underlying tables can contain information about each emer-gency resource type, costs, handling procedures, etc.
30. Support for communication/dispatch function–GIS can identify where communication/dispatch backup locationsexist, where mobile dispatch centers can be deployed with maximum communication coverage, etc.
31. Display of external service agreement coverage area–GIS can display external service agreement area locations,classify them by type of agreement, and display other agencies that respond. Underlying tables can contain spe-cific information about each service agreement area.
32. Underground tanks–GIS can display underground tank locations, tanks with known seepage problems and tanksthat are abandoned or tanks scheduled for replacement.
33. Critical care facilities–GIS can display key community facilities such as hospitals, schools, blood banks, etc.Underlying tables can contain specific information concerning hospital trauma capabilities, areas suitable for stag-ing area implementation or incident command posts, etc.

C H A P T E R T W O • 1 8 © 2 0 0 3 C O M M I S S I O N O N F I R E A C C R E D I T A T I O N I N T E R N A T I O N A L , I N C .
SummaryOnce the hazard assessment is completed, it is possible to make better decisions with respect to improve resourcedeployment plans and determine staffing levels. It is also possible that risk assessment may point to code amendmentsthat are needed to mitigate a particular problem. As you review the flow chart for the standards of response coveragemodel, you will note that risk assessment is not only the first step of this process, but that it must be re-visited fromtime to time to determine if the deployment plan is consistent with the growth and development of the community.

© 2 0 0 3 C O M M I S S I O N O N F I R E A C C R E D I T A T I O N I N T E R N A T I O N A L , I N C . C H A P T E R T H R E E • 1
CHAPTER THREEUSE OF RISK INFORMATION
OverviewOnce agencies have performed a risk categorization of the occupancies in the area, have examined their EMS risk andthen looked at other miscellaneous requirements in a systematic fashion, they should have identified all of the localfactors that increase or diminish their risk. The risk assessment model assumes that in every community the ratio ofrisks will be different. In general, it is anticipated that in most communities the vast majority of the risk will fall into themoderate category with smaller percentages being distributed among the low probability quadrants.
The majority of fire service concern should be directed toward the development of effective fire defense strategies foroccupancies that fall into the high probability-high consequence category, while at the same time preparing to deal withlow probability – high consequence events. As stated earlier distribution of fire companies assures wide-spread initialattack resources, but concentration of values requires an effective response force that is matched with that risk
It is envisaged that many fire agencies will continue to send more than the basic number of apparatus appropriate toa maximum risk at specific locations. Compliance with the basic concepts of the risk assessment, distribution of com-panies for initial response capability, concentration of companies for response effectiveness, plus an evaluation ofresponse reliability places a burden upon smaller agencies with large fire flows. Others can meet it readily. The eco-nomics of trying to adhere to all of these principles simultaneously can be a burden and problematic to agencies withlimited financial resources. Those small agencies with large fire flows or life safety occupancies are even further hand-icapped in achieving effective use of these principles.
The issue is that an organizational strategy to achieve an adopted level of service is very important to the credibility ofany fire organization. The risk levels in one community may be based on structural conditions only. However, there ismore than one way to assess risk. For example, an agency that has watershed fire fighting responsibilities may haveto define their risk on the basis of topography, fuel cover, and weather conditions. An area with a wildland-urban inter-face may require risk assessment that combines structural conditions with ground cover areas. Another communitymay have an airport, a harbor or a major industrial complex.
Staffing configurationJust as there are many different types of fire fighting agencies, there are also many different ways in which fire fight-ing apparatus will be staffed. The term for this is crew configuration. Crew configuration consists of the determinationof the number of people that will be on a piece of apparatus so that it can perform effectively and a statement ofhow that crew will be assigned to that apparatus when an event occurs.
History indicates that most fire departments start off as totally volunteer. That concept is at the heart of local govern-ment for the creation of frontier-type communities. However, it is of limited value once a fire department begins toexpand and grow. As stated in the sections of triggers and thresholds, it is clear that the community expectation of thestaffing of a fire department is based upon a perception of what kind of service level will be distributed when a per-son calls for help in an emergency.
In contemporary literature there is quite a bit of discussion about the concept of how crews are actually provided. Forexample there is a discussion today with respect to what is defined as a totally paid fire department versus a totallyvolunteer fire department. The literature is somewhat silent on some of these issues. The purpose of this section isto provide some guidance for organizations that are preparing their self-assessment document so that they candescribe their crewing configuration using standardized language.

C H A P T E R T H R E E • 2 © 2 0 0 3 C O M M I S S I O N O N F I R E A C C R E D I T A T I O N I N T E R N A T I O N A L , I N C .
Totally VolunteerA totally volunteer fire organization is a legitimate fire organization. The reasons for the staffing and crew configurationbeing based on volunteerism are a function of many variables including the community’s history and financial struc-ture. The term volunteer, however, should be reserved for those individuals who receive no compensation for per-forming their services as fire and emergency service personnel. The term volunteer excludes individuals who wouldreceive any periodic stipends for out-of-pocket expenses, i.e. clothing, fuel for vehicles and other predetermined costs.If an individual receives compensation on an hourly or a point system that is based upon training hours or actualresponse, then they are really paid-on-call. Volunteers may be recalled immediately as in a totally volunteer depart-ment. Or they may be recalled upon demand as in a combination department.
Paid-On-CallPaid-on-call is a term to be applied to any individual who is part of a crewing configuration in which they are paid inan hourly wage for a response to provide coverage on an apparatus. The paid-on-call individual is distinct from a vol-unteer in that the system is designed to reward the individual for a high level of participation in staffing a fire com-pany under specific conditions. Generally speaking, paid-on-call people are recalled instantly in the event of an oper-ational need.
Reserve FirefighterReserve firefighter is a term that is a more finite description of a paid-on-call firefighter. A reserve firefighter is an indi-vidual who is trained to meet minimum requirements with the department and also is allowed to perform ridealongs and participate in various forms of activity and be compensated on an hourly basis. The biggest distinctionbetween a paid-on-call and a reserve firefighter is that reserves may not be called for additional attack purposes.Generally speaking, they are reserved for larger staffing problems and/or used to assist in non-fire operation activi-ties such as fire prevention, public education, etc.
Full-Time FirefighterA full-time firefighter is an individual who has been tested, selected and appointed to a fire fighting agency andreceives a monthly compensation for his/her services. A full-time firefighter is classified as those individuals who aresubject to the Fair Labor Standards Act and are considered to be a full-time equivalent in a budget document.
Based upon the previous definitions, the crew configuration of a specific fire department may consist of one or moreindividuals who meet the different criteria. For example, in a totally volunteer fire department, no one is compensat-ed. However, in many communities the minute the fire department reaches a certain level of emergency responseactivity, it is not uncommon for that same department to maintain a volunteer cadre and to hire full-time personnelto perform specific functions, such as apparatus operator.
Not uncommonly many volunteer fire departments will select a full-time fire chief, full-time fire marshal and even a full-time training officer before they relinquish the crew configuration on the apparatus to any full-time personnel. In describ-ing a service level in a standard of response coverage document, crewing configuration is a reflection of essentially twothings. The first of these is the number of people that is required to be on a specific piece of apparatus before it isallowed to function. Second is the manner and method in which those personnel are put on the apparatus to respond.
Using the previous example, a fire department may classify itself as a mostly volunteer fire department if in fact theapparatus will not respond to the scene until it is staffed with a minimum number of volunteers leaving the station.This crew configuration has a direct relationship to response time. It is clear that in a totally volunteer fire department,there is a lengthier turnout time then there would be with a full-time equivalent. The key to defining a service levelwith a totally volunteer fire department is an accurate assessment of the actual turnout time it takes to staff the com-pany after the alarm has been given. Utilizing sirens, pagers and other forms of notifications, many volunteer fire

© 2 0 0 3 C O M M I S S I O N O N F I R E A C C R E D I T A T I O N I N T E R N A T I O N A L , I N C . C H A P T E R T H R E E • 3
departments have fairly rapid turnout times. In more rural areas and specifically in very low density areas, turnout timeis often longer than the travel time. This is based on the assumptions that it takes a certain number of minutes to getpersonnel to the station before they can begin their response.
The crew configuration that allows a full-time person to drive an apparatus to the scene and then have the volunteersrespond directly to the scene meets a different criterion. This type of department, while it has the outward appearanceof being a volunteer department, is actually a combination department. A combination configuration consists of anystaffing scenario in which a person is in the station to respond with the equipment without having to rely on meetingminimum staffing with volunteers, i.e. an engine company receives the alarm, responds to the call and then has the vol-unteers respond to the location.
A second iteration of combination departments is very common in transitional organizations. This is when there isminimum staffing on an engine company and they handle routine emergencies without recall of the other designat-ed personnel, i.e. volunteers, paid-on-call or reserves. This type of configuration is classified as the initial attack and isprimarily paid, but the effective response force is recalled. This pattern is not uncommon in departments that havean EMS function and do not utilize their volunteers for that type of incident.
The key to this type of organization is the condition under which the incident commander and/or the dispatch cen-ter make a decision to recall personnel. For example, with this crew configuration there are departments that giveauthority to the fire officer on duty to recall personnel if he or she believes the incident will require additional resources.Other departments have a fixed criterion that if the incident is a medical aid, there is no recall; but if it is a structurefire or wildland fire (under certain conditions) the recall occurs simultaneously.
Full-time staffing configuration is essentially determined when an organization does not have any recall capacity at all,i.e. it is moved from a combination department to a fully staffed organization. The key among the issues of determin-ing whether a department must be a full-time fire department is determined by the hazards and values at risk. Moreover,workload often will determine when a department will be able to sustain any other form of crew configuration.
Finally, in the area of crew configuration, the type of fire agency also will make some determination as to how thecrew is configured. For example, a crew that is responding to an aircraft crash scenario or a shipboard fire in a harboror port and/or a wildland fire agency may have different kinds of staffing configurations, depending upon their mis-sions and specific assignment.
When providing documentation on standards of response coverage, fire departments should give consideration towriting a single paragraph that describes their configuration, i.e. a brief description of how that fire truck is going to getout of the fire station and begin the response to comply with the department’s response time goals.
Community Size and ScopeIt has been stated that there are about 33,000 fire departments in the United States. These departments are all dif-ferent sizes and compositions. The community size and scope often place direct demand upon the department withrespect to community expectations. The following terms are used to describe the type of community when deter-mining variables in risk, value and expectation:
■ Urban population–usually used to describe dense, fully developed areas with a high density of permanentor transient population. Density of 1,500 persons per square mile and higher. High number of buildings persquare mile. Closely gridded street network. Limited open space, manufacturing facilities. Usually concentrationsof mid- and high-rises. Common core locations that include transportation hubs. Usually more than 250,000population. High per capita tax base. In International City/County Management Association annual report iden-tified by both size and budget expenditures.

C H A P T E R T H R E E • 4 © 2 0 0 3 C O M M I S S I O N O N F I R E A C C R E D I T A T I O N I N T E R N A T I O N A L , I N C .
■ Suburban–usually used to describe areas with mixed occupancy, average to high density populations, typicallyfringed around heavily urban areas. Population density between 500 and 1,500 persons per square mile.Moderate number of buildings per square mile. Gridded streets and existence of cul-de-sac, dead-end residen-tial development. Gated communities. Open space, green areas, mid rise, low rise. Limited high rise. Industry andcommercial development. Accessed by limited access highways and freeways. When population is predominantlyresidential, commonly have strip malls and “brand boxes.” These are franchised buildings such as fast food restau-rants, or “big boxes” such as the various warehouse type retail businesses. Budgets usually based on propertyand sales tax. Moderate tax bases, unless areas of affluence with high assessed valuation. Listed in ICMA annu-al report as cities from 50,000 to 250,000.
■ Rural–usually used to describe areas with large open spaces, low to moderate population densities, typicallyremote from other areas, normally covered by fire districts as opposed to municipalities. Residential occupanciespredominate, agricultural businesses, service businesses.
■ Frontier–used to describe areas that are remote from any significant development, usually limited road network,long response times in excess of 15 minutes.
Community ExpectationSetting expectations after risks have been identified is part art, science and politics. The previous discussion of staffingis a part of establishing community expectations. Once a thorough evaluation and categorization of risks has beencompleted, it is expected for the fire department to start reviewing outcomes of an emergency that occurs in any givenrisk category. The science part is knowing what has been the extent of historical problems for each risk type in thecommunity and the historical outcomes. Were the outcomes acceptable to the fire department, elected officials andcommunity? The phrase “closing the barn door after the horse is stolen” applies to many communities after sufferinga severe fire or EMS loss. The art and politics steps are necessary to blend historical experience with current expec-tations, ability to pay and political willingness to see the policy carried out.
Remember the standard of cover process is a loop – if after setting risk category expectations, the resultant responseplan is not affordable, the community’s elected leaders might be forced to lower expectations or find an alternativeway to pay for the response resources.
Many communities can start with these general expectations that cross all risk levels or types. The fire fightingresources that are deployed in the community should be able to:
a. Stop the escalation of the emergency when found.b. Respond with enough resources to handle typical emergencies per risk category without routinely calling for
greater alarms or mutual aid.c. For EMS and specialty rescues, arrive before brain death occurs in a full-arrest and be able to extricate and
transport trauma patients to a designated trauma center within 60 minutes of the accident occurring.d. For hazardous materials incidents, be able to identify the hazard, implement a program to protect nearby
workers and/or citizens, stop the leak or spill and be able to clean up or supervise the clean-up of the inci-dent with the assistance of industry.
Sample Expectation StatementsSome sample expectations that could be developed based upon RHAVE Structure Fire Risk Category could be:

© 2 0 0 3 C O M M I S S I O N O N F I R E A C C R E D I T A T I O N I N T E R N A T I O N A L , I N C . C H A P T E R T H R E E • 5
Maximum Risk–OVAP Score 60+
Objective–to stop escalation of a major fire when found. Typically this means conducting a search and rescue for anyvictims, confining the fire damage to the floor of origin, plus limiting heat and smoke damage to the area or floor offire origin. The tasks of rapid intervention rescue for trapped firefighters, property salvage, and crew rotation with reha-bilitation requires additional personnel on a fire scene in this risk category.
Significant Risk–OVAP Score 40-59
Objective–to stop escalation of a serious fire when found. Typically this means conducting a search and rescue forany victims, confining fire damage near the room of origin, plus limiting heat and smoke damage to the area or floorof fire origin. The tasks of rapid intervention rescue for trapped firefighters, property salvage, and crew rotation requireadditional personnel on a fire scene in this risk category.
Moderate Risk–OVAP Score 15-39 (also known as typical or average)
Objective–to stop the escalation of a minor fire when found. Typically this means conducting a search and rescue forany victims, confining the fire damage to the room of origin, plus limiting heat and smoke damage to near the roomof fire origin. The first arriving unit is capable of starting rescue work or advancing a first line for fire control. The sec-ond engine and truck company provide additional personnel for tasks already started plus ventilation, salvage, andother work as necessary.
Low Risk–OVAP Score < 15
Objective–to stop the escalation of a minor fire when found. Typically this means conducting a search and rescue forany victims, confining the fire damage to the room of origin, plus limiting heat and smoke damage to near the roomof fire origin. The first arriving unit is capable of starting rescue work or advancing a first line for fire control. The sec-ond engine and truck company provide additional personnel for tasks already started, plus ventilation, salvage andother work as necessary.
Wildland Interface Zone, Maximum Risk
Objective–to stop escalation of a major fire where found. Typically this means controlling the fire to the area of ori-gin, on a high fire danger day without spread to adjacent structures or escalating to a size requiring significant addi-tional resources (including mutual aid).
Wildland Interface Zone, Significant Risk
Objective–to stop escalation of a serious wildland fire when found. Typically this means controlling the fire to the area oforigin without spread to adjacent structures or escalating to a size requiring additional resources (including mutual aid).
Wildland Interface Zone, Moderate Risk
Objective–to stop escalation of an initial wildland fire when found. Typically this means controlling the fire to the areaof origin without spread to adjacent structures.

C H A P T E R T H R E E • 6 © 2 0 0 3 C O M M I S S I O N O N F I R E A C C R E D I T A T I O N I N T E R N A T I O N A L , I N C .
Wildland Interface Zone, Low Risk
Objective–to stop escalation of a small (minor) wildland fire when found. Typically this means controlling the fire to theimmediate area of origin without the fire growing, endangering property or requiring significant response resources.
Special Risks
Objective–to stop escalation of a serious fire, rescue, or hazardous materials emergency where found. Typically thismeans controlling the fire to the area of origin without spread to adjacent structures, rescuing trapped citizens, or stop-ping the spread of a hazardous materials release.
EMS ExpectationsFire continues to grow until enough water can be applied to contain, control, and extinguish it. In medical emergen-cies, trained personnel must arrive and intervene appropriately before damage from the medical complaint becomesirreversible. In other words, stop the escalation of a medical emergency beyond the level of severity found at arrivalof fire department personnel.
For medical aid calls response time performance requirements must take into account the most time-sensitive chiefcomplaints. Time sensitivity is a description of the relationship between elapsed time and increases in patient mor-bidity and mortality. In the case of cardiac arrest, the absence of blood flow to the brain results in irreversible braindamage within four to six minutes. Thus, cardiac arrest is by far the most time-sensitive emergency. Providing car-diopulmonary resuscitation (CPR) and defibrillation in the shortest elapsed time has a direct correlation with improvedpatient functionality and decreased mortality. The danger of using cardiac arrest to drive system response time per-formance goals lies in the fact cardiac arrest is only approximately 1.5 percent of the total EMS call volume.
For medical emergencies, a prompt response is needed to relieve suffering and save lives, but few calls for serviceare true life or death emergencies. Again, a reasonable service goal is to be on scene soon enough to: 1) assesspatients and prioritize care to minimize death and disability, 2) intervene successfully in life-threatening emergencies,3) stabilize patients to prevent additional suffering. Typically this means providing basic defibrillation or advanced lifesupport and minor rescue as necessary for one to three patients.
Emergency Medical Service, Moderate Risk
Objective–to stop escalation of a medical emergency where found. Typically this means providing basic or EMT-defib-rillation or advanced life support and/or minor rescue as necessary for three or fewer patients.
SummaryThe establishment of performance measures and the measurement of capability is one of the most critical aspectsof assuring that standards of cover are consistent with local needs. The decision on how to staff a department andthe policy questions on station location are all linked to this concept. Because of the wide variety in community typeand size, standards of response cover should be established based upon local conditions. Fire officials should estab-lish performance statements and have them adopted. This provides a baseline for consideration in evaluating theeffectiveness of the overall department.

© 2 0 0 3 C O M M I S S I O N O N F I R E A C C R E D I T A T I O N I N T E R N A T I O N A L , I N C . C H A P T E R F O U R • 1
CHAPTER FOURDESIRED OUTCOMES
Setting Performance MeasuresThe next step in the standard of response cover process involves setting performance measures based on risk andoutcome expectations, from which station coverage areas can be designated. Setting performance measures is easyto say, harder to do properly. The fire service must understand all of the elements of time from before the incidentstarts until final mitigation, plus know how to construct valid measures.
The Relationship Between Fire Behavior and Response TimeFirefighters meet a wide variety of conditions at each fire. Some fires will be at an early stage and others may alreadyhave spread throughout the entire building. This variation in conditions complicates attempts to compare fire depart-ment capability. A common reference point must be used so that the comparisons are made under equal conditions.
When conducting fire station location and apparatus staffing studies, the flashover point, the significant threat to lifeand property, is the event that the service level is intended to prevent from occurring. From an emergency medicalperspective, the six-minute time frame is used as a means of service level measurement, as brain damage is very like-ly in cardiac arrest patients after six minutes without oxygen flow to the brain.
Fire suppression tasks that are required at a typical fire scene can vary a great deal. To save lives and limit propertydamage, fire companies must arrive within a short period of time with adequate resources to do the job. Matchingthe arrival of resources with a specific point of fire growth is one of the greatest challenges for chief fire officers today.
Dynamics of Fire Growth and FlashoverThe answer for controlling the variation in the fire dynamics lies in finding a common reference point, something thatis common to all fires regardless of the risk level of the structure, the material or the time the fire has burned. Sucha reference point exists. Regardless of the speed of growth or length of burn time, all fires go through the same stagesof growth. And, one particular stage emerges as a very significant one because it marks a critical change in conditions.It is called flashover. The flashover stage of a fire marks a big turning point in fire conditions that escalates the chal-lenge to a fire department's resources.
Smoldering Stage—This is the first stage of any fire. When heat is applied to a combustible material, the heat oxidizesthe material's surface into combustible gases. The oxidation process is exothermic, meaning that the oxidation processitself produces heat. The heat from oxidation raises the temperature of more material, which increases the rate of oxi-dation and begins a chemical chain reaction of heat release and burning.
A fire can progress from the smoldering phase immediately or slowly, depending on the fuel, nearby combustiblesand the surrounding air. For example, a wad of newspapers will smolder only a few seconds before progressing tothe next stage, but a couch with a burning cigarette may continue smoldering for more than an hour.
Incipient Stage—When the temperature gets high enough, flames can be seen. This stage is called incipient or openburning. The visible burning at this stage is still limited to the immediate area of origin. The combustion process con-tinues to release more heat, which heats nearby objects to their ignition temperature, and they begin burning.
Flashover—Not all the combustible gases are consumed in the incipient stage. They rise and form a superheated gaslayer at the ceiling. As the volume of this gas layer increases, it begins to bank down to the floor, heating all com-bustible objects regardless of their proximity to the burning object.

C H A P T E R F O U R • 2 © 2 0 0 3 C O M M I S S I O N O N F I R E A C C R E D I T A T I O N I N T E R N A T I O N A L , I N C .
FlashoverThe following discussion describes why flashover is such a significant fire event and explains why preventing this stageof fire behavior is appropriate for evaluating fire department capability.
Fire department performance capability is easy to measure, but at the same time difficult to interpret. Specific per-formances are not difficult to record. Travel time data will show how long it will take to get fire companies to a fire atpoint X. Likewise, fireground tasks such as operating an attack line or raising ladders are easy to measure. But thesemeasurements alone do not indicate what can be accomplished in the time frames recorded. More knowledge isneeded before concluding what the fire companies are capable of when they get to a fire.
Two significant factors that must be known are:■ The threat of the fire—Is it small and isolated from other combustible material? Are occupants trapped by smoke
or flames? How fast is it growing?
■ The number of fire suppression tasks involved—A small fire with little smoke might require only a few firefightersto extinguish it and remove smoke from the building. A larger fire will require a greater number of firefighters,and a fire where lives are threatened will require still greater numbers of firefighters.
To make valid comparisons of fire department capability, the comparisons must evaluate the variation in the fire threatfactor and the fireground task factor. The dynamics of fire growth interrelate with various configurations of fire stationlocation, built-in fire protection and staffing patterns as a result of different scenarios of fire growth. The fire suppres-sion tasks that are required at a typical fire scene vary a great deal depending upon risk level. Fire companies mustarrive at the right time, with adequate resources to do the job to save lives and limit property damage. Matching thearrival of resources with a specific point of fire growth is one of the greatest challenges to fire managers.
Fire Behavior FactorsIn a typical structure fire, the gas layer at the ceiling can quickly reach 1,500 degrees Fahrenheit. As the gas layermoves down, it begins heating combustible objects in the room to their ignition temperature. The gas layer is most-
Time
History of Fire
Tem
pera
ture
in D
egre
es F
aren
heit
1600
1400
Ignition
Ope
n Fl
ame
Flas
hove
r1200
1000
800
600
400
200
0A B C FED
The "Critical" Period
The Critical Period

© 2 0 0 3 C O M M I S S I O N O N F I R E A C C R E D I T A T I O N I N T E R N A T I O N A L , I N C . C H A P T E R F O U R • 3
ly carbon monoxide, so the absence of oxygen prevents the heated objects from bursting into flame. Oxygen getsintroduced in two ways. There is often enough available oxygen near the floor level to start the open burning processwhen the gas layer reaches that level.
Or, the high heat breaks a window and the incoming oxygen allows the burning to begin. It should be noted that theroom becomes untenable long before flashover. Even though open flaming may not be present until everythingreaches 500 degrees Fahrenheit and oxygen is introduced, the room becomes untenable for human survival at 212degrees Fahrenheit. When flashover occurs, everything in the room breaks into open flame at once. The instantaneouseruption into flame generates a tremendous amount of heat, smoke and pressure with enough force to push beyondthe room of origin through doors and windows. The combustion process then speeds up because it has an evengreater amount of heat to move to unburned objects.
Flashover is a critical stage of fire growth for two reasons. First, no living thing in the room of origin will survive, so thechance of saving lives drops dramatically. Second, flashover creates a quantum jump in the rate of combustion, anda significantly greater amount of water is needed to reduce the burning material below its ignition temperature. A firethat has reached flashover means it is too late to save anyone in the room of origin, and a lot more staffing is requiredto handle the larger hose streams needed to extinguish the fire. A post-flashover fire burns hotter and moves faster,compounding the search and rescue problems in the remainder of the structure at the same time that more fire-fighters are needed for fire attack.
The Significance of FlashoverPre-Flashover: . . . . . . . . . . . . . . . . . . . . . . Post-Flashover:Limited to one room. . . . . . . . . . . . . . . . . . . . May spread beyond one roomRequires smaller attack lines . . . . . . . . . . . . . Requires more and larger attack linesSearch and rescue is easier . . . . . . . . . . . . . . Compounds search and rescueInitial assignment can handle. . . . . . . . . . . . . Requires additional companies

C H A P T E R F O U R • 4 © 2 0 0 3 C O M M I S S I O N O N F I R E A C C R E D I T A T I O N I N T E R N A T I O N A L , I N C .
To summarize the above, clearly the stage of a fire affects staffing and equipment needs. Both of these needs can bereasonably predicted for different risk levels and fire stages. The ability to correlate staffing and equipment needs withfires according to their stage of growth became the basis for a response coverage study by a fire agency.
It is unreasonable to expect a fire department to reach all fires before flashover, even the most heavily staffed andequipped department. It is also unrealistic to expect every fire to be at flashover when a fire truck arrives. As for the rea-sonable number of fires that an effective response force should reach before flashover, the following point must bekept in mind. Given that some fires will reach flashover before the fire department can respond—either because thematerials involved are very volatile, because the fire was accelerated with flammable liquids, or because the fire wentunreported—it is unreasonable to expect the fire department can save every life or stop all significant property loss.
EMS Time Benchmarks and ExpectationsCardiac Arrest Response Time PerformanceThere is little doubt strict cost-benefit analysis would dictate most cardiac arrest resuscitation efforts be abandonedbecause of the inexorable decline in survivability as time passes. However, this strategy would be difficult to defendmorally given public expectations and the value our society places on each and every life. Nevertheless, the cost ofdeploying resources capable of meeting clinical response time guidelines is significant. Add in intensive care, rehabil-itation, and long-term quality-of-life effects and the cost becomes very significant. However, the hidden costs of notdeploying resources to treat cardiac arrest effectively in the field would likely include litigation and political upheaval.
Ultimately, policy makers must balance public expectations with alternative uses of public funds to provide essentialservices. The difficulties in forwarding policy decisions contrary to popular opinion lie in public perceptions regardingquality of service. A faster-is-better mentality, which is clinically justified for some medical and traumatic conditions,often becomes the exclusive determinant in the public’s perception of the quality of public safety services.
The reference to litigation is one consequence of ignoring published standards of practice. While there are recommend-ed response time performance goals for specific types of medical conditions, a system-wide, empirically supported
Time in Minutes
Flashover - Too Late
Time Versus Products of CombustionNOTE: All Times are Based Upon National Averages
Prod
ucts
of
Com
bust
ion
0 1 2 3 4 5 6 7 8 9 10
Fire GrowthUnrestricted
Firefighters open hoze nozzle now
Fire Growth Restricted
Fighting FireResponse to FireDirection of Fire
Reportof Alarm
Dispatch Setup
Fire Growth Restricted
Stan
dard
Spr
inkl
er A
ctiv
ates
Resi
dent
ial S
prin
kler
Act
ivat
esSm
oke
Det
ecto
r So
unds
Ala
rm
Time directly manageable by Fire DepartmentTimes Varies

© 2 0 0 3 C O M M I S S I O N O N F I R E A C C R E D I T A T I O N I N T E R N A T I O N A L , I N C . C H A P T E R F O U R • 5
response time recommendation has yet to be published. The problem lies in the recommendations published by var-ious authorities. These recommendations do not present cost-benefit analyses to justify EMS expenditures. In theabsence of such data, EMS providers and system administrators are tasked with being responsive to published guide-lines until such time empirical data demonstrates otherwise. In light of this, EMS agencies seeking to respond differ-ently from existing convention must justify changes in system response time standards.
While the basis for eventual changes should be predicated on clinical research, there are societal and operationalissues driving designs of EMS systems. As society becomes more specialized and interdependent, the need for stan-dardization grows. The creation of standard operating procedures helps ensure consistency and provides a basis formonitoring and measuring organizational activities. Standards must be the product of scientific research to ensure poli-cies and procedures enhance quality of service.
Response time performance and its relationship to cardiac arrest survival is the result of hundreds of large and small stud-ies. Recommendations regarding effective response force for fires have been developed through ongoing analysis of thephysical properties of combustion. Recommendations regarding response times and effective response are based on sci-entific and operational research. Thus, an organization making a commitment to adopt an industry best practice can:
■ Scientifically defend their position and work toward further refinement of the standards■ Measure and compare outcomes■ Establish accountability: individually, organizationally, and socially■ Provide the basis for incremental improvements through operational performance objectives■ Use probability to determine the likelihood of catastrophic system failure as part of cost/benefit analysis.
Published EMS Standards and Guidelines“Ensuring Effectiveness of Community Wide Emergency Cardiac Care.” JAMA; Oct. 28, 1992. Vol. 268, No. 16. Followinga careful review of current medical literature related to emergency cardiac care, the American Heart Association, in con-cert with clinicians, administrators, and researchers, published a series of guidelines in the Journal of the AmericanMedical Association (JAMA). While many recommendations found in the article are already in this report, the materialworth noting here discusses documentation of time intervals and use of non-professionals equipped with AEDs.
The article recommends using the Utstein reporting criteria for outcomes research and capture of the following time stamps:
■ Time call for help is received■ Time emergency vehicle is dispatched■ Time first response vehicle stops at scene■ Time cardiac arrest is confirmed (If EMDs began phone-directed CPR, time should be noted)■ Time bystander CPR is initiated■ Time of first defibrillation shock■ Time each treatment is provided■ Time patient arrived at emergency department■ Time death is declared.

C H A P T E R F O U R • 6 © 2 0 0 3 C O M M I S S I O N O N F I R E A C C R E D I T A T I O N I N T E R N A T I O N A L , I N C .
Recording the time stamps recommended in the JAMA article would enable departments to present a more accuratepicture of how changes in the EMS system affect cardiac arrest survival. In addition to time stamps, the article dis-cusses the importance of early defibrillation. The JAMA article recommends the automatic external defibrillator be atthe patient’s side in four minutes or less after the call to 9-1-1.
The article goes on to say:
“Early defibrillation is the link in the chain of survival most likely to improve survival. The placement of auto-mated external defibrillators (AEDs) in the hands of large numbers of people trained in their use may bethe key intervention to increase the survival chances of out-of-hospital cardiac arrest patients.”
With this in mind, the American Heart Association proposed the use of AEDs by trained lay people.
California EMS Systems Standards and Guidelines. EMSA 101; June, 1993. Designed as guidelines for local EMSauthorities, Section D—Response/Transportation, subsection 4.05 of the guidelines states:
Each local EMS agency shall develop response time standards for medical responses. These standardsshall take into account the total time from receipt of the call at the primary public safety answering point(PSAP) to arrival of the responding unit at the scene, including all dispatch intervals and driving time.
Further elaboration in subsections a through d states: Emergency medical services areas (response zones) shall bedesignated so that, for ninety percent of emergency responses:
a. Response time for a basic life support and CPR-capable first responder does not exceed:Metro/urban–five minutesSuburban/rural–15 minutesWilderness–as quickly as possible
Events Associated with Cardiac Arrest Resuscitation AttemptsRevised Date 27 March, 1991
Recommended coretime to record
Supplemental times torecord if possible
Collapse/Recognition
First CPR-Bystanders
Dispatch Call Receipt
Vehicle Moving
Vehicle Stops
Personnel at Patient's Side
First CPR-EMS Personnel
First Defibrillatory Shock
Intubation Achieved
ROS Ventilation
IV Access Achieved
Departure from Scene
Arrival at EM Department
ROS Circulation
CPRAbandoned Death
Medications Administered
Early Access
Early CPR
Early ACLS
Early Defib

© 2 0 0 3 C O M M I S S I O N O N F I R E A C C R E D I T A T I O N I N T E R N A T I O N A L , I N C . C H A P T E R F O U R • 7
b. Response time for an early defibrillation-capable responder does not exceed:Metro/urban–five minutesSuburban/rural–as quickly as possibleWilderness–as quickly as possible
c. Response time for an advanced life support capable responder (not functioning as the first responder) does not exceed:Metro/urban–eight minutesSuburban/rural–20 minutesWilderness–as quickly as possible
d. Response time for an EMS transportation unit (not functioning as the first responder) does not exceedMetro/urban–eight minutesSuburban/rural–20 minutesWilderness–as quickly as possible.
EMS Response Intervals: EMDAC Position Paper. Emergency Medical Directors’ Association of California; 1998.Following the release of the 1993 California EMS Systems Standards and Guidelines, the Emergency MedicalDirectors’ Association of California (EMDAC), an association of medical directors of emergency medical services sys-tems and agencies, published a position paper in 1998. The purpose of the paper was to review the medical litera-ture since the release of the Emergency Medical Standards Agency (EMSA) standards document and clarify the clin-ical ramifications of response time performance objectives.
Referring to a widely cited study published in JAMA in 1979, the position paper points out the results of the JAMAstudy have been misinterpreted and led to response time performance standards inadequate to ensure appropriateclinical treatment of cardiac arrest.
The relation of timing to two key resuscitation efforts, CPR and defibrillation, is illustrated in the following table:
Collapse Collapse Probability to CPR to Defibrillation of Survival≤ 5 . . . . . . . . . . . . . . . . . . . . . . . . ≤ 10 minutes . . . . . . . . . . . . . . . . . . . . . . 37%≤ 5 . . . . . . . . . . . . . . . . . . . . . . . . > 10 minutes . . . . . . . . . . . . . . . . . . . . . . 7%> 5 . . . . . . . . . . . . . . . . . . . . . . . . ≤ 10 minutes . . . . . . . . . . . . . . . . . . . . . . 20%> 5 . . . . . . . . . . . . . . . . . . . . . . . . > 10 minutes . . . . . . . . . . . . . . . . . . . . . . 0%
The EMDAC position paper states, “defibrillation within 10 minutes of patient collapse is an achievable goal in urbansystems.” However, EMDAC is quick to point out system performance standards must concisely articulate which acti-vation, response, and treatment steps are included in the response time intervals. The paper goes on to say “[A]llow-ing for a two-minute interval from collapse to 9-1-1 activation, the time from receipt of call to defibrillation should notexceed eight minutes. A five-minute response interval [or total reflex time] will allow three minutes to locate and assessthe patient, apply the defibrillator, allow the device to detect ventricular fibrillation and deliver the shock [defibrillate].”
Previous studies looking at the time to deliver a shock to the patient found at “the 90th percentile, vehicle-at-sceneto defibrillation interval has been reported to be a minimum of three-six minutes.” In other words, two minutes fordetection (collapse to 9-1-1 activation), five minutes total reflex time (call processing, turnout, and travel times), andat least three minutes for set up (find patient, prepare equipment, verify fibrillation, and first shock) for a total of atleast ten minutes from collapse to first defibrillation shock.

C H A P T E R F O U R • 8 © 2 0 0 3 C O M M I S S I O N O N F I R E A C C R E D I T A T I O N I N T E R N A T I O N A L , I N C .
The EMDAC paper concludes with the following recommendation regarding response time performance:
Current best medical evidence suggests that response time intervals, measured from the time of firstring at the primary PSAP until arrival at the scene should be five minutes for responders capable of per-forming CPR and defibrillation, 10 minutes for providers capable of performing ALS, and 12 minutes fora transport-capable vehicle.
While the shortest possible response times create the highest probabilities of resuscitation, system costs are signifi-cant. The charge of public policy makers and system oversight agencies is to determine the most cost-effective blendof system resources to obtain the best possible outcomes.
The EMDAC paper discusses other patient chief complaints that would benefit from prompt medical treatment.Examples include upper airway obstructions, acute asthma, pulmonary edema, and anaphylaxis. In these cases,although ALS field treatment has been shown to be beneficial, “No published study has demonstrated a response-time related outcome effect in these conditions.”
Nontraditional EMS ResponseTraditionally, the public education efforts of most fire departments have been a prevention strategy versus an inter-vention strategy (with the exception of CPR and programs such as the Juvenile Fire Setter). And there is little doubtregarding the competency of the fire service to conduct these activities, given the success of fire prevention. Thedepartment’s choice to employ a process of incremental improvement toward a goal of service delivery times thatare empirically supported and are known to reduce mortality, morbidity and property loss can be accomplished usingseveral approaches.
The traditional strategy is to obtain more capacity to meet demand through improved department efficiency andthrough the addition of resources. A less conventional strategy would be to use non-department resources to increasecapacity. In this scenario a department would team with other agencies and citizens, recruiting them to become a partof the initial response team. This approach can be implemented at a fraction of the cost of adding system capacitythrough more resources. This statement is not suggesting that this strategy can be accomplished without the partici-pation of the fire department as they often have primary responsibility for EMS for the city. However, this strategy canbe used to improve performance.
Capitalizing on successful business strategies that have sought to leverage existing infrastructure (i.e., Safeway mar-kets leasing space to Wells Fargo, Starbucks moving into movie theaters, etc.), the departments could enlist other cityand private non-EMS service providers (i.e., law enforcement, security companies, community groups, etc.) to respondto cardiac arrest with automatic external defibrillators.
The use of bystanders as system responders is not new, but in the context of cardiac arrest it must be a reliable sourceof response to improve response to cardiac arrest. It must also be stated that effectiveness of a Public AutomaticDefibrillator (PAD) program has not been scientifically proven. Receiving defibrillation earlier in cardiac arrest has beenproven to improve survival. The ability to safely operate today’s AED by laypersons has been proven. The use of auto-matic defibrillators by laypersons as a system strategy to shorten time to defibrillation has yet to be scientifically vali-dated. Thus, PAD as an augmentation strategy could be implemented on a trial basis and studied.
Public Access to Defibrillation ProgramThe greatest chance of survival from cardiac arrest occurs with instantaneous defibrillation. This can be and is accom-plished with devices known as implanted defibrillators. The next best scenario for surviving cardiac arrest is the avail-ability of an AED at the location of the cardiac arrest. In a recently published article in Circulation, a publication of the

© 2 0 0 3 C O M M I S S I O N O N F I R E A C C R E D I T A T I O N I N T E R N A T I O N A L , I N C . C H A P T E R F O U R • 9
American Heart Association, titled “Public Location of Cardiac Arrest: Implications for Public Access Defibrillation,” theauthors concluded, following a five-year study of the locations of cardiac arrest, that the “placement of 276 defibrilla-tors in 172 higher-incident sites would have provided treatment for 134 cardiac arrest patients in a five-year period,60 percent of whom were in ventricular fibrillation.” 1 The authors estimated that eight to 32 additional lives could besaved with the availability of AEDs. However, they point out the random locations of the remaining 347 of the totalsample of 481 would require AEDs in 71,000 sites, making widespread distribution not practical.
Given the initial findings of a limited field research effort, the exact strategy of AED placement and citizen recruitmenthas yet to be determined. In another published article in Circulation, titled “Public Access Defibrillation: A Statementfor Healthcare Professionals From the American Heart Association Task Force on Automatic External Defibrillation,” theauthors present the American Heart Association’s (AHA) position on AED use. In the article, “The AHA supports effortsto provide prompt defibrillation to victims of cardiac arrest.” They go on to say, “In public access defibrillation, the tech-nology of defibrillation and training in its use are accessible to the community.” 2
Attributes of PAD include:■ Performance of defibrillation by laypersons at home and by fire fighters, police, security personnel, and non-
physician care providers■ Exploration of the use of bystander-initiated automatic external defibrillation in rural communities
Other areas the AHA anticipates playing a major role includes:■ Increasing public awareness that defibrillation improves the rate of survival■ Ensuring the objective, current research data are used to guide implementation of these changes■ Working with manufacturers, legislators, and governmental agencies to promote safety
Overall Time and Performance ExpectationsTimeThe next component of standards of coverage deals with the passage of time and what it means to performanceexpectations. If we use the contemporary theory that there are two to four levels of risk we should be able to define,then we must define and measure the amount of time for each risk category.
Chapter two of this manual defined the elements of time and demonstrated that all the elements combined form a“cascade” of time events. Standards of cover studies should use its definitions to form common measures of time. Ina monograph published in 1994 author Rexford Wilson described the “Nine Steps from Ignition to Extinguishment.” 3 Init he found the nine steps to response time (similar to cascade) had in fact three managers:
■ Pre-response—Property owner, building and fire inspector, uniform codes■ Response—Fire chief, who designs and manages a response system■ Incident—Incident commander, who manages on-scene resources
There are several key points that make these time study publications worthwhile:■ A standards of cover study needs definitions of total time and individual time elements■ A standards of cover study needs accurate data for each time slice in the total response picture■ We can use Wilson’s three managers to hold different elements of the time cascade accountable, in order to
improve performance resulting in less time loss.
1 Becker et al, “Public Locations of Cardiac Arrest: Implications for Public Access Defibrillation” (abstract), Circulation, June 1998, pp. 2106-2109.2 Weisfeldt et al, “Public Access Defibrillation: A Statement for Healthcare Professionals From the American Heart Association Task Force onAutomatic External Defibrillation,” Circulation, September 1995, p. 2763.3 Rexford Wilson, FSFPE; FirePro Institute Ltd., Vermont, 1994.

C H A P T E R F O U R • 1 0 © 2 0 0 3 C O M M I S S I O N O N F I R E A C C R E D I T A T I O N I N T E R N A T I O N A L , I N C .
So, a standards of cover study does not just measure travel time to emergencies, but rather is a strategic plan for com-munity loss control. Use of code enforcement, public education, early response technology such as sprinklers or publicaccess defibrillation, aggressive time management in 9-1-1 centers, traffic pre-emption devices such as Opticom, stationdesign, apparatus specifications, tool locations, hose loads and crew training all impact time, thus they need to be man-aged constantly! This concept was reinforced in the introduction with reference to the “Systems Approach to Staffing andDeployment” article in the appendix.
Each risk level in a standards of cover study should be assigned two prescribed travel times. The first travel time shouldbe for the first-due company and the second travel time should be for remainder of the assignment needed to makeup an effective response force (ERF). Travel times for each risk category vary according to each risk level and the avail-ability of staffing to achieve the critical tasks. The purpose of making this determination is to provide a target numberfor prescribed response times in correlation with the various risk levels.
It may be appropriate that the response time is the same for all risk categories, but agencies with diverse risk shouldestablish different response times for different types of risk. A sample time and performance policy statement could be:
“For 90 percent of all incidents, the first-due unit shall arrive within six minutes total reflex time (call receiptto wheels stop on scene). The first-due unit shall be capable of advancing the first line for fire control orstarting rescue or providing basic life support for medical incidents. The balance of the effective responseforce shall arrive within 10 minutes total reflex time, 90 percent of the time.”
A good way to help policy makers understand the time sequence is to prepare a graphic such as this, using your agency’s times:
EMS Time Issues■ Note: Prior and current fire deployment time measures essentially stop when the unit arrives on scene. However just
as fires require set-up time, EMS patients are not seen until the EMT or paramedic gets to the patient’s side. This couldrequire a walk into a garden apartment complex, or an elevator ride in a high rise. There is no current consensus onthe issue of including this time segment into total reflex. The best advice today is to do so if a significant percentageof the incidents responded to include these delays. For example, a downtown company that has the majority of itsbuildings with elevators. Systems today should also track two time intervals – “at scene” and “at patient.”
■ Structured caller interrogation should be utilized to prioritize medical incidents based on the type of medical com-plaint from the patient. EMS response time standards should be based on the medical urgency of the patient.Application of this methodology is consistent with the establishment of different response time standards for dif-ferent risk categories.
Ignite & Free Burn
Detect/Notify
CallHandle
Turnout Travel Arrival Set Up Combat
Segment: 00:00 1:00 1:00 4:00 2:00
Total: 1:00 2:00 6:00 8:00 10:00 >10:00
CardiacArrest
BrainDeathBegins
BiologicalDeath

© 2 0 0 3 C O M M I S S I O N O N F I R E A C C R E D I T A T I O N I N T E R N A T I O N A L , I N C . C H A P T E R F O U R • 1 1
A sample time and performance standard for EMS could display like this:
PRIORITY CATEGORY PERFORMANCE GOAL FOR 90 percent OF ALL CALLS“4” Non-Urgent 20 minutes from receipt of call to on scene“3” Urgent 15 minutes from receipt of call to on scene“2” Serious 10 minutes from receipt of call to on scene“1” Time-Critical 6 minutes from receipt of call to on scene
By developing different standards for different categories of incidents, distribution of resources can be measured bycategory. For example, distribution may be adequate if all EMS incidents are categorized the same and given the samestandard and measured as a whole. However distribution may be inadequate if the incidents are subdivided into cat-egories and measured separately. In this way distribution of resources can be further refined and deployment deci-sions can be made given the specific target.
As will be discussed in detail later in the section on evaluating historical workload, time is best measured as total reflex.It is also best to show time performance by minute, both on a department-wide and per-company basis. Here is anexample of showing it by department:
A frequently asked question is when to stop the response time clock – at unit arrival at the address (wheels stop) orwhen the crew is at the patient’s side or flowing water on the fire. Ideally, both wheels stop and at the incident objec-tive should be measured. If on EMS calls there is almost always a delay in getting to the patient (a district with all high-rises for example), then the response system should reflect the total reflex time to the patients, not just the front ofthe 30-story building.
1 2 3 4 5 6 7 8 9 10 11 12 13 14 15 16 17 18 19 20 21 22 23 240
200
400
600
800
1000
1200
1400Citywide Response Time (Total Response Time)
Minutes (911-to-Arrival)
Num
ber
of I
ncid
ents
24.2% within 4 Minutes42.9% within 5 Minutes62.6% within 6 Minutes77.1% within 7 Minutes86.5% within 8 Minutes91.8% within 9 Minutes94.9% within 10 MinutesJuly 98 - June 99

C H A P T E R F O U R • 1 2 © 2 0 0 3 C O M M I S S I O N O N F I R E A C C R E D I T A T I O N I N T E R N A T I O N A L , I N C .
Emergency Scene PredictabilityAfter this review of both fire behavior and emergency medical time criterion, standards of cover studies should considerthat the scene of any specific emergency is unpredictable in many ways. While it is relatively easy to state what typicaltasks must be accomplished in order to extinguish a generic fire, it is not always possible to predict exactly how many firefighters it will take to accomplish this task on all incidents. The number of personnel and the amount of equipment nec-essary to accomplish the critical tasks under a study in this document may vary according to the following factors:
A. Delayed responseB. Building constructionC. Number and condition of occupantsD. Physical and emotional condition of occupantsE. Extent of fire upon arrival (stage of fire growth)F. Actions of built-in fire protectionG. Direction of fire migration and area of total fire involvementH. Fire fighter or civilian injuryI. Failure of equipment
Performance Expectations—On Scene Operations Critical TaskingThe variables of fire growth dynamics and property/life risk combine to determine the fire ground tasks that must beaccomplished to stop the loss. These tasks are interrelated but can be separated into two basic types, fire flow andlife safety. Fire flow tasks are those related to getting water on the fire. Life safety tasks are those related to findingtrapped victims and removing them from the building.
The required fire flow is based on the building—its size, structural material, distance from other buildings, horizontal andvertical openness (lack of partitions), and its contents—type, density, and combustibility (BTUs per pound). Fire flowtasks can be accomplished with hand-held hoses or master streams (nozzles usually attached to the engine or ladder).The decision to use hand lines or master streams depends upon the stage of the fire and threat to life safety. If the fireis in a pre-flashover stage, the firefighters make an offensive attack into the building with hand lines. The lines are usedto attack the fire and shield trapped victims until they can be removed from the building. If the fire is in its post-flashoverstage and the structural damage is a threat to the firefighters' life safety (e.g., weakened roof, stairs), then the structureis declared lost and master streams are employed to keep the fire from advancing to surrounding buildings.
As the number of larger commercial occupancies (greater than 10,000 sq. feet), high-rise buildings and occupancieswith high value contents increase, the required fire flow increases. Areas with very large and very valuable buildingscan require fire flows of 3,000 or more gpm. The staffing needed to generate these fire flows also can be calculated.
The life safety tasks are based upon the number of occupants, their location (e.g., a low-rise vs. high-rise), their sta-tus (awake vs. asleep), and their ability to take self-preservation action. For example, ambulatory adults need less assis-tance than non-ambulatory. The elderly and small children always require more assistance.
The key to a fire department's success at a fire is coordinated teamwork, regardless of whether the fireground tasks are all fire flow related or a combination of fire flow and life safety.
Two fire scenarios used here as examples may help illustrate the importance of simultaneous and coordinated actionand demonstrate why different levels of fire risk require different levels of staffing and equipment. The first exampleis a fire in a detached single car garage, and the second is a house fire.
Several important factors make a house fire a higher risk than a burning garage. The first factor is size. Garages aremuch smaller than houses and thus require less water to extinguish than house fires. Another factor is life risk. A

© 2 0 0 3 C O M M I S S I O N O N F I R E A C C R E D I T A T I O N I N T E R N A T I O N A L , I N C . C H A P T E R F O U R • 1 3
garage fire is not likely to be a threat to life. Exposure is another factor. A garage is usually separated far enough fromother structures so fire cannot spread to them. In addition to these factors, the combination of small size and accessaround all sides allows firefighters to extinguish the fire from the exterior, and this removes the need for a backupcrew. All of these factors mean that a relatively smaller force of firefighters can handle the risks of a detached garagefire than other types of structures.
Compared to the garage example, a house fire poses a higher level of risk and requires a correspondingly larger forceof firefighters. A house's larger area and contents generate hotter and faster growing fires that require more water—and consequently more hose lines—for extinguishment. The threat to occupants requires search and rescue to beconducted simultaneously with fire suppression. And, the fire attack cannot be safely done without the simultaneousventilation of rooftop or wall openings. A backup crew is necessary any time the firefighters are inside the building,adding to the staffing need.
These two examples show that a significantly greater number of firefighters and equipment is needed for a house firethan for a detached garage fire. As the discussion below will show, the tasks must be performed simultaneously, sothe necessary staffing must arrive in a minimum amount of time in order for the crews to coordinate their actions.Other structures such as apartments, nursing homes or large warehouses pose still higher risks than house firesbecause they require greater levels of staffing and equipment to arrive in a reasonable time and work in a coordinat-ed manner. The discussion of risk categories included details explaining why the higher risks increase the need foradditional staffing and equipment.
The fire attack practices used by most fire departments are similar throughout the country for organized fire depart-ments. Activities at fires should also conform to nationally recognized safe practices for structural firefighters and com-ply with federal Occupational Safety and Health Administration (OSHA) rules such as the 2-in/2-out policy.
Identifying Critical TasksThere are some critical tasks that must be conducted by firefighters at structure fires. In creating standards of responsecoverage an assessment must be conducted locally to determine the capabilities of the arriving companies and indi-vidual firefighters to achieve those tasks. When identifying critical tasks, firefighter safety must come first. Wheneverinterior fire operations are necessary, which require the use of protective equipment, including turnout gear, SCBA,and a minimum of an 1-1/2 inch hose line, additional personnel must be staged to perform rescue functions for inte-rior fire fighting personnel, and a command structure should be in place. Since the OSHA 2-in/2-out standard, all agen-cies will follow that definition of hazardous atmosphere and have in place both an Initial Rapid Intervention Team(IRIT) and well as a full company Rapid Intervention Team (RIT) as the effective response force assembles on scene.
A typical way to approach critical tasking is to set out the critical tasks for each risk type found in the community usingRHAVE for structure fires, plus EMS and special incident outcome objectives. In a smaller, more homogeneous city ordistrict, an analysis of the most common fire type is all that is necessary. In most communities this will be the singlefamily dwelling, given the number of such structures and lack of sprinkler protection.
Some sample individual critical tasks at structure fires are listed below. Wildland, EMS, hazardous materials incidentsand special rescues all will have their own unique set of tasks that must be identified and assigned to the appropri-ate number of personnel. When performing critical tasking, remember to assign personnel to functions that mustsimultaneously be performed if the incident objective is to be accomplished.

C H A P T E R F O U R • 1 4 © 2 0 0 3 C O M M I S S I O N O N F I R E A C C R E D I T A T I O N I N T E R N A T I O N A L , I N C .
Attack Line—A medium sized hose that produces 100+ gpm and is handled by a minimum of two fire-fighters, or a larger hose that produces 200+ gpm and is handled by three or more firefighters. Each enginecarries a set of attack lines that are either pre-connected to the pump, folded on the hosebed, or in a spe-cial pack for carrying into high-rise buildings.
The selection of which attack line to use depends on the type of structure, the distance to the seat of thefire, and the stage of the fire. The pre-connected lines are the fastest to use but are limited to fires within200 feet of the pumper. When attack lines are needed beyond this limit, the hose bed lines or high-rise linesare used. A larger attack line will be used when the fire is already beyond the flashover stage and threatensan unburned portion of a structure.
Search and Rescue—A minimum of two firefighters assigned to search for living victims and remove themfrom danger while the attack crew moves between the victims and the fire to stop the fire from advancingon them. A two person crew is normally sufficient for most moderate risk structures, but more crews arerequired in multi-story buildings or structures with people who are not capable of self-preservation.
Ventilation Crew—A minimum of two firefighters to open a horizontal or vertical ventilation channel when theattack crew is ready to enter the building. Vertical ventilation or ventilation of a multi-story building can requiremore than two firefighters. Ventilation removes superheated gases and obscuring smoke, preventingflashover and allowing attack crews to see and work closer to the seat of the fire. It also gives the fire an exitroute so the attack crew can “push” the fire out the opening they choose and keep it away from endangeredpeople or unburned property. Ventilation must be closely timed with the fire attack. If it is performed toosoon, the fire will get additional oxygen and grow. If performed too late, the attack crew cannot push the firein the direction they want. Instead, the gases and smoke will be forced back toward the firefighters and theirentry point, which endangers them, any victims they are protecting, and unburned property.
Back-up Line—Usually the same size as the initial attack line that is taken in behind the attack crew to coverthe attack crew in case the fire overwhelms them or a problem develops with the attack line. This needs aminimum of two firefighters. A larger line staffed by three or more firefighters will be used for back up insteadof a medium line where the type of fire is one that could grow rapidly if not stopped by the attack line.
Rapid Intervention Crew/Team (RIT) —A minimum of two firefighters equipped with self-contained breath-ing apparatus (SCBA) and available near the entry point to enter the structure and rescue the attack, searchand rescue, or back up crew if something goes wrong. When the first four firefighters are on scene, the twooutside firefighters are also known as the initial RIT. When the balance of the effective response force arrivesand interior fire attack is continuing in hazardous atmospheres and conditions, a full company is assigned tobe the rapid intervention team.
Exposure Line—Any sized attack line or master stream appliance staffed by two or more firefighters and takenabove the fire in multi-story buildings to prevent fire expansion. Also used externally to protect nearby struc-tures from igniting from the radiant heat.
Pump Operator—One firefighter assigned to deliver water under the right pressure to the various hoselinesin use (attack, backup and exposure lines), monitor the pressure changes caused by the changing flows oneach line and ensure that a water hammer doesn't endanger any of the hoseline crews. This firefighter alsocompletes the hose hookups to the correct discharges and completes the water supply hookup to the cor-rect intake. The pump operator can sometimes make the hydrant hookup alone if the pumper is near ahydrant (50 feet), but the hydrant location sometimes precludes this.

© 2 0 0 3 C O M M I S S I O N O N F I R E A C C R E D I T A T I O N I N T E R N A T I O N A L , I N C . C H A P T E R F O U R • 1 5
Water Supply—A crew of one or more firefighters who must pull the large diameter hose between thepumper and the nearest hydrants if not laid out on the way in, provide hookup to the hydrant and deliver awater supply to the pumper before the pumper's water tank runs dry. Depending on the fire flow required,this could take several additional vehicles with the resultant number of operators.
Command—An officer assigned to remain outside of the structure to coordinate the attack, evaluate results andredirect the attack, arrange for more resources, and monitor conditions that might jeopardize crew safety.
Safety Officer—As used in the incident command system (ICS), this is an officer assigned to ensure thatdepartment members on scene are following department policies and procedures to ensure the safety ofthe entire crew.
The following table shows how critical tasks might be listed by risk type:
Representative Tasks Necessary at a Moderate-Risk Structural FireTask FirefightersAttack line . . . . . . . . . . . . . . . . . . . . . . . . . . . . . . . . . . . . . 2
Back-up line. . . . . . . . . . . . . . . . . . . . . . . . . . . . . . . . . . . . 2
Support for hose lines . . . . . . . . . . . . . . . . . . . . . . . . . . . 2
Search and rescue . . . . . . . . . . . . . . . . . . . . . . . . . . . . . . 2
Ventilation . . . . . . . . . . . . . . . . . . . . . . . . . . . . . . . . . . . . . 2
IRIT crew . . . . . . . . . . . . . . . . . . . . . . . . . . . . . . . . . . . . . . 2
Pump operator . . . . . . . . . . . . . . . . . . . . . . . . . . . . . . . . . 1
2nd pump and/or aerial operator . . . . . . . . . . . . . . . . . 1
Command . . . . . . . . . . . . . . . . . . . . . . . . . . . . . . . . . . . . . 1
Total:. . . . . . . . . . . . . . . . . . . . . . . . . . . . . . . . . . . . . . . . . . 15
This level of resources can set up the equipment and simultaneously handle the tasks of fire attack, search and res-cue, ventilation, backup lines, pump operation, water supply and command, all within a few minutes. If fewer fire-fighters and equipment are available, or if they have longer travel distances to cover, then the department will not beable to provide an objective such as confining the fire near or to the room of origin.
Because the average time from a fire's incipient stage to flashover is five to 10 minutes, the travel times selected forany fire agency should allow the fire department to arrive before flashover in the majority of cases (about four out offive). Total reflex times are longer than the flashover time, but this is compensated for by the fact that a portion of thefires will still be in the smoldering or incipient stage when reported, which will normally mean a longer time before

C H A P T E R F O U R • 1 6 © 2 0 0 3 C O M M I S S I O N O N F I R E A C C R E D I T A T I O N I N T E R N A T I O N A L , I N C .
flashover occurs. In the long run, the fire department will get to most fires before or at the time they reach flashover. Theother one-in-five fires that are not reached before flashover are those cases noted earlier where the fire went to flashoverrapidly because flammable accelerants were present or because the fire burned a long time before being reported.
The next step in displaying critical tasking is to aggregate the tasks into typical company groupings. While tasks will varydepending on individual tactical situations, a grouping by company will allow the elected officials to see the tasks byunits as well as by individuals.
Moderate Risk Structure Fire
First-Due Engine Company1. Stretch a 200 foot 1-3/4 inch pre-connect to the point of access for the residence.2. Operate the pump to supply water and hook-up a four-inch hydrant supply line.3. Assume command of initial operations.
Second-Due Engine Company1. If necessary, lay in a hydrant supply line to the first company.2. Stretch a second 200 foot pre-connect for exposures or safety-line function.3. Fill out IRIT, so interior attack can start.
Truck Company 1. Conduct primary search.2. Secure utilities.3. Using tools and methods, provide vertical or positive pressure ventilation.
Third-Due Engine Company1. Staff functions not already underway and/or provide a full RIT crew.
To fully assess critical tasking, agencies should have emergency incident performance measures and standard oper-ating procedures (SOPs) in place, or conduct drill ground time measures to document the steps and time to com-pletion for all tasks. This data serves two purposes:
a. The time measurements make sure the critical steps are being done simultaneously and effectively to obtain thedesired outcome.
b. The measurements, when explained to elected officials, demonstrate that even after arrival, it takes some time to stopthe escalation of the emergency. Thus total reflex time does not really stop until the emergency is under control.

© 2 0 0 3 C O M M I S S I O N O N F I R E A C C R E D I T A T I O N I N T E R N A T I O N A L , I N C . C H A P T E R F O U R • 1 7
The following charts are examples of critical task measures conducted by a large agency, on a drill ground, operatingunder their standard SOPs. They are a serious, significant risk structure fire and two-car auto accident in the City of Acme:
Task Firefighters CompanyAttack Line . . . . . . . . . . . . . . . . . . . . . . . . . . 2 . . . . . . . . . . . . . . . . . . . . . . . . . . . . . . . . First EnginePump Operator. . . . . . . . . . . . . . . . . . . . . . 1 . . . . . . . . . . . . . . . . . . . . . . . . . . . . . . . . First EngineInitial Command . . . . . . . . . . . . . . . . . . . . . 1 . . . . . . . . . . . . . . . . . . . . . . . . . . . . . . . . First EngineSearch and Rescue. . . . . . . . . . . . . . . . . . . 2 . . . . . . . . . . . . . . . . . . . . . . . . . . . . . . . . Second EngineWater Supply . . . . . . . . . . . . . . . . . . . . . . . . 2 . . . . . . . . . . . . . . . . . . . . . . . . . . . . . . . . Second EngineVentilation/Utilities . . . . . . . . . . . . . . . . . . . 5 . . . . . . . . . . . . . . . . . . . . . . . . . . . . . . . . Truck CompanyBack-up Line . . . . . . . . . . . . . . . . . . . . . . . . 4 . . . . . . . . . . . . . . . . . . . . . . . . . . . . . . . . Third EngineRapid Intervention Team . . . . . . . . . . . . . . 5 . . . . . . . . . . . . . . . . . . . . . . . . . . . . . . . . Rescue UnitIncident Command . . . . . . . . . . . . . . . . . . 1 . . . . . . . . . . . . . . . . . . . . . . . . . . . . . . . . Battalion ChiefTotal . . . . . . . . . . . . . . . . . . . . . . . . . . . 23
The following are the times to complete all the necessary tasks at a significant risk structure fire. The times are cumu-lative both by task and total reflex since time of call:a. 9-1-1 call . . . . . . . . . . . . . . . . . . . . . . . . . . . . . . . . . . . . . . . . . . . . . . . . . . . . . . . . . . . . . . . . . . . . . . . . . . . . . . . . . . . 0:00b. Call handling interval . . . . . . . . . . . . . . . . . . . . . . . . . . . . . . . . . . . . . . . . . . . . . . . . . . . . . . . . . . . . . . . . . . . . . . . . . 2:00c. Turnout time interval . . . . . . . . . . . . . . . . . . . . . . . . . . . . . . . . . . . . . . . . . . . . . . . . . . . . . . . . . . . . . . . . . . . . . . . . . 2:00d. Travel time interval . . . . . . . . . . . . . . . . . . . . . . . . . . . . . . . . . . . . . . . . . . . . . . . . . . . . . . . . . . . . . . . . . . . . . . . . . . . 4:00Response time subtotal. . . . . . . . . . . . . . . . . . . . . . . . . . . . . . . . . . . . . . . . . . . . . . . . . . . . . . . . . . . . . . . . . . . . . . . . . . . 8:00
Critical tasks and completion times (four-person crew) are:First engine on scene. . . . . . . . . . . . . . . . . . . . . . . . . . . . . . . . . . . . . . . . . . . . . . . . . . . . . . . . . . . . . . . . . . . . . . . . . . . . . 0:001. Size-up by fire captain . . . . . . . . . . . . . . . . . . . . . . . . . . . . . . . . . . . . . . . . . . . . . . . . . . . . . . . . . . . . . . . . . . . . . . . . 1:00
Second engine and first truck company arrive . . . . . . . . . . . . . . . . . . . . . . . . . . . . . . . . . . . . . . . . . . . . . . . . . . . . . . . 2:00 Response time subtotal . . . . . . . . . . . . . . . . . . . . . . . . . . . . . . . . . . . . . . . . . . . . . . . . . . . . . . . . . . . . . . . . . . . . . . . . . 10:00
2. First attack line charged off apparatus tank water. . . . . . . . . . . . . . . . . . . . . . . . . . . . . . . . . . . . . . . . . . . . . . . . . . 2:30 3. Second floor door forcibly opened, attack line enters fire floor . . . . . . . . . . . . . . . . . . . . . . . . . . . . . . . . . . . . . . 3:104. First Engine attaches one 50-foot length of supply line to nearby hydrant and gets water to pump . . . . . . . 3:455. Second line charged for back-up . . . . . . . . . . . . . . . . . . . . . . . . . . . . . . . . . . . . . . . . . . . . . . . . . . . . . . . . . . . . . . . 4:006. Attack crew reports water flowing on fire. . . . . . . . . . . . . . . . . . . . . . . . . . . . . . . . . . . . . . . . . . . . . . . . . . . . . . . . . 4:107. Utilities reported secured. . . . . . . . . . . . . . . . . . . . . . . . . . . . . . . . . . . . . . . . . . . . . . . . . . . . . . . . . . . . . . . . . . . . . . 4:30
Third engine and battalion chief arrive. . . . . . . . . . . . . . . . . . . . . . . . . . . . . . . . . . . . . . . . . . . . . . . . . . . . . . . . . . . . . . 5:00 Response time subtotal. . . . . . . . . . . . . . . . . . . . . . . . . . . . . . . . . . . . . . . . . . . . . . . . . . . . . . . . . . . . . . . . . . . . . . . . . . 13:00
8. Primary search reports “all clear” in fire area. . . . . . . . . . . . . . . . . . . . . . . . . . . . . . . . . . . . . . . . . . . . . . . . . . . . . . 5:45
Rescue company arrives. . . . . . . . . . . . . . . . . . . . . . . . . . . . . . . . . . . . . . . . . . . . . . . . . . . . . . . . . . . . . . . . . . . . . . . . . . 7:00Response time subtotal . . . . . . . . . . . . . . . . . . . . . . . . . . . . . . . . . . . . . . . . . . . . . . . . . . . . . . . . . . . . . . . . . . . . . . . . . 15:00
9. First ladder from truck crew up to roof . . . . . . . . . . . . . . . . . . . . . . . . . . . . . . . . . . . . . . . . . . . . . . . . . . . . . . . . . . 7:3010. Second ladder up to roof . . . . . . . . . . . . . . . . . . . . . . . . . . . . . . . . . . . . . . . . . . . . . . . . . . . . . . . . . . . . . . . . . . . . . 8:30

C H A P T E R F O U R • 1 8 © 2 0 0 3 C O M M I S S I O N O N F I R E A C C R E D I T A T I O N I N T E R N A T I O N A L , I N C .
11. Chainsaw on roof and started. . . . . . . . . . . . . . . . . . . . . . . . . . . . . . . . . . . . . . . . . . . . . . . . . . . . . . . . . . . . . . . . . . 9:3012. Roof cut open and ventilation provided . . . . . . . . . . . . . . . . . . . . . . . . . . . . . . . . . . . . . . . . . . . . . . . . . . . . . . . . 11:0413. Protection line to roof for ventilation crew . . . . . . . . . . . . . . . . . . . . . . . . . . . . . . . . . . . . . . . . . . . . . . . . . . . . . . 11:2014. Fire reported knocked down. . . . . . . . . . . . . . . . . . . . . . . . . . . . . . . . . . . . . . . . . . . . . . . . . . . . . . . . . . . . . . . . . . 11:2015. Rapid Intervention Team tooled-up and staged with incident commander. . . . . . . . . . . . . . . . . . . . . . . . . . . . 11:30
Total time from 9-1-1:. . . . . . . . . . . . . . . . . . . . . . . . . . . . . . . . . . . . . . . . . . . . . . . . . . . . . . . . . . . . . . . . . . . . . . . . . . . 19:30
Vehicle Accident—EMS Heavy Rescue:Typical tasks for a two-car, three-patient auto accident with a moderate extrication problem:
9-1-1 call . . . . . . . . . . . . . . . . . . . . . . . . . . . . . . . . . . . . . . . . . . . . . . . . . . . . . . . . . . . . . . . . . . . . . . . . . . . . . . . . . . . . . . . 0:00Call handling interval. . . . . . . . . . . . . . . . . . . . . . . . . . . . . . . . . . . . . . . . . . . . . . . . . . . . . . . . . . . . . . . . . . . . . . . . . . . . . . 2:00Turnout time interval. . . . . . . . . . . . . . . . . . . . . . . . . . . . . . . . . . . . . . . . . . . . . . . . . . . . . . . . . . . . . . . . . . . . . . . . . . . . . . 2:00Travel time interval . . . . . . . . . . . . . . . . . . . . . . . . . . . . . . . . . . . . . . . . . . . . . . . . . . . . . . . . . . . . . . . . . . . . . . . . . . . . . . . 4:00Response time subtotal . . . . . . . . . . . . . . . . . . . . . . . . . . . . . . . . . . . . . . . . . . . . . . . . . . . . . . . . . . . . . . . . . . . . . . . . . . . 8:00
Critical tasks and completion times (four-person crew) are:First engine on scene. . . . . . . . . . . . . . . . . . . . . . . . . . . . . . . . . . . . . . . . . . . . . . . . . . . . . . . . . . . . . . . . . . . . . . . . . . . . . 0:001. Size-up by fire captain . . . . . . . . . . . . . . . . . . . . . . . . . . . . . . . . . . . . . . . . . . . . . . . . . . . . . . . . . . . . . . . . . . . . . . . . 1:00
Truck company and light unit arrive . . . . . . . . . . . . . . . . . . . . . . . . . . . . . . . . . . . . . . . . . . . . . . . . . . . . . . . . . . . . . 2:00 Response time subtotal. . . . . . . . . . . . . . . . . . . . . . . . . . . . . . . . . . . . . . . . . . . . . . . . . . . . . . . . . . . . . . . . . . . . . . . . . . 10:00
2. Foam line flowing onto fuel spill . . . . . . . . . . . . . . . . . . . . . . . . . . . . . . . . . . . . . . . . . . . . . . . . . . . . . . . . . . . . . . . . 2:103. One firefighter into upright car (#1) for patient assessment . . . . . . . . . . . . . . . . . . . . . . . . . . . . . . . . . . . . . . . . 3:454. Face-to-face command transition with B/C . . . . . . . . . . . . . . . . . . . . . . . . . . . . . . . . . . . . . . . . . . . . . . . . . . . . . . . 4:305. The light tower or other scene illumination is deployed . . . . . . . . . . . . . . . . . . . . . . . . . . . . . . . . . . . . . . . . . . . . 4:45
Second engine and battalion chief arrive. . . . . . . . . . . . . . . . . . . . . . . . . . . . . . . . . . . . . . . . . . . . . . . . . . . . . . . . . 5:00 Response time subtotal. . . . . . . . . . . . . . . . . . . . . . . . . . . . . . . . . . . . . . . . . . . . . . . . . . . . . . . . . . . . . . . . . . . . . . . . . . 13:00
6. Car #2 cribbed to support it on its side. . . . . . . . . . . . . . . . . . . . . . . . . . . . . . . . . . . . . . . . . . . . . . . . . . . . . . . . . . 5:307. Rescue tools and patient care equipment moved to vehicle area . . . . . . . . . . . . . . . . . . . . . . . . . . . . . . . . . . . . 6:008. Hydraulic rescue tool pump started . . . . . . . . . . . . . . . . . . . . . . . . . . . . . . . . . . . . . . . . . . . . . . . . . . . . . . . . . . . . . 7:159. Firefighter into car #2 for patient care . . . . . . . . . . . . . . . . . . . . . . . . . . . . . . . . . . . . . . . . . . . . . . . . . . . . . . . . . . . 7:2010. Car #1 driver’s door removed. . . . . . . . . . . . . . . . . . . . . . . . . . . . . . . . . . . . . . . . . . . . . . . . . . . . . . . . . . . . . . . . . . 8:3011. Car #2 stabilized with rope to fire engine . . . . . . . . . . . . . . . . . . . . . . . . . . . . . . . . . . . . . . . . . . . . . . . . . . . . . . . . 9:0012. Patient #2 assessed in car #1 . . . . . . . . . . . . . . . . . . . . . . . . . . . . . . . . . . . . . . . . . . . . . . . . . . . . . . . . . . . . . . . . . 9:0013. Cervical collar applied to patient #1 in car #1 . . . . . . . . . . . . . . . . . . . . . . . . . . . . . . . . . . . . . . . . . . . . . . . . . . . . 9:1514. Second firefighter into car #1 for patient loading. . . . . . . . . . . . . . . . . . . . . . . . . . . . . . . . . . . . . . . . . . . . . . . . . 10:0015. Patient #1, car #1 removed by backboard . . . . . . . . . . . . . . . . . . . . . . . . . . . . . . . . . . . . . . . . . . . . . . . . . . . . . . 11:2016. Windshield removed from car #2 . . . . . . . . . . . . . . . . . . . . . . . . . . . . . . . . . . . . . . . . . . . . . . . . . . . . . . . . . . . . . 12:0017. Patient #2, car #1 removed by backboard . . . . . . . . . . . . . . . . . . . . . . . . . . . . . . . . . . . . . . . . . . . . . . . . . . . . . . 13:2018. Patient #1 packaged, ready for transport. . . . . . . . . . . . . . . . . . . . . . . . . . . . . . . . . . . . . . . . . . . . . . . . . . . . . . . . 15:3019. Roof cut and removed from car #2. . . . . . . . . . . . . . . . . . . . . . . . . . . . . . . . . . . . . . . . . . . . . . . . . . . . . . . . . . . . 17:3020. Patient #2 packaged, ready for transport. . . . . . . . . . . . . . . . . . . . . . . . . . . . . . . . . . . . . . . . . . . . . . . . . . . . . . . . 18:0021. Patient #3, car #2 removed from car by backboard . . . . . . . . . . . . . . . . . . . . . . . . . . . . . . . . . . . . . . . . . . . . . . 20:0022. Patient #3 packaged, ready for transport . . . . . . . . . . . . . . . . . . . . . . . . . . . . . . . . . . . . . . . . . . . . . . . . . . . . . . . 22:00Total time . . . . . . . . . . . . . . . . . . . . . . . . . . . . . . . . . . . . . . . . . . . . . . . . . . . . . . . . . . . . . . . . . . . . . . . . . . . . . 30:00

© 2 0 0 3 C O M M I S S I O N O N F I R E A C C R E D I T A T I O N I N T E R N A T I O N A L , I N C . C H A P T E R F O U R • 1 9
Secondary SupportDon’t forget that secondary support functions may be performed by the initial response personnel after being “recy-cled” from the completion of an initial assignment. The concept of secondary support also includes the use of the callof special units, such as volunteers or reserve forces to perform the task of relieving initial crews, conducting salvage,overhaul, or staffing of ancillary duties such as rehabilitation, staging, air supply, etc.
Effective Response ForceAn effective response force is defined as the minimum amount of staffing and equipment that must reach a specificrisk location within a maximum prescribed total reflex time, from the time of call receipt to the units arriving on scene.
An effective response force should be able to handle fires that are reported shortly after they start and are within themaximum prescribed time for the full assignment of fire companies according to the risk level of the structure. In anystaffing and response study, the staffing, equipment and time intervals that accompany each of the risk categoriesshould be based upon that premise.
Considering that the fire department cannot hold fire risk to zero, a response cover study's objective should be to finda balance between distribution, concentration and reliability that will keep fire risk at a reasonable level, and at thesame time yield the maximum savings of life and property at the least cost. The maximum prescribed travel times actas the limit to effectiveness—if you put fire stations too far apart, the minimum effective response force cannot get toa fire in time.
The following table, part of critical task analysis, illustrates in a matrix an agency’s baseline fire flow response goals bynumber of engines and response time:
NUMBER OF COMPANIES COMPANY DUE-IN (TIME — MINUTES)Risk Type First Second Third plusMaximum 4,000+ gpm . . . . . . 5 . . . . . . . . . . . . . . . . . . . . . 4 . . . . . . . . . . . . . . 5. . . . . . . . . . . . . . 8
Significant 3,000+ gpm . . . . . . 4 . . . . . . . . . . . . . . . . . . . . . 4 . . . . . . . . . . . . . . 6. . . . . . . . . . . . . . 8
Moderate 1,000-2,000 gpm . . 3 . . . . . . . . . . . . . . . . . . . . . 4 . . . . . . . . . . . . . . 8. . . . . . . . . . . . . . 8
Low < 1,000 gpm . . . . . . . . . . 2 . . . . . . . . . . . . . . . . . . . . . 4 . . . . . . . . . . . . . . 8 . . . . . . . . . . . . . . -
Special Risk. . . . . . . . . . . . . . . . . as needed
It is important to get all the required firefighters to a fire scene quickly because fire suppression is a simultaneous andcoordinated activity.
At a fire in an occupied structure, a minimum of eight tasks must be simultaneously conducted in order to stop theloss of civilian lives, stop further property loss, and keep the risks to the firefighters' lives at a reasonable level. Thenumber and type of tasks that need simultaneous action will dictate the minimum number of firefighters needed atdifferent types of fires.

C H A P T E R F O U R • 2 0 © 2 0 0 3 C O M M I S S I O N O N F I R E A C C R E D I T A T I O N I N T E R N A T I O N A L , I N C .
Similar charts should be prepared for each risk level found in the community. Such critical task analysis also should takeinto account that maximum potential staffing depends on other factors such as: delayed responses, occupant load,occupant physical condition, built-in protection, area of fire involvement, injuries, and equipment failure. Additionalresources are required for assignments such as communications, planning, staging, high-rise operations, etc.
Integrated Time and Performance Objective StatementsOnce all risk, time and critical task issues are identified and measured, the agency can draft integrated performancegoal statements. These will be used to model deployment for both distribution and concentration in the next steps inthe standards of cover process.
Listed below are what such sample statements could look like:
Structure Fire, Maximum RiskGoalAn effective response force of 37 personnel deployed via five engine companies, two truck companies, one rescuecompany, plus two battalion chiefs shall respond.
MeasureThe first unit shall arrive within six minutes total reflex time, for 90 percent of all requests for emergency service. Thesecond-due engine and first-due truck company shall arrive within 10 minutes total reflex time, for 90 percent of allrequests for emergency service. Remaining units, including the battalion chiefs, shall arrive within 13 minutes totalreflex time, for 90 percent of all requests for emergency service. The rescue company shall arrive within 15 minutestotal reflex time, for 90 percent of all requests for emergency service.
Performance ObjectiveTo stop escalation of a serious fire where found. Typically this means conducting a search and rescue for any victims,confining the fire damage near the room of origin, plus limiting heat and smoke damage to the area or floor of fireorigin. The tasks of rapid intervention rescue for trapped firefighters, property salvage, and crew rotation with rehabil-itation requires at a minimum 14 additional personnel on a fire in this risk category.
Structure Fire, Significant RiskGoalAn effective response force of 23 personnel deployed via three fire engines, one truck company, one rescue com-pany, plus one battalion chief shall respond.
MeasureThe first unit shall arrive within six minutes total reflex time, for 90 percent of all requests for emergency service. Thesecond-due engine and truck company shall arrive within 10 minutes total reflex time, for 90 percent of all requestsfor emergency service. Remaining units, including the battalion chief, shall arrive within 13 minutes total reflex time,for 90 percent of all requests for emergency service. The rescue company shall arrive within 15 minutes total reflextime, for 90 percent of all requests for emergency service.
Performance ObjectiveTo stop escalation of a serious fire where found. Typically this means conducting a search and rescue for any victims,confining the fire damage near the room of origin, plus limiting heat and smoke damage to the area or floor of fireorigin. The tasks of rapid intervention rescue for trapped firefighters, property salvage, and crew rotation with rehabil-itation require, at a minimum, nine additional personnel on a fire in this risk category.

© 2 0 0 3 C O M M I S S I O N O N F I R E A C C R E D I T A T I O N I N T E R N A T I O N A L , I N C . C H A P T E R F O U R • 2 1
Structure Fire, Moderate RiskGoalAn effective response force of 14 personnel deployed via two engine companies, one truck company or one rescuecompany, plus one battalion chief shall respond.
MeasureThe first unit shall arrive within six minutes total reflex time, for 90 percent of all requests for emergency service. Thesecond-due engine and truck company shall arrive within 10 minutes total reflex time, for 90 percent of all requestsfor emergency service. The battalion chief shall arrive within 13 minutes total reflex time, for 90 percent of all requestsfor emergency service.
Performance ObjectiveTo stop the escalation of a minor fire where found. Typically this means conducting a search and rescue for any victims,confining the fire damage to the room of origin, plus limiting heat and smoke damage to near the room of fire origin. Thefirst arriving unit is capable of starting rescue work or advancing a first line for fire control. The second engine and truck com-pany provide additional personnel for tasks already started plus ventilation, salvage, and other work as necessary
Structure Fire, Low RiskGoalAn effective response force of 14 personnel deployed via two engine companies, one truck company or one rescuecompany, plus one battalion chief shall respond.
MeasureThe first unit shall arrive within six minutes total reflex time, for 90 percent of all requests for emergency service. The sec-ond-due engine shall arrive within 10 minutes total reflex time, for 90 percent of all requests for emergency service.Remaining units shall arrive within 15 minutes total reflex time, for 90 percent of all requests for emergency service.
Performance ObjectiveTo stop the escalation of a minor fire where found. Typically this means conducting a search and rescue for any victims,confining the fire damage to the room of origin, plus limiting heat and smoke damage to near the room of fire origin. Thefirst arriving unit is capable of starting rescue work or advancing a first line for fire control. The second engine and truck com-pany provide additional personnel for tasks already started plus ventilation, salvage, and other work as necessary.
Wildland Interface Zone, Significant RiskGoalAn effective response force of 31 personnel deployed via four wildland engine companies, one engine tender com-pany, one engine company, one brush patrol group, plus two battalion chiefs shall respond.
MeasureThe first wildland company shall arrive within eight minutes total reflex time, for 90 percent of all requests for emer-gency service. The second-due wildland company shall arrive within 10 minutes total reflex time, for 90 percent of allrequests for emergency service. Remaining units, including the third-due wildland company, engine company, enginetender company and first-due battalion chief shall arrive within 13 minutes total reflex time, for 90 percent of allrequests for emergency service. The brush patrol group and second-due battalion chief shall arrive within 15 minutestotal reflex time, for 80 percent of all requests for emergency service.

C H A P T E R F O U R • 2 2 © 2 0 0 3 C O M M I S S I O N O N F I R E A C C R E D I T A T I O N I N T E R N A T I O N A L , I N C .
Performance ObjectiveTo stop escalation of a serious fire where found. Typically this means controlling the fire to the area of origin withoutspread to adjacent structures or escalating to a size requiring additional resources (including mutual aid).
Target and Special RisksGoalAn effective response force of 23 personnel deployed via three engine companies, one truck company, one rescuecompany, plus one battalion chief shall respond.
MeasureThe first unit shall arrive within eight minutes total reflex time, for 90 percent of all requests for emergency service. Thesecond-due engine and truck company shall arrive within 10 minutes total reflex time, for 90 percent of all requests foremergency service. Remaining units, including the third-due engine company and battalion chief, shall arrive within 13minutes total reflex time, for 90 percent of all requests for emergency service. The rescue company and/or specialtyunits shall arrive within 15 minutes total reflex time, for 90 percent of all requests for emergency service.
Performance ObjectiveTo stop escalation of a serious fire, rescue, or hazardous materials emergency where found. Typically this means con-trolling the fire to the area of origin without spread to adjacent structures, rescuing trapped citizens, or stopping thespread of a hazardous materials release.
Emergency Medical Service, Moderate RiskGoalAn effective response force of four personnel deployed via one engine company or one truck company shall respond.
MeasureThe unit shall arrive within eight minutes total reflex time, for 90 percent of all requests for emergency service.
ObjectiveTo stop the deterioration of the patient’s condition, to provide relief from further suffering and ensure the patient getsthe appropriate level of definitive medical care that the situation warrants.
Later, in the discussion of distribution, concentration and reliability of forces, measures will be made to see if the totalresponse effort gets enough companies to the scene in a timely manner, so that fire flows are met and critical tasksaccomplished.
SummaryThe relationship between fire behavior and response time is a critical element in understanding the consequences ofany event. Time, as was once stated by Rexford Wilson, “is either the enemy or the ally.” This chapter focuses on com-ing up with performance objectives that include trying to stop fires before major damage occurs or getting to an emer-gency medical event so that life can be saved.

© 2 0 0 3 C O M M I S S I O N O N F I R E A C C R E D I T A T I O N I N T E R N A T I O N A L , I N C . C H A P T E R F I V E • 1
CHAPTER F IVE
DEF IN ING THE ELEMENTS OF TIME
The Importance of Time in Assessing ResponseEmergency events occur at all hours, all days and under all conditions. Emergencies are like lighting strikes—they occuranytime, anywhere. The fire service's response to these unpredictable conditions has been to develop a methodolo-gy for being prepared to respond in a timely fashion when they occur. The operative word is timely.
Can we predict with accuracy what the outcome is going to be of the specific activities we call fire protection? This canonly be answered by individual fire chiefs who consider the issue of conducting analysis a high priority. Those fire depart-ments that do not conduct analysis must resort to generalities to determine whether or not they are hitting the target.
In August 1985, Fire Chief magazine published an article, “A Systems Approach to Staffing and Manning.” In the arti-cle, Fire Chief Ron Coleman discussed the various stages that a fire goes through from ignition and the consequencesand strategies that are the most effective in containing a specific fire emergency. That document is provided asAppendix A to this book.
In conducting research for the Commission on Fire Accreditation International, Inc., (CFAI) members of the initial taskforce spent a considerable amount of time looking at the elements of time. A review of this activity was a fundamentalbuilding block to establishing a service level based on the passage of time. The task force also discovered that manyfire departments are collecting data points on their emergency response, but they were not necessarily using the datato properly illustrate performance.
The following information was originally published in the first edition of the CFAI Fire and Emergency Service Self-Assessment Manual. It is being republished in this book with further elaboration.
Cascade of Events—The Response Time ContinuumResponse time elements are a cascade of events. This cascade is similar to that used by the medical community todescribe the events leading up to the initiation, mitigation, and ultimate outcome of a cardiac arrest. It is imperativeto keep in mind certain intervals described can be directly influenced by the fire service (reflex interval and travel inter-val), while others can be influenced indirectly (through public education, engineering initiatives, and standards).
MeasuresCareful definition of terminology is essential to any conversation about response performance standards. It becomeseven more critical when an organization attempts to benchmark its performance against other providers. You mayconsider using the following standard response time intervals.

C H A P T E R F I V E • 2 © 2 0 0 3 C O M M I S S I O N O N F I R E A C C R E D I T A T I O N I N T E R N A T I O N A L , I N C .
Time Points and the Cascade of EventsThe response performance continuum is composed of the following time points and time intervals:
■ Event Initiation Point—T1—the point at which factors occur that may ultimately result in an activation of theemergency response system. Precipitating factors can occur seconds, minutes, hours, or even days before a pointof awareness is reached. An example is the patient who ignores chest discomfort for days until it reaches a crit-ical point at which he/she makes the decision to seek assistance (point of awareness). It is rarely possible toquantify the point at which event initiation occurs.
■ Emergency Event Awareness—T2—the point at which a human being or technologic sentinel (i.e., smokealarm, infrared heat detector, etc.) becomes aware that conditions exist requiring an activation of the emergencyresponse system. This is considered the point of awareness.
■ Alarm—T3—the point at which awareness triggers an effort to notify the emergency response system. An exam-ple of this time point is the transmittal of a local or central alarm to a public safety answering point. Again, it isdifficult to determine the time interval during which this process occurs with any degree of reliability.
A sub interval—the alarm transmission interval—lies between the awareness point and the alarm point. Thisinterval can be significant, as when the alarm is transmitted to a distant commercial alarm monitoring organiza-tion, which then retransmits the alarm to the local 9-1-1 dispatch facility. When there is an automatic transmis-sion of the signal, the fire department gains valuable time in controlling the event.
■ Notification—T4—the point at which an alarm is received by the public safety answering point (PSAP). Thistransmittal may take the form of electronic or mechanical notification received and answered by the PSAP.
1. Call processing interval—the interval between the first ring of the 9-1-1 telephone at the dispatch centerand the time the computer-aided dispatch (CAD) operator activates station and/or company alertingdevices. This can, if necessary, be broken down into two additional parameters: “call taker interval” (the inter-val from the first ring of the 9-1-1 telephone until the call taker transfers the call to the fire department dis-patcher) and “dispatcher interval” (the interval from the time when the call taker transfers the call to the dis-patcher until the dispatcher/CAD operator activates station and/or company alerting devices).
Cascade of Events Associated with Emergency Operations
Distribution Time
State of Normalcy
Baselines based on Risk Factor
Concentration Staffing
Event Initiation-Soft Data
Emergency Event-Soft Data
Alarm-Soft Data
Notification-Hard Data • Alarm is reported-Emergency in Progress
Baseline = 50 seconds
Baseline = 50 seconds
On-Scene Time-Hard Data • Unit Arrives at Scene
Termination of Incident-Hard Data
State of Normalcy
Initiation of Action-Soft Data • Unit begins operations
Alarm Processing-Hard Data Unit is notified Turnout Time-Hard Data Unit has left station Travel Time-Hard Data
ResponseTime

© 2 0 0 3 C O M M I S S I O N O N F I R E A C C R E D I T A T I O N I N T E R N A T I O N A L , I N C . C H A P T E R F I V E • 3
■ Dispatch time—T5— the time when the dispatcher, having selected appropriate units for response, initiates thenotification of response units.
1. Reflex or Turnout Interval—the interval between the activation of station and/or company alerting devicesand the time when the responding crew activates the responding button on the mobile computer terminal ornotifies dispatch by voice that the company is responding. During the reflex interval, crews cease other activ-ities, don appropriate protective clothing, determine the location of the call, and board and start the fire appa-ratus. It is expected that the responding signal will be given when personnel are aboard the apparatus and theapparatus is beginning to roll toward the call.
■ En Route Time—T6—the point at which the responding apparatus signals the dispatch center that they areresponding to the alarm.
1. Travel (Interval)—begins at the termination of the reflex interval and ends when the responding unit notifiesthe dispatcher unit that it has arrived on scene (again, via voice or mobile computer terminal notification).
■ On-Scene Time—T7—the point at which the responding unit arrives on scene.
■ Initiation of Action—the point at which operations to mitigate the event begin. This may include size-up,resource deployment, etc.
■ Termination of Incident—T8—the point at which unit(s) have completed the assignment and are available torespond to another request for service.
■ Response Interval—Alarm processing time plus turnout time plus travel time.
■ Customer Interval—This measure is an indictor of the customer’s perception of the performance of the emer-gency service system. It includes those factors that, in the customer’s perception, reflect the performance of thefire service whether or not the fire service directly controls those elements. This interval adds the call-processinginterval to the response interval.
The Use of Time Information Many fire agencies will publish response statistics to the end of the calendar year that read something like this: “Theanytown fire department responded to 2,144 incidents. The average response time was five minutes.”
There are problems with these two statements. One is simply the number of incidents and the other is the amountof time that was the average. It does not reveal what the types of events were, such as fires versus medical aids. Nordoes it mention what were the longest and shortest responses. What if the department responded to all of the minorevents in a timely fashion, but was never on time for working structures? It does not indicate if the calls were all red-light-and-siren calls or whether some of the calls were handled as very low priority.
To get an average response time, you add the total amount of time intervals and divide it by the total number of calls.However, if there are a couple of unusually long response times resulting from abnormal circumstances, this will skewthe average. The results could make it appear as though the department frequently has long response times ratherthan having a couple of abnormally long response times.
But, an average is only one measurement of central tendency. There are three separate distinctions in statistical analy-sis: mean, median and mode. These concepts will be explored more extensively in the chapter on statistics.

C H A P T E R F I V E • 4 © 2 0 0 3 C O M M I S S I O N O N F I R E A C C R E D I T A T I O N I N T E R N A T I O N A L , I N C .
The fire service has not been strong in the area of statistical analysis. Some in the industry believe this number crunch-ing is somehow irrelevant to fire protection. Yet the law enforcement community uses statistics very successfully tojustify what they are attempting to do. Moreover, they often use it to prove what they set out to accomplish.
Probably one of the best examples of this today would be the television series The District. The star of that show isfrequently found standing in front of a map with statistics arrayed on it, using those numbers to talk about policy andpower. The fire service is a long way from there.
Before we get into the specifics of talking about how to do that, it might be appropriate to review some of the anom-alies associated with how we provide service to the community. For example let’s go back to our statement aboutaveraging response times. If that is truly an average of all response times, then it must combine code three and non-code three responses. The only way you could use that number is if you took all incidents. However, there are manyincidents that a fire department responds to that do not demand an emergency response.
If you listen to the radio dispatches of fire companies, you will often hear the dispatcher tell the responding companythat haste is not necessary. These incidents include public assists, service calls and so forth. If firefighters hark back tothe early days in the firehouse, they will probably recognize that when they were given a dispatch to go to a non-code-three emergency, they probably didn’t hasten to get on the fire apparatus either. And that has an effect on turnout time.
So, we need to be clear on what we are actually measuring. The definition of measuring response to structure firesshould include the criterion that the incident is a code-three response if it is to be included in the measurement of cen-tral tendency. This creates work. It is easier to add up all the numbers, punch a button and hope that you come outwith an answer. But this may not be a true representation of the service level you are providing to the community.
It is noticeable that many fire departments are now publishing their response time as part of their customer orienta-tion. From the public’s point of view, the department is making a promise that it must keep or it will be subject to anevaluation and criticism.
The current tendency to only look at response time as if it is a magical number really denies the reason for theresponse time in the first place. What a fire department is trying to demonstrate is that it needs the element of timeon its side in order to effectively mitigate an emergency.
Finally there is a problem when different fire agencies use different time frames to exemplify their response time suc-cess ratios. For example if a department does not include alarm processing time or turnout time in its definition ofresponse, the review of the department’s success ratio in achieving a certain time goal looks pretty good. If a fractileis being used and the only time measured is travel time, the performance may look high. On the other hand adepartment that does include alarm time and processing time in its records may not have a high success rate if theyset the total time frame too low, i.e. three minutes.
There is a term used in statistics called statistical anarchy. It simply means that people use statistics in an inappropri-ate way to prove a point that is not valid. It is imperative to clearly define the time elements before you establish theperformance goal. Make sure that the evaluation of performance is not being misrepresented by measuring on onescale and evaluating on another.
Further Observations on Each ComponentIn the early days of the colonies, a fire that occurred at night was nearly always lethal. There were no smoke alarmsin those days. And fire protection consisted of what your neighbors could do to help you.

© 2 0 0 3 C O M M I S S I O N O N F I R E A C C R E D I T A T I O N I N T E R N A T I O N A L , I N C . C H A P T E R F I V E • 5
The community, recognizing this need, identified a group of people called the Rattle Watch. These late night observerswould visit each and every part of the town in the night looking for the tiniest wisp of smoke or any form of ignition. If theydiscovered a fire they would immediately start operating a large wooden device called a rattle. Not unlike the Halloweenversion of noisemakers, it was nothing more than a paddle of wood that formed of the concept of fire notification.
In the fire service we have recognized for a long time that notification is an important element of effective fire protection.Stated simply, if a fire starts and is allowed to grow to the point where it achieves flashover state within a structure, peo-ple die and property is destroyed. A rapidly growing fire front in the form of a vegetation fire is the wildland fire equiva-lent. In either case the problem of suppressing fire increases significantly with each second that a fire burns undetected.
One of the best reading sources for this topic is the book Nine Steps from Ignition to Extinguishment, written byRexford Wilson, a fire protection engineer. He also wrote an article in the NFPA Journal entitled “Time: Enemy or Ally.”
Today we don’t have any rattle watches in our communities. Today we are relying upon a great deal of technologysuch as smoke alarms to perform that same function. But, smoke alarms are not designed to warn someone outsideof the structure. They only notify someone who is inside of the building. The fire must produce products of combus-tion before the smoke alarm operates. And when it does, if the person in that room is not awakened or doesn’t prop-erly respond, the fire department may not know that a fire is in progress.
For purposes of this discussion, notification includes detection, alarm and contact. Detection is the technology able tosense the products of combustion, including smoke, heat, flame or fire gases. Detection can include human inter-vention. That’s why we have fire alarms in some of our occupancies so someone can trip a device that would beginthe communications process without having to wait for the fire to achieve a level of combustion that requires thesmoke alarm to activate. Sprinkler systems also function to achieve that type of communication. Any assessment ofcommunity risk must recognize the role of all available technology in quickly containing and minimizing.
Detection is relevant when it has the ability to result in a state of alarm being created. Alarm is when detection activatessome form of mechanism that alerts the occupants of the building and the immediate vicinity that a fire is in progress.
For example, the smoke alarm serves the detection and alarm purpose. However, a fire alarm box on the side of thewall serves the alarm purpose only. In terms of human senses, detection is smelling and alarm is screaming. This isthe purpose of these devices.
Notification is an actual linkage between the event that is in progress and the emergency response capacity of thecommunity. In other words someone must call the fire department.
Unfortunately, some people do not realize that without detection, alarm, and notification, the 9-1-1 system is essen-tially deaf, blind, and silent. For the purpose of this text, 9-1-1 system is used for alarm receiving point. In all of thediscussion about how well a fire department can perform, there is a tendency to believe that when a fire starts wewill be there four minutes later. That’s not true. And moreover it’s misleading when we set that as the only perform-ance measurement for a fire agency.
To the contrary, when a fire starts it may have an extended period of time in which it remains in a low-challenge stateand no one detects it. Moreover, it is conceivable that a fire will go to a higher and higher level of assault on a build-ing without ever being detected. This is the result if there are no detection devices. Therefore, when a fire departmentarrives at the scene of a fully involved building in which there were no detectors, no alarms, and no notification, thefive-minute travel time is somewhat irrelevant.

C H A P T E R F I V E • 6 © 2 0 0 3 C O M M I S S I O N O N F I R E A C C R E D I T A T I O N I N T E R N A T I O N A L , I N C .
The primary focus of an effective fire protection program should be on reducing the point of time between ignitionand detection. One might make the case that the other NFPA Standards such as 13, 13D and 72 create these tech-nologies, but the current NFPA 1710 totally dismisses them as being relevant in setting response time policy.
Then, assuming that detection could be compressed as closely as possible, the next fire protection principle shouldbe to create a state of alarm as quickly as possible. This helps to protect the individuals whose lives are immediatelythreatened and results in notification occurring as rapidly as possible. The third principle is that notification should belinked with the fire department reporting system to minimize a period of time taken to give the response unit thelocation of the event in progress.
Often the alarm bells will ring in a firehouse, the fire crew will mount the fire apparatus, open the door and immedi-ately see a plume of smoke or a glow in the far distance indicating that response time will not make much difference.That happens regardless of how close fire stations are located to one another. In some cases buildings burn downright next door to fire stations because nobody realized they were on fire until they were totally involved.
In order for the fire manager to be able to manage a targeted response time in an intelligent and logical manner, thefire prevention bureau must do everything possible to reduce the detection, alarm, and notification component. Thereare costs and benefits to each alternative strategy to achieve this goal. It is cost prohibitive to assume we have theability to develop a system that drives this element down to a zero fraction.
However, that does not eliminate the possibility that codes and ordinances may have more of an effect on reducingfire loss than response time will. For example having an alarm system linked to a notification device that goes to thefire agency may be more important in a building with a higher risk of life safety. A good example of this would bebuildings in which fire alarms are required during the daytime for life safety purposes but are not necessarily linkedto central stations when the building is unoccupied. There are many large-area buildings in which we have done agood job on detection and alarm but have totally missed the concept of notification.
Within the concept of fire behavior it is a well known fact that almost all fires go through certain stages of development ina fairly logical sequence. The low-challenge, smoldering combustible fire compared to the high-challenge pre-flashover phe-nomenon demonstrates the range of the problem. Once a fire starts it will grow in relationship to the special configurationof the fuel and the building as well as interacting with the oxygen level and the distribution of products of combustion.
The argument that this book is making is that putting fire stations into the community and promising the public thatyou will be there within a specific travel time should always be qualified by the following statement, “The fire depart-ment will respond to the scene of emergencies within a ___ minute travel time after it has been notified and has hadthe ability to transmit the alarm to its respective fire stations.”
This may sound like legalese, but it is a statement of reality. Until the fire department receives the alarm, the fire serv-ice is deaf, blind, and silent. One of the ways that a fire prevention bureau improves the quality of life in the com-munity is to compress the notification time to an absolute minimum.
Detection is no less important than the other steps. Among the things that have been discussed in the earlier part ofthis chapter are alarm-processing times, turnout times, travel times, and set-up times. The outcome of these eventsis measured as a totality.
The focus on the concepts in this text is based upon the need for the fire service to stop thinking in a simplistic fash-ion about the consequences of the response chain of events and to deal effectively with the need for a fire protectionagency to plan, execute, and evaluate the entire system from top to bottom. We are suggesting a comprehensiveapproach to meeting the needs of their most important customers: the ones that call for an emergency in progress.

© 2 0 0 3 C O M M I S S I O N O N F I R E A C C R E D I T A T I O N I N T E R N A T I O N A L , I N C . C H A P T E R F I V E • 7
NOTIFICATIONThe comedian Lily Tomlin once performed a comic routine centered on some of the alleged behavior of a mythicaltelephone operator. If you didn’t see the skit just imagine getting an operator at the other end of the line that was afew numbers short of a full telephone directory. One of her most famous lines was her counting out…one ringydingy…two ringy dingy…three ringy dingy, etc.
In a previous section we discussed the concept of detection and alarm. That’s when the ringy dingies start. But noti-fication ends the minute the telephone line or alarm circuitry lets a public safety operator know that there is an emer-gency in progress. It begins a sequence of events that should quickly result in the fire agency notifying the fire com-panies in the field to respond to that same emergency. The difference between notification time and when the fireapparatus begin to respond has been labeled as alarm processing time in the Commission on Fire AccreditationInternational, Inc. model. It is an element of time that a fire agency cannot take for granted.
For example, many fire agencies are operating in a 9-1-1 system that has a public safety answering point somewherein the loop. Depending on the policies and procedures of that public safety answering point and the relationship withthe actual fire dispatch center, there could be a huge difference in how long it takes to find out that you have an emer-gency and when you actually get the companies rolling. This will have an effect upon response time performance.
On the other end of the line John Q. Citizen doesn’t really care. When he dials an emergency number he is count-ing the number of rings. As soon as someone answers the phone, he believes he has notified the fire agency. Maybehe has. Maybe he has not. Regardless of whether the person who answered that phone is in a public safety answer-ing point 90 miles away from the fire department, the person who calls in that alarm expects the clock to be tick-ing when they hang up.
The public has the expectation that a fire truck will show up in the promised period of time. The clock is ticking, butright now it might not count if it is still within another dispatch system and the fire department is not aware of it yet.Many firefighters have arrived at the scene of an alarm and been immediately accosted by a person who claimed “Ittook you guys…30 minutes to get here!” We usually quickly dismiss them as nuts or overwrought. But CFAI researchinto alarm processing time identified that unless multi-tiered communications centers are carefully evaluated, thereare potential problems for tracking and recording true response time performance data.
So, how long does it take to process an alarm? It depends on whether or not the alarm goes directly into the fire dis-patch center or whether an intervening call screener is processing it. It depends upon whether the dispatch center isautonomous or part of a combined law enforcement and fire/EMS center. It depends on how the department is doc-umenting and recording the receipt of the alarm and the dispatch of the fire companies. It depends upon whether ornot the agency is practicing emergency medical dispatch. It also depends on whether or not the dispatch center hasset a standard for processing that alarm.
For example, an agency that tracks its respective alarm times by hand-written notes is not generating credible statis-tics. The margin of error is too high. Dispatch centers that use a manual time stamping method where the dispatch-er must enter a card and have it stamped is a little better but lacking in terms of reliability. This is where we start see-ing the difference between hard and soft data.
Alarm processing time could and should be electronically determined by two things: the first ring in the dispatch cen-ter and the activation of the mechanism for alerting the fire station. In other words, if you can keep track of these twotime elements, then you can measure your alarm processing time.

C H A P T E R F I V E • 8 © 2 0 0 3 C O M M I S S I O N O N F I R E A C C R E D I T A T I O N I N T E R N A T I O N A L , I N C .
Imagine that a public safety answering point doesn’t answer the phone until the third ring and it takes 15–20 sec-onds to determine that it is a fire emergency before it turns it over to the fire agency. Then imagine that the fire dis-patch center must wait for a couple of rings. Many fire agencies in this country are still allowing dispatchers to sleepon duty. How long does it take to wake someone up at 3 a.m. to handle an incoming alarm? If the time of notifica-tion is taken to the time that the dispatch center answers it when compared to the actual turnout time, it is not uncom-mon for this to be as much as two or three minutes.
When the Commission on Fire Accreditation International, Inc. was researching this, Fire Chief Charlie Rule andBattalion Chief Chris Maxwell conducted a survey of fire service agencies all over the United States. Thousands ofalarm elements were collected. It was determined that many fire departments were not documenting nor analyzingthe period of time it took to actually process the alarm. The person who calls 9-1-1 believes that the minute he/shehangs up the telephone the clock starts. If a fire agency has been telling the public to expect the fire department with-in a certain number of minutes, the public believes the clock begins as soon as they have called 9-1-1.
Remember the irate customer who demanded to know what took us so long to get there. Upon analyzing many ofthese calls, the fire service found many conditions ranging from the fact that someone called the wrong dispatch cen-ter (this was in the days of the old seven-digit telephone numbers) to the fact that sometimes people use their cel-lular phones to call an alarm not realizing that they are not answered by the local fire agency. A communication cen-ter should engage in a focused analysis of its alarm processing times. We are not talking about analysis paralysis. Theagency's process must be clear and understood. What is happening to an alarm once it enters the system? Is itscreened? Is it managed? Is it delayed? Is it documented?
With notification, the balance of responsibility is primarily on the civilian population. If they do not notify us we can-not respond. There is a difference here. Now the alarm has been handed over to a public safety agency. The morethat we are able to determine how accurate our processing time is, the more likely we are going to make intelligentdecisions with respect to our communications and dispatching processes.
Knowing what your alarm processing time is all about is not an exercise in minutia. It is the hallmark of professional-ism to set a benchmark that your community can rely on and your fire department can depend on.
Turnout TimeTurnout time is the period that begins when the firefighters are notified to respond and ends when the wheels beginto turn on the apparatus. It sounds simple, but it isn’t. The firefighters may or may not be prepared to stop doing whatthey are doing and get on the truck. There is an assumption that firefighters are in stations just waiting for a call. Manyfire agencies have heavy commitments to training, fire prevention and maintenance. If an alarm comes in during theday, they may not be able to redirect as easily as one might expect. And the impact upon the fire service from theEMS activity has been significant. Many times first-due fire companies are unavailable for calls in their own first-in dis-tricts. Furthermore, fire agencies that have active physical fitness programs may have slight delays while firefighters puton proper clothing to respond. Also delays can occur because of poor radio communications and processes.
Travel TimeIn the early days of the volunteer fire service when the hose wagons were pulled out of the building and hauled tothe scene of fires, these events were often a raucous undertaking. Imagine if you can 32 men tugging at the ropesof a large hand pumper barreling down a road. There was a high degree of possibility that they could run down thecitizens walking the sidewalk or scare the horses pulling wagons. They had to be warned. One of the many techniquesthat were used in those early days was use of a vamp.

© 2 0 0 3 C O M M I S S I O N O N F I R E A C C R E D I T A T I O N I N T E R N A T I O N A L , I N C . C H A P T E R F I V E • 9
A vamp was an individual who could run faster than the collective team could pull the appliance. Vamps often car-ried torches and ran ahead of the crew shouting for people to get out of the way. Sometimes they used a noisemaker.The techniques were the precursor of the red lights and the siren. Shortly thereafter fire departments began to adaptall sorts of devices to make noise along with lights on the apparatus itself. It was a necessity by the time the appara-tus was motorized. Fire bells, whistles and any other form of audible signal were utilized. There was the invention ofthe siren. First it was hand cranked and then it become electric. The whole idea was to make a fire truck visible andaudible as it traveled from the firehouse to the scene of emergencies.
The type of sirens used in those early days could not compete with the noise level of a contemporary city, much lesspenetrate the cocoon-like atmosphere that is created in a modern automobile. But the principle remains the same:when a fire apparatus is dispatched to the scene of an emergency it needs to get there as quickly as possible. It musttravel and compete with all other traffic.
Travel time is the one thing most people, even the uninformed, can understand. It is the time period from wheels start-ing to stopping in front of the emergency. Again, this is a simple concept, but can be complicated by many factors.
Travel times are a measurable aspect of fire suppression operations, yet many fire agencies fail to keep good recordson this activity. Government agencies have increased the emphasis placed on the performance of fire companies.Travel time is one area where emphasis should be placed when improving a fire agency's planning processes. If youhaven’t paid much attention to travel time before, this can be a problem. If you have collected the data and can assureits accuracy, you have made progress on standards of coverage issues.
The discussion of travel time requires a look at community traffic patterns and the possible use of traffic calmingdevices. Most discussion about the idea of traffic calming in the fire service has focused how to get the traffic out ofour way so that we could go from our point of dispatch to our point of alarm in the shortest possible time. This hasfocused on the code-three response.
Over the last few decades we have tried a lot of things to make a fire truck more visible and have the ability to attract atten-tion more rapidly. For the most part it has been a qualified success. In some cases it is becoming a potential failure. Too manyin our society ignore the fire service's request to “move to the right for sirens and lights.” Traffic patterns at different times ofthe day can affect response times. Traffic calming devices that are installed to slow down traffic patterns can also delay fireapparatus. Devices such as chicanes, speed bumps, one-way streets and even signal patterns can have an adverse effect.
The real reason has nothing to do with what we are doing to fire trucks but what is happening with traffic circulation.As our communities have grown and become denser, the infrastructure to support the mass movement of large num-bers of vehicles has not always kept pace with our needs. Handcarts were competing with wagons. Our trucks arenow tangling with everything from sports cars to 18-wheelers. Traffic engineers and community planners have takenanother point of view with respect to traffic control. It is focused upon the need to move traffic and limit traffic at thesame time. Therefore we are often affected by these decisions when we respond.
Some of the current phenomena that the fire service must compete with include, but are not limited to, one-waystreets, traffic medians that preclude crossing over into oncoming lanes to bypass traffic, cul-de-sacs, dead-end streetswithout adequate turnarounds, flag streets, traffic jams of a daily cyclic nature, traffic jams of a seasonal cyclic nature,attempts by traffic engineers to control the flow of traffic speed, and apathy and indifference of the driving public whenit comes to code-three vehicles.
The significance of all these phenomena is they affect response patterns and actual response performance. If ourcredibility in handling emergencies is partially dependent on travel time, then we must have a role in planning the

C H A P T E R F I V E • 1 0 © 2 0 0 3 C O M M I S S I O N O N F I R E A C C R E D I T A T I O N I N T E R N A T I O N A L , I N C .
traffic circulation system. Once a fire company has been alerted that there is an emergency in progress, it must gofrom that point of dispatch to the point of the incident as rapidly as possible.
This is why fire agencies must assess the various consequences of the road network, their operating policies and theirexperience in using it as roadbed for response. Without this type of analysis, the department’s performance may beless than what the community expects.
Statistics That Relate to TimeFor many years fire agencies have been using a statistical term that is based on one of the three types of central ten-dency. The three types are mean, median and mode. For nearly 50 years, fire agencies have been talking about theiraverage response time. This is an inadequate statistical reference. As discussed earlier, a few isolated abnormalresponse times will skew the average, giving an inaccurate picture of the agency's overall response time. When theIAFC Task Force on Accreditation researched this subject, it discovered that averaging was not a true reflection of per-formance. In early CFAI documentation it was suggested that fractile goals were more relevant in defining an expect-ed response goal for fire and EMS response times instead of using averages.
Since then many contemporary fire departments have discontinued using average response times. Instead they areusing a fractile such as 80 percent, or whatever has been set by local policy as a response time goal. In essence theperformance is better measured in terms of how often the department is able to achieve that goal with respect to100 percent of the time. For example, a department would create a performance measurement that says that the fireapparatus will arrive at the scene of the dispatched incident within a certain period of time, 80 percent of the time.There is considerable debate over whether or not we should be using a high or low number for this fractile. Fifty per-cent is totally inadequate for most fire responses. But, promising a 100 percent is irresponsible and unachievable.Now it comes down to the debate of whether is should be 75 percent, 90 percent or something else.
If we use the principle of Pareto, this should be relatively easy for us to evaluate. Pareto stated that in any given setof circumstances, 20 percent of activity or effort will result in 80 percent of your outcomes. Recent analytical work hasstated that whatever it takes to achieve the 80 percent fractile in terms of costs and resources will be increased sig-nificantly trying to reach the same results in the remaining 20 percent. Hence, in most business processes, 80 per-cent is used as a baseline.
In relation to fire station deployment, we should attempt to protect the largest risk with a minimum response time tostay within the adopted fractile and recognize that other losses may occur outside of that parameter, but that is a riskthat we could afford to take.
If the fractile of 90 percent is used for the five-minute response time, it assumes that there will be 10 percent of thosecalls that you will not get there in that same time frame. For planning purposes fire station deployment should ensurethat there is a minimum amount of risk in the areas that border on the outside parameters of time response.
The fire service has a wide variety of fire agencies, including wildland agencies. It should be noted that response timescould be lengthy with a low-density incident rate in some areas. Therefore, one should not be critical of response timeunless it is carefully evaluated.
The fire service has generally adopted the concept that a five-minute travel time provides for a reasonable level ofdistribution of resources throughout a community. Not everyone agrees with this. There are agencies that haveextremely long travel times because they have a low-density fire problem. For some highly dense communities a five-minute travel time is not acceptable. The purpose of this book is to deal not with the specific decision made by acommunity, but with the fact that the community needed to make a decision.

© 2 0 0 3 C O M M I S S I O N O N F I R E A C C R E D I T A T I O N I N T E R N A T I O N A L , I N C . C H A P T E R F I V E • 1 1
One of the next questions to be answered is: How far can a fire vehicle travel in that assigned time period? That’s a legit-imate question. And of course there are many variables. How fast is the vehicle traveling? What are the obstacles to itspassage? If we go back to the earliest studies of fire station deployment, the Rand Institute study, we can note it used anaverage 35-mile-per-hour road speeds. If a vehicle were averaging 35 miles an hour, then in one hour of travel time itwould have gone 35 miles. From point A to point B, it is traveling .58333 miles per every minute (35 divided by 60). Ifthese assumptions are correct, then in a four-minute travel time the apparatus should be able to transverse about 2.33road miles. However, for a variety of reasons, fire companies will not be able to consistently hit that average.
The reality is that a response time goal is just that: a goal. Performance in achieving that goal is something that mustbe evaluated. When you do, you might find some surprises.
It should be a matter of public policy that the distribution of fire stations in the community is based on the element oftravel time and the response goal. Also, travel time should be periodically sampled and analyzed to determine whetheror not the fire department is achieving a reasonable response performance to handle the emergencies that occur. Asstated earlier, setting an average response time is totally inadequate. Taking a small number of incidents and comingup with a five-minute response time will give you one level of performance. But taking tens of thousands of incidentsand giving a five-minute response time the range could be quite extensive. Conversely taking every call, including pub-lic assists and non-emergency responses, can wreak havoc with the achievement of a fractile performance.
Studies have demonstrated that the time differential for the turnout and travel time for events of low-level significanceincreased the total elapsed time substantially. Other studies demonstrate that response-time conformance is not cor-related with distance from the firehouse, but rather distance from the point of dispatch to the location. Consider: Whatpercentage of calls to your companies are dispatched when the companies are in the field and otherwise committed?Are they training? How about at the shop? Responding back from the hospital? Some statistics already have been devel-oped that demonstrate that some of the longest response times are back into first-due areas. There are many respons-es into areas that are covered by second-due companies because first-due companies are already engaged elsewhere.
Therefore, the purpose of this discussion is to focus on what policies and practices affect travel time. As discussedearlier warning devices have been around for a long time. The purpose behind the warning device is simple. It isdesigned to request the right of way for emergency vehicles. Code-three devices are not a cart-blanche to do any-thing you want on the road. The apparatus operator must keep the vehicle under control at all times. The vehicle mustbe prepared to take evasive action quickly in the event that a person who assumes they have the right of way is notaware of the warning device.
The tragic loss of firefighters to traffic accidents is a very significant problem. Driving code three is not a license to kill.Fire department command officers have been at the scene of many fire apparatus collisions.
The issue regarding code three is straightforward. In order to get from point of dispatch to the emergency, an appara-tus must be allowed to go through signals, use opposite lanes to travel in the direction of dispatch and in many waysexpose the officer and crew to a wide number of dangers. Therefore, the fire service’s desire to calm traffic by the useof a code-three device is a risky measure. Some of the potential solutions to improve upon this include traffic signalcontrol devices and electronic warning. However, these are not technologies in widespread use for the fire service.
Traffic control devices have been around for a long time. In many cases they started with such simple ideas as havinga control switch in a fire station that could be pushed when you leave the bay to turn a nearby intersection signal intoa cautionary signal. It has evolved into various types of devices that electronically can access a traffic signal as the vehi-cle approaches in order to turn the signal in favor of the responding vehicle. These technologies are part of the firedepartment's ability to control the flow of traffic and can have an impact on response times.

C H A P T E R F I V E • 1 2 © 2 0 0 3 C O M M I S S I O N O N F I R E A C C R E D I T A T I O N I N T E R N A T I O N A L , I N C .
The most important consideration regarding traffic control is safety. Any and all policies and practices should be direct-ed at a mechanism of allowing a vehicle to move swiftly through traffic without exposing a civilian or the firefighter tounnecessary harm from collisions.
While this book is not focused on training, it is important to note that driver training programs are more concernedwith travel time safety than any other specific department policy. Any fire department that is allowing someone whois not adequately trained to drive a vehicle is just waiting for a tragedy to happen. This is particularly true if the driveris lacking training on the limitations of the braking systems and the limitation of the code-three warning devices.
Back to the other side of the formula: What do traffic engineers do to calm down traffic? Their solution is to do thingsto the roadbed that are intended to keep people from traveling at a high rate of speed. An automobile can travel ata fairly high rate of speed on a roadbed. A car traveling at 50 miles per hour has a different capacity to stop than afire truck traveling at 50 miles per hour. The traffic engineers are not concerned about calming down fire trucks; theyare concerned about calming traffic. Therefore some of the traffic calming devices used includes such things as speedbumps and chicanes. Hitting a speed bump at 35 miles per hour in a car with a good suspension system may notbe that disturbing. But hitting a speed bump with a fire truck at 35 miles per hour is a vehicle-rearranging event anda firefighter safety issue.
The reason that this is significant is that many fire department officials are estimating their travel time on the basis ofa formula that measures road speed as a constant. They draw lines on various maps indicating they can achieve cer-tain levels of response without regard for these impediments.
Another traffic calming process is to create neighborhoods that have one way in and one way out with strong controlover access. These are the classic gated communities and affect travel time.
Another impediment affecting travel time is the traffic jam. Measuring a segment of the street and indicating that youcan travel 35 miles-an-hour on it is an assumption. That route may have a one-mile-an-hour or five-mile-an-hour limitbecause of some cyclic nature of the traffic circulation in the community. Therefore travel time must consider thesekinds of features when planning distribution and deployment of fire apparatus.
The next thing we should talk about with respect to travel time is the analysis of travel time. Most deployment mod-els are built upon the basis of an underpinning map, i.e., first-in response districts have been assigned based on trav-el time. At one time the fire service traveled to most of its fires from the firehouse itself. That may or may not be thecurrent reality and may possibly be more of an error in judgment in the future.
The reason for this is the level of activity and the phenomena of increased commitment to parallel program activitiessuch as fire prevention. In the case of increased activity, more fire vehicles are being dispatched from the field whenthey go back in service immediately after an event. Those departments that are heavily committed for emergencymedical services (EMS) find this a frequent occurrence. The key here is the fire station location may not have anybearing on the actual response time. It is point of dispatch to point of arrival that becomes important.
The secondary phenomena is the increasing amount of time that fire stations are empty because the crews are out atcompany inspections, training, performing apparatus maintenance, teaching public education activities and a wide rangeof other commitments other than fire suppression. With the mass majority of the fire service on a shift schedule, thedegree of this significance can vary considerably. It is not uncommon in the analysis of an incident report to find outthat there is a bi-mobile peak and level of activity in many fire departments. There is more activity in the early morningand more activity in the late evening, resulting in two spikes of the evaluation of incident reports based on time of day.

© 2 0 0 3 C O M M I S S I O N O N F I R E A C C R E D I T A T I O N I N T E R N A T I O N A L , I N C . C H A P T E R F I V E • 1 3
But the number of incidents that are in the valleys in between may reflect the level of commitment of the depart-ment. During the nighttime response there are usually no traffic jams. The response in the middle of the day or towardthe peak rush hour may have longer response times because of the factors discussed previously.
What is important here is that when fire departments look at travel time they need to be looking at it from a contextof the actual travel time and not just the hypothetical goal.
In conducting research for this project, CFAI found that one fire department performed this analysis and was startledto find that a significant number of the responses that fell outside of its response time goals actually occurred closerto the firehouse. Upon closer examination it was discovered that these extended response times often were a func-tion of some of the issues described in previous paragraphs. The crews were training, returning from a hospital, per-forming vehicle maintenance, etc. In some cases the first-in company was actually a second-due company becausethe first-in company was on another call. This raises issues of reliability of each company. In other words, while it maybe assigned, will it be available?
In summary, travel time is not just a measurement of the fire station to the scene of potential incidents. It is a com-plex performance measurement that determines whether or not the local service to the community is consistent withwhat you have promised. If during the planning stages you ignore traffic calming and the anomalies that can reduceyour effectiveness in getting to the scene, then the first-in districts that are developed may actually be sending out afalse expectation. Once the fire stations have been appropriately located and apparatus deployed, the analysis ofresponse times cannot be a simple aggregation of those times with a simple statement of how often you met yourperformance measurement. Travel time is a multidimensional variable, a decision-making component requiring thatthe fire professional dissect and understand it clearly.
Set-Up TimeThe fire doesn’t automatically go out when we show up on scene. Nor do the victims suddenly sit up and say thatthings are much better now. In order to handle an emergency we must do different things in different sequences inorder to mitigate that emergency. Let’s discuss what constitutes “set-up time.”
At the very outset we need to recognize that the concept of set up time is also a multidimensional variable that direct-ly corresponds with how severe the emergency is once we arrive on the scene. Among the first considerations mustbe the fact that the severity of the emergency is almost always linked with the extent of activity that is required approx-imately in the first seven to ten minutes on the scene. Therefore, this publication does not focus on the entire timethat a fire department takes to handle an emergency but rather what it does in the first four or five minutes in orderto attempt to maintain control of the escalating event.
Later in this book we will look at a concept called critical tasks. The concept of critical tasks is that there are specificactivities that must be done in a certain sequence in order to control an event that is at a specific level of escalationat the time of arrival. Critical tasks are those things that must be performed or the event will continue to escalate.
In simplest terms, arriving at the scene of a very small fire incident does not require a considerable amount of activity.Or does it? Imagine you are an engine company officer sent to the scene of a high-rise building with a report of smokein the area. When you pull up in front of that building and give the communications center an indication that you havearrived on scene, you may or may not be able to assess the nature of the emergency from that location. Contrast thatwith a scenario where you are an engine officer and you are responding to a fire, and as soon as you pull out of thefire station, you see heavy smoke on the horizon. Until you get to the scene you are not sure what is generating thatsmoke. The old fashioned term for this is size up. Lloyd Layman coined the term more than 50 years ago and it hasbeen used extensively by fire officers ever since. A unit is not on the scene of an emergency until it is in a location

C H A P T E R F I V E • 1 4 © 2 0 0 3 C O M M I S S I O N O N F I R E A C C R E D I T A T I O N I N T E R N A T I O N A L , I N C .
where it has the opportunity to begin the assessment of the problem. Therefore, the evaluation of critical task beginswhen you determine that there are jobs to be done in order to mitigate the emergency.
Arrival at an address of an incident may not be arrival at the scene of an emergency. When we are analyzing respons-es from a deployment perspective, the most important point in time is when the fire officer is able to make the deter-mination that specific things must be done, i.e. the laying of lines, raising of ladders, etc.
Now back to the concept of critical task. Probably the most controversial issue in the fire service today is how manypeople it takes to staff a fire truck. The way that a fire department operates and the manner in which it attacks firesis as much of a consideration as the response time number itself. For example, fire departments can use pre-con-nected hose lines and have set-up policies to be able to go into action quickly instead of having delays. They have afaster set up time and therefore a better utilization of personnel to achieve critical task than those that don’t.
One of the problems those laymen have in understanding the fire service is that they do not see us implement crit-ical task often enough. Instead, they frequently see a fire truck arrive at the scene with the captain disembarking andasking questions such as who reported the fire, has anybody seen anything, what seems to be the nature of the prob-lem here? On a significant number of alarms a fire crew does very little for the public to assess as being important.
Therefore, the concept of critical task is concerned with the state of the emergency upon arrival and the level of esca-lation. A majority of the emergencies that a fire company responds to do not require all of the people identified inthe critical task analysis. The distinguishing characteristics of those that do are events that are in the process of esca-lating and accelerating at a very rapid rate. Two good examples of this might be a fire company arriving at the sceneof a food-on-the-stove call versus a room that is just about ready to flashover. In the case of the former there is verylittle difficulty; in the case of the latter minutes can mean extensive property damage and increased risk of loss of life.
Another component of set-up time and critical task analysis is the level of training of the incumbent firefighter on thatcompany. A well-trained firefighter will perform at a more consistent and uniform rate than an untrained firefighter will.Therefore, the training program is most influential in creating the performance expectation in a department regardinga set-up time. Many fire departments have established some of these performance standards so that the companyofficer has some degree of expectation about how long it will take to set up.
Let’s take a standard initial attack on a single-family dwelling with heavy smoke showing. This is the bread-and-butterfire of the fire service. How a single fire company deals with this scenario is often the underpinning of the depart-ment’s reputation and credibility in the community.
A critical task analysis of this type of an event might look something like this: A. Initial size up and assessment of theincident commander; B. donning breathing apparatus and pulling a preconnected hoseline (firefighters); C. estab-lishing a water supply and putting the pump into operation to provide fire stream (fire engineer).
It is obvious that an engine company operating alone arriving at the scene of a major fire involvement—even a sin-gle-family dwelling—can’t do everything. Therefore critical analysis might include: D. ventilation (firefighter); E. termi-nation of utilities (firefighter); F. establishment of rapid intervention team (two firefighters).
The concept of critical analysis is based on defining jobs and listing them in a sequence of priorities. Vocational edu-cators have been doing this for years to teach people how to operate machinery. The fire service has adopted a sim-ilar philosophy with the basics of firemanship.

© 2 0 0 3 C O M M I S S I O N O N F I R E A C C R E D I T A T I O N I N T E R N A T I O N A L , I N C . C H A P T E R F I V E • 1 5
Critical task analysis also is linked to another concept during the set-up period, effective response force. This was aterm established by the Commission on Fire Accreditation International, Inc. as part of the core competency—that afire agency establishes a standard of response coverage. The effective response force is the number of peoplerequired given all the elements of critical task analysis for the level of risk being protected. For example, any time youattempt an interior fire attack on a building that is of a complex nature, it requires between 13 and 15 people on thescene to do this job safely and effectively.
However, if a certain number of people show up at the scene of a fully involved structure and the entire operation isexterior, there is a different critical task analysis and therefore the effective response force may be of a different number.
The challenge to the fire community is to find ways of linking set-up time with critical task analysis so that an effec-tive response force can do its job. This is a real challenge because in most communities, the number of fires in whichcritical task analysis and effective response force really makes a difference are relatively small in number. Granted,there are communities that have a knock-down, drag-out fire once a day. Unfortunately there may be a credibilityproblem in the community because they are losing too many lives or too much property.
For purposes of this discussion, what is important is that individual fire agencies have these components and havediagnosed them in their own terms. This indicates the need for an individual fire department to evaluate its perform-ance standards for what it expects out of a single company and/or multiple companies within a certain time frameafter arrival on the fireground. Moreover it must be diagnosed in the context of multiple scenarios.
This is not just a concept that applies to the fireground. It also applies to the concept of emergency medical aids. Justthe fact that a firefighter/emergency medical technician must maintain a seriously injured patient's airway and con-tinue circulation begins to frame a critical task analysis for basic life support. (At the paramedic level time-consumingtasks such as establishing telemetry, dispensing medication, and engaging in procedures that are more complicatedand therefore lengthier.)
The same concept continues with the hazardous materials incident. In reality we practice so much caution on haz-ardous materials incidents that one can almost bring about a reconnaissance and stabilization of a hazmat incidentwith fewer people than you would need for simple medical aid.
One of the dilemmas that many fire departments face is the lack of data tracking of set-up time. Most departmentsdo not track this time and fail to recognize that their set-up times are sometimes two or three times lengthier thanthe response time itself.
In summary, set-up time begins when the wheels stop turning on the fire truck and the wheels start turning in themind of the officer in charge. Anything that a fire agency can do to make their first-in fire companies more produc-tive—more capable of going into action quickly—will work in favor of reduced loss of life and/or property. Ignoring set-up time can cause a fire agency to be behind the curve in terms of total incident management.
SUMMARY We have examined the elements of response time in this chapter. Before we complete our discussion of responsetime, there are a couple of realities that need to be discussed and considered with regard to the fire department plan-ning effort. Just setting a response time goal to react to that increasingly complex set of problems is not adequate toassure that the community is being protected. In the past, the average fire officer was held accountable primarily forwhat occurred right at the scene of an emergency. We have done a very good job of establishing the credibility of theAmerican fire service as being responsive and courageous while fulfilling the duties of this task. But, in the future afire officer will need to know more about the overall situation in order to minimize the loss of life and property in ourcommunity. Response time is only one component.


© 2 0 0 3 C O M M I S S I O N O N F I R E A C C R E D I T A T I O N I N T E R N A T I O N A L , I N C . C H A P T E R S I X • 1
CHAPTER SIXDEPLOYMENT CAPABILITY MEASURES
As stated in previous chapters the key terms in understanding standards of response coverage are: distribution, con-centration, overall resource efficiency, response reliability and response effectiveness. They are quantifiable perform-ance measures that can be used by the fire department staff to objectively and quantitatively analyze the relationshipbetween existing or new fire station locations and the fire department's capability. As street improvements and newland development take place, the database can be revised to increase the accuracy of the data.
The location of fire stations impacts only one segment of the continuum, travel time from the fire station. Travel timeand response time are not the same thing. When we say that a particular station has a four-minute travel time to anaddress, it doesn't mean that a unit will arrive there in four minutes from the caller’s viewpoint. Nor will the unit alwaysrespond from a fire station.
Once the minimum staffing and equipment needs are established for each level of risk, fire department analystsshould then determine how fast the entire force of staffing and equipment must reach the fire scene to be effective.Data from fire growth experiments and historical fire incidents can be used to determine the maximum travel timethat would allow the staffing and equipment to get to a fire scene while a fire was still in its early stages of growth.
Station Location Study ToolsDistribution and concentration studies revolve around the need to study travel time from station locations to differenttypes of risks in the community. In the ‘good old days’ we did this by driving the distance with a stopwatch and esti-mating what our time would have been had we driven with red lights and sirens on. A similar method was to meas-ure distance on a map and using a mean travel speed such as 35 m.p.h., see how many minutes of travel the com-pany could cover. Another method was to look at historical incident data for times. This approach is often error proneas time stamps on call segments are not always accurate.
Dispatchers, if they have to type in a time stamp, might be busy with radio traffic and delay for several seconds or upto a minute. Some older computer aided dispatch systems rounded off to the nearest minute. Even with mobile dataterminals, not all personnel push the button at the same time, even if their agency requires it. For example one com-pany officer might push the responding button before donning protective clothing, another when the unit is actuallywheels rolling.
The best way today is to build and use a computer-based geographic mapping software model. If properly designedand aligned with real street level issues such as one-way streets and then benchmarked against real incident times,these models will give the most accurate travel time performance indicators available for station location planning.There are a variety of software choices available in several price ranges. See the accompanying article in this man-ual’s appendix.
There are several considerations to the use of these models. One is that they can measure travel time two ways – asa constant over the distance, like the old map and string days; or they can use an impedance loaded database modelthat actually uses different mean travel speeds over each street segment. While the actual speed model might bemore work to obtain and build accurately, it gives far better results. We know that in today’s traffic, fire apparatus andambulances cannot travel the same mean speed over the entire length of the travel distance. Large agencies withrush-hour traffic issues might need to look at times with and without the impact of rush hour.
CFAI Chapter6cx 10/17/03 1:36 AM Page 1

C H A P T E R S I X • 2 © 2 0 0 3 C O M M I S S I O N O N F I R E A C C R E D I T A T I O N I N T E R N A T I O N A L , I N C .
After travel time measures are studied, they must be combined with risk type locations and historical incident data.Again while state-of-the-art computer aided dispatch and records systems make this easy, manual methods also work.One way to integrate these study segments is to think of them as elements. Each element can be a layer on top ofa basemap. The study can then “look down” through all the data layers at once to see the interrelation of all the ele-ments. Without computer tools it is still easy to do this. Start with a large-scale basemap of the agency and lay it outfirst on a large table. Then using clear Mylar sheets build and lay over the base map the risk, distribution, concentra-tion and historical workload elements. You will still be able to look down through all the data at once to arrive at amore fully informed and integrated conclusion.
DistributionA statement of distribution is essentially the record of the location of resources to assure an all-risk initial interventionis within the specific time frame identified in a community’s performance goal statement for each risk type.
It is assumed that a “fire agency” serves a bounded geographical area made up of contiguous sub-areas separatedonly by natural or manmade areas, and those barriers limit that distribution of resources.
Historically, fire protection starts with a single resource, a fire station or apparatus in the center of a newly formed pop-ulation center. In general, population centers are located some distance from one another.
Depending upon what era the community began and when it increased in size, the distance and artificiality of theconcept of jurisdiction can affect the distribution and concentration of fire protection services. In short, sometimes twocommunities will develop independently of one another and then find that they are competing for jurisdiction whenthey grow closer together. The result is often an expensive duplication of resources.
Another issue is that this often results in competition for coverage of the areas, especially for the funding sources, pos-sibly to the point of reducing the desirability for cooperative efforts. In the contemporary fire service, the concept ofmutual aid and automatic aid, boundary drops and contractual services has reduced the negative impact of this factorto a degree. The practice of looking at resources on a geographical/regional basis, however, is a local policy decision.
To control fires offensively before they become large and to rescue trapped persons, a quick initial attack, backed upby a complete force, is required. This strategy dictates a well-planned fire station location and deployment system.
The life and fire loss potential sets the stage for how quickly fire companies must initially respond and how quicklyfollow-up resources must arrive. The distribution of fire companies must also consider the type of units needed, i.e.,fire pumper vs. a ladder unit. An additional key factor is that the units responding must be staffed with adequatelytrained personnel.
A relevant goal might be to quickly position two standard fire stream attack lines, coordinated with adequate ladderand support services. A 250 gallons-per-minute fire flow could require four fire fighters within six minutes total reflextime, followed by an additional 10 or so fire fighters within 10 minutes total reflex time to sustain or grow the fireattack. Many of these factors depend upon how the apparatus is configured and hose are lines deployed.
The spectrum for a defined distribution standard can vary from initial attack fires to a multi-alarm call for fire flows of3,000 gallons per minute or more. Fires above the fourth floor of any occupancy or special hazards may require evena greater number of firefighters and command personnel.
A defensive tactical objective to protect only exposures or fire spread to other buildings may reduce the overall staffingand equipment distribution requirements. This can be better described as an “exposure level of service.” Conversely,
CFAI Chapter6cx 10/17/03 1:36 AM Page 2

© 2 0 0 3 C O M M I S S I O N O N F I R E A C C R E D I T A T I O N I N T E R N A T I O N A L , I N C . C H A P T E R S I X • 3
an “offensive” level of service would require a timely distribution of staffing and equipment. This service level is appro-priate for the possible rescue of persons trapped within the building and for the control of the fire before it runs outof fuel and the building becomes totally destroyed.
Distribution implies that there are certain risks that will require resources beyond that available on initial attack. Thenext phase of a standards-of-coverage study should include an analysis of whether sufficient resources are availablewithin secondary and tertiary time frames to amass staffing, equipment and methodologies to deal with risk levelsthat demand extraordinary effort. This is best defined by describing the types and numbers of total resources that canbe committed to deal with specific risks.
This table as shown before is a representative matrix depicting an agency’s baseline fire flow goals by number ofengines and response time:
Number of Companies Company Due-in(four per crew) Time — minutes
Risk Type First Second Third plus
M a x i m u m 4 , 0 0 0 + g p m . . . . . 5 . . . . . . . 4 . . . . . . . 5 . . . . . . . 8
S i g n i f i c a n t 3 , 0 0 0 + g p m . . . . 4 . . . . . . . 4 . . . . . . . 6 . . . . . . . 8
M o d e r a t e 1 - 2 , 0 0 0 g p m . . . . . 3 . . . . . . . 4 . . . . . . . 8 . . . . . . . 8
L o w < 1 , 0 0 0 g p m . . . . . . . . 2 . . . . . . . 4 . . . . . . . 8 . . . . . . . -
S p e c i a l R i s k . . . . . . . . . . as needed
Agencies must not only analyze still alarm or single-family-dwelling responses, but also areas or occupancies thatdemand heavy fire flows and multiple-company response. Of course, mutual aid also can be figured into the totalresponse need.
Once the time goal has been set during the self-evaluation phase, the agency should evaluate whether its resourceshave been deployed properly within its jurisdictional boundaries to achieve its own response times within a certainlevel of predictability.
In essence, small fires don't make much of a difference in the resource allocation of any fire department. Major fireshave the significant impact. The dilemma that any fire agency has is staffing for routine emergencies and being pre-pared for the fire of maximum effort. This balancing act of distribution and concentration staffing needs is one thatalmost all fire agencies are dealing with constantly.
Distribution is measured by the percentage of the jurisdiction covered by first-due units within adopted public policytimelines for each risk type and outcome measure.These coverage measures could be: percent of square miles
percent of equally sized analysis areaspercent of total road miles in jurisdiction.
The measure of distribution is based on risk. Therefore it is possible for some low-risk demand zones to have ade-quate distribution of coverage because they can handle longer travel times, while high-risk zones have shorter traveltimes and might not get a first-due company on scene quickly enough to meet identified goals for that risk.
CFAI Chapter6cx 10/17/03 1:36 AM Page 3

C H A P T E R S I X • 4 © 2 0 0 3 C O M M I S S I O N O N F I R E A C C R E D I T A T I O N I N T E R N A T I O N A L , I N C .
In the above example, assuming travel is one box in all directions, a first-due company effectivelyserves only 83 percent of the jurisdictions demand zones.
Distribution strives for an equitable level of outcome—that is, everyone has a fire station approximately within the samereach in a community. Distribution is primarily based on equal probabilities that all areas experience fires, not totallyon the risk or consequence of those fires. For example, an area of low risk could have fire company travel times fargreater than that of a high-risk, high-consequence area, but would the citizens in the low-risk area accept a differentlevel of service? Additionally, aggressive EMS response times based on successful intervention in cardiac arrest caseswill drive distribution to be the same community wide, which negates different distribution based on risk.
A sample measure statement of distribution for a community might look like this:
■ 80 percent of all demand zones receive adequate first-due unit coverage.■ 65 percent of all Low Risk demand zones receive adequate first-due unit coverage.■ 85 percent of all Moderate Risk demand zones receive adequate first-due unit coverage.■ 90 percent of all Maximum Risk demand zones receive adequate first-due unit coverage.
A B
CFAI Chapter6cx 10/17/03 1:36 AM Page 4

© 2 0 0 3 C O M M I S S I O N O N F I R E A C C R E D I T A T I O N I N T E R N A T I O N A L , I N C . C H A P T E R S I X • 5
Later in the analysis phase, this community, after looking at concentration and reliability factors, would have to decide if it can live with the existing high-risk coverage or if an additional company, new station or station relocation is necessary.
I-Zone Fire Fighting Resources for a Standard of Response Cover PlanAs stated before, having the resources to combat a wildland/urban interface fire in the early periods before it becomesa potential catastrophic event is essential. This is the “last line of defense.” Once the fire has established itself, fire fight-ing resources will be needed to control and extinguish the fire. This ability has several key components.
Pre-Planning—as with any type of hazard, preplanning is important. This is even more true with wildland issues. Thereason for this is the changing environment. The access roads may not be in the same condition after the winter.Development may have modified the topography or placed new structure in harm’s way. It is important to review yourwildland areas each year prior to the wildland fire season. This review should include:
Access is a critical component of any wildland fire fighting system. If you can’t get to it fast, you may have no reasonto go there at all. Making sure the roads are accessible (keys for gates, roads wide enough and bridges that can sup-port fire apparatus) and maintained (drivable by the type of apparatus that will be used). The access to all hazardareas must be confirmed prior to the wildland fire season and maintained in the same condition until the winter rainsbegin. Since most fires are fought more safely from below, it is important to have safe access to the areas adjacentto interface structures whenever possible.
Water supply is critical to the success of any wildland operation. This can be accomplished with water points, water ten-ders, portable pumps (if local water is available) and municipal services. It is important to maintain the ability to movelarge amounts of water to remote locations in a short time frame. Without this capability, fire fighting operations will bereduced to hand tools only. These are not effective against a fast-moving fire when they are not supported by hose lines.
CFAI Chapter6cx 10/17/03 1:36 AM Page 5

C H A P T E R S I X • 6 © 2 0 0 3 C O M M I S S I O N O N F I R E A C C R E D I T A T I O N I N T E R N A T I O N A L , I N C .
Additional considerations such as weather and fire history must be considered. All aspects of weather can affect thefire. Temperature, humidity and winds will affect the probability of ignition and the ability to control and extinguish thefire. Weather patterns such as long- and short-term droughts must be considered. The history of wildland fires canprovide a valuable dimension for the assessment of fire potential for the upcoming year. There will be an increase inthe probability of a fire occurring in environments where they have occurred in the past. The severity and frequencyof past fires enable us to project the resource requirement in the future.
Response Resources—The current number and types of resources devoted to wildland fire suppression must be quantified.
Response Times—The issue of response times can be addressed based on the current deployment. It should be notedthat wildland fires by nature are in areas with difficult access. For this reason, response times are affected. Additionally,it is more difficult to state when the unit has arrived at the scene. For example, at a structure fire or medical aid inci-dent, the arrival at the address is the point at which response time clock stops. For wildland fires, this is more difficult.The fire apparatus may stop at several locations to get a size up of the fire prior to committing a hose lay. Many times,the unit may have to leave the paved road to find an access. The fire, often, is reported to be at the location where itstarted or was seen from, but upon arrival, the fire front is some distance away. This separation may require the unit toredirect other units or backtrack on some of its own route to make the best fire attack. For these reasons, responsetimes based on wildland fire must be viewed with more subjectivity than those of other types of fires.
Given the nature of wildland fire fighting, getting all initial attack resources to the scene within 30 minutes is not out-side of the norm in this area. Being able to place the first unit with water to the area within a 10-minute total reflextime means that structure protection can be initiated.
ConcentrationConcentration is the spacing of multiple resources arranged close enough together so that an initial “effective responseforce” can be assembled on scene within adopted public policy time frames. An initial effective response force is thatwhich will most likely stop the escalation of the emergency for that risk type.
For example, in urban/suburban areas, an initial effective response force is typically two to four units arriving within10 minutes or less total reflex time.
Such a response can stop the escalation of the emergency, even in high-risk areas. An initial effective response forceis not necessarily the total number of units or personnel needed if the emergency escalated to the maximum poten-tial. For example, if a building pre-planned for a worst-case fire flow of 4,000 gpm, it is possible that the jurisdictionplanned an initial effective response force to provide the gpm necessary (say 1,500 gpm) to contain the fire to a rea-sonably sized compartment of origin. Additional alarms or units from neighboring or distant jurisdictions, includingmutual aid, could be included in the planning.
If risk is well-defined, such as moderate, then the initial effective response force shall be planned for the predominant risktype found, supported by historical fire data showing what it took to control the average or “bread-and-butter” fire problem.Concentration is best measured by risk category type – high-risk areas need second- and third-due units in shortertime frames than in typical or low risk areas.
CFAI Chapter6cx 10/17/03 1:36 AM Page 6

© 2 0 0 3 C O M M I S S I O N O N F I R E A C C R E D I T A T I O N I N T E R N A T I O N A L , I N C . C H A P T E R S I X • 7
Concentration measures could be: percent of square milespercent of equally sized analysis areaspercent of total road miles in jurisdiction, for the number
of total units in the initial effective response force.
In this example, the community is served by three stations. The adopted effective response goal is to have three com-panies on scene within 10 minutes travel time to all demand zones. In this example assume that each station cancover one demand zone in each direction for first-due coverage and four demand zones in each (right angle) direc-tion for multiple unit coverage. Thus of the 24 demand zones, 12 (or 50 percent) are covered by an effectiveresponse force. Twenty-three demand zones (or 95.8 percent) are covered by at least two units within policy guide-lines. This measure may or may not meet the community’s needs based on risk assessment.
The art in concentration spacing is to strike a balance of how much overlap there should be between station areas.Some overlap is necessary to maintain good response times and to provide back-up for distribution when the first-due unit is busy on a prior incident.
A B
C
CFAI Chapter6cx 10/17/03 1:36 AM Page 7

C H A P T E R S I X • 8 © 2 0 0 3 C O M M I S S I O N O N F I R E A C C R E D I T A T I O N I N T E R N A T I O N A L , I N C .
Traffic Calming MeasuresMany communities today are faced with the issue of too much traffic or speeding traffic on residential streets. A setof measures called traffic calming tools can be implemented to slow or redirect traffic. There are more than 15 suchtraffic tools including radar enforcement, speed humps, medians and neck downs. Many of the physical tools thatslow traffic also affect fire and ambulance response times. Communities may desire to keep some of the more aggres-sive measures off primary response routes. A careful balance between response times and community traffic safetymust be sought. In several published studies, most notably by the Portland (Oregon) Bureau of Fire, it has been sub-stantiated that each speed hump or traffic circle adds an average of 10 seconds to response time. This is in additionto the damage to the fire apparatus and fire fighters. Thus a set of six speed humps on one response route adds oneminute to travel time!
Of course, most station locations were already spread as far apart as possible to control the staffing costs of theagency, so traffic calming delays will slow response past the point where the same performance objectives can stillbe achieved. Many agencies today designate “prime” response routes that feed into subdivisions and do not allowtraffic calming on those streets.
Trigger Point ThresholdsThere are other struggles in the massing of fire stations. One is what triggers another station as an area grows?
When a fire department establishes a response time criterion, it is anticipated that it applies to 100 percent of the areacovered by the boundaries of the fire department. However, that expectation is fraught with many problems. In the sim-plest of terms, the total area covered by a fire department may or may not be highly developed. In fact there are manyvariations on this theme. Older established cities tended to be denser and smaller in dimension. Newer communitiesmay be much larger in area than the first fire station can cover in a short time. Urban sprawl, which is a currently an activediscussion in other areas of public policy, has resulted in fire station construction and staffing being a topic of concern.
Usually when a fire department constructs its first fire station the area, the values at risk and hazards to be protectedfrom are within a close driving distance. In effect the fire station is a centroid for fire protection. From the time the first
CFAI Chapter6cx 10/17/03 1:36 AM Page 8

© 2 0 0 3 C O M M I S S I O N O N F I R E A C C R E D I T A T I O N I N T E R N A T I O N A L , I N C . C H A P T E R S I X • 9
station was built it creates an expectation that the facility can and will provide a timely response to calls for service.When the original criterion is set for response time from a facility, there is an immediate “location – allocation” for thatstation. This means that the station provides a response time to a given area within a reasonable time frame. Evenbefore any incident occurs in a community, the attributes of a community create a dynamic segmentation that resultsin the ability to predict what areas can be covered and those that will not be covered.
There are many components of the infrastructure that have an effect upon the location allocation concept. Amongthese are the road and highways network, impedance factors such as traffic patterns and processes (stoplights andsigns) and turn impedance, i.e. roadbed configuration and elevation impedance. It is axiomatic that there is an inversedistance-weighting factor that results in longer response times to areas further away from the centroid of the station.This is called distance decay. The manner and means of response involve the use of the roadbed, but also involvedealing with differences in elevation and competing vehicles on the roadbed. In short, the farther away from the loca-tion of an incident and the higher the impedance for response, the less effective that resource is in dealing with theinitial stages of an emergency event.
The concept of using travel time itself is not exactly new. However, for many years the basic criterion was road mileageonly. The standard was that a fire station was expected to reach any incident within 1.5 miles of the station within fiveminutes of driving time. Time was a secondary consideration. That standard was based upon data from the 1940swith respect to road conditions and traffic patterns. A lot has changed since then!
Current fire agency performance standards are based upon the rapid speed of fire growth and consequences of emer-gency medical situations over a short time frame. It has been determined that both fires and medical emergenciescan gain a foothold that results in excessive losses when these times are exceeded.
What is response failure? First, we must define what is being measured and how we measure the performance goal.For example, a basic question to be answered is whether a department is covering the “dirt” or the “incidents.” Arewe going to measure percentage of performance by first-due district, or department-wide? Generally fire protectionpractitioners try to position stations to cover 90 percent of the ground in each first-due district, provide overlap for con-centration, and allow for redundancy to handle multiple calls for service and for equity of access for customer serv-ice. It is economically impossible to cover 100 percent of the ground. Then based on actual call loading, we couldstrive for 80-90 percent of the calls within our first-due and concentration total reflex measures.
If the measure for either area or incidents is set at 80-90 percent effectiveness, how much “slop” over the perform-ance measure is acceptable? For example, if an historical incident measure is at the 88 percent point, but the othertwo percent are covered in the next 60 seconds, is that acceptable? Maybe yes, maybe no. It is important to under-stand risk, type of unmet calls and the total number of calls. If the deficiency is only two percent or 25 calls out of500, depending on the size of the measurement area, the gap may or may not be significant, economically justifiableor large enough to suggest more resources.
For example, if the performance requirement was to arrive at the scene of an emergency within four minutes of trav-el time, 90 percent of the time, then this criterion could be applied to one year’s response data to see if the goal wasachieved. It should be noted that this criterion allows for 10 percent of the calls to be beyond the four minutes trav-eling time over a given reporting period. This provides flexibility in the assessment of coverage to cope with anom-alies such as extraordinary response conditions, such as responding from out of district, or for delays caused by simul-taneous alarms. This raises an additional question: of the 10 percent overage, how many of the incidents are coveredwithin the next 30-60 seconds?
CFAI Chapter6cx 10/17/03 1:36 AM Page 9

C H A P T E R S I X • 1 0 © 2 0 0 3 C O M M I S S I O N O N F I R E A C C R E D I T A T I O N I N T E R N A T I O N A L , I N C .
The first indication of a problem in providing service is when the number of alarms that exceed the performance standardare documented. This may or may not be function of new growth. It could be the result of in-fill growth that causes a high-er number of alarms for the company than it can service. This is especially true when alarms come in simultaneously.
Moreover, when areas are being developed that begin to extend travel times, they do not automatically become thesource of new alarms. In fact, new construction often has a period of several years before creating service demandsfrom fire. That is not necessarily true from the perspective of emergency medical aids.
The question that many communities must address is: when is a second, third or thirtieth fire station required?Obviously, this has been answered in any community that has more than one fire station. The problem comes in find-ing a quantifiable threshold to determine that point for each specific situation. It varies from community to community.It also varies within a specific jurisdiction. The overall answer is partially financial and partially professional judgment. Infact, in today’s fire service literature, there is very little definitive guidance on how this should be accomplished.
The standard of cover process is based upon a growing body of knowledge aimed at quantifying deployment. Whatis unfortunate is that there is no universally acceptable algorithm. The fire protection planning process does easily allowfor an evaluation of potential loss as a result of deteriorating response times.
As the growth and development extends beyond the range of travel time of one station, the percentage of calls thatexceed the performance requirement should begin to increase. This may first appear as a change in the annual analy-sis of emergency calls. For example, if a department has 1,000 alarms and a 90 percent compliance with the responsestandard, then there would be about 100 alarms per year that were beyond the goal. This would be the baseline forexisting response performance. If the following year the number of alarms were 1,200 and percentage dropped to 85percent, this would indicate the department is losing ground on response performance. If the change in the numberof alarms had merely increased because of more calls in the same area, the response time percentage should haveremained fairly similar. However since the alarm rate went up and the performance went down, the failure thresholdmay be approaching. The change in alarms that were not met has now gone to 180 (or 15 percent). As stated earli-er, analysis must be performed on the deficiency to determine how many of those incidents were handled in theincrement of 60 seconds beyond the performance time.
Based upon actual response time analysis, one threshold that must be considered is the increase in alarms and thepercent of calls handled under the criterion adopted. Anything more than a 10 percent increase in missed calls anda 10 percent reduction in performance is a signal to evaluate the level of service being provided.
In larger departments most practitioners are factoring out non-emergency calls, and for actual incident performance,are only looking at core emergencies. The definition of core emergencies can be made locally based on risk andimportance to the community, but they are usually structure fires and moderate-to-severe status EMS calls.
In general more than one measure must be slipping, and then an evaluation of all of the standards of coverage fac-tors along with the reason why the data is slipping is required. A one-year snapshot may not be valid if the agency,for example, had a big storm event this year and stacked a bunch of calls just that month for that year only.
However, this approach depends upon having emergencies that do not address what is at risk. That is where the map-ping technology applies. As structures and different types of fire problems are constructed, they may represent addi-tional lives and property that are at risk, which deserve equity in protection. One of the elements for creating a gov-ernment entity is to control land use and to create mechanisms for collecting taxes and determining ownership.Furthermore, these same individuals are paying the taxes, fees and permits for the level of service being provided. Inone sense when growth occurs, the new properties are usually safer than the older part of the community becausethey are constructed to a higher standard.
CFAI Chapter6cx 10/17/03 1:36 AM Page 10

© 2 0 0 3 C O M M I S S I O N O N F I R E A C C R E D I T A T I O N I N T E R N A T I O N A L , I N C . C H A P T E R S I X • 1 1
For example, in growth communities, it is not uncommon to see new commercial and industrial occupancies pro-tected by automatic fire protection systems outside a station’s coverage area. What many communities understand isthat simply because an area is out of the range of the response standard, this does not trigger a new facility.
Assessed valuation or increased revenues in the form of benefit assessment or mitigation fees can provide the eco-nomic capacity for new fire stations to be constructed and staffed. One threshold that must be carefully monitored isthe revenue stream that accrues from development. That revenue stream should provide a threshold when differentelements of future fire stations can be determined. For example, it takes several years to evolve a location into a firestation site. As the revenue stream grows, funds could be available for site acquisition, initial plans and specifications,site treatment and then construction.
The threshold for construction could be to provide a new fire station into any zone in the city orjurisdiction that has more than 50 percent of its parcels developed. Some of the secondary meas-ures currently being used are 300-500 calls for service for any individual fire company or a serv-ice population of 10,000 to justify a full-time paid company.
This decision process then must be placed into the context of the staffing discussion. It is not uncommon to have astation constructed and have the staffing pattern evolve over years from one system to another. Given economic con-siderations it is not uncommon to see a station start out all volunteer, go to paid-on-call then finally full-paid status.
Experience in our industry has shown that it takes a multiplicity of standards of coverage factors to be out of balance,along with having additional economic resources to justify an additional paid company or staffing increase in one ormore companies.
For example, when Fire Chief Stewart Gary justified his fifth company in Livermore, Calif., in 1995, he had the north-west part of a district with 10-plus-minute travel times to a growing higher risk/jobs/tax base, and the closest com-pany was the department’s busiest. Furthermore, that company was being pulled in the opposite direction from theextended travel area, and the department call stacked 30 percent of the time. Lastly, the department did not haveenough on-duty total staffing for an effective initial response force of 15. Five factors were out of balance. As a result,the city directed additional revenue from growth to fund a reasonable increase in deployment. Other agencies havehad similar experiences. But, the reasons must be significant, not just a few calls, slightly over the benchmark to mod-erate risk areas. In slight excessive response situations, if we are only short on travel time to a reasonable number ofcalls, what other mitigation can be used, at what cost (auto detection, sprinklers, AED)?
One way to identify the variables and decision points in deciding whether an additional station area is needed wouldbe to place them into a matrix. The following is an example and is not meant to recommend given decision points:
CFAI Chapter6cx 10/17/03 1:36 AM Page 11

C H A P T E R S I X • 1 2 © 2 0 0 3 C O M M I S S I O N O N F I R E A C C R E D I T A T I O N I N T E R N A T I O N A L , I N C .
A single fire station is fairly easy to assess with respect to what it can do to cover a specific area. Time and distancedetermine what the fire apparatus will be able to do in intervening with emergencies. When that area of coverage isimpacted by growth, a process must be put into place to monitor the incremental changes that will occur. This requiresthat there be both performance measures in place and discrete data collected to point to the specific need to buildanother fire station.
Forecasting Response Time FailureAs a city grows in population, so will the number of emergency responses requiring fire department intervention. Thisincreased call volume places more demand on fire department assets. The new calls occur either in new areas farfrom an existing station (which results in long response times) or within the normal coverage area. Call volumeincrease results in each apparatus being busier, and thus each fire company has a higher probability of being busywhen another call for service comes in. This then requires an apparatus from another station to respond; the fartheraway the station, the greater the response time. As this simultaneous demand for department assets rises, responsetimes increase. At some point, the percentage of calls that meet the desired response time criteria will drop belowthe desired performance goals.
The threshold point is defined as the point at where a station drops below the desired response time performancestandards. The trigger point is the point in time where corrective action must be taken to avoid reaching the thresh-old point. Failure to initiate corrective action at the trigger point means we cannot get resources into the field to pre-vent falling below the threshold point. Corrective action could be adding new stations, shifting maintenance/trainingschedules to minimize reliability, relocation of a station within its area of coverage, or another deployment tactic thatensures performance levels remain above minimum response time goals. In forecasting response time failure thresh-olds, the goal is to evaluate existing data and be able to initiate corrective action before reaching the trigger point.
CHOICES
Maintain status quo
Temporary facilities and minimal staffing
Permanent stationneeded
Permanent stationessential
DISTANCE
All Risks WITHIN 1.5 miles
Risks 1.5 to 3.0 miles from existing station
Risk locations exceeding four milesfrom the station
Outlying risk locations exceeding five miles from the first station
RESPONSE TIME
First due co. is withinfour minutes totalreflex time, 90 percentof the time.
First due co. exceedsfour minutes traveltime 10 percent ofthe time, but neverexceeds 8 minutes.
First due co. exceedsfour minutes travel time,20-25 percent of thetime; some calls lessthan 8 minutes.
First due co. exceedsfour minutes traveltime, 30 percent ofthe time. Some callsless than 10 minutes.
PERCENT OF CALLS
100 percent in district
More than 10 percentof calls are in adjacent area
More than 20-25 percent of calls are in outlying area
More than 30 percentof calls are in outlying area
BLDG INVENTORY
Existing inventory and infill.
New area has 25 percent of samerisk distribution as in initial area.
New area has 35 percent of samerisk distribution as ininitial area of coverage.
New area has 50 percent of samerisk distribution as ininitial area.
CFAI Chapter6cx 10/17/03 1:36 AM Page 12

© 2 0 0 3 C O M M I S S I O N O N F I R E A C C R E D I T A T I O N I N T E R N A T I O N A L , I N C . C H A P T E R S I X • 1 3
As an example, let’s assume an agency’s response time criteria for a first-arriving engine is 50 percent within four min-utes, 80 percent within six minutes, and 90 percent within eight minutes total response time. The respective thresh-old points are 50/80/90 percent and our trigger points are somewhere between 0 to 5 percent above each respec-tive threshold point. The percentage of calls meeting the desired response time is also known as the level of com-pliance. Thus, we require a 50/80/90 percent level of compliance for our four/six/eight minute response time crite-ria for a first-arriving engine.
This analysis will demonstrate a methodology allowing decisions to be made prior to performance reaching the trig-ger point, thus allowing the department to avoid the failure threshold. This analysis will focus upon first-arriving engineperformance (distribution) but can be applied to second-arriving engine, first-arriving truck, or any other performanceindicator. An important factor in forecasting is not only the number of calls occurring within a 60-minute interval perarea, but also the type of call. Generally, EMS and other call types require a single responding apparatus and, ifrequired, an accompanying satellite vehicle. Fire calls, however, generally require multiple responding apparatus; anexample would be a typical risk structure fire requiring a minimum of two engines and one truck. At minimum, thecombined assets of two fire stations will generally be required to answer one structure fire call, whereas those samethree assets could handle three simultaneous single-apparatus calls.
The stations at risk (i.e., deemed vulnerable) require monitoring. If performance levels remain constant and abovethreshold levels, then no action is required. If performance levels drop, then a projection to determine the time whenanother apparatus, station relocation, or new station is required. The same methodology can be used for travel timeand effective response force response time criteria.
The following is a step-by-step procedure on how to employ this methodology. Hypothetical Engine 1 will be usedas the example in how to use forecasting to identify trigger points and prevent the station from falling below thethreshold point. In this example, we will show how to identify Engine 1’s trigger point for first-due first-arriving engine.
Step 1 – Calculate Baseline Data
We calculate Engine 1’s response time level of compliance assuming that the engine had 100 percent response reli-ability and a 100 percent level of compliance. Response reliability is the probability that the engine will be availableto answer a call within its own area. The following table displays the calculated values and actual levels of compliance.This data is used to identify threshold and trigger points in the two different methods shown below.
Response Reliability Level of Compliance – Fire Station 1Four minutes Six minutes Eight minutes
100 percent . . . . . . . . . . . . . . 51.7 percent . . . . . . . . 91.8 percent . . . . . . . . 97.2 percent0 percent. . . . . . . . . . . . . . . . . 16.5 percent . . . . . . . . 56.4 percent . . . . . . . . 87.5 percent
Step 2 - Response Reliability Method
Next, we plot the above data, as shown in the following graph. The graph shows that when Engine 1’s response reli-ability drops to 67 percent, we would expect the response time level of compliance to reach the threshold point (80percent compliance for eight minutes). Threshold response reliability of four minutes is around 96 percent. As longas Engine 1’s response reliability does not drop below those reliability levels, we would expect to meet or exceed ourrespective response time goals.
CFAI Chapter6cx 10/17/03 1:36 AM Page 13

C H A P T E R S I X • 1 4 © 2 0 0 3 C O M M I S S I O N O N F I R E A C C R E D I T A T I O N I N T E R N A T I O N A L , I N C .
As an excursion, let us assume that Engine 1 response reliability over the past five years has slowly degraded at theaverage rate of 2.0 percent a year for our six-minute response time criteria (current response reliability is 83.3 percent).Provided this degradation continues as projected, in 8.2 years we would expect to reach Station 1’s failure thresholdpoint (dropping from 83.3 minus 2.0 a year). The data was compiled 1997, thus we would expect to reach failurethreshold some time in earlier 2005. If it takes two years to put resources into place, then our trigger point is mid 2003(2005-2=2003) for the six-minute response time criteria. This method can be employed for any other desiredresponse time. It is important to note that the eight-minute criteria would appear to be met even with a response reli-ability of zero percent. This is because of the concentration of other adjacent fire stations (assuming increased work-load on those stations do not degrade their response reliability, which would probably also drop in turn).
Step 3 - Response Performance Method
Using the above information we can determine the trigger point for this station using a slightly different method basedon response time level of compliance. Overall, a 1.0 percentage drop per year was observed (we assume this dropis averaged over the period of a few years). We calculate it will take us six years to drop from 86.0 percent down to80.0 percent (6.0/1.0 = 6.0). Thus, we would expect to hit our threshold point in 2003 (the year of evaluation was1997). Employing the two-year lead time used above, we would expect our trigger point to be the year 2001.
Step 4 – Overall Evaluation
A fire department must evaluate all stations with compliance levels between 0 to 5 percent. General observations in othercities have shown that trends are gradual and drops rarely exceed one to two percentage points in a single year. Thecaveat to this statement is the addition of something (i.e. sports stadium, large retail center, etc.) that results in an unex-pected infusion of new calls. Your fire department must evaluate both methods on an annual basis. The worst-case trig-ger point should be used as the real trigger point; this minimizes the probability of the station hitting the threshold point.
100
80
60
40
20
00 20 40 60 80 100
Fire Station 1 - Response Performance
1st Due Engine Response Reliability
Leve
l of
Com
plia
nce
4 Minutes6 Minutes8 Minutes
Threshold Points
CFAI Chapter6cx 10/17/03 1:36 AM Page 14

© 2 0 0 3 C O M M I S S I O N O N F I R E A C C R E D I T A T I O N I N T E R N A T I O N A L , I N C . C H A P T E R S I X • 1 5
There are also non-incident reasons for unit performance decay. Maybe traffic patterns have worsened, out-of-districttraining hours have increased or the units must travel out-of-district for routine supplies. Many of these reasons canbe mitigated without adding additional response units. For example, traffic headaches could be lessened by using sig-nal light preemption systems. In large departments, some training can be delivered via cable television systems or inspread out “mini” training centers. Department couriers and roving mechanics can be added to bring supplies andsmall repair capabilities to the stations to increase in-district availability.
Equity in Mutual and/or Automatic AidAnother tough issue in deployment: equity, or what it means when neighbors share resources via mutual or auto-matic aid. Again in the fire service, we have not developed any standard measures of inequity. Frankly, for a variety ofreasons, partner agencies either get along on this issue, or they don’t. We do not mean the decision to share or notfor occasional mutual aid; we are talking about when agencies share first-due or first-alarm response areas to controladditional resource needs and improve customer service.
Usually equity discussions are more political than operational, and the parties to the agreement tend to strive for arough exchange of balanced resources over a long time period—such as one fiscal year. Agencies do not typically lookfor balance over a day, week or month, unless there is a large imbalance in use. The best agreements occur whenthe parties deploy like resources and must share deployment to a common area.
Imbalance occurs when the types of resources are vastly different, or one party has a significantly larger number of callsfor service. Agencies can try to strike a balance by using offsetting resources. For instance Agency X runs into Agency Y’sjurisdiction twice as often but has free use of Agency Y’s training facility, a facility that they don’t own. When the staffingor incidents get vastly unbalanced, some agencies charge the other on an agreed-to fee for service basis, which is stilloften less than the shortfall agency deploying a full resource. The bottom line is that the elected officials involved mustsee better customer service and perceive equity in the relationship, and usually people know that when they see it!
3-4.0 Miles
>35% Occupancy
5.0 Miles
>50% Occupancy
3.0 Miles
<25% Occupancy
10% Failure
<8 Minutes
30% Failure
>10 Minutes
Decision Process for Deployment Review
All risks between 1.5 miles & 2 miles?
Yes
Yes
No
Monitor
Temporary Station
Permanent Station
ST
AR
T
FA
CT
OR
S
No
Response records within adopted goals?
AnnualPerformance
Review
ProposedImprovement
in LOS
New Levelof Service
OPTIONS:• New Fire Station• 2 piece companies• Road network improvements• Fully sprinkler the risks• Other Alternatives
EstablishedResponse Zones
EstablishedResponse Goals
ExistingLevel ofService
Yes
Distance/Density(Travel) (Risk)
Response Failure(Performance)
20-25% Failure
>8 Minutes
CFAI Chapter6cx 10/17/03 1:36 AM Page 15

C H A P T E R S I X • 1 6 © 2 0 0 3 C O M M I S S I O N O N F I R E A C C R E D I T A T I O N I N T E R N A T I O N A L , I N C .
The flow chart noted above has been developed to explain the concept of how a fire department must perform peri-odic evaluation of its standards of response coverage to assure that there are no gaps, and consideration is given to“hard to service” areas. The flow chart works like this:
The starting point is the existing level of service. It can be a single fire station or it can be multiple fire stations. It makesno difference of exactly how many stations are in the matrix. What is significant are the first two decision points regard-ing all fire stations in the inventory. The next section of the chart deals with two essential planning decisions. The firstof these is whether or not the department has established fire demand zones and whether they are all within a rea-sonable travel distance from existing fire facilities. The standard that is used in this discussion is 1.5–2 miles. The ISOpolygon is usually 1.5 miles. However that was established 50 years ago. That was prior to the intervention of suchthings as traffic control devices, main thoroughfares, and traffic expediency devices. The second element is the estab-lishment of a response time goal. As stated in other sections of this document, it makes no difference if the goal isthree minutes of travel time, four minutes of travel time or five minutes of travel time with regard to the goal. What isimportant is that it be established with a fractile. For example, a response time goal of five minutes of travel time, 90percent of the time is a common industry norm. But once the response time goals have been established then thedepartment’s management information system should keep track of incidents.
In the utilization of this model, the two databases from which the evaluation should emerge is the city’s mapping envi-ronment and the city’s records management system. The former identifies the location of occupancies on the groundand the latter identifies the actual experience and performance of the department in providing protection to thosefacilities. The most common industry practice for those agencies that utilize a recognized standards of cover model isto perform an annual review to assure that both of these criteria are being met.
If the answer to the questions remain yes, the existing level of service is satisfactory.
However, in the event that one of the two thresholds is exceeded, then the department should be obligated to developa level of service improvement. Notably you can exceed one and not exceed the other. For example, a few scatteredbuildings beyond the range of the response time goal do not mean you have a serious problem. These particularoccupancies may not be the site of a specific emergency, therefore they would not be calculated in response timeanalysis. Conversely having all of the buildings within the fire demand zone does not mean that you will not haveresponse threshold failure.
There are many factors that can cause a fire department to not meet its response time goal other than fire stationlocation. These might include, but are not limited to, such things as extremely heavy traffic patterns during specificperiods of time and concurrent alarms that result in engine companies coming out of district more often than theyshould to provide first-in response to another district. There could be other factors such as seasonal weather condi-tions or specific community events that have a negative impact on the availability of a fire company to meet itsresponse time goals. It is important to note that response time goals are measured on a company-to-company basis.One should not make the mistake of averaging all of the responses in an entire community in calculating a fractile.This could result in certain outlying districts having very bad response records and the system not identifying them.
The purpose of the level of service improvement is to study fire station by fire station. The two study elements thatmust be reviewed for service level improvements are: 1. what factors are causing the response times to get lengthy,and/or 2. what areas are causing a call for service that previously had not been identified.
This takes you to a series of potential thresholds. The factors that are being evaluated to mitigate the problem couldbe such things as adding another fire station, outfitting a second company in an existing fire station, requiring improve-ments in the road transportation network, and including traffic expediting devices such as signal control by the fire and
CFAI Chapter6cx 10/17/03 1:36 AM Page 16

© 2 0 0 3 C O M M I S S I O N O N F I R E A C C R E D I T A T I O N I N T E R N A T I O N A L , I N C . C H A P T E R S I X • 1 7
emergency services. It also is conceivable that you could minimize risk by requiring built-in fire protection in thoseareas that are beyond travel distances or response time achievement.
At this point in the model the fire department should evaluate two conditions. The first is what percentage of theoccupancies are outside of a normal fire demand zone. The methodology here infers that you always take a look atthe fire demand zone that is immediately adjacent to the area in which growth is occurring. For example, if it is a pre-dominately residential area, then the assessment should be residential growth. If it is in an industrial area, then it islogical to look at industrial growth. To use a specific example, if an area had a total of 5,000 single- and multi-familyoccupancies within the time and distance of existing level of service, then 10 percent of that number (if that werereflected in the new growth area) should raise the level of monitoring by the department.
Reading across the bottom of the model there is a similar line with regard to response time thresholds. If your goalis to have a five-minute travel time 90 percent of the time and you are only able to achieve it 80 percent of the time,then it is time to start monitoring the conditions that are causing that delay.
There are software programs available that allow the fire department to identify the location of specific emergency eventsand also classify and categorize them by the length of time it takes to arrive. Therefore looking at any time the perform-ance measure drops below 10 percent, the main issue is to determine whether those long response times were withinthe existing level of service area or were generated by the area where the new growth has occurred. Notably on the firstof this chart, there is an indication that all of your responses stay within eight minutes. Once the department has identi-fied a number of responses that exceed eight minutes, it is almost always an indicator of outlying unprotected risk.
The second set of incremental observation is when you go to a 25 percent occupancy factor and a 25 percentresponse time failure. These are labeled in the model as the time and travel threshold that should generate consid-eration for a temporary fire station or the exercising of the other options that have been identified. If during an annu-al review a department discovers that it does have up to a 25 percent occupancy distribution, the second considera-tion that must be evaluated is the density of that distribution. One viewpoint is to look at approved development withregard to distribution and concentration. A single outlying building does not constitute much of a risk. However if thatbuilding were a hotel that was eight stories tall and it was in a somewhat rural area, there is reason to be concerned.Large housing tracts, particularly those that are planned unit developments, are especially important to note.
The single- and multi-family dwelling occupancy is the primary occupancy for the loss of life and property accordingto the fire records in the United States. Therefore, anytime there is a concentration of single-family and/or multi-fam-ily dwellings, there is an expectation of fire service levels being consistent with the level of service throughout theremainder of the community.
The last set of brackets constitute a 50 percent occupancy factor and any responses where the response failure ismore than 30 percent and response times exceed 10 minutes. If a fire agency has not provided a temporary stationand arrives at this condition, the liability for the community is extensive unless there is a specific policy establishingseparate response goals in different parts of the community.
For example, in a highly rural area it is not uncommon to have a different response time goal than in an urban area.These are usually defined by the density of the dwelling units per acre or the population concentration per square mile.
In the event that a temporary station is put into position and/or a permanent station is put into position, the annualreview process should provide documentation on what transpires as a result of that decision. Temporary fire stationsare a common practice in the fire service. However they have a tendency to sometimes be allowed to remain in placelong after the period of usefulness. Formative fire stations should always be in place when the occupancy density isequivalent of 50 percent of the land zoned for development.
CFAI Chapter6cx 10/17/03 1:36 AM Page 17

C H A P T E R S I X • 1 8 © 2 0 0 3 C O M M I S S I O N O N F I R E A C C R E D I T A T I O N I N T E R N A T I O N A L , I N C .
SummaryDeployment capability measures are the baseline of operations for standards of cover. The fire department needs to bethe expert on how these deployment measures apply over the entire landscape of a community. This chapter infers thatyou must establish these measures but moreover you must evaluate them on a frequent basis. At a bare minimum,deployment measures should be evaluated on each response through the management information system. Monthlyand annual reports should reflect the department's compliance with these deployment capability measures. In the eventthat these measures indicate lack of compliance, consideration needs to be given to redoing the standard of cover.
CFAI Chapter6cx 10/17/03 1:36 AM Page 18

© 2 0 0 3 C O M M I S S I O N O N F I R E A C C R E D I T A T I O N I N T E R N A T I O N A L , I N C . C H A P T E R S E V E N • 1
CHAPTER SEVENPERFORMANCE MEASUREMENTS USING STATISTICS
Fire Reporting Versus Performance ReportingFire reporting systems, for the most part, have been used to keep track of the total numbers of incidents, i.e. call work-load and types of calls being responded to, such as structural fires, vehicle fires, etc. In both cases these statistics areindications of workload but are not good for estimating the performance of a fire company. Furthermore, these sta-tistics were seldom aggregated and fed back to the source that developed them—the fire companies. Therefore, fire-fighters in general regard fire and EMS record keeping as a necessary evil.
This chapter will place a renewed interest on that data. Without accurate record keeping and periodic evaluation, nodepartment can clearly state that is either efficient or effective in dealing with the community fire and EMS risk.However, the emphasis is not on total, but rather increments—specifically increments of time and of type. For exam-ple, it may be very important that a department can clearly identify what percentage of time they meet the perform-ance objective for structural fires, but the time it takes to get to a public assist may not be as critical. This processplaces much more responsibility upon the individuals who gather the data in the organization to assure accuracy andcomprehensiveness of record keeping.
Validity of MeasuresConstructing valid measures is relatively new to the fire service. For too long we did not define time in a standardizedway, and we reported average time instead of percentage of completion related to a goal. Since using good statisticsin setting fire service performance goals is recent to our profession, we need to pause here and review the basics ofdesigning appropriate performance goal statements and measures.
Performance Standards – What Do They Really Mean?We hear a great deal about performance measures or standards in literature from the International City/CountyManagement Association (ICMA) and other public policy organizations. Chapter 7 of the ICMA publication Managing FireServices provides an overview of such concerns. This concept may well have its origins in the ICMA publicationPerformance Auditing for Local Government, published in 1989. Lastly, the ICMA Comparative Performance MeasurementConsortium continued to place a premium on the analysis of fire department performance criterion in the 1990s.
The net result to date is that many fire departments are actively pursuing the creation of performance criteria, intend-ed to be a definable level of effort or accomplishment. Very often, criteria are intended to be a goal rather thanabsolutes. But what do they really mean? Utilizing this SOC methodology, many EMS delivery systems around thecountry now use fractile (percentage) measures in their performance measures.
Fractile MeasurementsOn one hand, this is good as it moves our industry away from the concept of average, but do fractile measurementstell the whole story?
Another key point to understanding fractile measurements in deployment is figuring out what the percentage goal isgoing to cover. For example, 90 percent of all actual incidents is a very different measure from that of covering 90percent of all the ground in a community. Is the 90 percent a department-wide measure, a battalion-by-battalionmeasure or a first-due district measure?
CFAI Chapter7cx 10/17/03 1:37 AM Page 1

C H A P T E R S E V E N • 2 © 2 0 0 3 C O M M I S S I O N O N F I R E A C C R E D I T A T I O N I N T E R N A T I O N A L , I N C .
If a department “call clustered” downtown around a few busy stations, it might be easy for them to achieve XX-min-utes travel time, 90 percent of the time if all incidents department-wide are measured at once. However, the outerareas may never come close to 90 percent. If you intend to cover all your area with 90 percent compliance, then italways will take more units to cover the dirt than to cover all the calls department wide.
But, if we are protecting Mrs. Jones all over the city, should we not set, measure and guarantee compliance to 90 per-cent of each first-due area? Why should we use the low response time downtown incidents, where stations are moreconcentrated because of risk and call volumes, to average out the department-wide measure and pretend we havethe same coverage out in the suburbs?
Just in case it has been a few years since your last statistic and probability class, let’s do a quick review of the conceptsand how a manager can have an effect on departmental performance as it relates to the performance standards.
There are two basic components to a performance standard. First we have the measurable task. In this case we willuse part of response time—specifically turnout and driving elapsed time intervals. The task would be stated in min-utes for this standard. We will use 5:00 minutes (five minutes, zero seconds). The second part of the standard is thelevel of performance. This is normally stated in either an average or a percentage (fractile) of the amount of tasks thatfall at or below the desired level, for example 80 percent. In our example it would be either a five-minute average or5:00 minutes, 80 percent of the time.
Performance standards are easy to write. People sit down in budget meetings and do this all the time. But what doesthat mean out on the street where we provide our service? The measurable task is fairly simple. We will not debatethe issues of which timeframe to use here, as that is another discussion altogether. The issue is how we use the serv-ice level indicated in our performance standards.
AveragesRemember that an average is the sum of all the values in the data set divided by the number of pieces of data. Inthis measurement, every piece of data is counted and the value of that data has an impact on the overall perform-ance. For example, take the following data set:
DATA SET 1 DATA SET 20:01:28 . . . . . . . . . . . . . . . . . . . . . . . . . . . . . . . 0:04:120:02:22 . . . . . . . . . . . . . . . . . . . . . . . . . . . . . . . 0:04:220:02:30 . . . . . . . . . . . . . . . . . . . . . . . . . . . . . . . 0:04:240:03:24 . . . . . . . . . . . . . . . . . . . . . . . . . . . . . . . 0:04:280:03:35 . . . . . . . . . . . . . . . . . . . . . . . . . . . . . . . 0:04:300:04:12 . . . . . . . . . . . . . . . . . . . . . . . . . . . . . . . 0:04:350:04:57 . . . . . . . . . . . . . . . . . . . . . . . . . . . . . . . 0:04:570:05:00 . . . . . . . . . . . . . . . . . . . . . . . . . . . . . . . 0:05:000:10:35 . . . . . . . . . . . . . . . . . . . . . . . . . . . . . . . 0:10:350:11:59 . . . . . . . . . . . . . . . . . . . . . . . . . . . . . . . 0:11:590:50:02 . . . . . . . . . . . . . . . . . . . . . . . . . . . . . . . 0:59:020:05:00 Sum Average 0:06:35
As would be expected, the data set with the longer response times has a greater average. Without the two “bad calls,”the average performance would be 3:26, rather than the 5:00. These calls have a direct impact on the total per-formance measurements and farther they are from the desired performance, the greater the impact.
CFAI Chapter7cx 10/17/03 1:37 AM Page 2

© 2 0 0 3 C O M M I S S I O N O N F I R E A C C R E D I T A T I O N I N T E R N A T I O N A L , I N C . C H A P T E R S E V E N • 3
The most important reason for not using averages for performance standards is that it does not accurately reflect theperformance for the entire data set. As illustrated above, two bad calls skewed the entire average. While it does reflectall values, it does not really speak to the level of accomplishment in a strong manner.
FractilesWhen you deal with fractiles or percentages, the actual value of the individual data does not have the same impactas it did in the average. The reason for this is that the fractile is nothing more than the ranking of the data set. The80th percentile means that 20 percent of the data is greater than the value stated and all other data is at or belowthis level. For example, if you had 100 pieces of data and you put them in order of lowest to highest. Counting fromthe smallest, when you got to number 80, this would be the value of the 80th percentile. The methodology does notcare about the value of the data above or below this point. For this reason, fractiles can be misleading.
If we look at the two data sets used in the first example, we can see that the value for the 80th percentile is in factthe same (5:00).
DATA SET 1 DATA SET 20:01:28. . . . . . . . . . . . . 10%. . . . . . . . . . . . . . 0:04:120:02:22. . . . . . . . . . . . . 20%. . . . . . . . . . . . . . 0:04:220:02:30. . . . . . . . . . . . . 30%. . . . . . . . . . . . . . 0:04:240:03:24. . . . . . . . . . . . . 40%. . . . . . . . . . . . . . 0:04:280:03:35. . . . . . . . . . . . . 50%. . . . . . . . . . . . . . 0:04:300:04:12. . . . . . . . . . . . . 60%. . . . . . . . . . . . . . 0:04:350:04:57. . . . . . . . . . . . . 70%. . . . . . . . . . . . . . 0:04:570:05:00 . . . . . . . . . . . . 80%. . . . . . . . . . . . . . 0:05:000:10:35. . . . . . . . . . . . . 90%. . . . . . . . . . . . . . 0:10:350:11:59. . . . . . . . . . . . . 100% . . . . . . . . . . . . 0:11:590:50:02 . . . . . . . . . . . . . . . . . . . . . . . . . . . . . . . 0:59:020:05:00 Sum Average 0:06:35
In fact, the values of the last two data pieces could be any number (hours or days) and it would not have an impacton the fractile performance. This is important to understand when dealing with fractile measurements.
Fractiles are normally used because they show that the large majority of the data set has achieved a level of per-formance that is desired. It does this well. Its simply does not speak to the remaining data.
Measurements of Data and Central TendencySo if averages and fractiles do not tell the whole story, what can you use to see the facts? Here are some more toolsthat are useful in this quest.
Median: This is the center point of the data set. Exactly 50 percent of the data is above and below the medi-an. In a perfect bell shaped curve, this is also the mean but that is not always true.
Mode: The most frequently occurring score or data value in the set.
Interquartile Range: This is the difference between the score (value) representing the 75th percentile andthe score (value) representing the 25th percentile. Thus, 50 percent of the scores fell within the range.
CFAI Chapter7cx 10/17/03 1:37 AM Page 3

C H A P T E R S E V E N • 4 © 2 0 0 3 C O M M I S S I O N O N F I R E A C C R E D I T A T I O N I N T E R N A T I O N A L , I N C .
The foremost measure of central tendency is the standard deviation. Simply stated, standard deviation is the meas-urement of how far the data is away from the mean (average).
Standard Deviation: The standard deviation is the square root of the average squared deviation from themean. The standard deviation is kind of the “mean of the mean,” and often can help you find the storybehind the data.
To understand standard deviation, let’s use the bell curve (normal distribution). A normal distribution of data means thatmost of the values in a data set are close to the average (mean) and relatively few tend to be at one end or the other.
If you looked the normal distribution data on a graph, it would look something like this:
For our purposes, the x-axis (the horizontal one) is the measurable task in question (z- minutes), and the y-axis (thevertical one) is the number of times in happened for each value on the x-axis
Standard DeviationThe standard deviation is a statistic that tells you how tightly all the various examples are clustered around the meanin a set of data. When the examples are pretty tightly bunched together and the bell-shaped curve is steep, the stan-dard deviation is small. When the examples are spread apart and the bell curve is relatively flat, that tells you that youhave a relatively large standard deviation.
Computing the value of a standard deviation is complicated.
y
0 x
y
0 x
CFAI Chapter7cx 10/17/03 1:37 AM Page 4

© 2 0 0 3 C O M M I S S I O N O N F I R E A C C R E D I T A T I O N I N T E R N A T I O N A L , I N C . C H A P T E R S E V E N • 5
The equation states that the standard deviation equals the square root of the sum of squared differences of the scoresfrom their mean, divided by the number of scores.
On a graph, a standard deviation represents:
What does it all mean?Essentially it means that no single measurement can tell the whole story.
Each measurement has a place and a need. Fractiles, while good, need additional quantification to provide a level ofaccountability to the calls outside of the standard. This can be done by using such tools as standard deviation to establisha “stop loss point” at either the second or third standard deviation above the mean. For example, using the second stan-dard deviation as the measurement would place the value of the stop loss within 97.5 percent of all values in the set.
Using the two examples from the earlier discussion, the second standard deviation would set a stop loss value ofapproximately 12:00 minutes for all calls.
DATA SET 1 DATA SET 20:05:00 . . . . . . . . . . . . . . . . . . . average . . . . . 0:06:350:03:31 . . . . . . . . . . . . . . . . . . . St. Dev. . . . . . 0:02:520:08:31 . . . . . . . . . . . . . . . . . . . 1st . . . . . . . . . 0:09:270:12:01 . . . . . . . . . . . . . . . . . . . 2nd . . . . . . . . 0:12:19
Now with a performance standard of 5:00, 80 percent of the time and no calls for service over 12:00. The perform-ance standards have a more complete picture of the entire service provided. It is important to fully understand thedata on which you base your decisions. Using only one statistical tool can lead to erroneous conclusions on the partof the decision maker. Good data and good research will stand the light of day.
SummaryIn the opening of this chapter we noted that the performance movement has been growing in the fire service forabout 20 years now. A concurrent development has been the pressure upon public entities to develop a rationale forthe cost of those services. In 1990 ICMA published another MIS report that focused upon that factor. Entitled“Establishing the Cost of Services,” this publication has placed even more emphasis upon fire departments having astrong rational background for advocating public policy positions.
As is often stated in discussions of statistics, there are ways in which statistics can be manipulated and how informa-tion can be misrepresented. However, in this case the use of statistics to identify the performance of a fire depart-ment is a straightforward and appropriate use of real world data. Those departments that continue to utilize general-ized and perhaps inaccurate data will eventually be impacted by policy decisions that may not be in the interest offire protection goals and objectives.
One standard deviation from the average (mean) inboth directions encompasses 68 percent of the valuesin this group. Two standard deviations encompass 95percent of the values and three standard deviations 99percent of the values.
CFAI Chapter7cx 10/17/03 1:37 AM Page 5

CFAI Chapter7cx 10/17/03 1:37 AM Page 6

© 2 0 0 3 C O M M I S S I O N O N F I R E A C C R E D I T A T I O N I N T E R N A T I O N A L , I N C . C H A P T E R E I G H T • 1
CHAPTER EIGHT
HISTORICAL DEPLOYMENT PERFORMANCE
OverviewThis aspect of a standards-of-cover study is every bit as important as measuring travel time for distribution and con-centration. If an agency doesn’t look at other factors affecting deployment the wrong impression can be created.Adopting a policy does not mean that it is being adhered to. For example, simultaneous calls for service for one spe-cific company may mean that a second-due company must handle the call. This chapter proposes that all agenciesshould use retrospective analysis to see if the agency is performing within its expectations.
Before we proceed with this chapter another review of mathematical and statistical concept is in order. Measuring per-formance is another area where misapplying statistics to historical data can skew the results even in a well-intentionedstandards-of-cover study.
Use of Response Time DataFirst, this requires using real response data to evaluate your department’s performance. Fire service personnel havebeen complaining for years that they do not understand why they must fill out response records when they neversee the results being used. This particular topic answers that question. In fact accurate response data is absolutelyessential to conducting reviews of fire agency performance.
Once distribution and concentration policies are used to allocate resources, historical data must be used to determineif the current system is effective (i.e. meets the agency’s adopted response goals and standards). This type of studymust be accomplished at several levels. The first step is to apply the evaluation methodologies based on the actualresponses for the individual demand zones.
Then the process should be used for an entire first-in district. The second step is to apply the study to a citywide per-spective prior to making the final overall assessment. For example, if 100 percent of the jurisdiction should get a first-due unit 90 percent of the time, is it possible that an individual fire company may have a very high level of compli-ance? Is it possible that another company may have a very low degree of compliance? What if you have one or twoareas that have extremely long response times, but very few fires? What is important is that individual companies con-tribute to the department’s overall performance. Conversely, a fire company with very poor compliance can alsoimpact the community’s overall performance.
Some key points to keep in mind:A) If by map measurement you expect to cover an area within a specific response time, do you actually do it? If not,
why? Are actual traffic patterns such as rush hour flows slowing down responding companies? Do traffic lightson bridges create choke points during high incident demand periods? Are traffic calming devices and gated areascreating delays?
B) For a given multi-company area, or citywide measure, are compliance times for concentrations within acceptableranges? Is one area continually drawing in outside companies? Does simultaneous demand or multi-companyincidents create disproportionate demand? Did the risk analysis miss something?
C) Are your critical task analyses holding up? Maybe your distribution and concentrations are good, but an area hasgrown in population density. Perhaps there is an increase in structural fire problems, and the fire flows dictateincreasing company staffing to get all tasks done in a timely manner.
CFAI Chapter 8CX 10/17/03 1:34 AM Page 1
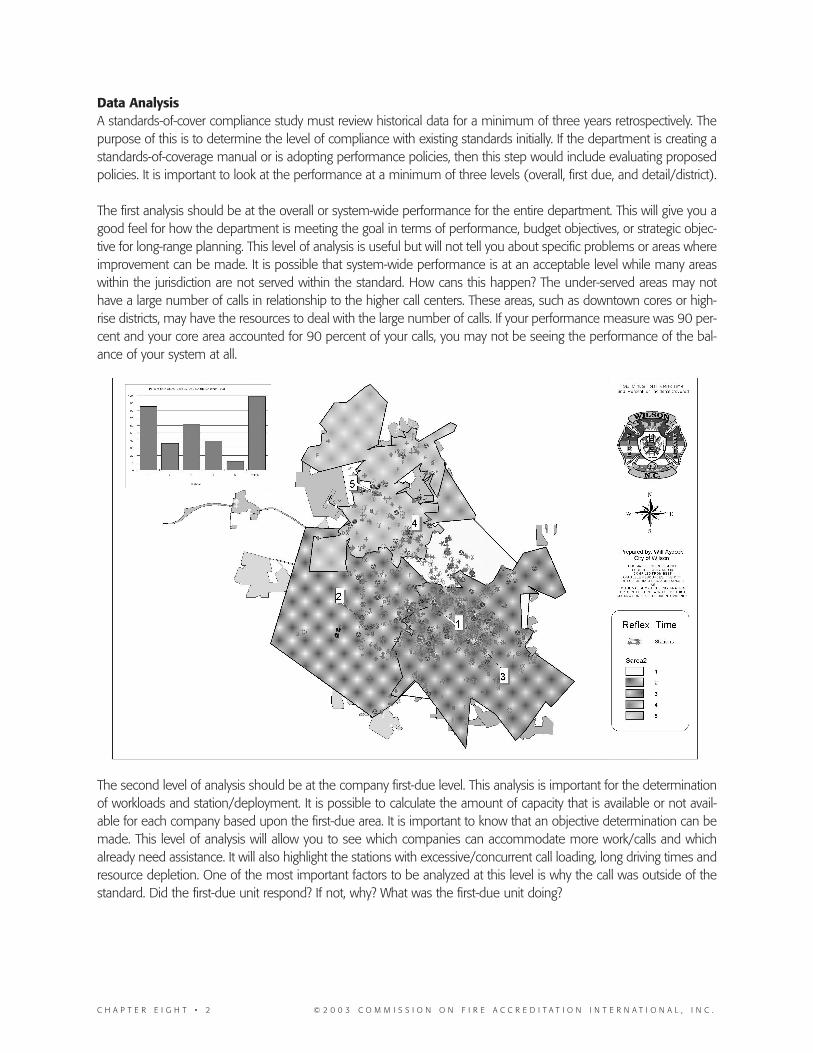
C H A P T E R E I G H T • 2 © 2 0 0 3 C O M M I S S I O N O N F I R E A C C R E D I T A T I O N I N T E R N A T I O N A L , I N C .
Data Analysis A standards-of-cover compliance study must review historical data for a minimum of three years retrospectively. Thepurpose of this is to determine the level of compliance with existing standards initially. If the department is creating astandards-of-coverage manual or is adopting performance policies, then this step would include evaluating proposedpolicies. It is important to look at the performance at a minimum of three levels (overall, first due, and detail/district).
The first analysis should be at the overall or system-wide performance for the entire department. This will give you agood feel for how the department is meeting the goal in terms of performance, budget objectives, or strategic objec-tive for long-range planning. This level of analysis is useful but will not tell you about specific problems or areas whereimprovement can be made. It is possible that system-wide performance is at an acceptable level while many areaswithin the jurisdiction are not served within the standard. How cans this happen? The under-served areas may nothave a large number of calls in relationship to the higher call centers. These areas, such as downtown cores or high-rise districts, may have the resources to deal with the large number of calls. If your performance measure was 90 per-cent and your core area accounted for 90 percent of your calls, you may not be seeing the performance of the bal-ance of your system at all.
The second level of analysis should be at the company first-due level. This analysis is important for the determinationof workloads and station/deployment. It is possible to calculate the amount of capacity that is available or not avail-able for each company based upon the first-due area. It is important to know that an objective determination can bemade. This level of analysis will allow you to see which companies can accommodate more work/calls and whichalready need assistance. It will also highlight the stations with excessive/concurrent call loading, long driving times andresource depletion. One of the most important factors to be analyzed at this level is why the call was outside of thestandard. Did the first-due unit respond? If not, why? What was the first-due unit doing?
CFAI Chapter 8CX 10/17/03 1:34 AM Page 2

© 2 0 0 3 C O M M I S S I O N O N F I R E A C C R E D I T A T I O N I N T E R N A T I O N A L , I N C . C H A P T E R E I G H T • 3
The third level is the detail level. This could be by district, grid, tax rate area, census block or any other discrete methodof dividing up the response areas that will fit inside of the first-due company analysis. At this level we will begin to seethe actual problem areas and opportunities for improvement. By calculating the performance at this level, you are ableto focus on the areas (calls) that are causing the performance issues. This is the level that we begin to discover wherethe problem is. An important issue at this level is the location of the calls that fall between the actual performanceand the intended standard. These are the calls that must be affected in order to show a performance increase.Improving all other calls will not change the fractile performance.
So you wanted to be at the 90th percentile and you are at the 71st. How do you get to the desired level? It is veryimportant to look into the data to see when, why, and where you are coming up short. Let’s start with when.
To view the data in a format that will allow for effective analysis, use a bar graph to look at calls by time of day. It ispossible to create a complex graph for looking at multiple issues.
For example in thegraph we haveused calls by timeof day in hourlyblocks. We havesubdivided the barsinto types of calls sothat we know whichtype of resource isbeing impacted
1 2 3 4 5 6 7 8 9 10 11 12 13 14 15 16 17 18 19 20 21 22 23 240
500
1000
1500
2000
2500
3000
3500
4000
HOUR OF DAY
CLA
SS
1997/98
Fire Calls
Other Calls
EMS Calls
CFAI Chapter 8CX 10/17/03 1:34 AM Page 3

C H A P T E R E I G H T • 4 © 2 0 0 3 C O M M I S S I O N O N F I R E A C C R E D I T A T I O N I N T E R N A T I O N A L , I N C .
With this analysis, it is possible to compare the call frequency, concurrent call loading (stacking or queuing), and avail-ability of resources to respond to those emergencies in a quick manner. This analysis could then be applied to theday of week as well. This is a good understanding of when the calls are occurring. The next question is why second-due units were needed to respond to the calls. By running the same analysis for each company, it is possible to pin-point the companies that are impacted by call volume and those that are not.
Now we need to know where they occur. Where are the calls that are outside of the performance objective? Is it asystem-wide issue or are they concentrated in pockets or clusters? The best way to view this type of information is toplace the data on a map (encoded data does this quickly and easily). In the map below, we have plotted the loca-tion of the calls that are between the actual performance and the desired performance. These are the call areas thatmust be improved. It is possible to view this with a tabular chart, but the map illustrates this analysis very well.
The second graphuses the same datato view the first-duevs. second-due units providing the service. We now begin tosee the relationshipbetween call and resources.
1 2 3 4 5 6 7 8 9 10 11 12 13 14 15 16 17 18 19 20 21 22 23 240
500
1000
1500
2000
2500
3000
3500
4000
HOUR OF DAY
CLA
SSCitywide Reliability - 1997-98
2nd Due
1st Due
CFAI Chapter 8CX 10/17/03 1:34 AM Page 4

© 2 0 0 3 C O M M I S S I O N O N F I R E A C C R E D I T A T I O N I N T E R N A T I O N A L , I N C . C H A P T E R E I G H T • 5
Now that we know when, where, and why we are not meeting the standard, the question that begs an answer iswhat do we have to do to get into compliance. By taking the data and constructing a histogram of the call frequencydistribution, we can actually see the performance gap, with this histogram, we also see the volume of calls that mustbe affected. Once the distribution of calls is graphed, placing the appropriate measures (mean, fractile goal, and stan-dard deviation) on the graph will provide most of the information needed in one single graphic.
The reality gap, how big is it?
In the graph above, 8,000 calls for service were used to produce the histogram. These were core emergency calls fora metro department. You can see the actual performance for five minutes (71 percent) is just over 30 seconds. The90 percent mark is 1.5 minutes beyond the current performance. Because the database has 8,000 calls, the depart-ment would need to improve the performance on the 800 calls between the 70th and 80th percentile in order tomeet the performance standard. An additional 800 calls would require improvement to move to the 90th percentile.
Data Analysis StepsResponse Reliability/Queuing (the concept)Response reliability is the percentage of time a company is in quarters and available to answer a call within its juris-diction. A company with a reliability of 95 percent historically has been in quarters and available to respond to answer95 percent of the incidents within its area. As call volume increases, however, the probability that the company isdeployed when another call is received increases as well. This results in a lower reliability of a company’s ability torespond to its assigned coverage area and would require an out-of-area company to answer the incident.
First Arrival WorkloadFirst arrival workload refers to the number of calls an in-area company responds to within its own area. Ideally, first-due companies respond to all calls in their own areas. When the call volume becomes too great, additional first-duecompanies must be added or first arrival reliability can drop below acceptable standards. Distribution is associated withfirst arrival workload where assets are dispersed in order to maximize the number of calls responded to by first-duecompanies. With regard to first arrival workload in the high-call volume area, concentration is the solution that wouldrequire multiple company stations or more “closely spaced” fire stations to ensure first arrival reliability.
Effective Response ForceEffective response force refers to the number of responding companies required to achieve a successful outcome foran area’s emergency incidents. Alarm assignments for each type of incident combined with the number of those inci-
CFAI Chapter 8CX 10/17/03 1:34 AM Page 5

C H A P T E R E I G H T • 6 © 2 0 0 3 C O M M I S S I O N O N F I R E A C C R E D I T A T I O N I N T E R N A T I O N A L , I N C .
dents determines the overall workload (or number of companies required). Each type of incident has its own uniquerequirements and demands on the system. Low-call volume and single-responder incidents may allow for greater dis-tribution of assets. However, higher call volume and multiple-responder incidents require greater concentration ofresources to ensure timely effective response force arrival.
Interdependency of Adjacent StationsDistribution and concentration are determined by the interdependency of adjacent stations and the needs of each area’sspecific workload. Evaluating first arrival workload and total response workload results in a balancing act of allocation ofdepartment resources. While it is important to have a prompt first arrival, it is also important to ensure arrival of an effec-tive force (multiple companies) within prescribed standards. Because adjacent fire stations often lend mutual support toone another when needed, a ripple effect can occur during high-demand periods. One company may respond intoanother area covering a near simultaneous or multi-company call, only to have an incident occur within its own area. Thisresults in yet another station’s company responding to cover the vacant area, thereby creating a ripple or domino effectthat can be felt throughout the department. Basically, what occurs in one station’s area can directly or indirectly affect mul-tiple adjacent stations. Removal or relocation of a company can cause a ripple effect felt throughout the department, theseverity of which is determined by the additional workload shouldered by adjacent stations.
Definitions of terms:
A) Company performance refers to evaluating how well that company is handling the workload and the value it pro-vides to the community.
B) Area response performance refers to the services rendered to that area (i.e. like the percentage of responsesunder four minutes, etc.) by the various companies that respond into that area.
C) First-due response refers to the ability of assigned first-due companies to handle the incident workload within itsarea. Essentially, this is how well the area’s first-due responders are handling their immediate workload.
D) Second-due response refers to the ability of assigned second-due companies to respond to the workload in itsarea and adjacent areas. Essentially, this is how well the area’s second-due responders are providing assistanceto the first-due responders.
E) Effective response force refers to the ability to assemble the required assets needed to respond to multi-respon-der incidents. Essentially, this is how well the interplay of company distribution and concentration allow for timelyarrival of adequate forces for incidents requiring more than one responder.
Statistical Analysis (and Queuing Theory):Statistical analysis is basically the art and science using existing data to understand the operational dynamics of a real-world system. In the fire service we can use statistics to find ways to improve our performance. Proper use of statis-tical tools such as queuing theory allows us to try and predict ‘what-if’ situations, such as company reliability givenincreasing workload.
As the number of emergency calls per day increases, the probability increases that a needed piece of apparatus willalready be busy when a call is received. Consequently, the department's response reliability decreases.
To illustrate, consider a detached single-family home. It is in the moderate risk category, so the alarm assignment is twoengines, one ladder truck, 12 firefighters and one battalion chief. The maximum prescribed travel time is five minutesfor the first-due company and eight to 11 minutes for the remainder of the assignment. If one of the engines is already
CFAI Chapter 8CX 10/17/03 1:34 AM Page 6

© 2 0 0 3 C O M M I S S I O N O N F I R E A C C R E D I T A T I O N I N T E R N A T I O N A L , I N C . C H A P T E R E I G H T • 7
busy at another call, the minimum amount of staffing and equipment will probably reach the scene by the maximumprescribed travel times. The probability of this unavailability is one measure of the fire department's reliability.
In measuring response reliability, take all types of calls for service into account. Emergency medical service (EMS) callsobviously impact greatly the availability of all fire companies. An overall evaluation may indicate that EMS call volumeis dictating the need for more companies or stations.
Usually response reliability is derived from historical data and is expressed both by company statistics and citywidestatistics. If enough historical data is available, predications can be made with a computer model as to future responsereliability. Be very careful in this endeavor. Queuing theory models can be quite complex and not always fit emergencyresponse trends. Private ambulance companies operating fluid system-status-management models spend a lot ofmoney in this area with mixed results.
For most response reliability studies in non-metro areas, the historical look will be sufficient. It may be cost efficient todeploy resources into new areas and to frequently review response reliability, adjusting as work loads creep-up, insteadof trying to live by the sword of predications.
Advantages of Queuing Theory. Queuing theory provides us a simple means of predicting or extrapolating the relia-bility of a company. Just as firefighters have different types of apparatus and equipment for different tasks, analystshave different types queuing models for different mathematical problems. With knowledge of the probability of a calloccurring (arrival rate) and how long it takes to service a call (mean service time), one can estimate the reliability ofa company as a function of call volume.
Potential pitfalls. Queuing theory models are based upon certain parameters and assumptions. As long as theseparameters and assumptions are followed, calculated results should be fairly accurate. The more these parametersand assumptions are violated, the greater the probability that the answer provided by queuing theory will be invalid.Using a statistical tool outside the guidelines for which it was designed is like trying to pound a nail into a board witha screwdriver (you won’t get good results).
Limitations of queuing theory1) The general queuing theory models assume a one-to-one server-to-customer ratio. That is, queuing theory
assumes a single responder to a single incident. The more multiple responder incidents you have, the morequeuing theory will overestimate your company’s reliability and ability to handle the workload. Failing to accountfor multi-responder incidents while using queuing theory will result in overly optimistic predictions for first-due,second-due, and effective force performance.
2) The arrival rate of an incident (the probability of arrival) is assumed to remain constant throughout the entire timeof evaluation. The more the arrival rate varies, the more invalid the results. Fire service data indicates that inci-dents are not equally time spaced. Also, some types of incidents occur more often in specific time periods (suchas fires in the home during dinner hours). Queuing theory will tend to average things when incident arrival ratevaries. That is, it will give overly optimistic results for peak demand periods and underestimate capability duringlow demand periods. Maintenance and training out-of-service times also must be accounted for or else queuingmodels will calculate reliability to be overly optimistic.
3) The mean service time (the average time it takes a company to service a call) is assumed to be from the sameprobability distribution (i.e. have the same mean and variance). In layman’s terms, it is assumed that all calls takeabout the same relative amount of time to service. Queuing theory can be considered valid for grocery storesbecause everyone is doing relatively the same thing—buying groceries—and the only variation in service time
CFAI Chapter 8CX 10/17/03 1:34 AM Page 7

C H A P T E R E I G H T • 8 © 2 0 0 3 C O M M I S S I O N O N F I R E A C C R E D I T A T I O N I N T E R N A T I O N A L , I N C .
depends upon the amount of items bought (assuming a check or credit card isn’t declined). Conversely, it maynot be valid for an automotive repair shop because doing a tune-up and rebuilding an engine are two totally dif-ferent tasks. The auto repair analogy holds true for the fire/rescue industry because of the diversity of incidenttypes. As with arrival rate, the more the mean service times vary for different incidents (medical, auto accident,structure fire, etc.) the more suspect the results become. Service times will be averaged and could predict overly opti-mistic reliability for long-service-time calls and under predict reliability for short-service-time calls.
Validation (whether predictions match reality). Queuing theory results should always be benchmarked against actualdata. Calculated results should always be viewed as suspect until validated with real data. Prediction should match reallife. Predictions that do not match real life data indicate that the statistical model is invalid and should not be used. Evenif the results match real data, if the parameters and assumptions are violated, then the outcome was coincidence andthat the model should still be considered invalid. Investing in the stock exchange with a model that has not been vali-dated is one thing; betting someone’s life on a model that has not been validated is something different.
Regression Analysis (predicting the future using real data). Regression is another statistical technique that can be used to predict outcomes such as company reliability. Withregression, we essentially take a set of data points and look at the trend (i.e. which way would the line go if you weretrying to extrapolate or predict beyond the farthest data point). Regression techniques are less restricted by parame-ters and assumptions than is queuing theory. Simply plot the data and look at or calculate the trend. The data repre-sents the variation of arrivals, multiple response incidents, maintenance and training out-of-service times, and otherreal life factors not accounted for in queuing theory.
A disadvantage of regression is that you must have existing data in order to predict an outcome (the more data pointsthe better the prediction). Regression also assumes that the operating baseline parameters of the system do notchange over the time of evaluation (i.e. adding a second company to a fire station will change response times andhence the baseline). Regression requires an apple-to-apple comparison for the data used. There are different tech-niques one can use to fit a line or curve to the data.
In summary, statistical tools are only valid when they are used exclusively for the missions they were designed for(such as comparison of ambulances, engines, and trucks). One can stretch the use of an apparatus or a tool, but wemust realize that we are using something for what it was not intended. Many statistical tools are different and can beused to complement each other. These tools also can be used to help validate each other's results (the best tool ofall is real data). No single tool can be the answer for everything. Statistical tools provide one method to evaluate orpredict performance, but must be used with caution. The following provides an example illustrating these concepts.
Example: A Queuing Theory Pitfall
Let’s assume staff recommends a new ladder truck (at Fire Station BB) at the expense of an existing engine company(closing Fire Station AA). The fire department’s analytical staff used queuing theory to justify and support the decision.It was predicted that 80 percent of Fire Station AA’s workload could be shifted onto adjacent Fire Station ZZ. The fol-lowing is staff’s summary of the analysis supporting this decision:
“We assume that 70 percent of incidents occur during the peak 14 hours of the day; this amounts to a 20percent increase in arrival rates over the daily average. The utilization calculated is for this peak 14-hourperiod of the day. We also assume that the engine companies are the first responding unit in two-com-pany stations. Although this may not be true in all circumstances, it is sufficiently close to actual operationsfor our purposes. The mean service times for the fire companies was calculated form the actual incidentslast year; these figures were used to estimate the utilization figures below.”
CFAI Chapter 8CX 10/17/03 1:34 AM Page 8

© 2 0 0 3 C O M M I S S I O N O N F I R E A C C R E D I T A T I O N I N T E R N A T I O N A L , I N C . C H A P T E R E I G H T • 9
“These figures indicate that Engine ZZ’s workload, due to additional calls in Still District AA, will increase byapproximately 6 percent. Because Engine ZZ will have a higher workload, a portion of the incident responseswill revert to Truck ZZ as the second-due unit in Still District ZZ. Roughly 80 percent of the time both EngineZZ and Truck ZZ would be available for handling new emergencies; and 95 percent of the time Truck ZZwould be available for handling new emergencies while Engine ZZ is busy. Queuing theory calculates theprobability that calls in Still District ZZ (including Station AA’s) will arrive when both Engine ZZ and Truck ZZare busy is 0.024; thus, only 2.4 percent of the calls (110 incidents) will be handled by other companies.Because Station ZZ is a two-company station, queuing models indicate it can handle the larger workload.”
As worded, the above statement would lead the general public to believe that Fire Station ZZ’s workload could beincreased by 30 percent and that the station could handle 97.6 percent of the new workload. Upon reviewing thesection discussing queuing theory, and real data, we will find that this analysis has violated some of the conditionsthat make queuing theory valid. The following are some readily apparent invalid assumptions/parameters:
1) The analysis implies a one-to-one apparatus-to-incident response ratio.2) The arrival rate of incidents is assumed to be constant over a 14-hour time period.3) The mean service time for incidents is averaged for a variety of calls.4) The analysis fails to match real data.
First, this analysis assumes a single response to a single incident during the 14-hour peak demand period. The follow-ing table shows the number of first arrival incidents, total number of responses, and response/incident ratio. Theresponse/incident ratio is the number of responses divided by the number of incidents. The ratio tells us that we canexpect to need 121 responders for every 100 incidents during Station ZZ’s peak demand period. Thus, actual workloadin Station ZZ’s area is 21 percent greater than indicated when using number of incidents alone. This in turn severelyunder-estimates actual workload and makes queuing theory results appear better than would be actually experienced.It is important to note that the percentage of incidents occurring within the 14-hour peak demand time period is clos-er to 76 percent than 70 percent. Underestimating actual workload will result will result in overly optimistic queuing the-ory predictions. The following table shows the actual incident and response workload for the districts in question:
Incident and Response WorkloadNUMBER OF STATION ZZ STATION BB
TOTAL 14-HOUR PEAK TOTAL 14-HOUR PEAK Incidents . . . . . . . . . . . . . . . . . . . . . . . 3,395 . . 2,562. . . . . . . . . . . . . . . . . . 1,347 . . 1,033First Arrivals. . . . . . . . . . . . . . . . . . . . . - . . . . . 2,375. . . . . . . . . . . . . . . . . . - . . . . . -Responses . . . . . . . . . . . . . . . . . . . . . 4,090 . . 3,096 . . . . . . . . . . . . . . . . . 1,562 . . 1,205First Arrival Percentage . . . . . . . . . . . - . . . . . 92.7%. . . . . . . . . . . . . . . . . - . . . . . -Response/Incident Ratio . . . . . . . . . 1.2 . . . . 1.21. . . . . . . . . . . . . . . . . . . 1.16 . . . 1.17
Second, the incident arrival rate varies over time. The greater this variation, the less reliable the calculated results.Figures C-1 and C-2 illustrate the incident call volume and actual response workload volume per hour. The dark areasrepresent time periods that exceed the average arrival/response per hour rate. It is during these “dark area” time peri-ods where queuing theory would over predict performance capability. Note that both districts experience above aver-age demand during the same hours of the day. This implies a simultaneous demand problem should these districtsbe combined. Also, incident arrival rate varies much as 67 percent (217 versus 128) over the 14-hour time period.Queuing theory tends to average things when variation is experienced. Averaging generally results in over estimatingone’s performance during above average demand time periods.
CFAI Chapter 8CX 10/17/03 1:34 AM Page 9

C H A P T E R E I G H T • 1 0 © 2 0 0 3 C O M M I S S I O N O N F I R E A C C R E D I T A T I O N I N T E R N A T I O N A L , I N C .
FIGURE C-1 • Incident Per Hour Call Volume
Third, response service times (the time it takes to service a call) are averaged. Data was not available to properly eval-uate the effects of varying service-time-per-call type. Averaging of these service times per specific incident type wouldlead to over estimating performance (reliability) during calls that require excessively long service times.
Fourth, the calculated results fail to replicate real results. In the prior year, Station ZZ (engine and truck responses) wasonly able to respond to 92.7 percent of the incidents. It is physically impossible to increase a station’s workload andexpect response reliability to increase from 92.7 percent up to 97.3 percent. In reality, one would expect station reli-ability to drop as station workload increases. Figure C-3 displays a second order polynomial curve fit for five years ofStation ZZ data. Regression techniques indicate that ability to handle the workload will drop from 86 percent down to81 percent if the total response workload for Station ZZ increases 30 percent.
FIGURE C-2 • Response Per Hour Call Volume
300
250
200
150
100
50
00 5 10 15 20
Hour of Day
Num
ber
of In
cide
nts Still #Z
Still #A
14 Hour Peak Period
300
250
200
150
100
50
00 5 10 15 20
Hour of Day
Num
ber
of R
espo
nse
Still #Z
14 Hour Peak Period
Still #A
CFAI Chapter 8CX 10/17/03 1:34 AM Page 10

© 2 0 0 3 C O M M I S S I O N O N F I R E A C C R E D I T A T I O N I N T E R N A T I O N A L , I N C . C H A P T E R E I G H T • 1 1
FIGURE C-3 • Percent of Workload Answered Per Total Response Workload
Example bottom line: The more we divert from the fundamental foundations that make a statistical model valid, theless valid the results of that statistical model. When used properly, statistical analysis provides a vital tool for helpingus make the correct decision. However, we must take care not “to use a screwdriver to pound a nail into wood.” Alwaysrepeatedly check results with real data. If a statistical tool fails to model reality, there is no confidence that it will modelanything else accurately.
Sample Statistical Overview of DeploymentThe following is an example of one method to conduct the snapshot of how we are doing based upon real life data.The data, goals, and standards used in this example are actual data from a mid-sized U.S. city. Table C-2 providesmore information such as apparatus distribution and concentration, and other data discussed in the example below.Each fire station has a single engine that is assumed to be the district’s first responder. Trucks provide first backup fortheir assigned areas (stations 1, 4, 8, and 10) and truck coverage to the non-truck company stations.
2,500 3,000 3,500 4,000 4,500 5,000 5,5000.8
0.84
0.88
0.92
0.96
NUMBER OF RESPONSES IN 1996
PER
CEN
TAG
E O
F W
OR
KLO
AD
HA
ND
LED
Estimated New Station 1 Workload(approx. 5200 responses)
% = 0.92184 + M * 1.367e-5 - M * 5.9491e-9 R2=0.91067where M = number of responses
CFAI Chapter 8CX 10/17/03 1:34 AM Page 11

C H A P T E R E I G H T • 1 2 © 2 0 0 3 C O M M I S S I O N O N F I R E A C C R E D I T A T I O N I N T E R N A T I O N A L , I N C .
TABLE C-2Fire Department Distribution and Concentration
Fire Station . . . . . . . First Responder(s) . . . . . . . . Second Responder1 . . . . . . . . . . . . . . . . Engine 1 . . . . . . . . . . . . . . . . Truck 12 . . . . . . . . . . . . . . . . Engine 2 . . . . . . . . . . . . . . . . -3 . . . . . . . . . . . . . . . . Engine 3 . . . . . . . . . . . . . . . . -4 . . . . . . . . . . . . . . . . Engine 4 . . . . . . . . . . . . . . . . Truck 45 . . . . . . . . . . . . . . . . Engine 5 . . . . . . . . . . . . . . . . -6 . . . . . . . . . . . . . . . . Engine 6 . . . . . . . . . . . . . . . . -7 . . . . . . . . . . . . . . . . Engine 7 and
Trauma Squad* . . . . . . . . . . . -8 . . . . . . . . . . . . . . . . Engine 8 . . . . . . . . . . . . . . . . Truck 89 . . . . . . . . . . . . . . . . Engine 9 . . . . . . . . . . . . . . . . HazMat**10. . . . . . . . . . . . . . . Engine 10 . . . . . . . . . . . . . . . Truck 1011. . . . . . . . . . . . . . . Engine 11 . . . . . . . . . . . . . . . -12. . . . . . . . . . . . . . . Engine 12 . . . . . . . . . . . . . . . -13. . . . . . . . . . . . . . . Engine 13 . . . . . . . . . . . . . . . -14. . . . . . . . . . . . . . . Engine 14 . . . . . . . . . . . . . . . -15. . . . . . . . . . . . . . . Engine 15 . . . . . . . . . . . . . . . -16. . . . . . . . . . . . . . . Engine 16 . . . . . . . . . . . . . . . -17. . . . . . . . . . . . . . . Engine 17***. . . . . . . . . . . . . -
*Trauma Squad-7 became operational mid 1996. **HazMat-9 is staffed but is considered a non-responder for purposes of this example.***Fire Station 17 became operational mid 1996.
1) Establish and identify the performance goals and standards. Current goals and standards are citywide measuresonly. This city’s current goals and standards address first arriving company and effective response force arrival(two engines and one truck). Because each city/county is unique, goals/standards should be based upon eachmunicipality’s specific needs and risks. Table C-3 illustrates city response time standards for first arrival and effec-tive response force.
TABLE C-3First Arrival and Effective Response Force Time Goals
TOTAL RESPONSE FIRE DEPARTMENT GOALS CITY STANDARDSTIME (CITYWIDE ONLY) (CITYWIDE ONLY)
First arrival Effective Force First arrival Effective Force< 4 minutes. . . . . . . . . . . . . . . . 50%. . . . . . . . . . - . . . . . . . . . . . . . . . . . . - . . . . . . . . . . . . . -< 6 minutes. . . . . . . . . . . . . . . . 80%. . . . . . . . . . - . . . . . . . . . . . . . . . . . . - . . . . . . . . . . . . . -< 8 minutes. . . . . . . . . . . . . . . . 100%. . . . . . . . . - . . . . . . . . . . . . . . . . . . 90%. . . . . . . . . . . -< 12 minutes. . . . . . . . . . . . . . . - . . . . . . . . . . . . - . . . . . . . . . . . . . . . . . . - . . . . . . . . . . . . . 90%
Each district serviced by a fire station should also have its own set of goals and standards. This prevents high-call-volumestations from skewing the results and helps to ensure comparable response rates throughout the city. It is best to eval-uate each station’s ability to respond to the workload individually and then combine results to evaluate citywide
CFAI Chapter 8CX 10/17/03 1:34 AM Page 12

© 2 0 0 3 C O M M I S S I O N O N F I R E A C C R E D I T A T I O N I N T E R N A T I O N A L , I N C . C H A P T E R E I G H T • 1 3
performance as a whole. If risk types in districts differ from typical risks (i.e. an equity issue), then different service lev-els may be required for each unique area. An area with older, closely spaced homes and substandard fire flow maynecessitate a faster response time than newer, more dispersed homes that have adequate fire flow. For the remain-der of this study we will assume that citywide goals/standards are also those set for each station and its assigned area.
2) The next factor is ensuring that the data you are collecting has the measurements that will allow you to evaluateyour performance. Inaccurate data will lead to inaccurate results. To make decisions you need information; tomake good decisions you need good information. The more information you collect for each specific incident,the more in-depth analysis you can conduct.
3) Evaluate company reliability to determine if the assigned companies can handle the area’s call volume. Thisincludes adjacent fire stations when evaluating the time it takes to construct an effective force (as defined above).Evaluate each individual fire station to determine if goals/standards are being met and then combine the resultsinto a total to determine if citywide goals/standards are being met.
When evaluating reliability it is important to look at which companies are responding to a call, not their respectiveresponse times (evaluating response time performance will be covered in the next section). In reliability our goal isonly to determine if distribution and concentration policies allow us to adequately cover the workload. Ideally, forcedeployment should allow us to meet our goals and standards.
Evaluating First Arrival Response ReliabilityThis is achieved by dividing the total number of a specific area’s first-due apparatus by the total number of incidentswithin that area. Because not all calls require a first responder, a more accurate method would be to divide the num-ber of first responses by the number of incidents requiring an actual apparatus response (in this case an engine, truck,or trauma squad). As reliability drops, out-of-area responders must pick up the missed calls. At a certain workload, asecond first-due apparatus should be added to ensure adequate reliability for that station’s area.Reliability = (number of responses) / (number of incidents)
Rough Data Example: Engine 1 responded 2,827 times within the Station 1 area resulting in an 81.9 percent relia-bility (2,827 responses/3,452 incidents).
Detailed data example: In reality, only 3,395 incidents within Still District 1 really required a first responder. Thus Engine1 has an actual reliability of 83.3 percent (2,827 / 3,395). More detailed recorded information allows for a moreaccurate snapshot of how you are doing. Table C-4 shows the number of calls and the respective reliability for eachstation’s first responder.
CFAI Chapter 8CX 10/17/03 1:34 AM Page 13

C H A P T E R E I G H T • 1 4 © 2 0 0 3 C O M M I S S I O N O N F I R E A C C R E D I T A T I O N I N T E R N A T I O N A L , I N C .
TABLE C-4In-Area First Responder Reliability
FIRE NUMBER OF INCIDENTS NUMBER OF ENGINE FIRST RESPONDER RELIABILITYSTATION # RAW ACTUAL FIRST RESPONSES RAW % DETAILED %1 . . . . . . . . . .3,452 . . . . . 3,395 . . . . . . . . . 2,827 . . . . . . . . . . . . . . . . . . . 81.89. . . . . . 83.32 . . . . . . . . . .1,517 . . . . . 1,506 . . . . . . . . . 1,208 . . . . . . . . . . . . . . . . . . . 79.63. . . . . . 80.23 . . . . . . . . . .1,351 . . . . . 1,347 . . . . . . . . . 1,178. . . . . . . . . . . . . . . . . . . . 87.19 . . . . . . 87.54 . . . . . . . . . .2,434 . . . . . 2,422 . . . . . . . . . 2,151. . . . . . . . . . . . . . . . . . . . 88.37. . . . . . 88.85 . . . . . . . . . .1,432 . . . . . 1,425 . . . . . . . . . 1,271. . . . . . . . . . . . . . . . . . . . 88.76. . . . . . 89.26 . . . . . . . . . .1,577 . . . . . 1,570 . . . . . . . . . 1,393 . . . . . . . . . . . . . . . . . . . 88.33. . . . . . 88.77 . . . . . . . . . .2,972 . . . . . 2,955 . . . . . . . . . 2,555 . . . . . . . . . . . . . . . . . . . 85.97. . . . . . 86.58 . . . . . . . . . .3,854 . . . . . 3,824 . . . . . . . . . 3,139. . . . . . . . . . . . . . . . . . . . 81.45. . . . . . 82.19 . . . . . . . . . .1,581 . . . . . 1,555 . . . . . . . . . 1,389 . . . . . . . . . . . . . . . . . . . 87.86 . . . . . . 89.310 . . . . . . . . .2,187 . . . . . 2,180 . . . . . . . . . 1,916. . . . . . . . . . . . . . . . . . . . 87.61 . . . . . . 87.911 . . . . . . . . .2,342 . . . . . 2,332 . . . . . . . . . 2,008 . . . . . . . . . . . . . . . . . . . 85.74. . . . . . 86.112 . . . . . . . . .906 . . . . . . . 902. . . . . . . . . . . 844 . . . . . . . . . . . . . . . . . . . . . 93.16. . . . . . 93.613 . . . . . . . . .773 . . . . . . . 771 . . . . . . . . . . . 706 . . . . . . . . . . . . . . . . . . . . . 91.33. . . . . . 91.614 . . . . . . . . .1,381 . . . . . 1,367 . . . . . . . . . 1,244 . . . . . . . . . . . . . . . . . . . 90.08. . . . . . 91.015 . . . . . . . . .255 . . . . . . . 250 . . . . . . . . . . . 238 . . . . . . . . . . . . . . . . . . . . . 93.33. . . . . . 95.216 . . . . . . . . .191 . . . . . . . 191 . . . . . . . . . . . 183 . . . . . . . . . . . . . . . . . . . . . 95.81. . . . . . 95.817 . . . . . . . . .390 . . . . . . . 390 . . . . . . . . . . . 325 . . . . . . . . . . . . . . . . . . . . . 83.33. . . . . . 83.3
Note: Raw percentage refers to the number of in-area first responder arrivals divided by the total number of incidents(i.e. raw number). Detailed percentage refers to using the number of in-area first responder arrivals divided by thetotal number of incidents that required a first-due company response (i.e. we are using more detailed incident infor-mation to achieve a more accurate picture).
Regression example: If we plot an engine’s reliability on the Y-axis and its total workload on the X-axis, we create adata plot. Using a linear regression curve fit (root-sum square methodology - RSS), we can create a line that allowsus to estimate reliability as a function of engine workload. An “apples-to-apples” comparison is required for this typeof regression. Figure C-4 shows that we can predict a first responder’s reliability based upon a projected workload. Wealso can determine when we need to add another first-due apparatus if we want reliability to remain above a specificlevel. Figure C-4 illustrates this statistical tool. As expected, the higher the engine workload (number of responses perengine), the lower the reliability.
CFAI Chapter 8CX 10/17/03 1:34 AM Page 14

© 2 0 0 3 C O M M I S S I O N O N F I R E A C C R E D I T A T I O N I N T E R N A T I O N A L , I N C . C H A P T E R E I G H T • 1 5
FIGURE C-4Effects of Engine Workload on Engine Reliability
[Note that the two-circled data points (stations 2 and 17) have been removed from the curve fit so as not to skew theresults (these deviant points are known statistically as outliers). Engine 2 is cross-staffed as Heavy Rescue 2 and Station17 was opened in the summer of 1996. Station 2 was thus dropped from the data fit because it is assumed to haveexcessive out-of-service times because of its extensive training requirements and citywide workload. Station 17 wasremoved from the data fit because it was only in operation for the last half of the year. These are most likely the rea-sons these stations vary from the others. A more detailed analysis would be required to verify this assumption.
Evaluating First Arrival Response (Out-of-Area Reliability)What is the reliability of adjacent first responders to fill in for an out-of-service first responder? This is achieved by divid-ing the total number of calls answered by immediately adjacent fire stations (or second-due in-area companies) divid-ed by the total number of incidents not answered by the area’s first responder. Ideally, if an out-of-area first respon-der is required, we want it to come from no farther away than an adjacent fire station. The farther away the respond-ing station, the longer (worse) the first arrival response time.
Detailed Data Example: In this case, the Station 1 area has a 73 percent out-of-area first response reliability from immedi-ately adjacent stations (185 responses from adjacent stations/253 incidents responded to by out-of-area stations). Lowerreliability by adjacent stations results in longer response times. Trucks were excluded from this example for clarity purposes.
Evaluating Effective Response Force ReliabilityThis refers to the percentage of time an effective response force is assembled within the desired goals or standards.The primary difference between this reliability and the previous two discussed is that this reliability must account formultiple (not single first arrival) responders to a single incident. What comprises an effective response force must bedetermined based upon risk and assessment. The composition of this force can vary as a function of incident type,location within the city, building structure, or combination of different variables. As stated previously, we are designat-ing an effective response force as the arrival of two engines and one truck within 12 minutes total response time(time of 9-1-1 call to on-scene arrival of all apparatus). Table C-5 shows effective response force statistics.
0 500 1,000 1,500 2,000 2,500 3,000 3,500 4,0000.8
0.82
0.84
0.86
0.88
0.9
0.92
0.94
0.96
NUMBER OF RESPONSES IN 1996
ENG
INE
IN-A
REA
REL
IAB
ILIT
Y
FS-17 (New Station)
FS-2 (Hvy Rescue)
y = 0.95752 - 3.6187e-05x R2 = 0.89329
CFAI Chapter 8CX 10/17/03 1:34 AM Page 15

C H A P T E R E I G H T • 1 6 © 2 0 0 3 C O M M I S S I O N O N F I R E A C C R E D I T A T I O N I N T E R N A T I O N A L , I N C .
TABLE C-5In-Area Responder Reliability for Structure Fire Calls
FIRE SFIR NUMBER OF SFIR RELIABILITYSTATION # INCIDENTS IN-AREA RESPONSES IN AREA RESPONDER
NUMBER ENGINE TRUCK ENGINE % TRUCK %1 . . . . . . . . . . 47. . . . . . . . . . . . . . . . . 42. . . . . . . . . . 44 . . . . . . . . . . . . . . . . . . . 89.4 . . . . . . . . . . . . 93.62 . . . . . . . . . . 25. . . . . . . . . . . . . . . . . 20 . . . . . . . . . . - . . . . . . . . . . . . . . . . . . . . . 80.0 . . . . . . . . . . . . -3 . . . . . . . . . . 20. . . . . . . . . . . . . . . . . 19 . . . . . . . . . . - . . . . . . . . . . . . . . . . . . . . . 95.0 . . . . . . . . . . . . -4 . . . . . . . . . . 20. . . . . . . . . . . . . . . . . 17 . . . . . . . . . . 19 . . . . . . . . . . . . . . . . . . . 85.0 . . . . . . . . . . . . 95.05 . . . . . . . . . . 10. . . . . . . . . . . . . . . . . 10 . . . . . . . . . . - . . . . . . . . . . . . . . . . . . . . . 100. . . . . . . . . . . . . -6 . . . . . . . . . . 20. . . . . . . . . . . . . . . . . 17 . . . . . . . . . . - . . . . . . . . . . . . . . . . . . . . . 85.0 . . . . . . . . . . . . -7 . . . . . . . . . . 49. . . . . . . . . . . . . . . . . 46. . . . . . . . . . - . . . . . . . . . . . . . . . . . . . . . 93.9 . . . . . . . . . . . . -8 . . . . . . . . . . 57. . . . . . . . . . . . . . . . . 54 . . . . . . . . . . 54 . . . . . . . . . . . . . . . . . . . 94.7 . . . . . . . . . . . . 94.79 . . . . . . . . . . 23. . . . . . . . . . . . . . . . . 23 . . . . . . . . . . - . . . . . . . . . . . . . . . . . . . . . 100. . . . . . . . . . . . . -10 . . . . . . . . . 42. . . . . . . . . . . . . . . . . 40. . . . . . . . . . 41 . . . . . . . . . . . . . . . . . . . 95.2 . . . . . . . . . . . . 97.611. . . . . . . . . 39. . . . . . . . . . . . . . . . . 35 . . . . . . . . . . - . . . . . . . . . . . . . . . . . . . . . 89.7 . . . . . . . . . . . . -12 . . . . . . . . . 7 . . . . . . . . . . . . . . . . . . 6 . . . . . . . . . . . - . . . . . . . . . . . . . . . . . . . . . 85.7 . . . . . . . . . . . . -13 . . . . . . . . . 19. . . . . . . . . . . . . . . . . 17 . . . . . . . . . . - . . . . . . . . . . . . . . . . . . . . . 89.5 . . . . . . . . . . . . -14 . . . . . . . . . 13. . . . . . . . . . . . . . . . . 10 . . . . . . . . . . - . . . . . . . . . . . . . . . . . . . . . 76.9 . . . . . . . . . . . . -15 . . . . . . . . . 5 . . . . . . . . . . . . . . . . . . 5 . . . . . . . . . . . - . . . . . . . . . . . . . . . . . . . . . 100. . . . . . . . . . . . . -16 . . . . . . . . . 2 . . . . . . . . . . . . . . . . . . 2 . . . . . . . . . . . - . . . . . . . . . . . . . . . . . . . . . 100. . . . . . . . . . . . . -17 . . . . . . . . . 7 . . . . . . . . . . . . . . . . . . 5 . . . . . . . . . . . - . . . . . . . . . . . . . . . . . . . . . 71.4 . . . . . . . . . . . . -
Evaluating Structure Fire Reliability Because of High Call VolumeThe more detailed the data, the more aspects you can evaluate of your department's performance. Are EMS andother high-volume calls overriding response to structure fire (SFIR) calls? What is the first responder’s reliability specif-ically related to answering SFIR calls? Take the total number of times that first responder responded to SFIR calls with-in its own area and divide by the total number of the area’s SFIR calls.
Detailed data example: In this case Engine 1 has an 89.4 percent reliability (42 responses / 47 SFIR incidents) foranswering SFIR calls given its current workload. Truck 1 has a 93.6 percent reliability for responding to SFIR calls inthe Station 1 area. Table C-5 shows in-area SFIR reliability for all stations. Truck reliability is not shown for out-of-arearesponses (optimum truck CAD deployment information was not available for this type of analysis).
Evaluate Response Times Two things will cause response times to be too long: in-area reliability is too low or the coverage area is just too big.The first situation implies the assigned first responders are overloaded and the second situation indicates a secondstation must be added to reduce excessive drive times from the existing station. Table C-6 shows in-area and out-of-area engine response times for districts one, eight, and nine.
CFAI Chapter 8CX 10/17/03 1:34 AM Page 16

© 2 0 0 3 C O M M I S S I O N O N F I R E A C C R E D I T A T I O N I N T E R N A T I O N A L , I N C . C H A P T E R E I G H T • 1 7
TABLE C-6The Value of Engine Response ReliabilityTotal Response Time Performance
FIRE STATION IN-AREA RESPONDING OUT-OF-AREA RESPONDING ENGINE ENGINE< 4 < 6 < 8 < 4 < 6 < 8
1 . . . . . . . . . . . . . . . . . .51.7% . . . . 91.8% . . . . 97.2% . . . . . . . . . 16.5% . . . . 56.4%. . . . . 87.5%8 . . . . . . . . . . . . . . . . . .27.4% . . . . 76.9% . . . . 94.8% . . . . . . . . . 12.7% . . . . 38.6%. . . . . 76.4%9 . . . . . . . . . . . . . . . . . .19.9% . . . . 69.1% . . . . 92.5% . . . . . . . . . 10.7% . . . . 26.0%. . . . . 66.5%
If Engine 1 had a 100 percent reliability (able to answer every call within it own area), we would expect to achieve 51.7percent of all calls less in than four minutes. If Engine 1 reliability were 0 percent we would then expect to only achieve16.7 percent of all calls in less than four minutes. Thus, as Engine 1 in-area reliability drops from 100 percent to 0 per-cent we would expect the percentage of calls responded to in less than four minutes to drop from 51.7 percent downto 16.7 percent. To find the actual number of calls degraded, simply multiply the calculated percentage by the call volume. It is important to remember that 5 percent of 100 calls is very different from 5 percent of 1,000 calls.
Note that even with 100 percent reliability, Engines 8 and 9 will never achieve the desired goal of 50 percent calls inunder four minutes and 80 percent under six minutes. This implies that the coverage areas are too large. Establishinga new station west of station 12, along the most western north-south road corridor, would resolve the too-large-an-area problem in the northwestern portion of the city. The solution to district 8 is not as readily straightforward. Actualcall volume density must be identified for all districts surrounding Station 8 in order to determine the best location toplace the new station. It is possible that splitting a station’s district could result in the creation of two new stations (optimum location to minimize response time to the maximum number of calls).
Evaluate First Responders Ability To Respond In Own AreaThis is determined by tallying the number of first responder first arrivals within each goal/standard time criteria. Thefollowing comparison shows Engine 1 and out-of-area Engine/Trauma Squad response times into Station 1’s area.This is where the importance of reliability comes into play. As Engine 1 reliability drops, first arrival response timeswithin district 1 will shift to out-of-area engine response times (assuming trucks are not used to cover for busyengines). Table C-7 shows the current District 1, Engine 1, and out-of-area first responder reliability and their respec-tive response times. The data illustrates that to achieve the desired 50 percent arrival in less than four minutes requiresa higher reliability than currently exists for Engine 1. The more we can increase Engine 1 reliability, the more we willshift from 47 percent calls under four minutes to 51 percent calls under four minutes.
Evaluate Second Responder Ability to Fill in for Missing First ResponderThis is done by tallying the number of adjacent station out-of-area first responders and divided by the total calls respond-ed to by out-of-area first responders. Looking at Table C-7, we see that adjacent out-of-area first response reliability is73.1 percent (185/253). We also see, as expected, that response times become longer the farther away from theresponding station. Using this data, we can estimate response time changes given changes for in-area reliability.
CFAI Chapter 8CX 10/17/03 1:34 AM Page 17

C H A P T E R E I G H T • 1 8 © 2 0 0 3 C O M M I S S I O N O N F I R E A C C R E D I T A T I O N I N T E R N A T I O N A L , I N C .
TABLE C-7Engine and Trauma Squad Reliability and First Arrival Response Time PerformanceEngine / Trauma Squad Responses into Still District 1
TOTAL DISTRICT 1 ENGINE OUT-OF-AREA RESPONDERSRESPONSE RESPONSE 1 ONLY ADJACENT NON-ADJACENTTIME HISTORY<4 minutes . . . . 47.0%. . . . . . . . . . . . . . 51.0%. . . . . . . . . . . . . 24.7%. . . . . . . . 38.0%**<6 minutes . . . . 86.8% . . . . . . . . . . . . . 90.9%. . . . . . . . . . . . . 76.4%. . . . . . . . 45.5%<8 minutes . . . . 95.4% . . . . . . . . . . . . . 97.3% . . . . . . . . . . . . . 95.5%. . . . . . . . 52.4%8+ minutes . . . . 4.6%. . . . . . . . . . . . . . . 2.7% . . . . . . . . . . . . . . 4.5% . . . . . . . . . 47.6%Number of . . . . - . . . . . . . . . . . . . . . . . . . 2,661 . . . . . . . . . . . . . 185 . . . . . . . . . . 68
first arrivals% of calls . . . . . . 100% . . . . . . . . . . . . . . 91.4%. . . . . . . . . . . . . 6.4% . . . . . . . . . 2.2%
**High percentage could be due to pro-active move-up policy or improperly recorded data.
Evaluate Ability To Assemble Effective Response ForceThis is achieved by tallying all calls with two engines and one truck arriving at the scene of an incident. Table C-8 showsthe department’s ability to assemble an effective force within the 12-minute total response time criteria. Overall, city-wide performance is 88.6 percent, which falls below the 90 percent standard. This implies the need for more com-panies in order to raise the level above the city’s standard. Incidents where both an engine and a truck were late willrequire the addition of both vehicle types.
TABLE C-8The Probability of Assembling an Effective Response Force
FIRE SFIR NUMBER OF INCIDENTS TOTAL NUMBER SFIRSTATION INCIDENTS WHERE APPARATUS FAILED EXCEEDING RESPONSE# NUMBER 12 MINUTE ARRIVAL 12 MINUTES RELIABILITY
ENGINE TRUCK BOTH AN ENGINE & TRUCK
1 . . . . . . . . . . . . 47 . . . . . . . . . . . . . 1 . . . . . . . . -. . . . . . . . . . - . . . . . . . . . . . . . . . . . . 1 . . . . . . . . . . . 97.8%2 . . . . . . . . . . . . 25. . . . . . . . . . . . . 1 . . . . . . . . 1 . . . . . . . . . - . . . . . . . . . . . . . . . . . . 2 . . . . . . . . . . . 92.0%3 . . . . . . . . . . . . 20. . . . . . . . . . . . . - . . . . . . . . . -. . . . . . . . . . - . . . . . . . . . . . . . . . . . . -. . . . . . . . . . . . 100%4 . . . . . . . . . . . . 20. . . . . . . . . . . . . 2 . . . . . . . . -. . . . . . . . . . 1 . . . . . . . . . . . . . . . . . 3 . . . . . . . . . . . 85.0%5 . . . . . . . . . . . . 10 . . . . . . . . . . . . . - . . . . . . . . . 2 . . . . . . . . . - . . . . . . . . . . . . . . . . . . 2 . . . . . . . . . . . 80.0%6 . . . . . . . . . . . . 20. . . . . . . . . . . . . 1 . . . . . . . . -. . . . . . . . . . - . . . . . . . . . . . . . . . . . . 1 . . . . . . . . . . . 95.0%7 . . . . . . . . . . . . 49. . . . . . . . . . . . . 1 . . . . . . . . -. . . . . . . . . . 3 . . . . . . . . . . . . . . . . . 4 . . . . . . . . . . . 91.8%8 . . . . . . . . . . . . 57. . . . . . . . . . . . . 1 . . . . . . . . -. . . . . . . . . . 1 . . . . . . . . . . . . . . . . . 2 . . . . . . . . . . . 96.5%9 . . . . . . . . . . . . 23. . . . . . . . . . . . . - . . . . . . . . . 3 . . . . . . . . . 2 . . . . . . . . . . . . . . . . . 5 . . . . . . . . . . . 78.3%10 . . . . . . . . . . . 42. . . . . . . . . . . . . 2 . . . . . . . . 2 . . . . . . . . . 1 . . . . . . . . . . . . . . . . . 5 . . . . . . . . . . . 88.1%11 . . . . . . . . . . . 39. . . . . . . . . . . . . 1 . . . . . . . . 5 . . . . . . . . . 4 . . . . . . . . . . . . . . . . . 10 . . . . . . . . . . 74.4%12 . . . . . . . . . . . 7 . . . . . . . . . . . . . . - . . . . . . . . . 1 . . . . . . . . . 1 . . . . . . . . . . . . . . . . . 2 . . . . . . . . . . . 71.4%13 . . . . . . . . . . . 19 . . . . . . . . . . . . . - . . . . . . . . . 1 . . . . . . . . . - . . . . . . . . . . . . . . . . . . 1 . . . . . . . . . . . 94.7%14 . . . . . . . . . . . 13 . . . . . . . . . . . . . 1 . . . . . . . . 2 . . . . . . . . . 2 . . . . . . . . . . . . . . . . . 5 . . . . . . . . . . . 61.5%15 . . . . . . . . . . . 5 . . . . . . . . . . . . . . - . . . . . . . . . 2 . . . . . . . . . - . . . . . . . . . . . . . . . . . . 2 . . . . . . . . . . . 60.0%16 . . . . . . . . . . . 2 . . . . . . . . . . . . . . - . . . . . . . . . -. . . . . . . . . . - . . . . . . . . . . . . . . . . . . -. . . . . . . . . . . . 100%17 . . . . . . . . . . . 7 . . . . . . . . . . . . . . - . . . . . . . . . 1 . . . . . . . . . - . . . . . . . . . . . . . . . . . . 1 . . . . . . . . . . . 85.7%Total . . . . . . . . . . 405. . . . . . . . . . . . 11 . . . . . . . 20. . . . . . . . 15 . . . . . . . . . . . . . . . . 46. . . . . . . . . . 88.6%
CFAI Chapter 8CX 10/17/03 1:34 AM Page 18

© 2 0 0 3 C O M M I S S I O N O N F I R E A C C R E D I T A T I O N I N T E R N A T I O N A L , I N C . C H A P T E R E I G H T • 1 9
Effective response force for this example is defined as two engines and one truck arriving within a 12-minute totalresponse (9-1-1 to arrival). Sometimes the second-in engine is late, sometimes the truck is late, and sometimes bothan engine and truck are late.
Evaluate Apparatus DeploymentPlotting the information provided in Table C-8 provides a method to visually interpret the big picture. In Still District 9,we have the numbers 0-3-2 and 23. The number 23 represents the number of calls where an effective responseforced arrived. The ‘0-3-2’ represents the number of calls where an engine, a truck, or both arrived later than the des-ignated response time. In this example, an engine failed to arrive zero times, a truck failed to arrive three times, andboth an engine and truck failed to arrive two times within the required response time standards. This shows that someof the city’s effective response force times are poor because of a lack of truck coverage. Data shows that late arrivalsare most likely because of low reliability (high simultaneous demand call volume). This implies that another engineas well as a truck is needed to improve effective response force performance.
Station Location EfficiencyThis is the system-wide measure of the site efficiency of the station plan. Efficiency is typically measured for eachresource in the system as it contributes to the whole. The goal is to equally distribute (geographically) the area cov-ered and the workloads of the companies in the initial effective response force. In an ideal system, each resourcewould cover an equal share of the workload. For example, in a five-station system, each station would handle one-fifth of the workload.
While an exact leveling of workload is impossible, likewise extremes are not good. If a company covers one-fifth of thejurisdiction, but handles 45 percent of the total calls and queuing (call stacking) is not a factor system-wide, perhapsanother resource is misplaced or not cost-efficient. In another example, a station only handles 15 percent of the jurisdic-tion’s area and 8 percent of the total calls. Unless absolutely needed because of geography, as a critical piece of an ini-tial effective response force, or lack of mutual aid, it may not be cost-efficient as it contributes to the output of the whole.
This example of a station only covering 15 percent of the total area is also an example of how distribution and concen-tration can affect economic efficiencies. It also must be remembered that most goal statements do not promise 100 per-cent coverage for initial response times. In this example of a station only covering 15 percent of the area and being underworked, if the area were low risk or growing into typical risk, it may be that for a few years the area receives responsetimes a couple of minutes longer. The entire system could still meet its 90 percent goals by being slow in this area andoperating at above 90 percent levels in other areas until the entire system can economically justify another resource.
CFAI Chapter 8CX 10/17/03 1:34 AM Page 19

C H A P T E R E I G H T • 2 0 © 2 0 0 3 C O M M I S S I O N O N F I R E A C C R E D I T A T I O N I N T E R N A T I O N A L , I N C .
In the above example, Station B covers 50 percent of the total demand zones, or 100 percent of its fair share. StationA was located at the jurisdiction limits and can only cover 33 percent, which is less than its fair share of 50 percentof the demand zones in this two station system. The under-covered demand zones in the middle are medium andhigh risk and Station A’s zones are low risk. Should Station A be relocated to the right or a third station added?
For example, in a five-fire-station system, each station should handle about 20 percent of the fire demand zones thatcould be covered by the stations. In reality, though, each first-in district varies because of the street layouts, streetspeeds and the levels of risk in the specific districts.
Where stations are located close to city limits, their response efficiency will be arbitrarily lower, unless there is an auto-matic aid agreement that improves their efficiency. Conversely, a uniform set of location efficiency is desirable to keepresponse reliability and distribution at a reasonable level. Areas that have a low response reliability score require moreavailable engine companies to make up for busy engines. With multiple fire companies and established maximumprescribed travel times, an equilibrium point in the effectiveness/efficiency tradeoff may need to be established.
Sometimes it would be more cost effective to move a station elsewhere and let it help with overall distribution. Or,perhaps a station covers a few very high-risk demand zones and the jurisdiction accepts the cost of that coverage. Thegoal in this phase of study is to make each station as cost efficient and informed as possible.
Some overlap of companies is necessary for appropriate response reliability as discussed in the next section. A juris-diction should not strive for perfect system-wide efficiency—it would have no overlap and reliability (coverage-in-depth) strength. The tough balancing act is to obtain good distribution while maximizing efficiency because compa-nies are too expensive to under-serve their fair share of the total jurisdiction.
A B
CFAI Chapter 8CX 10/17/03 1:34 AM Page 20

© 2 0 0 3 C O M M I S S I O N O N F I R E A C C R E D I T A T I O N I N T E R N A T I O N A L , I N C . C H A P T E R E I G H T • 2 1
Using the example from before here is how the jurisdiction could look at efficiency with the addition of a third station:
Station A’s Efficiency is 100 percent (6 of 6 fair share)Station B’s Efficiency is 150 percent (9 of 6 fair share)Station C’s Efficiency is 150 percent (9 of 6 fair share)
Additional Deployment Measures:
Drawdown The resource level you will not go below when asked for mutual aid.
In any organization there will be a specific number of initial attack resources. For example, a departmentmay have six engine companies. The department may also have reserve companies that are staffed byrecalling personnel. An example drawdown policy is “The EveryTown Fire Department will commit upto 50 percent of its resources to respond on mutual aid or automatic aid calls. Once this level is com-mitted, the department will no longer respond to request until reserves are placed in service, or uponapproval of the duty chief.” Setting drawdown points prevents the department from facing a situationwhere an emergency occurs within the jurisdiction and its resources are totally out of position.
Key questions might be:How often has it happened?What caused it happen?What should be done when it happens?Who has authority to act?Does it require a decision by one or more parties?
CFAI Chapter 8CX 10/17/03 1:34 AM Page 21

C H A P T E R E I G H T • 2 2 © 2 0 0 3 C O M M I S S I O N O N F I R E A C C R E D I T A T I O N I N T E R N A T I O N A L , I N C .
Resource Exhaustion This is when a system is completely out of resources for both initial response and an area-wide effective response force. In a small jurisdiction this would be when all units werecommitted. In a large jurisdiction it might be one sub-area (battalion or division) at totalcommitment.
In any organization there can be circumstances where the department’s total capacity canbe committed on emergencies. What can create resource exhaustion quickly is a multiple-alarm fire in a small-to-medium-sized fire agency. Or it can be caused by a drawdown sit-uation followed quickly by a local event. In either case, the point at which this can occurshould be recognized and evaluated in the performance area.
Key questions might be:How often has it happened?What caused it happen?What should be done when it happens?Who has authority to act?Does it require a decision by one or more parties?
When analyzing how to handle resource exhaustion, queuing measurements of frequency, availability of mutual aidand the call-back of personnel all must be considered together. One system with frequent exhaustion history and nonear-by mutual aid could then economically justify another resource. In another system, exhaustion may happen soinfrequently, that close-in mutual aid will be sufficient. Also remember during this phase of the analysis to factor mutualaid provided into your queuing statistics—you give as well as receive.
SummaryVery few fire agencies lack historical records. However, many fire departments do not correlate their historical per-formance with the actual needs of the community. This chapter focuses on fire departments becoming more sophis-ticated with respect to statistical analysis. This is becoming an important skill in suburban departments today. In met-ropolitan departments, a statistician may be as important to the department as many of the other specialties.
Not only is it important to keep historical records, but it is equally important that fire agencies place emphasis on collecting accurate data with respect to time elements and consequences of fire department intervention. Both of thesedata elements require a degree of emphasis by administration if they are going to be incorporated by line personnel.
CFAI Chapter 8CX 10/17/03 1:34 AM Page 22

© 2 0 0 3 C O M M I S S I O N O N F I R E A C C R E D I T A T I O N I N T E R N A T I O N A L , I N C . C H A P T E R N I N E • 1
CHAPTER N INEEVALUATING STANDARDS OF RESPONSE COVERAGE
To clearly define standards of coverage, agencies must have a statement of policy regarding how risks are categorizedwithin the context of their own jurisdiction. Because of the wide range of complex issues for which individual agen-cies are held accountable, it is not necessary that there is a standard method of creating these policies. Rather theagency must define its own standards of coverage policies and document its findings.
If you don’t have a set of written standards statements now, then the exercise in the appendix of this book shouldprovide some information on how to create them.
As stated in the previous chapters, standards of coverage must include an element of time: the maximum prescribedtravel that indicates the level of service that is anticipated. These statements also must contain measurable outcomeperformance objectives. Such standards of cover statements must identify response levels to identified levels of risksand include critical tasks so that staffing plans meet the desired levels of distribution, concentration and reliability inthe community.
Integration, Reporting, and Policy DecisionsThe final standards of cover document integrates all the analysis points into a clear, comprehensive statement of whathas been found and what recommendations may be necessary for future change. The document, with the use ofgraphs and mapping-based displays, should foster informed policy discussion.
The key points presented should be:
1. Existing standards of cover statements (If any)2. Risk assessments3 Time and on-scene performance expectations (Baselines)4. Critical task analyses5. Company distribution measures 6. Station concentration measures (Effective Response/Efficiency)7. Reliability studies (Queuing)8. Historical performance (Effectiveness)9. As necessary, propose revised standards of cover
statements with cost-benefit analysis.

C H A P T E R N I N E • 2 © 2 0 0 3 C O M M I S S I O N O N F I R E A C C R E D I T A T I O N I N T E R N A T I O N A L , I N C .
In the example from chapter eight, if a third station were added, the distribution and concentration measures couldlook like this:
Station A’s efficiency is 100 percent (6 of 6 fair share)Station B’s efficiency is 150 percent (9 of 6 fair share)Station C’s efficiency is 150 percent (9 of 6 fair share)
100 percent of the demand zones have five-minute initial attack distribution33 percent of the demand zones get two companies in eight minutes (circles)16 percent of the demand zones get three companies in 10 minutes (squares)
When making public presentation, be sure to explain actual and expected standards of cover. Let citizens and policymakers know it is ultimately their values and community economics that dictate standards of cover. Each communityin essence buys the level of fire protection that it prudently needs and can afford. No national fire or insurance indus-try “standard” should be imposed upon a community if it has rigorously analyzed its own needs and made informed“purchase” decisions based on that analysis. Professional fire service officers should be expected to provide suchdetailed analysis and explain the pros and cons of each choice while remembering it is ultimately up to the commu-nity’s elected officials to adopt their standards of response cover plan.
Periodic Review of Existing Standards of Cover PoliciesOnce an organization has created a set of standards of cover statements, the issue goes from formulation of policyto the re-evaluation of policy on a periodic basis.
A BC
Station New Station Station

© 2 0 0 3 C O M M I S S I O N O N F I R E A C C R E D I T A T I O N I N T E R N A T I O N A L , I N C . C H A P T E R N I N E • 3
The following flow chart was explained in chapter five. It bears repeating because it also illustrates the concept of howa fire department needs to perform periodic evaluation of its standards of response coverage to assure that there areno gaps and consideration is given to hard-to-service areas. The flow chart works like this:
A. The starting point is the existing level of service. It can be a single fire station or it can be multiple fire stations.It makes no difference exactly how many stations are in the matrix. What is significant are the first two decisionpoints regarding all fire stations in the inventory. The next section of the chart deals with two essential planningdecisions. The first is whether or not the department has established fire demand zones and they are all withina reasonable travel distance from existing fire facilities. The standard that is used in this discussion is 1.5–2 miles.
B. The ISO polygon is usually 1.5 miles. However that was established 50 years ago. That was prior to the inter-vention of such things as traffic control devices, main thoroughfares, and traffic expediency devices. The secondelement is the establishment of a response time goal. As stated throughout this document, it makes no differ-ence if the goal is three minutes of travel time, four minutes of travel time or five minutes of travel time withregard to the goal. What is important is that it be established with a fractile. For example a response time goal offive minutes of travel time, 90 percent of the time is a common industry norm. But once the response time goalshave been established, then the department’s management information system should keep track of incidentsand response times.
In the utilization of this model, the two databases from which the evaluation should emerge is the city’s mapping envi-ronment and the city’s records management system. The former identifies the location of occupancies on the groundand the second identifies the actual experience and performance of the department in providing protection to thosefacilities. The most common industry practice for agencies utilizing a recognized standard of cover model is to per-form an annual review to assure that both of these criteria are being met.
If the answer to the questions remain yes, the existing level of service is satisfactory.
3-4.0 Miles
>35% Occupancy
5.0 Miles
>50% Occupancy
3.0 Miles
<25% Occupancy
10% Failure
<8 Minutes
30% Failure
>10 Minutes
Decision Process for Deployment Review
All risks between 1.5 miles & 2 miles?
Yes
Yes
No
Monitor
Temporary Station
Permanent Station
ST
AR
T
FA
CT
OR
S
No
Response records within adopted goals?
AnnualPerformance
Review
ProposedImprovement
in LOS
New Levelof Service
OPTIONS:• New Fire Station• 2 piece companies• Road network improvements• Fully sprinkler the risks• Other Alternatives
EstablishedResponse Zones
EstablishedResponse Goals
ExistingLevel ofService
Yes
Distance/Density(Travel) (Risk)
Response Failure(Performance)
20-25% Failure
>8 Minutes

C H A P T E R N I N E • 4 © 2 0 0 3 C O M M I S S I O N O N F I R E A C C R E D I T A T I O N I N T E R N A T I O N A L , I N C .
However, in the event that one of the two thresholds is exceeded, then the department should be obligated to develop alevel of service improvement. Notably you can exceed one and not exceed the other. For example, a few scatteredbuildings that are beyond the range of the response time goal does not mean there is a serious problem. These par-ticular occupancies may not be the site of a specific emergency, therefore they would not be calculated in response-time analysis. Conversely having all of the buildings within the fire demand zone does not mean there will never beresponse threshold failure. There are many factors that can cause a fire department to not meet its response-time goal.
These might include, but are not limited to, such things as extremely heavy traffic patterns during specific periods oftime, concurrent alarms that result in engine companies coming out of district more often to provide first-in responseinto another district. There could be other factors such as seasonal weather conditions and specific community eventsthat have a negative impact on the availability of a fire company to meet its response time goals. It is important tonote that response-time goals are on a company-to-company basis. One should not make the mistake of averagingall of the responses in an entire community in establishing a fractile. This could result in certain outlying districts hav-ing very bad response records and the system not identifying them.
The purpose of the service-level improvement is to study fire station by fire station. The two study elements that mustbe reviewed for service-level improvements are which factors are causing the response times to get lengthy and/orwhich areas are causing a call for service that previously had not been identified.
This takes you to a series of potential thresholds. The factors that are being evaluated to mitigate the problem couldbe such things as adding a new fire station, outfitting a second company in an existing fire station, requiring improve-ments in the road transportation network, the inclusion of traffic expediting devices such as signal control by the fireand emergency services. You could minimize risk by requiring built-in fire protection in those areas that are beyondtravel distances or response-time achievement.
At this point in the model, the fire department should evaluate two conditions. The first of these is what percentage ofthe occupancies is outside of a normal fire demand zone. The methodology here infers that you always take a look atthe fire demand zone that is immediately adjacent to the area in which growth is occurring. For example, if it is a predominately residential area, then the assessment should be residential growth. If it is in an industrial area, then it islogical to look at industrial growth. To use a specific example, if an area had a total of 5,000 single- and multi-familyoccupancies that were within the time and distance of existing level of service, then 10 percent of that number (if itwere reflected in the new growth area) should raise the level of monitoring by the department.
Reading across the bottom of the model, there is a similar line with regard to response time thresholds. If your goalis to have a five-minute travel time 90 percent of the time, and you are only able to achieve it 80 percent of the time,then it is time to start monitoring the conditions that are causing that delay.
There are available software programs that allow the fire department to identify the location of specific emergencyevents and classify and categorize them by the length of time it takes to arrive. Therefore looking at any time the per-formance measure drops below 10 percent, the main issue to determine is whether those long response times werewithin the existing level of service area or whether they were being generated by the area where the new growth hasoccurred. Notably on the first of this chart there is an indication that all of your responses stay within eight minutes.Once the department has identified a number of responses that exceed eight minutes, it is almost always an indica-tor of outlying unprotected risk.
The second set of incremental observation is when you go to a 25 percent occupancy factor and a 25 percentresponse time failure. These are labeled in the model as being the time and travel threshold that should generateconsideration for a temporary fire station or the exercising of the other options that have been identified. If during an

© 2 0 0 3 C O M M I S S I O N O N F I R E A C C R E D I T A T I O N I N T E R N A T I O N A L , I N C . C H A P T E R N I N E • 5
annual review a department discovers that it does have up to a 25 percent occupancy distribution, the second con-sideration that must be evaluated is the density of that distribution. Look at approved development with regard to dis-tribution and concentration. A single outlying building does not constitute much of a risk. However if that building werea hotel that was eight stories tall in a rural area, there is reason to be concerned. Large housing tracts, especially thosethat are planned unit development, are important to note.
Single- and multi-family dwelling occupancies are the primary occupancies for the loss of life and property accordingto U.S. fire records. Therefore, any time there is a concentration of single-family and or multi-family dwellings, there isan expectation of fire service levels of being consistent with the level of service throughout the entire community.
The last set of brackets constitutes a 50 percent occupancy factor and any responses where the response failureexceeds 30 percent and response times exceed 10 minutes. If a fire agency has not provided a temporary stationand arrives at this condition, the liability for the community is extensive unless there is a specific policy providing forseparate response goals in different parts of the community.
For example, in a highly rural area it is not uncommon to have a different response time goal than in an urban area.These are usually defined by the density of the dwelling units per acre or the population concentration per square mile.
In the event that a temporary station is placed in service and/or a permanent station is established, the annual reviewprocess should provide documentation on what transpires as a result of that decision. Temporary fire stations are acommon practice in the fire service. However, sometimes there is a tendency to allow them to remain in place longafter the period of usefulness. Formative fire stations should always be in place when the occupancy density is equiv-alent of 50 percent of the developable land.
Use of GIS to Identify Specific Areas of ConcernIf an agency has employed GIS to pinpoint is historical fire records, it can also use that data to pinpoint specificareas of concern.
Density and Hot Spots for all RMS Incidents

C H A P T E R N I N E • 6 © 2 0 0 3 C O M M I S S I O N O N F I R E A C C R E D I T A T I O N I N T E R N A T I O N A L , I N C .
Equivalency and ComparabilityAmong the most difficult issues in adequately assessing fire protection is determining how to compare one fireagency’s service delivery system with another fire agency’s service delivery system. This discussion often goes underthe term of comparability. As stated throughout this manual, fire departments have many missions, many objectivesand many configurations that are required to provide a delivery system that is comprehensive and at the same timeachieves the goals of the organization.
The two terms comparative and equivalency defined as:
Comparative–Estimated by comparison; not positive or absolute; proceeding by comparison, especiallyfounded upon the comparison of different things belonging to the same science or study; the act ofexamining in order to discover how one thing stands with regard to another.
Equivalency–Equal in value, force, power, effect, excellence, import or meaning. Interchangeable.
From the perspective of response cover, the Commission on Fire Accreditation International, Inc. recognizes that the deliv-ery of fire protection is a classic example of a “system loop.” In a system loop, if you input accurate data into the system,you should have desirable outcomes after the process has been completed. Therefore, as part of this developmentalprocess we are recommending that fire departments develop performance outcomes as well as response time goals.
Contemporary literature places considerable emphasis on the establishment of response goals based upon criterionas the cascade of events, the standard time temperature curve and the Utstein Criteria. The basis for all three of thesescientific principles for setting those response time goals is to affect a positive outcome. Therefore, as part of thisprocess of establishing a standard of cover there should be a minimum of two outcome statements.
These outcome statements should read as follows: “The intended outcome of the response time goal for the firedepartment is to confine fires to the room of origin 95 percent of the time. Secondarily the intent of the emergencymedical response it to see that the patient or victims survive the accident or injury 95 percent of the time.”
These outcome statements can be measured on an annual basis to determine whether the delivery system is actu-ally achieving the intent.
Those communities that have utilized protective measures such as sprinkler systems, fire alarm systems, intensive fireprevention codes, first aid training, CPR training, AED distribution in the community, etc. will certainly expect the firedepartment to demonstrate that their staffing and crewing configuration is consistent with the intent of fire and lifesafety in the community.
Adoption by the Authority Having JurisdictionThe development of the standards of response cover document is a rigorous exercise. Because it is so focused onrisk hazard and value as well as community expectations it is not complete unless it is actually adopted by the com-munity. In examining literally hundreds of fire department response goals, it has been noted that many of the goalsare incorporated in the city’s general plan as guidelines. However, often accountability is not specified. Moreover, manyfire departments place their response time goals as part of their budget document with a similar lack of specificity.
In the event that a fire department adopts a staffing and crewing standard that is external to their organization, theCommission on Fire Accreditation International, Inc. (CFAI) will accept that as a minimum standard for that commu-nity. However, the department must adhere to its standard (and document this), or CFAI will not accredit that agency.If an agency wishes to have its standard recognized as an equivalency it must comply with the concept discussed pre-

© 2 0 0 3 C O M M I S S I O N O N F I R E A C C R E D I T A T I O N I N T E R N A T I O N A L , I N C . C H A P T E R N I N E • 7
viously, i.e. to have outcome-based requirements as well as being officially adopted by the authority having jurisdic-tion through resolution.
A sample resolution is included as an appendix to this document.
SummaryStandards of response coverage should be described in the policies, practices, and procedures of the organization insuch a way that a specific level of service is described and can be measured.
The chart that illustrates the sequence of events for deployment analysis is a loop. Once it has been established, itmust be periodically reviewed to assure that it is still efficient and effective. Making policy changes and affecting changeis part of this process. Creating a standard of cover without periodic evaluation may, over time, become misleadingand either overestimate or underestimate the need for change to keep current.
It should be noted that when agencies have an EMS mission, whether it is BLS or ALS, the element of time is notbased on fire flow risk parameters, but rather on cardiac/trauma life safety time elements. It is further assumed thatevery organization conducting a standards of coverage evaluation will have a specific jurisdictional boundary. The eval-uation of a community’s standards of coverage should show how all the relevant factors (mutual aid) have been con-sciously evaluated and policies established within that specific jurisdiction.
Agencies that are creating standards of coverage should have a policy statement regarding standards of coverage thathas been adopted by the authority having jurisdiction. It should reflect an evaluation by the agency of the level of risk,the commitment to achieve initial attack, the distribution of its resources to assure initial coverage, and an analysis ofits in-depth resources to assure concentration to combat its greatest risk.
It must be clearly stated that we are not assuming that all fire departments will be able to extinguish all fires all thetime to a certain level of limited damage. Fire fighting agencies may choose to develop strategies that deal with firegrowth levels during different eras of fire spread. The standards of response coverage model acknowledges that thereare alternative methods that can and will be utilized by various fire fighting agencies. No one methodology shouldpreclude the others.
Standards of Coverage Process
Identify Risks &Expectations
Existing(Proposed)Deployment
Identify Service Level
Objectives
Distribution &Concentration
Study
ReliabilityStudy
(Queuing)
PerformanceStudy
(Historical)
Display
Yes
No
Distribution and
Concentration
Affect Change
Stds ofCoverage
Display
Evaluation
Display Display Display
Policy Choices


© 2 0 0 3 C O M M I S S I O N O N F I R E A C C R E D I T A T I O N I N T E R N A T I O N A L , I N C . A P P E N D I X A • 1
APPENDIX AA SYSTEMS APPROACH TO STAFFING AND PROGRAM FOCUS
BY RONNY J. COLEMAN
This appendix describes a chart to help fire managers and city officials identify the impacts of specific policy decisionson their community’s fire problem.
One question has plagued the fire service through the years: How much is enough? How much manpower is need-ed to combat a fire? To staff an engine company? How much time should it take a truck company to arrive at a firescene? These are difficult questions to answer because fire control has so many different dimensions. A solutionhere may be a limitation there.
Recently, in an attempt to quantify a methodology to approach this problem, I developed a chart to visualize staffingpatterns as they relate to fire ignition and growth, and the options used to control fire spread. The chart was origi-nally developed for a discussion of fire department decision-making theory. This article allows me to present the chartto a wider audience and to offer a further explanation of what the chart implies.
The ChartThe chart has two dimensions. In the left-hand column are the Episodes. These are clearly defined elements of timein the life cycle (or growth period) of a single fire. They represent eight distinct levels of fire potential, with each episodeof fire growth having a behavior that will be translated at some point into requirements for dealing with that level of fire.
The body of the chart consists of seven columns that project the evolution of an episode. They are:� Era, the period of time during which the episode normally lasts;� Initiating event, the occurrence that triggers the Era sequence;� Domain, the physical configuration of the fire;� Critical event, the singular event that causes a specific emergency to move from one episode to the next (lack
of such a singular event usually means termination of the fire);� Options/alternatives, the methodologies developed to prevent the event from either occurring or escalating;� Decision point, the point at which resources (either fire prevention or fire suppression) are committed to
limit the event;� Outcomes measurement, the statistical means for determining the rate of occurrence within the community or
a defined fire area.
The chart is simple to read. Looking down the left-hand column, you see the evolution of episodes. An emergencyterminated at any given episode will have a fixed effect on a given fire problem. In other words, if you terminate afire problem in episode 4, the specific amount of threat to life and property is going to be a lot less than if the fire isallowed to progress to episode 8.
The implication of the information represented on the chart is simple: as episodes evolve, one after another, each hasthe potential to increase exponentially the threat to the community. Episode 1, a situation where no fire exists, rep-resents insignificant fire loss. An event that progresses to episode 2, where there is actual ignition, is going to offer acertain amount of danger. However, a fire that is allowed to go to open flame (episode 3) presents an amount ofdanger that doesn’t just double but begins to rise on an exponential curve.
This phenomenon is directly related to the rate of rise reflected on the American Standard Time-Temperature curve.The slope of the curve, once it goes from episode 2 through episode 6, is very steep. The slope varies, dependingon fire load, content value, size of structure, and so forth, but the slope line is constant.

A P P E N D I X A • 2 © 2 0 0 3 C O M M I S S I O N O N F I R E A C C R E D I T A T I O N I N T E R N A T I O N A L , I N C .
You may be familiar with the Reflex Time Chart developed by Rexford Wilson. This chart identifies the fixed time rateby which the manpower-technological resource pool responds to a given fire emergency. Wilson’s chart indicates acontinuum that moves forward in time once an event has activated the reflex response.
If you take the standard time-temperature chart and plot the various reflex times against the time temperature curve,you can determine the amount of resources needed to control the fire. For example, if the juncture of the reflex con-tinuum intersects the slope of the time-temperature curve prior to flashover, you have a specific fire problem that canbe controlled with a certain amount of resource, i.e., the first alarm responding companies.
Unfortunately, the reflex continuum does not always intersect the standard time-temperature curve at any given point.We know that firefighters respond to a large percentage of fires that are still in the smoldering stage. In fact, the fre-quency of occurrence of different levels of fire is fairly constant: most fire departments respond to a relatively smallnumber of fires that are out upon arrival, a large number that fall somewhere in the middle of the spectrum of poten-tial fire loss, and a relatively small number that involve an entire block.
What the systems chart does is recognize the existence of both the time-temperature curve and the reflex time con-tinuum, and attemps to place a value on the outcome of controlling the fire at each episode level.
As you read across the chart, you see there is not one solution that, like a rubber band, can be stretched from episode1 all the way around episode 8. There is an array of potential solutions, with each having a cost factor and a timeelement that can be assessed prior to the occurrence of an actual event.
In a systems approach to a community’s fire problem, each episodic level can be strategically dealt with by focusingon the “prevention” of the critical event—that is, by implementing an intervening strategy that prevents the critical eventfrom ever taking place.
The Chart’s MessageIn simplistic terms, what this chart tells us is that fires that don’t occur cost little, while fires that are allowed to reach cat-astrophic levels require astronomical resources to deal with them. Someone once told me that the primary role of aconsultant is to restate the obvious. The systems chart restates the obvious also. It tells us that the fire service mustmake a conscious effort to place a value on keeping fires small or, better yet, on preventing them in the first place.
Many fire departments state that this is their primary mission now. However, their staffing patterns suggest that theemphasis is really at the opposite end of the spectrum.
In analyzing the response of California fire departments to Proposition 13, I noted that one of the first things to be cutwas the resource of the fire prevention bureau. That was a conscious decision to remove an element of intervention toprevent a fire from occurring in the first place. As an inevitable consequence, more fires occur and subsequently thereis a need to increase the staffing requirements to cope with fires that have gone beyond the limits of the early episodes.
By the same token, a person could argue that reducing manpower levels on existing fire companies is also a con-scious effort to allow the fire to reach a critical event that pushes it into the next highest episode. This can be trans-lated as a conscious decision to allow a fire problem to outstrip the available resources. This also will result in anincrease in fire losses and a subsequent demand for additional resources.
The chart tells us something else. If we assume that episode 1 represents the population of a given fire area, andthat episode 8 represents the total destruction of that fire area, a corollary can be seen between level of effort andlevel of effectiveness. If an area has a population of 30,000, and the fire department devotes level of effort to pub-

© 2 0 0 3 C O M M I S S I O N O N F I R E A C C R E D I T A T I O N I N T E R N A T I O N A L , I N C . A P P E N D I X A • 3
lic education and prevention that totals $100,000 a year, that represents a per capita effort cost of about $3.33. If nofires occur, that $3.33 represents an almost insignificant sum.
Conversely, if little is spent on fire prevention and fires occur at, say, the episode 6 or 7 level with a great deal of fre-quency, the demand for a professional fire fighting force could generate budget expenditures in the millions of dol-lars. Fires stopped at the 6 or 7 level also represent a significant increase in actual fire losses and, subsequently, anincrease in fire insurance rates.
As you can see, the effect is synergistic. As you move down the chart, the cost to individual citizens and to the com-munity as a whole begins to get more and more expensive as you approach episodes 6, 7 and 8.
Trying to determine the cost of fire protection is a complex problem. However, as you read down through the vari-ous episodes, you can see that the system is not being managed. Instead of being in control of the fire problem, theorganization is being controlled by the phenomenon of fire.
Please observe that the chart has a need for everyone in the fire service. Intervention strategies in episode 1 use theexpertise of educators and information specialists. Episode 2 moves into the arena of the code specialist. The nextlevel uses the technologists–the fire protection engineers.
By the time a fire reaches episode 4 or higher, the only resource left for dealing with it is the manual fire fighting force.When a community faces the ultimate Armageddon, it is totally dependent on its manual fire suppression forces andperhaps a benevolent act of God.
The Chart’s UsesPolicy makers in the fire protection agencies, leaders in local government, and those responsible for implementing mas-ter plans for fire protection may be able to use this chart as a tool to identify the impacts of specific policy decisions.Like any tool, however, it has to be matched to the task at hand. I developed this chart primarily as a means of visu-alizing the effectiveness of intervention strategies on any given event. It predicts general trends and patterns only.
For example, the chart suggests that the impact of a certain amount of resources devoted to public education couldbe measured over a three or four year period. Public education could be an extremely cost-effective way of reduc-ing a community’s fire problem. However, it would probably take at least a five to seven year time frame to accu-mulate a database to adequately describe the outcomes so you could see if such programs were affecting the com-munity’s fire problem.
When fire departments attempt to measure their levels of fire protection, they tend to measure too frequently andalong the wrong dimensions. Statistics are regularly gathered on fire loss and fire cost, on manning levels and equip-ment costs—in other words, on what it takes to suppress fire.
Likewise, local government officials budget resources based on a fire department’s performance at the upper levelsof the episodic chain, and are often unwilling to fund programs that deal with the earlier stages. The net result is thatfire departments are accused of an unwillingness to change. And we have been unwilling to change because it isvery difficult to want to reduce your resources in the face of a strong enemy.
Actually, the U.S. fire service has been doing an admirable job of coping with the fire problem. In many cases, firelosses have been going down because of some of the intervening strategies fire departments have directed towardthe early episodes of fire. The emphasis on residential smoke detectors, on stricter code enforcement with regard tothe removal of common fire hazards, and on automatic fire protection in commercial and industrial occupancies hasforced the fire loss line below the increase in assessed valuation in this country.

A P P E N D I X A • 4 © 2 0 0 3 C O M M I S S I O N O N F I R E A C C R E D I T A T I O N I N T E R N A T I O N A L , I N C .
Unfortunately, many of these decisions have not been consciously based on a systems approach but rather have beenincremental decisions designed to mitigate individual problems. The fire loss records show that when we do havemajor fires, they are still major fires. A decrease in fire frequency means success in the early episodes of fire; anincrease in fire severity might mean a deficiency in staffing and manpower patterns in later episodes.
The Long ViewIn summary, this is a somewhat complex chart that is based on a relatively simple premise: if you divide fire incidentsinto small episodes you can deal with a complex fire problem in a relatively simple and straightforward manner.However, this chart requires some in-depth thinking on the part of the person who wants to utilize it.
Using the chart is not unlike using a road map. You can have the map spread out in front of you, but unless you havepersonally decided where you want to go, the map is nothing but a collection of meaningless lines and dots. The sameapplies to the chart. A fire protection planner has to pick a point on the chart as a target and then go for it.
The very nature of the demands placed on the fire service encourages redundancy. But that’s all right. There willalways be a need for parallel planning for all levels of fire. As a tool, the chart simply offers a fire protection plannersome shortcuts to resolving portions—not all—of the fire problem. Indeed, the chart may only serve to shift the focusin a community from what people thought was their primary fire problem to what really is the primary problem.
We in the fire service are trained to deal with crisis. But we can’t help but realize that many of the emergencies weface on a daily basis could have been prevented. By using this chart, you will be shifting your thinking from the tech-nical aspects to the philosophical problems of fire protection.
Managing a community’s fire problem is not a finite science. The use of the chart implies decision making and judg-mental elements that are very difficult to define in the content of an article such as this. The chart implies a certaintype of morality associated with policy making in the fire service. It implies a changing role for fire protection officialsand a need to modify behavior.
Those who choose to use a chart such as this must be prepared to let time serve as the final arbiter. Rome wasn’tbuilt in a day and neither were the fire problems in our communities. Even if we altered the entire fire protectiondelivery system in our communities tomorrow and began focusing on the earlier episodes of fire, it is highly unlikelythat there would be any significant change in emergency service needs for a minimum of three years, and more likelyfive or more. But think how much we could have changed things if we had made the right strategic choices in 1965instead of 2002.
Measurable differences in the fire problem probably will not be detected in most communities until 10 years afterstrong fire prevention programs have been initiated. But imagine what the quality of life might be in our communi-ties if we could say 25 years from now that our fire losses are 10 percent of what they were in 1985. Now that’s anadmirable goal.
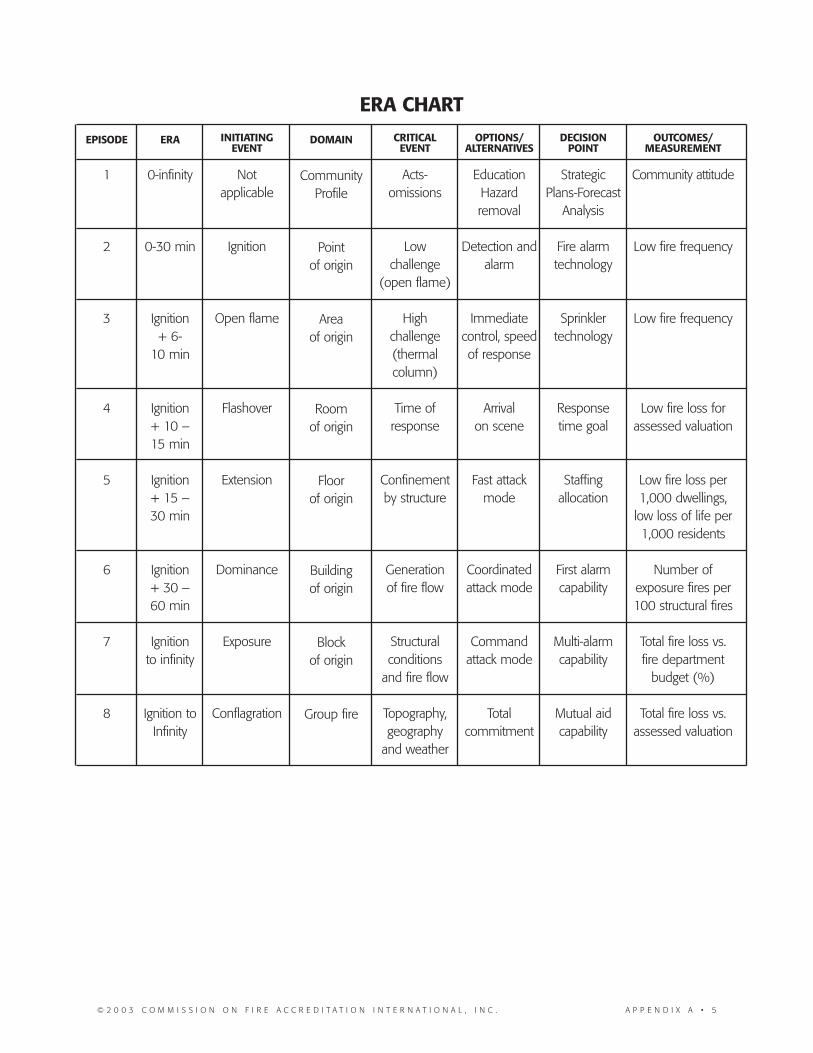
© 2 0 0 3 C O M M I S S I O N O N F I R E A C C R E D I T A T I O N I N T E R N A T I O N A L , I N C . A P P E N D I X A • 5
ERA CHART
EPISODE
1
2
3
4
5
6
7
8
ERA
0-infinity
0-30 min
Ignition+ 6-
10 min
Ignition+ 10 – 15 min
Ignition+ 15 – 30 min
Ignition+ 30 – 60 min
Ignitionto infinity
Ignition to Infinity
INITIATINGEVENT
Not applicable
Ignition
Open flame
Flashover
Extension
Dominance
Exposure
Conflagration
DOMAIN
CommunityProfile
Point of origin
Area of origin
Room of origin
Floor of origin
Building of origin
Block of origin
Group fire
CRITICALEVENT
Acts-omissions
Low challenge
(open flame)
High challenge(thermal column)
Time ofresponse
Confinementby structure
Generation of fire flow
Structural conditions
and fire flow
Topography,geography
and weather
OPTIONS/ALTERNATIVES
EducationHazardremoval
Detection andalarm
Immediatecontrol, speedof response
Arrival on scene
Fast attackmode
Coordinatedattack mode
Commandattack mode
Total commitment
DECISIONPOINT
Strategic Plans-Forecast
Analysis
Fire alarm technology
Sprinkler technology
Response time goal
Staffing allocation
First alarmcapability
Multi-alarmcapability
Mutual aidcapability
OUTCOMES/MEASUREMENT
Community attitude
Low fire frequency
Low fire frequency
Low fire loss forassessed valuation
Low fire loss per1,000 dwellings,
low loss of life per1,000 residents
Number of exposure fires per100 structural fires
Total fire loss vs. fire department
budget (%)
Total fire loss vs.assessed valuation


© 2 0 0 3 C O M M I S S I O N O N F I R E A C C R E D I T A T I O N I N T E R N A T I O N A L , I N C . A P P E N D I X B • 1
APPENDIX BCOMMISSION ON FIRE ACCREDITATION, INTERNATIONAL
TEMPLATE STANDARDS OF RESPONSE COVERAGE
IntroductionThe Commission on Fire Accreditation International defines standards of response coverage as being those adopted,written policies and procedures that determine the distribution, concentration and reliability of fixed and mobileresponse forces for fire, emergency medical services, hazardous materials and other forces of technical response. TheCFAI methodology has nine points of assessment.
The following document is a template for use by fire agencies that are in the process of providing an exhibit for selfassessment for the various performance indicators that deal with standards of response coverage. The purpose of thistemplate is to provide guidelines to provide evidence of compliance with Performance Indicator A2, Criterion 3,Category 2. This document is not intended to be the only way that an organization can comply with this performanceindicator, but it does provide a template that, when fully utilized, should provide the agency with a reasonable expec-tation of approval by peer assessors.
This template provides a section for the analysis and documentation to address each point in an adopted standardsof response cover document.
Executive SummaryAfter the document has been drafted, reviewed and recommended for adoption, prepare an executive summarywhich highlights the main points of the study. Depending upon the format of the study agency, provide essential infor-mation to the reader to obtain either a positive vote or a consensus on the report.
It may include an explanation of the process. For example:■ The following template provides one approach to putting together an agency’s standards of response coverage, it is:■ Based upon the SOC methodology published in the CFAI Self Assessment Manual. All terminology is based
upon that document.■ This process is totally reliant upon the accuracy and comprehensiveness of a local fire agency’s needs, data
and policies.
It is a tool for:■ evaluating and defining an agency’s baseline of operations.■ identifying benchmarks for achieving an agency’s goals and objectives.■ determining levels of service for all, or portions of a community.■ measuring an agency’s performance over different budget or operational years.
And, lastly, a method of documentation of SORC that meets the core competency requirements for accreditation bysupplying supportive evidence that documents both the process and the outcomes.
CFAI Standards of Response-B 10/16/03 5:21 PM Page 1

A P P E N D I X B • 2 © 2 0 0 3 C O M M I S S I O N O N F I R E A C C R E D I T A T I O N I N T E R N A T I O N A L , I N C .
Body of the Report
Section I—Community BaselinesA. Community Overview—This section should provide an overview of the agency that is conducting the study. Itmay include, but not be limited to, a description of both historical and contemporary factual information. The pri-mary purpose of this section is to provide the reader with a context for the department. Previous achievementsand accomplishments that relate to fire station location, staffing and performance that will assist the reader inunderstanding the department’s needs and rationale for developing the standards are useful in setting the foun-dation for the remainder of the document.
B. Describe the Governance Model of the AHJ
C. Current Levels of Service—This section of the document should provide the peer reviewers with a descriptionof the physical and human resources assets of the department as the department currently exists. Do not try tojustify any past decision that has resulted in things being what they are right now. This is just a description of thedepartment resources at the time of the study.
■ Number of companies■ Locations of existing fire stations■ Staffing levels and staffing patterns■ Use charts and graphs to simplify this area■ Provide description or narrative of current goals and objectives.
Section II—Risk AssessmentThis section is established to provide the reader with as understanding of the scope, complexity and relationship ofthe various risk factors. The CFAI recognizes that there are many different ways to illustrate this section. For example,a fire agency that is trying to protect against wildland fires will have to evaluate the factors of fuel, topography andweather. An agency that is an airport facility will have to evaluate aircraft design, runway access and air traffic control.Structural or all-risk agencies may have to use more than one method. The standards of response coverage conceptrecognizes any system that has elements of being based upon empirical data and can be sourced.
CFAI also provides one type of software that can be used without cost. It is called RHAVE. It is available for free fromthe U.S. Fire Administration. It can also be downloaded from the USFA Web site at www.usfa.gov.
A. General requirements.
Provide general demographics of the area to be protected, defined in square miles■ Population at risk■ Permanent ■ Transient
B. Average area protected by initial attack companies, i.e. 20 square miles, five fire companies = four square milesper company, 100 square miles, five companies = 20 square miles. Generally speaking when the area protect-ed by fire companies exceeds nine square miles this results in extended response times.
C. Population density per square mile (population divided by area served) i.e. 10 square miles and 10,000 pop-ulation = 1,000 people per square mile. 100 square miles and 10,000 population = 100 people per squaremile. Generally speaking the lower the density, the lower every other factor tends to be, i.e. calls, values at risk,and even financial resources to support the department’s financial needs.
CFAI Standards of Response-B 10/16/03 5:21 PM Page 2

© 2 0 0 3 C O M M I S S I O N O N F I R E A C C R E D I T A T I O N I N T E R N A T I O N A L , I N C . A P P E N D I X B • 3
D. Building density per square mile (area divided by number of buildings in inventory) i.e. 10 square miles and 5,000buildings = 500 building per square mile. 5,000 buildings in 100 square miles = 50 buildings per square mile.
C. Describe method chosen to describe values at risk
RHAVE is a tool that can help hereStructural Risk AssessmentNumber of structures to protectTypes of structures to protectDefine – levels of risk and categories used
Maximum RiskSignificant RiskRoutine RiskRemote Risk
Non-Structural Risk AssessmentEmergency Medical ServicesHazardous MaterialsHeavy RescueSwift Water RescueWildland
Section III—Standards, Goals and ObjectivesA. Based upon the risks being assessed describe what level of service the department is providing to the com-munity. Describe level of acceptable risk.
In the RHAVE there is a definition of “acceptable risk.” Determine if the service level being provided is intended to dealwith all risk, or whether there are certain situations where there is an element of acceptable risk.
Urban population—usually used to describe dense, fully developed areas, high density of permanent or transient pop-ulation. Density of 1,500 persons per square miles and higher. High number of buildings per square mile. Closelygridded stret network. Limited open space, manufacturing facilities. Usually concentrations of mid and high rises.Commonly core locations that include transportation hubs. Usually over 250,000 population. High per capita tax basein ICMA annual report identified by both size and budget expenditures.
Suburban—usually used to describe areas with mixed occupancy, average to high density populations, typically fringedaround heavily urban areas. Population density between 500 and 1,500 persons per square mile. Moderate numberof buildings per square mile. Gridded streets and existence of cul-de-sac, dead-end residential development. Gatedcommunities. Open space, green areas, mid rise, low rise. Limited high rise. Industry and commercial development.Accessed by limited access highways and freeways. When population is predominantly residential, commonly havestrip malls and franchised buildings such as fast food restaurants, or “big boxes” such as the various “Depot” type busi-nesses. Budgets usually based on property and sales tax. Moderate tax bases, unless areas of affluence with highassessed valuation. Listed in ICMA as cities from 20,000 to 100,000.
Rural—usually used to describe areas with large open spaces, low to moderate population densities, typically remotefrom other areas, normally covered by fire districts as opposed to municipalities. Residential occupancies predomi-nate, agricultural busineses, service businesses.
CFAI Standards of Response-B 10/16/03 5:21 PM Page 3

A P P E N D I X B • 4 © 2 0 0 3 C O M M I S S I O N O N F I R E A C C R E D I T A T I O N I N T E R N A T I O N A L , I N C .
Frontier—used to describe areas that are remote from any significant development, usually limited road network, longresponse times, in excess of 15 minutes.
F. Describe risk policies that are already in existence
Section IV - Discussion of Critical Task Capability of DepartmentA. Provide a description of the critical task(s) that have been developed by the department to describe:
Initial Attack, First Alarm—StructuralInitial Attack, First Alarm—CommercialSecond Alarm Assignment
First Alarm Assignment – Structural
Provide a matrix that describes the departments resources, such as:
Station Engines/ Trucks/ Squads/ Command/staffing staffing staffing staffing
1. . . . . . . . . . . . . . 1-3 . . . . . . . . . . . . 1-4 . . . . . . . . . . . . 1-1 . . . . . . . . . . . . 1-12. . . . . . . . . . . . . . 1-3 . . . . . . . . . . . . . . . . . . . . . . . . . . . . . . . . . . . . . . . . . . . 3 . . . . . . . . . . . . . . 1-4 . . . . . . . . . . . . . . . . . . . . . . . . . . . . . . . . . . . . . . . . . . . Total . . . . . . . . . . . 3-10 . . . . . . . . . . . 1-4 . . . . . . . . . . . . 1-1 . . . . . . . . . . . . 1-1
Section V - Setting Service Level ObjectivesDescribe the method used to develop time and percentile criterion by the agency. If the department needs to informthe reader of the cascade of events and Utstein Criterion, it should be listed as an appendix.
A. Establishing distribution criterion
Provide a definition of what distribution means in the report, in the context of the community preparing this document.
CFAI defines it as: The locating of geographically distributed, first-due resources, for all-risk initial intervention. Thesestation location(s) are needed to assure rapid deployment to minimize and terminate average, routine emergencies.
Describe the service level objective(s) for initial attack (first due) that have been established for the agency for eachrisk type. Agencies may have more than one risk type, i.e. remote, moderate, significant and maximum. Thereforethere may be more than one service objective.
An example of service level objectives is a follows:“For 90 percent of all incidents, the first-due unit shall arrive within five minutes total reflex time
(or travel time). The first-due unit shall be capable of advancing the first line for fire control or start-ing rescue or providing basic life support for medical incidents.”
Or it could more specific;“For 90 percent of all fire incidents in routine risk areas the first-due unit shall arrive within five
minutes total reflex time (or travel time). The first-due unit shall be capable of advancing the firstline for fire control or starting rescue or providing basic life support for medical incidents.”
CFAI Standards of Response-B 10/16/03 5:21 PM Page 4

© 2 0 0 3 C O M M I S S I O N O N F I R E A C C R E D I T A T I O N I N T E R N A T I O N A L , I N C . A P P E N D I X B • 5
There could be separate service level objectives for different types of services, i.e. fire, EMS, technical rescue,hazardous materials, USAR and other events.
There could be separate service objectives for specific fire or emergency demand zones. Provide what isappropriate for the agency to fully define its role in providing fire and EMS protection to the community.
Provide a list of fire station locations. If this statement can be supported by a map, this better illustrates thedistribution information.
If there were any previous methodology of station siting criteria, provide criterion here.
Based upon the area being covered by the fire stations, and the manner and method used to create fire oremergency demand zones, provide an analysis of how workload is distributed among the stations by usingany method that illustrates this point.
If available, provide one paragraph of how the population of each area covered is distributed among therespective stations.
If available, provide one paragraph of how many road miles there are to cover in the entire area, and describewhat percentage of road miles are covered by each station.
If this statement can be supported by a map, this better illustrates the distribution information.
B. Establishing concentration criterion
Provide a definition of what concentration means in this report.
CFAI defines it as: The spacing of multiple resources arranged (close enough together) so that an initial“effective response force” can be assembled on scene within adopted public policy timeframes. An initial effective response force is that which will most likely stop the escalationof the emergency for each risk type.
Describe the service level objective(s) for deploying a first alarm assignment (The department’s definition of an effec-tive response force) that have been established for the agency for each risk type. Agencies may have more than onerisk type, i.e. remote, moderate, significant and maximum. Therefore there may be more than one service objective.
A sample standards of cover policy statement on concentration could be:
“That in a maximum risk area, an initial effective response force shall arrive within 10 minutes total reflextime, 90 percent of the time and be able to provide 1,500 gpm for fire fighting, or be able to handle a five-patient emergency medical incident.”
There could be separate service level objectives for different types of services, i.e. fire, EMS, technical rescue, haz-ardous materials, USAR and other events. Examples:
“In the residential area, a basic life support force shall arrive within six minutes total reflex time, 90 percentof the time and be able to provide 1,500 gpm for firefighting, or be able to handle a one-patient emer-gency medical incident.”
CFAI Standards of Response-B 10/16/03 5:21 PM Page 5

A P P E N D I X B • 6 © 2 0 0 3 C O M M I S S I O N O N F I R E A C C R E D I T A T I O N I N T E R N A T I O N A L , I N C .
There could be separate service objectives for specific fire or emergency demand zones. Provide what is appropriatefor the agency to fully define its role in providing fire and EMS protection to the community.
“That in the area fire demand zone 26, 28 and 30 , an initial effective response force shall arrive within 10minutes total reflex time, 90 percent of the time and be able to provide 1,500 gpm for fire fighting, or beable to handle a five-patient emergency medical incident.”
Based upon the area being covered by the fire stations, and the manner and method used to create fire or emer-gency demand zones, provide an analysis of how concentration is achieved among the stations by using any methodthat illustrates this point.
Describe the percentage of area covered by agency’s effective response force.
Provide information on calls that fall out of the response time goal.
Identify “hard-to-service” areas. These are areas that are within the jurisdiction, are outside of the distributionarea coverage, and therefore are probably outside of areas for concentration also.
Describe percentage of road miles covered by agency’s effective response force.
If this statement can be supported by a map, it better illustrates the concentration information
Section VI—Evaluation of Reliability of Fire CompaniesThis section of the study looks at actual incident history data to measure historical performance. If your agency statesit does something within X-minutes, z percent of the time, does it? If not, why not? How reliable is your response sys-tem? Does the agency frequently see multiple calls for service (stacked, or queued calls) and do these degrade per-formance? Are there predictable times of the day, week or year when queued calls occur? Can these occurrences becontrolled or can peak-hour staffing be used? For example, in some areas in the summertime during extreme fireweather conditions, additional crews are placed into service for the worst part of the day, or in a similar way, EMSpeak-hour incident needs can be handled by additional, part-time units.
Discuss any issues associated with simultaneous calls that result in resources not being able to meet initial attack per-formance goals. Examine data to look at lengthy response times to determine if there are reasons for delayedresponse.
A. Evaluation of drawdown of department
Discuss the issue of what the minimum number of resources the department can be reduced to before it has reacheda point of not being able to handle a secondary or simultaneous call that occurs that is of equal magnitude of a callthat is in progress, i.e you are involved in a structural fire and another structural fire.
Discuss policies or procedures to deal with drawdown. Discuss mutual aid resources in this section if appropriate.
B. Evaluation of resource exhaustion of department
Discuss the issue of what happens when an emergency of sufficient magnitude occurs that results in total commitmentof the department. Describe what policies or procedures are in place to request assistance. Discuss mutual aid here.
CFAI Standards of Response-B 10/16/03 5:21 PM Page 6

© 2 0 0 3 C O M M I S S I O N O N F I R E A C C R E D I T A T I O N I N T E R N A T I O N A L , I N C . A P P E N D I X B • 7
C. Historical performance
Discuss what you know about the department’s performance up to the time that this report/document was prepared.
Describe total call load.
Provide three years data on call workload.
Use charts and graphs to breakdown the components into types of calls.
If mapping technology is available, provide maps.
D. Evaluation of performance on annual basis.
Discriminate between emergency and non-emergency call load. Provide a chart that differentiates these calls.
Provide charts of:
Day of week distribution of total call volume
Day of week distribution of emergency call volume
Treat fire and EMS separately if needed
Day of week distribution of non-emergency call volume
Time of day distribution of call volume
Month of year distribution of call volume
Fractile chart of all calls
Fractile chart of emergency calls
E. Maintenance of effort
This section should describe the agency’s ongoing effort to provide analysis and evaluation of the adopted standardsof cover. This may include, but not be limited to, a description of the management information systems to be used,the assignment of responsibility to a particular person or position, a schedule of assessments or the requirement forthe information to be officially reviewed by the authority having jurisdiction.
F. Overall Evaluation
Once all the individual SOC factors are understood and measured, an overall, comprehensive evaluation must be con-ducted. This is where the professional fire officer’s experience in his/her community is needed. We have all heard thecomputer industry term “garbage-in, garbage-out.” Well, all the statistics may say one thing, but they may totally dis-agree with real world experience. If so, find out why and keep studying until the numbers come close to reality. Thenbased on good data, compare and contrast the study findings to community needs, expectations and the ability toafford. All elected officials should be presented with a cost-benefit analysis, not just a demand for a change.
CFAI Standards of Response-B 10/16/03 5:21 PM Page 7

A P P E N D I X B • 8 © 2 0 0 3 C O M M I S S I O N O N F I R E A C C R E D I T A T I O N I N T E R N A T I O N A L , I N C .
Section VII—Policy Recommendations Provide the reader with a set of recommended actions to be taken. These will be carried forward to the executivesummary as the action items to be adopted. These could be as simple as formally adopting existing service levelobjectives, modifying them, suggesting that they be incorporated in other documents (i.e. budgets or general plan)or they could be as complex as requiring ongoing study. The CFAI recommends that any SOC study be adopted bythe AHJ in a resolution that clarifies the intent of the process.
Summary Written summary of the key points in the report.
AppendicesBibliography
Glossary (if needed)
Map Atlas – if available
CFAI Standards of Response-B 10/16/03 5:21 PM Page 8

© 2 0 0 3 C O M M I S S I O N O N F I R E A C C R E D I T A T I O N I N T E R N A T I O N A L , I N C . A P P E N D I X C • 1
APPENDIX CSTAFF REPORTS
Date: August 11, 2000
To: Staff
From: Chief Randy Bruegman
Subject: Staff Reporting
From time to time, as we are working our way through activities and programs for the organization, you will be request-ed to research and write a “staff report.” Organizationally, we do have some biases, points of view, and expectationsregarding staff reports. If we understand the expectations regarding staff reporting, it will make it a lot easier for us tobe a more effective team for the District as a whole.
The Wisdom Behind Staff ReportsGenerally speaking, when someone is assigned a staff report, the person was selected because he or she falls intoone of the following categories:
1. This is the person with the most expertise and knowledge on a specific subject area.2. The person has an assignment that puts him/her in that area as a result of their job description.3. The person has access to information that is needed to make the staff report complete.
Quite frequently, when people are given a task of doing a staff report, they hope the assignment will result in some-thing productive for the District. After all, on top of all that you have to do, you now have a report to write. However,maybe we should look at it in just the opposite way, as an opportunity. If you are requested to write a staff report, itis because there is a degree of confidence that you have knowledge to provide meaningful input in order to help theDistrict make a decision or a recommendation to the Board. So, it is critical that the work reflects your knowledge, yourexperience, based upon as much fact as possible, and not reflect only your own bias.
If time permits, the selection of a person to do a staff report is often generated by the process of dialogue that weuse at executive and staff meetings to discuss problems. This does not mean that if you speak up on a subject youare going to get “stuck” with a project. It also doesn't mean that if you remain silent you will be able to avoid doing astaff report. What it means is that we must listen very carefully to the various types of contributions that each of usbring to the District and try to determine who would be the best person for the job. If you are asked to do a staffreport, look upon it as an opportunity to contribute to the organization. If determination has been made to committhe time to designate something as being worthy of a staff project, you can be guaranteed the end product will bereviewed thoroughly, and the information will be used. The use of staff reports is for the express purpose of makingdecisions, and therefore we must rely upon your expertise in giving ACCURATE and COMPLETE INFORMATION, toassist the Board in their decision process.

A P P E N D I X C • 2 © 2 0 0 3 C O M M I S S I O N O N F I R E A C C R E D I T A T I O N I N T E R N A T I O N A L , I N C .
The ProcessIf you are given a staff project to accomplish, there are three things that are essential at the very outset. These are:
1. You have to know exactly what the objective of the staff report is. 2. We must have an opportunity for you to engage in a dialogue with members of the staff to determine the
scope of the staff report.3. There must be a time set for the completion of the staff report.
Nothing is more frustrating than being asked to do a staff report on something that is ambiguous and have a dead-line of sometime, someday. Staff reports are based on a “bias for action.” This means that you have to know why youare doing it, what you are supposed to be accomplishing by writing the report, and when it has to be done. Failureto provide any one of those three elements almost always dooms the staff report/project to failure.
Submitting a Staff ReportThere is a tendency, when people are given a staff assignment, for them to report back to their supervisor periodicallyand inform staff on how they are doing. It is important that you engage in extensive dialogue up front when you havebeen given a staff report to accomplish. The reason for this is that your task is to put the report together in as “unbi-ased” a form as possible.
From a District perspective, the primary interest in a staff report is that when it arrives on my desk as a completedproject, IT IS! Theoretically, if the staff report is being written on a subject such as something that requires City Manager,Council, or a Board decision, it is my desire to be able to take the report and transmit it directly to those particularindividuals with a minimum or no modification on my part. This means that completed staff work is just that, com-pleted. A good staff report will follow the outline presented. If the report requires substantial documentation, overseven to eight pages, utilize an executive summary.
When you prepare a staff report you should rely extensively on our professional secretarial/support staff of the Districtto review the finished documents. Review your material prior to submittal. The finished document should be just asprofessional as you are and reflect the quality of work you can do.
Therefore, it is appropriate, if you are given a staff assignment, for you to feel you have the right to come to me orany other appropriate staff member and discuss the issues critical to the project. By assigning a staff report to a mem-ber of our organization, we are in fact delegating the authority to act, collect information, and recommend a courseof action on certain elements for the District. Your confidence level in whether that research is going to be meaning-ful is directly related to your comprehension of what the staff report is all about in the first place. You always have theright, in fact the obligation, to make sure you understand why the project is considered relevant and what timetablesor deadlines are needed for its completion. It will never be held against a staff member for raising issues in the courseof developing any staff project. If we cannot discuss the issues, then there is a good possibility we have no right toask for the work to be accomplished.
Preparing a Staff ReportTeaching people how to write staff reports is an awful lot like trying to tell someone how to play music. Some peo-ple have an ear for it; others have to have sheet music in order to play. In both cases, however, there are some spe-cific strategies that can help all of us prepare better staff reports.
One of the basic ground rules is before you start writing a staff report, you must do your homework. That means col-lecting all the facts, details, information, resources, and other support materials that relate to the subject for the reportthat you are going to write. All too often, people start off the wrong way by trying to write the report and then findfacts to support their position. Any staff report must be generated from the facts. If you have not guessed by now, wehave a tendency not to like the “winging-it” approach. If we are changing our course, we better be able to justify it.

© 2 0 0 3 C O M M I S S I O N O N F I R E A C C R E D I T A T I O N I N T E R N A T I O N A L , I N C . A P P E N D I X C • 3
The second ground rule is prior to writing an actual report, you should sit down and develop an outline of the facts.In preparing the outline, jot down the main issues or key points and use that to organize the outline. The beginningof the outline should be an introduction to the subject and the finish should be a conclusion or summary. If the reportis to be presented to the Board, they have a preference of an outline they prefer. (See attached).
The third ground rule of staff reports is to always write at least one rough draft of a report prior to putting it into finalform. By developing a rough draft that is double-spaced, it will allow you the opportunity to read your material foradditions and corrections. It will also allow you to let someone else read the staff report for their input.
The fourth ground rule is to write extensively and edit ruthlessly. The most successful staff reports are usually no morethan two to three pages, single-spaced. Staff reports that tend to go on longer than that become somewhat of a bur-den on the reader.
Therefore, in preparing the staff report, it is better to collect all the information, develop an expanded outline, and writean extensive report; then go back and edit it down until it is comprehensive, concise, and to the point. If the reportneeds to be lengthy, provide an executive summary. It really helps to get the key points you have addressed in yourreport across to the reader.
It may seem that outlining and rough drafts are exercises that are somewhat futile, but they aren't. All too often, whensomeone is trying to prepare a staff report and trying to keep it brief, they leave out some of the more pertinent detailsand add in “flowery” information that is not necessarily relevant but sounds good. When we use the term “write long,”it doesn't mean five and six times the finished product length. It is not uncommon for an edited staff report to beanywhere from one half page to one page less than the first rough draft. Quite frequently, this editing process canreally be shortened by going back and reading the paragraphs and removing unnecessary modifiers, transition wordssuch as “and,” eliminating irrelevant facts, and pruning the sentences so they are more concise.
The final rule, and most important, in writing a staff report are the recommendations and actions recommended.When completing a staff report, the bottom line is that we have identified a need to take a course of action. Do notever hesitate making a recommendation that is direct and to the point. The reason they are called recommendationsis that they are not, in fact, actions themselves. They depend upon the reader of the staff report taking that input andutilizing the information during the decision making process. A staff report that is basically historical and does not pro-vide a direction for the reader is not really contributing to the decision-making process. However, the recommenda-tions better be supported by the facts outlined in your report, and reflect the ability to look at all sides of the issue.
SummaryThis is an overview on report writing and is by no means a comprehensive study in report writing. It's merely anoverview of expectations on the use of written documents to facilitate the level of professionalism in our organization.The District strongly encourages all of us to participate in report writing seminars, courses of instruction in English andcreative writing, or other opportunities to learn more about written reports.
We all hear the lament that we have too much paperwork. I appreciate that perspective and will do everything I canto eliminate unnecessary paperwork. Unfortunately, staff reports are grist for the mill of decision making and are notunnecessary. In fact, they are vital in the job as Fire Chief, to the Board of Directors, Senior Staff, and to all in the admin-istration and management of our resources.
The ability to do this kind of work does not come easily. Like the small child who once asked a famous violinist howhe got to Carnegie Hall, the answer is simple. Practice! Practice! As previously stated, your input is vital when you areasked to do a staff report. Your impact and contributions to the decision-making process of the District are going tobe greatly dependent upon your ability to develop and complete quality factual staff reports.

A P P E N D I X C • 4 © 2 0 0 3 C O M M I S S I O N O N F I R E A C C R E D I T A T I O N I N T E R N A T I O N A L , I N C .
SIX “GOLDEN RULES” OF A GOOD STAFF REPORT 1. COMPLETED STAFF WORK is the study of a problem and presentation of a solution by a staff officer in such
form that all that remains to be done on the part of the Chief is to indicate approval or disapproval of thecompleted action. The words “completed action” are emphasized because the more difficult the problem is,the more the tendency is to present the problem to the Chief in piece-meal fashion. It is your duty as anofficer to work out the details as much as you can with the information at hand. The product, whether itinvolves the pronouncement of a new policy or affects an established one, a new program or an analysis,should, when presented, be in finished form.
2. The impulse, which often comes to the inexperienced officer, is to ask your supervisor what to do and recursmore often when the problem is difficult. It is accompanied by a feeling of mental frustration. It is so easy toask a Chief what to do, and it appears so easy for him to answer. Resist that impulse. You will succumb toit only if you do not know your job. It is your job to advise the Chief, Board and staff what the best courseof action is. What is needed are answers, not questions. Your job is to study, write, re-study and re-write untilyou have evolved a proposed course of action--the best one of all you have considered. If you have done agood staff report the Chief or the Board has the needed information to make good decisions.
3. Writing a memorandum does not constitute completed staff work, but writing a memorandum for yoursupervisor to send to someone else does.
4. The theory of completed staff work does not preclude a rough draft, but the rough draft must not be a half-baked idea. It must be complete in every respect except that it lacks the requisite number of copies, andneed not be neat. But, a rough draft must not be used as an excuse for shifting to the Chief or other staffmembers the burden of formulating the action.
5. The completed staff work theory may result in more work for a staff officer, but it results in more freedomto explore ideas. This is as it should be. Further, it accomplishes two things: (1) The Chief is protected fromhalf-baked ideas, voluminous memoranda, and immature oral presentations. (2) The staff officer who has areal idea to sell is enabled more readily to find a market. Two critical points are: first, too often, staff reportsare based on intuition, rumor, innuendo, or some other emotional appeal. We should focus on facts when-ever possible and if the data is not available, either say so or determine how to acquire it. Secondly, it seemsas if some staff reports are more like thinly veiled sales pitches. These reports usually result in little more thana reading event.
6. When you have finished your completed staff work, the final test is this: If you were the Chief, would you bewilling to sign the paper you have prepared and stake your professional reputation on it being right? If theanswer is no, take it back and work it over, because it is not yet completed staff work.

© 2 0 0 3 C O M M I S S I O N O N F I R E A C C R E D I T A T I O N I N T E R N A T I O N A L , I N C . A P P E N D I X C • 5
OUTLINE
1. Action Request
2. Background
3. Known Facts- Policy Implications- Budget Implications
4. Potential Issues
5. OptionsA.B.C.D.
6. Recommendation and Why


© 2 0 0 3 C O M M I S S I O N O N F I R E A C C R E D I T A T I O N I N T E R N A T I O N A L , I N C . A P P E N D I X D • 1
APPENDIX DGEOGRAPHIC INFORMATION SYSTEMS -
A POWERFUL NEW TOOL FOR FIRE & EMERGENCY SERVICES
By Russ JohnsonPublic Safety Industry ManagerESRI, Redlands California
IntroductionWhy should fire departments utilize Geographic Information Systems (GIS)? Fire Departments have the responsibili-ty to protect lives and property but have a limited amount of resources. It is critically important that the deploymentof resources is effective, efficient and based upon the best information possible. Effective deployment is based onnumerous complex issues; fire flow requirements, effective fire fighting force, occupancy, historical occurrence,response time and others. Traditional planning methods require the use of numerous maps, reports, tables and his-torical records. This data is often found in a variety of different locations, formats and requires a great deal of time toacquire, prepare and formulate into a useful format. Resultant deployment plans are often completed, implementedand shelved. Deployment planning in the traditional sense is more of an event than an ongoing process.
GIS allows fire officers to view all of the data necessary to analyze deployment in one view. Data can be added, sub-tracted or modified with a click of a mouse. Alternative plans can be created, analyzed and modeled by fire officersusing GIS. Once a GIS database has been created, deployment analysis can be reviewed and updated at any timewith little effort. GIS allows deployment analysis to become a process rather than a periodic event.
Although computerized mapping systems have been around for many years, recent improvements have made GISsoftware available on the desktop and on laptops. GIS applications developed specifically for fire departments providetremendous functionality through a user-friendly interface. GIS software can now be used by non-specialists toimprove planning, analysis, and response. These tools offer managers the ability to eliminate much of the guessworkthat has been the norm in tasks such as siting stations or deploying apparatus.
What GIS Can DoStation Location PlanningSiting fire stations is a challenging task that is often over-simplified. In its most basic form, many stations are sited usinga simple radius coverage scheme that is believed to relate back to the time of horse-drawn fire apparatus. Other for-mulas presume that fire departments protect only real property, that travel speed is constant at all hours of the day,and that emergency events occur randomly with respect to time. In truth, fire department response involves non-fire(medical and service) responses. Travel time is dependent on traffic patterns. Most emergency events are predictablewithin certain limits and not randomly distributed.
Because of the constant changes in street networks, the ability to “test” potential fire station locations for area cover-age is very important. Historically, this testing was accomplished by sending a fire vehicle equipped with stopwatch todrive an area and “mark” travel times over the street network. This approach is limited by the varying speeds, dis-tances, and the availability of crew time in the face of competing duties. It is also not possible to test areas wherestreets have not been completed or where the street network is subject to change.
The ArcView® GIS package from Environmental Systems Research Institute (ESRI), with the Network Analyst extensioncan assist in new station location analysis. ArcView with its extensions run on desktop PCs running Windows 95, 98,or NT. Network Analyst allows an organization to test station locations using average travel speeds or in minutes oftravel with accuracy that can conform to the agencies requirements.

A P P E N D I X D • 2 © 2 0 0 3 C O M M I S S I O N O N F I R E A C C R E D I T A T I O N I N T E R N A T I O N A L , I N C .
Creation of Response Performance ZonesIn developing standards of response coverage, it is necessary to examine areas and perform statistical analyses ofresponse performance within those areas. Using GIS, responses can be address matched to their specific locations.Once incidents have been mapped, the underlying data can be retrieved and displayed. Subsets of responses can bequeried to perform statistical analysis. Response Zones can be created based upon workload, fire risk, and responsetimes rather than traditional response time criteria.
Pin Mapping and Response AnalysisOne of the most powerful tools provided by a GIS is the ability to geo-code or address match individual incidents anddisplay those incidents on jurisdictional base maps. Fire agencies can use geo-coded data to make tactical decisions.Decisions may include the need to purchase and assign additional extrication tools, strategically position a brush engine,or adjust staffing levels. Fire prevention requirements and other mitigation strategies can be determined through GISincident analysis. For example, fire cause can be mapped and compared to prevention programs provided. An areawith a high occurrence of children-caused fires may indicate a need for a neighborhood educational program.
Incident data can be readily examined via GIS and deployment adjusted accordingly. GIS provides the ability to quicklyquery the database and perform “what if” scenarios. The tools have eliminated waiting for paper maps to be pro-duced, allowing real-time problem solving by staff officers and others.
Mobile Data ComputersDynamic GIS in the cab of emergency response apparatus is rapidly expanding. This exciting development will elimi-nate many of the difficulties associated with too many three-ring binders, outdated map books, transfer of personnel,and rapidly developing communities. Firefighters will be able to obtain maps, travel directions, pre-fire plans, and avariety of other information from their mobile computers.
Large Incident ManagementLarge-scale incident management can be greatly enhanced through timely application of GIS technology. Incidentcommanders faced with wildfires, floods, earthquakes or other events are often overwhelmed by the vast amount ofneeded information to make critical decisions. GIS allows incident personnel to visualize and display complex data forother members of the incident management team and the public.
GIS has proven so valuable to California’s fire service that FIRESCOPE (the statewide all-incident mutual aid program)has GIS specialists assigned to its overhead incident management teams, utilizing common base maps, map sym-bology, and fire planning data. When large numbers of resources must be mobilized and accounted for as the eventprogresses, GIS has proven to be invaluable asset.
Recommendations for Fire and EMS AgenciesEvery fire service executive should be thinking about implementing GIS into the management and incident manage-ment process. One of the primary challenges for implementing GIS is obtaining geographic data. If reasonably accu-rate digital base maps are already available in the community (and the fire department has access), the biggest obsta-cle has been overcome. If data is not available from other departments, street data can be purchased reasonably fromcommercial sources. State of the art desktop GIS software, such as ESRI ArcView 3.2, can be acquired for less than$1200.00. ArcView runs on a desktop PC (you will need at least 64, and preferably 128 MB of RAM) under Windows95, 98, or NT. A computer-literate staff member with an interest can perform useful GIS work after a two-day trainingcourse (available from ESRI or through many community colleges). Geo-coding of incidents will require that incidentdata (location, times, incident type, etc.) be entered in to a database.

© 2 0 0 3 C O M M I S S I O N O N F I R E A C C R E D I T A T I O N I N T E R N A T I O N A L , I N C . A P P E N D I X D • 3
Hardware requirements vary based on user needs. A basic letter sized inkjet (color) printer such as one of the desk-top printers will produce up to 11”x 17” maps. Large-scale plotters make beautiful wall maps. Liquid Crystal Display(LCD) computer projectors allow real-time “what if” testing of scenarios projected on the wall. The application of GIStechnology for your daily business activities is limited only by imagination.
Existing Municipal ResourcesIn most communities, some level of GIS resources already exists. Municipal utilities, surveyors, tax assessors, trans-portation providers and others utilize GIS data to plan, analyze, and record geographic data. Another resource thatshould not be overlooked are law enforcement agency’s “crime analysts.” Most medium and large police and sher-iff’s departments have special units, often comprised of detectives and specialized support personnel, who use GISto map crime patterns and recommend resource deployment strategies for street patrol officers. Many strategies andtechniques employed by crime analysts are readily adaptable to the analysis of fire and EMS responses.
Multi-Agency PartnershipsIf your agency is too small to support its own GIS specialists, resources can be shared between agencies. One agencycould do the work, another fund the cost of basic data, and a third might perform the legwork to locate some impor-tant resources (hydrants, for example). Developing GIS capability is relatively straightforward and not cost prohibitive.It is always more cost efficient when agencies develop, share, and distribute data.
ConclusionFuture ConsiderationsThe opportunities to utilize GIS for planning, managing, and evaluating fire service operations appear to be virtuallylimitless. Mapping of all risk incidents can be made simplified, shortened, and made more efficient through the appli-cation of GIS technology.
Developments in GIS technology can provide tremendous enhancements to today’s fire service managers. Futuredevelopments will further revolutionize the way we do business. Automation will improve efficiencies for respondersand fire prevention personnel as well as managers and supervisors. Current and future fire service leaders should beencouraged to develop a growing awareness of the applications of GIS technology to their business.
“100 years ago the way we displayed our fire protection problems was on Sanborn maps. Drawnby hand, building by building, block by block, they were eventually abandoned because they weretoo labor intensive. Today we need specific information on our fire problems more than ever. And,we have a new tool: GIS. Just like we no longer fight fires with steamers, we shouldn't be usingcentury-old techniques to define our fire problems with a pad of paper and a pen. E-fire meansusing your computer to achieve excellence in fire planning.”
—Ronny J. ColemanRetired California State Fire Marshal

A P P E N D I X D • 4 © 2 0 0 3 C O M M I S S I O N O N F I R E A C C R E D I T A T I O N I N T E R N A T I O N A L , I N C .
Specialized GIS ApplicationsFlame by Bode Research GroupFLAME is a geo-based tool that uses actual street network data for your area to model emergency vehicular travel.This program includes a digitized, Census-based street map data for your community. Flame is a step below a full GISpackage and unless your community is very new, the census map will have most, if not all, of the streets in it. Flamecan run on an average desktop PC.
By:BRG Precision Products221 W. MarketDerby, KS 67037Phone: 800-295-0220 or 316-788-2000Fax: 316-788-7080http://www.brgproducts.com/page4.html
FireViewFireView is a geographic analysis product designed to meet the planning and analysis requirements of fire depart-ments. As a suite of integrated analysis tools designed for use in the ArcView GIS environment running underWindows, FireView facilitates the accomplishment of both simple and complex fire analysis tasks.
By:The Omega Group12707 High Bluff DriveSuite 120San Diego, CA 92130858-481-3119www.theomegagroup.com
CAD Analyst and Fire/EMS ADAMCAD Analyst is a performance analysis system. It is a “mapping-based” software that runs on the Windows 95/NT/2000 operating systems using another program called MapInfo. The CAD Analyst software is used to calculateworkload and performance and then display the result in both text and graphic outputs. The user can adjust the cri-teria in the calculation to see what the overall and specific result would be when that criteria is applied. The overallsystem performance is then shown in a text report. Performance for each grid (ZBB) is shown on a thematic (color-coded) map. Workloads are shown in the same manner.
Fire/EMS ADAM is a deployment analysis system. Using the results derived from CAD Analyst, Deccan creates theappropriate workloads for each grid (ZBB) and travel speeds for each unit type and geographic area. Then, using astreet map, the computer calculates the driving time from and to each grid (ZBB) as well as each current and pro-posed fire station location. The model is then calibrated, so that response performance projections for the currentlocation scenario closely match actual recorded performance in CAD Analyst.

© 2 0 0 3 C O M M I S S I O N O N F I R E A C C R E D I T A T I O N I N T E R N A T I O N A L , I N C . A P P E N D I X D • 5
By:Deccan InternationalSan Diego, Calif.858-799-7981 – voice858-799-7010 – faxhttp://www.deccanintl.com
CATSCATS (Consequence Tool Set) is a PC-based system that works with the affordable geographical information system(GIS) ArcView. CATS provides a comprehensive package of hazard prediction models, casualty and damage assess-ment tools, and population and infrastructure data for a wide range of applications. It also offers the user the oppor-tunity to add databases for custom analysis.
By:SAIC10260 Campus Pt. DriveMail Stop C2San Diego, CA 92121858-546-6022www.saic.com


© 2 0 0 3 C O M M I S S I O N O N F I R E A C C R E D I T A T I O N I N T E R N A T I O N A L , I N C . A P P E N D I X E • 1
APPENDIX ECOMPUTER MAPPING BASED MOVE-UP OF FIRE
RESOURCES DURING DISASTERS
B y R a j N a g a r a j , P h . D .
D i r e c t o r o f E n g i n e e r i n g , D e c c a n I n t e r n a t i o n a l
1 0 7 1 7 S o r r e n t o V a l l e y R o a d , S a n D i e g o , C A U S A
Table Of ContentsTable Of Figures . . . . . . . . . . . . . . . . . . . . . . . . . . . . . . . . . . . . . . . . . . . . . . . . . . . . . . . . . . . . . . . . . . . . . . . . . . . . . . . . . . . . 2Overview . . . . . . . . . . . . . . . . . . . . . . . . . . . . . . . . . . . . . . . . . . . . . . . . . . . . . . . . . . . . . . . . . . . . . . . . . . . . . . . . . . . . . . . . . . 3Background . . . . . . . . . . . . . . . . . . . . . . . . . . . . . . . . . . . . . . . . . . . . . . . . . . . . . . . . . . . . . . . . . . . . . . . . . . . . . . . . . . . . . . . . 3What Is a Move-Up? . . . . . . . . . . . . . . . . . . . . . . . . . . . . . . . . . . . . . . . . . . . . . . . . . . . . . . . . . . . . . . . . . . . . . . . . . . . . . . . . . 4Why are Move-Ups Needed? . . . . . . . . . . . . . . . . . . . . . . . . . . . . . . . . . . . . . . . . . . . . . . . . . . . . . . . . . . . . . . . . . . . . . . . . . 5Current Move-Up Practice In the US . . . . . . . . . . . . . . . . . . . . . . . . . . . . . . . . . . . . . . . . . . . . . . . . . . . . . . . . . . . . . . . . . . . 5Problems with Current Practice. . . . . . . . . . . . . . . . . . . . . . . . . . . . . . . . . . . . . . . . . . . . . . . . . . . . . . . . . . . . . . . . . . . . . . . . 6Computer Mapping Based Approach. . . . . . . . . . . . . . . . . . . . . . . . . . . . . . . . . . . . . . . . . . . . . . . . . . . . . . . . . . . . . . . . . . . 7Approach Design . . . . . . . . . . . . . . . . . . . . . . . . . . . . . . . . . . . . . . . . . . . . . . . . . . . . . . . . . . . . . . . . . . . . . . . . . . . . . . . . . . . 7Computer Aided Dispatch (CAD) Data Source . . . . . . . . . . . . . . . . . . . . . . . . . . . . . . . . . . . . . . . . . . . . . . . . . . . . . . . . . . 8Digital Maps. . . . . . . . . . . . . . . . . . . . . . . . . . . . . . . . . . . . . . . . . . . . . . . . . . . . . . . . . . . . . . . . . . . . . . . . . . . . . . . . . . . . . . . . 9Mapping Software. . . . . . . . . . . . . . . . . . . . . . . . . . . . . . . . . . . . . . . . . . . . . . . . . . . . . . . . . . . . . . . . . . . . . . . . . . . . . . . . . . . 9Analytical Models . . . . . . . . . . . . . . . . . . . . . . . . . . . . . . . . . . . . . . . . . . . . . . . . . . . . . . . . . . . . . . . . . . . . . . . . . . . . . . . . . . . 9Move-Up Modeling Software: Putting It All Together . . . . . . . . . . . . . . . . . . . . . . . . . . . . . . . . . . . . . . . . . . . . . . . . . . . . . 10Validating the Evaluation Tools . . . . . . . . . . . . . . . . . . . . . . . . . . . . . . . . . . . . . . . . . . . . . . . . . . . . . . . . . . . . . . . . . . . . . . . 10Building Disaster Scenarios . . . . . . . . . . . . . . . . . . . . . . . . . . . . . . . . . . . . . . . . . . . . . . . . . . . . . . . . . . . . . . . . . . . . . . . . . . 10Building First-Pass Move-Up Preplans for Disaster Scenarios . . . . . . . . . . . . . . . . . . . . . . . . . . . . . . . . . . . . . . . . . . . . . . 10Evaluating First-Pass Preplans Using A Computer Model . . . . . . . . . . . . . . . . . . . . . . . . . . . . . . . . . . . . . . . . . . . . . . . . . 10Developing New Preplans and Identifying Preferred Ones. . . . . . . . . . . . . . . . . . . . . . . . . . . . . . . . . . . . . . . . . . . . . . . . 11Move-Up Book - Documenting Preplanned Move-Ups For Disasters . . . . . . . . . . . . . . . . . . . . . . . . . . . . . . . . . . . . . . . 11Application Of Computer Mapping Based Approach in Seattle, USA . . . . . . . . . . . . . . . . . . . . . . . . . . . . . . . . . . . . . . . 11Seattle Layout . . . . . . . . . . . . . . . . . . . . . . . . . . . . . . . . . . . . . . . . . . . . . . . . . . . . . . . . . . . . . . . . . . . . . . . . . . . . . . . . . . . . . 11Overview of the tools that were used: CAD Analyst & ADAM . . . . . . . . . . . . . . . . . . . . . . . . . . . . . . . . . . . . . . . . . . . . . 11Disaster Scenario 1: Fire in Ship Canal . . . . . . . . . . . . . . . . . . . . . . . . . . . . . . . . . . . . . . . . . . . . . . . . . . . . . . . . . . . . . . . . 14Disaster Scenario 2: Fire on 30th floor of 50 story un-sprinkled high-rise . . . . . . . . . . . . . . . . . . . . . . . . . . . . . . . . . . . 16Challenges Of Switching To Computer Mapping Based Approach . . . . . . . . . . . . . . . . . . . . . . . . . . . . . . . . . . . . . . . . . 17Benefits Of Computer Mapping Based Approach . . . . . . . . . . . . . . . . . . . . . . . . . . . . . . . . . . . . . . . . . . . . . . . . . . . . . . . 17Issues Involved In Adapting Computer Mapping Based Approach To Asia & Europe . . . . . . . . . . . . . . . . . . . . . . . . . . 17Future Work. . . . . . . . . . . . . . . . . . . . . . . . . . . . . . . . . . . . . . . . . . . . . . . . . . . . . . . . . . . . . . . . . . . . . . . . . . . . . . . . . . . . . . . 17Conclusions. . . . . . . . . . . . . . . . . . . . . . . . . . . . . . . . . . . . . . . . . . . . . . . . . . . . . . . . . . . . . . . . . . . . . . . . . . . . . . . . . . . . . . . 17Acknowledgments . . . . . . . . . . . . . . . . . . . . . . . . . . . . . . . . . . . . . . . . . . . . . . . . . . . . . . . . . . . . . . . . . . . . . . . . . . . . . . . . . 17References. . . . . . . . . . . . . . . . . . . . . . . . . . . . . . . . . . . . . . . . . . . . . . . . . . . . . . . . . . . . . . . . . . . . . . . . . . . . . . . . . . . . . . . . 17

A P P E N D I X E • 2 © 2 0 0 3 C O M M I S S I O N O N F I R E A C C R E D I T A T I O N I N T E R N A T I O N A L , I N C .
Table Of Figures Figure 1. Lighted Map Board Of Seattle, Washington, USA. . . . . . . . . . . . . . . . . . . . . . . . . . . . . . . . . . . . . . . . . . . . . . . . . 6Figure 2. Schema For Computer Mapping Based Approach For Move-Up Pre-planning . . . . . . . . . . . . . . . . . . . . . . . . 7Figure 3. Seattle CAD Analyst Workload and Response Performance Calculator. . . . . . . . . . . . . . . . . . . . . . . . . . . . . . 12Figure 4. Seattle Current Response Performance On Medical Priority Calls . . . . . . . . . . . . . . . . . . . . . . . . . . . . . . . . . . 12Figure 5. First Paramedic Average Distribution . . . . . . . . . . . . . . . . . . . . . . . . . . . . . . . . . . . . . . . . . . . . . . . . . . . . . . . . . . 13Figure 6. First Paramedic Percentage Distribution . . . . . . . . . . . . . . . . . . . . . . . . . . . . . . . . . . . . . . . . . . . . . . . . . . . . . . . 13Figure 7. ADAM % Projection Of Current Paramedic Response Performance . . . . . . . . . . . . . . . . . . . . . . . . . . . . . . . . 14Figure 8. Projected % Engine Performance Following 2nd Alarm Response To Ship Fire . . . . . . . . . . . . . . . . . . . . . . 15Figure 9. Engine % Response Performance Following Six Apparatus Move-Up In Ship Fire Response . . . . . . . . . . . 15Figure 10. Initial Attack Coverage Following 2nd Alarm Response to Seafirst Building Fire . . . . . . . . . . . . . . . . . . . . . 16Figure 11. Initial Attack Coverage Following Move-Ups After 2nd Alarm Response to Seafirst Building Fire . . . . . . . 16

© 2 0 0 3 C O M M I S S I O N O N F I R E A C C R E D I T A T I O N I N T E R N A T I O N A L , I N C . A P P E N D I X E • 3
OverviewThis paper offers a computer mapping based approach for preplanning fire apparatus move-ups during disasters,which taps into data being collected in fire fighting operations and into field-provider move-up experiences. Move-upis essentially the repositioning of available fire resources during ongoing emergencies so that the service area contin-ues to be adequately covered. The proposed approach is an alternative to the current practice of identifying move-ups on the fly in a seat-of-the-pants manner.
The plan of this paper is as follows: The motivation behind the new approach for developing disaster move-up pre-plans is described in the Background section. In the next section, What is A Move-up?, move-ups are formally defined.The need for move-ups is detailed in the following section, Why are Move-Ups Needed? Current move-up practicein the United States and problems with it are described in the following two sections. The proposed alternate approachis detailed in the next section, Computer Mapping Based Approach. This section describes in order, the approachdesign; the Computer Aided Dispatch (CAD) and digital map data that it needs; the mapping software that it uses todisplay analysis and obtain feedback from the user; briefly, the analytical model that underpins it and exploits the CADdata and digital maps; how the model is validated using its analysis of current deployment; the disaster scenarios thatmust be envisioned and for which move-up preplans must be constructed; the first-pass preplans that are built by theuser based on past experience and user judgment; how the first-pass preplans are evaluated using the model; hownew preplans are built based on model analysis of first-pass ones and how the preferred ones are identified; andfinally, the preparing of a preplan move-up book.
Next, an application of the computer mapping based approach to Seattle, USA, is described, including two Seattle dis-aster scenarios and the move-up preplans that were developed for them using the approach. Old habits die hard.Hence, the challenges an operation must face when switching from the current practice to the computer mappingbased approach is described in the next section, Challenges Of Switching To Computer Mapping Based Approach.The benefits of the new approach are compiled in the next section. Next, in Adapting Computer Mapping BasedApproach To Asia & Europe, the issues involved in adapting the approach to alternate fire-fighting cultures and dataavailability such as those prevalent in Asia, Europe, and Australia are discussed. The paper closes out with ideas onfuture work and with conclusions.
BackgroundImagine that you are in a fire operations command center. Imagine also that you are satisfied with the current posi-tioning of your fire resources–your entire service area is fairly well covered, at least, the best you can given politicaland resource constraints. You even have more resources in the areas where traditionally call volumes are higher.Suddenly, a disaster erupts. You are forced to commit a large number of fire resources to it. No longer is your servicearea well covered–a lot of holes show up, both in high and low call volume areas. What do you do? While before thedisaster, the positioning of the remaining resources was adequate, they are clearly inadequate now. Should you domove-ups, i.e., reposition them? If the answer is yes, then to where? Unfortunately, a lot of other issues are flying byyou, and you don’t have the energy, or the time, or the calmness to evaluate the situation and devise a suitable gameplan. You then basically wing it, i.e., you decide on a course of action on the fly and hope for the best. If you were incommand center like the one in Seattle, USA, you may have some evaluation aids such as a lighted board with amap of the service area, lighted bulbs in the locations where you have resources, and unlit ones in the areas youdon’t. However, you still are devising move-ups in a seat-of-the-pants manner because you don’t know the coverageimpacts of potential move-ups. All you know is that certain areas are uncovered. Should you move the engines orladder trucks or both in order to cut down the uncovered areas? There are so many alternatives that you are eventu-ally taking a stab in the dark.
It does not have to be this way. This paper offers an alternate approach that (1) easy to use, (2) taps into the bestbrains within your operations and into the data that you collect, and (3) forces you to preplan move-ups for variousdisaster scenarios in a systematic and calm fashion. Then, during a disaster you simply pull up the move-up preplan

A P P E N D I X E • 4 © 2 0 0 3 C O M M I S S I O N O N F I R E A C C R E D I T A T I O N I N T E R N A T I O N A L , I N C .
that was developed for it and implement it knowing that it has had the benefit of the best thinking when it was devel-oped. Then during a disaster, you can focus on other issues that truly need your time and energy.
Most fire operations have valuable information that they already have that they can tap into in order to explore thewhole gamut of possible pre-plans and to come up with the best possible disaster preplans. Either the data residesin the operation’s CAD, if it has one, or in the department’s database that tracks all the calls that it responds to includ-ing incident address and related information.
The objective of this paper is to describe one approach to tapping into the department’s database and field experi-ence in order to explore and identify the best possible disaster preplans. It is based on the following premises:
1. People who develop and maintain CADs and information systems have a full-time job doing just that and so havethat little energy or time to tap into the data being collected for conducting analysis and developing disaster game-plans. Furthermore, they are likely to be more skilled in radio and communications technology and less in theanalytical tools or in the field experience needed for developing disaster preplans. As a result, the alternativeapproach must not tax such folks. All it can ask of them is to provide data in a raw form, not requiring much pro-gramming or processing.
2. The approach must be computer based because computers are particularly adept in the grunt work needed formove-up analysis, such as (1) calculating the along-the-road miles from each location alternative to various partsof the service area, (2) projecting the travel time taken by various apparatus types to various destination points,(3) projecting workloads of various apparatus, or (4) tallying up the coverage scores of move-up plan alterna-tives.
3. Computers, however, are not adept in composing new move-up alternatives or tapping into past move-up expe-rience, or in taking intangibles into account. So this approach must be driven by field personnel who are bothknowledgeable about the service areas and who have had experience in executing move-ups.
4. Field personnel, however, have little time for building up the needed analytical skills or for becoming experts insoftware design tools. Hence, all the analytical tools needed must be packaged in the background, not be intim-idating, and be inconspicuous. Furthermore the application must be quick to learn and easy to use. If not, even-tually it will be on the wayside, sitting on a shelf.
5. Field personnel must take ownership of the preplans being developed, otherwise at crunch time the plans willeither not get implemented or get corrupted This can be achieved only if the personnel are fully involved duringthe development process
In order to meet the above objectives, the software tool must have the following features:
a) be mapping based for easy and graphic results visualization,b) should only have buttons that are to be pressed,c) should incorporate all needed analytical models in the background, andd) should enable the planner to save, retrieve, and delete various move-up scenarios.
The following sections describe the approach in detail.
What Is a Move-Up?Move-up: The practice of repositioning uncommitted fire resources during an ongoing emergency so that they arebest positioned for handling the next emergency, wherever it may be, while ensuring that potential additional resourceneeds of the current emergency are quickly met, whenever they occur.
Other names for move-up that we know of are dynamic redeployment and system status management.

© 2 0 0 3 C O M M I S S I O N O N F I R E A C C R E D I T A T I O N I N T E R N A T I O N A L , I N C . A P P E N D I X E • 5
Why are Move-Ups Needed?As can be inferred from its definition, move-ups are needed for two reasons:
(1) To ensure that adequate reserve units of the right kind are available to the incident commander of an ongoingemergency and at locations that are close to the emergency, and
(2) To ensure that the service area continues to be adequately covered in order to handle future emergencies.
Move-ups are the direct result of the unpredictability of disasters. Thus, while one can locate fire stations and ambu-lance halls using careful planning based on historical workloads and historical response performances, a disaster willcause the plans to go out-of-kilter. The disaster could occur at a location that historically had low call volumes. As aresult, additional units would be needed at a location that, based on historical data, would have been a low priority.Uncommitted fire apparatus will have to be moved-up to this location from their pre-designated locations in order toaddress potential additional needs of the ongoing disaster.
At the same time, one cannot ignore the need to (1) continue to be ready for the next emergency wherever it mayoccur, and (2) address historical apparatus needs. For example, on January 13, 1982 a plane crash and train accidentoccurred back-to-back in Washington, DC, USA. In that case, if apparatus were not moved-up after the first emergency,the second one would have faced unsatisfactory response performances. Similarly, during a disaster, other emergen-cies will continue to occur and their resource needs must continued to be met in a satisfactory manner.
Following a disaster, move-ups are inevitably needed. For if a fire operation does not execute move-ups during dis-asters, it may face repercussions because of bad response performances and second-guessing by parties affected.
Current Move-Up Practice In the USAs noted above, every fire operation moves-up apparatus in some form or the other. While in some, the move-upsare done routinely even after minor emergencies, in others move-ups are performed only when there is a dire needto do so. Almost always, move-ups are composed by the dispatcher, lead dispatcher, or dispatch supervisor who ison duty at the time of the disaster. On occasions, the incident commander at the disaster site comes up with andorders the move-ups.
In some operations, move-ups are preplanned and stored in a computer. Then during a disaster, the dispatcher strictlyfollows the preplan that applies to the situation. However, the preplans themselves are built in a seat-of-the-pantsmanner, strictly relying on the judgment and experience of the person entering the preplans.
In Seattle, WA, a site that we explore in greater detail later in the paper, the active dispatcher has at his/her disposala set of preplanned move-ups associated with each alarm response. Alarm responses are collection of units dis-patched in batches in response to a reported fire and fire escalations. The alarms are named 1st, 2nd, and so ondepending on whether they correspond to the 1st batch, or 2nd batch associated with the incident location.
Seattle has a set of preplanned move-ups associated with the 2nd alarm on and up. The preplans were built andadjusted over a period of time, over 80 years. The preplans, however, presume that all of the other apparatus areavailable, which invariably is untrue. In Seattle, typically seven apparatus are unavailable for one reason or the other.Hence, the dispatcher has to tweak the preplanned move-ups in order to adapt to actual apparatus availability at thetime of move-up. For this tweaking, this person has one aid, i.e., a lighted large-size map on the wall as shown on thenext page.

A P P E N D I X E • 6 © 2 0 0 3 C O M M I S S I O N O N F I R E A C C R E D I T A T I O N I N T E R N A T I O N A L , I N C .
Figure 1. Lighted Map Board Of Seattle, Washington, USA
The map has lighted bulb for each station along with four letters that can be lit, i.e., E, L, M, & A – E for engine, L forladder, M for medic unit, and A for aid car (non transport unit with medical technicians on board). If the engine asso-ciated with the station is out, i.e., unavailable because it is busy on a call or for some other reason, the station’s E let-ter goes dark; otherwise, i.e., if the engine is at the station, then the station’s E is lit. Similarly for station ladder, medicunit and aid car. During a disaster, in order to tweak the preplanned move-ups, the dispatcher looks at the board toidentify areas where additional units are already tied up by looking at the unlit Es. The dispatcher uses these obser-vations and decides on the actual move-up to implement.
Problems with Current PracticeIn current practice, experience totally dominates preplan move-up development. While experience is vital, it limitsopportunities to those that have been experienced before. There are move-ups that a department could take thathave never been taken before and which would not show up during the preplanning process.
Moreover, the preplans are based on the existing locations of stations and apparatus assignments. Thus, to be accurate, theyhave to be adjusted whenever stations are moved/added/closed and whenever apparatus are reassigned to different stations. This adjustment is labor intensive and time consuming, and invariably is either not done or done in a cursorymanner. As a result, the preplans become out of date and inappropriate for current station and apparatus deployment.
Next, the pre-plans themselves are premised on all units uninvolved in the alarm responses being available. This prem-ise invariably does not hold – in Seattle, as mentioned earlier, on the average seven such units are committed on othercalls. As a result, the active dispatcher has to adjust preplan move-ups to reflect the current situation. While for this, thedispatcher has the assistance of the lighted map described earlier, the dispatcher is still left making decisions depend-ing heavily on their judgment. As a result, the quality of the move-ups is at the mercy of the active dispatcher, his/herjudgment and experience. Furthermore in doing so, this person is prevented from focussing on other issues that trulyneed his/her attention such as meeting incident commander’s needs and looking up building plans.
In many operations, the dispatcher does not even have the benefit of preplanned move-ups. In these cases, this per-son has to compose the move-ups from scratch – quite a tall order for someone who has many other importantissues to take care of. Move-ups get compromised in the process. The operation becomes unnecessarily ill preparedfor the next emergency.
Lighted map of Seattlewith lighted bulbs andlighted lettering indicatingapparatus status.

© 2 0 0 3 C O M M I S S I O N O N F I R E A C C R E D I T A T I O N I N T E R N A T I O N A L , I N C . A P P E N D I X E • 7
It does not have to be this way. Fire operations collect phenomenal amounts of data that can be tapped into whiledevising move-ups. Analytical models are available that can be exploited. Digital mapping technology, power portablecomputers, and user friendly operating systems and user interfaces are now at the disposal of fire operations at rela-tively low cost. If all of these are put together in a fashion where field managers can focus on applying their experi-ence and knowledge rather than on the mechanics of data processing and model construction, then fire operationswill be able to come up with rigorous, highly effective, move-up preplans. Moreover, the preplans will be able to betweaked with little dispatcher effort, thereby enabling a fire operation to continue to be best positioned for the nextemergency. This is precisely the objective of the approach described next.
Computer Mapping Based ApproachThe following computer mapping based approach offers a novel alternative for preparing move-up preplans. The lay-out of the approach is described below.
Approach DesignThe computer based mapping approach would have three components that drive the process:
1. Incidents & Responses Data Analyzer, 2. Field Officers, and3. Move-Up Plans Evaluator
The process schema is shown in the figure below. Here, the three process drivers are shown within ovals. The processdrivers take in various data, both raw and intermediate, in order to generate other data. The data components areshown in the rectangular boxes. The final products are the Move-Up Preplans (near the bottom left of schema). Theraw data are Incidents & Responses Data and Map Data. They are used by the Incidents & Response Data Analyzerin order to generate the Workloads and Response Performance analyses along with Model Parameters to be usedby the Move-Up Plans Evaluator.
Figure 2. Schema For Computer Mapping Based Approach For Move-Up Pre-planning
Incidents & Response Data
Performance TargetsResponse Performance
Move-Up Preplans
Map Data
Map Data
Workloads
Model Parameter
Disaster Scenarios
Preplan EvaluationsMove-Up Plans Evaluator
Incidents & Response Data Analyzer
Field Officers

A P P E N D I X E • 8 © 2 0 0 3 C O M M I S S I O N O N F I R E A C C R E D I T A T I O N I N T E R N A T I O N A L , I N C .
The Incidents & Response Data Analyzer is needed because fire operations need to first understand their currentworkloads and response performance in order to have a basis for evaluating the effectiveness of move-up plans andto identify the most effective ones. It should be mapping based in order to display the results geographically and suc-cinctly. A single color-coded map can be much more effective in conveying results compared to reams of tables andlines of text. In order to display the results in maps, the Analyzer will need to use mapping technology and digitalmaps of service area, i.e., the Map Data. Another output of the Analyzer are any Mover-Ups Plans Evaluator ModelParameters that can be derived from the Incidents & Responses data.
Next in the schema, Field Officers would review the Workloads and Response Performances and identify PerformanceTargets. Performance Targets specify the timeliness of various apparatus capabilities to the scene of disasters andemergencies. For example, a review of the Hong Kong Fire Services Web site reveals that its performance target onambulance emergency calls is to have an ambulance at incident address within 10 minutes of dispatch. Field Officersalso compose Disaster scenarios for which move-up preplans have to be developed. They would also prepare a first-pass, experienced-based set of Move-Up Preplans for the above scenarios.
Finally, the Move-Plans Evaluator would take in (1) the above Disaster scenarios, Move-Up Preplans, andPerformance Targets, (2) the current Workloads, (3) the Model Parameters derived by the Analyzer, and (4) the MapData in order to evaluate the preplans and to display the Preplan Evaluations. The Preplan Evaluations must be inthe form in color-coded maps highlighting the areas of poor and good coverage. They also must include succinctresponse performance scores so that the preplans can be compared in an objective manner.
Once the first set of preplans have been evaluated by the Evaluator, Field Officers would review them and possiblycome up with a different set of Preplans, which in turn are evaluated by the Evaluator. The loop continues until theOfficers are satisfied with the preplans they have developed. This loop is shown pictorially in the schema above inthe form of a dashed loop that goes through the Evaluator and the Officers and traces the path of the preplans goingfrom the Officers to the Evaluator and the evaluations going from Evaluator to Officers. For this process to work, theactual implementation of the loop must be in the form of a simple computer user interface in which a user can withmere drags of mouse and pressing of buttons define new plans and view their evaluations, tweak the plans, view thenew evaluations, and so on until the user is satisfied that he/she can do no better.
The components of the approach are described in greater detail below.
Computer Aided Dispatch (CAD) Data Source For implementing the computer mapping based approach, raw incident and responses data must be available in oneform or the other. Basically the data would be in the form of one line for each unit response. A fire incident wouldhave multiple unit responses and so would be represented in the form of multiple lines in the response data. To beuseful, each response line would contain the following information:
Time of Call*. . . . . . . . . . . . . . . . . . . . . . . . . . . . . . . . . . . Apparatus NumberDate Of Call* . . . . . . . . . . . . . . . . . . . . . . . . . . . . . . . . . . Time Of Caller Information EntryIncident Address. . . . . . . . . . . . . . . . . . . . . . . . . . . . . . . . Time of DispatchIncident Number . . . . . . . . . . . . . . . . . . . . . . . . . . . . . . . Time On Scene*Incident Type . . . . . . . . . . . . . . . . . . . . . . . . . . . . . . . . . . Time Proceeding To HospitalTime at Hospital . . . . . . . . . . . . . . . . . . . . . . . . . . . . . . . . Time Back In ServiceTime Back In Area . . . . . . . . . . . . . . . . . . . . . . . . . . . . . . Time Back In Station
The address, time of call and data are needed in order to plot the incidents and capture workloads. The apparatusnumber and time-stamps are needed in order to derive response performance in various categories. The moredetailed the time-stamps, the more opportunity a planner has to identify solutions for reducing response times.

© 2 0 0 3 C O M M I S S I O N O N F I R E A C C R E D I T A T I O N I N T E R N A T I O N A L , I N C . A P P E N D I X E • 9
In many fire operations in the US the above data are automatically collected in their CAD (computer aided dispatch)software that are used to dispatch units on incidents and keep track of them. If an operation does not have a CAD,the data is usually logged in manually and stored in some form of an information system. Either way, with or withouta CAD, the raw response data would be needed for evaluating response performances and workloads.
Digital Maps In order for incident data and computed response performance to be plotted and viewed easily in the form of color-coded maps, clearly the underlying maps are needed. With digital maps the plotting becomes automatic. In addition,to view workload and response performance in color-coded maps, one would be simply have to press a few buttons.The primary digital map needed is the so-called "street centerline file." This file has one line for each street segmentof the service area. Each line would contain the following:
1. Street name2. Lower and upper address ranges of the left and right side of the corresponding segment, and3. Latitude, longitude pairs for both ends of the segment.
In some countries like the US and Singapore, the government provides this file practically free for anybody to use. Inothers, the files while available, may require some cost.
Besides needed for plotting incidents, the digital street centerline file is essential for one another task, i.e., quickly andautomatically calculating the along-the-road (as opposed to as-the-crow-flies) miles from any point in the service areato any other point. These calculations are essential for the preplan evaluator when evaluating the coverage effective-ness of move-up preplans.
Finally, other digital map files besides the street centerline files that are useful in both the analyzer and evaluator are(1) schools and hospital locations, (2) park and water boundaries, etc. These files are essentially used in a cosmeticmanner – when a user zooms into a part of the service area, he/she would be able to quickly recognize where he/sheis by viewing the cosmetic layers.
Mapping Software Digital mapping technology is critical for the approach to succeed. Not only is it needed in order to exploit the digitalmap data for constructing color-coded maps, but also for enabling the user to easily specify move-up scenarios andmove-up preplans. Move-ups should be able to be specified by mere drags of the mouse. Digital Mapping technol-ogy is needed for this. Two of the more popular mapping software in the US are MapInfo by MapInfo Corporation,Troy, NY and ArcView by ESRI, Redlands, CA.
Mapping software, while essential for the computer mapping based approach, are not ready for direct use by fieldofficers. To be useful, they require significant training and time commitment on the part of a user, something that istypically not at the disposal of field officers. Hence, to be truly productive and useful the mapping technology has tobe embedded within the tools of the computer mapping based approach, i.e., within the Analyzer and the Evaluator
Analytical Models Analytical models are essential for projecting the impact of proposed move-ups. In addition, to being effective theyhave to be quick, in that they should enable a user to evaluate multiple preplans in one sitting. Starting the 1970s sig-nificant work [1] [2] [3] was done on fire apparatus deployment modeling. That was twenty years ago. Today, whenone inquires fire departments as to how such tools have helped them, the typical answer is that the tools are on abookshelf, unused. The tools required too much time commitment on the part of users that eventually users got fedup. Moreover, field officers were disenfranchised from the process–the analysis was done by some analyst over a

A P P E N D I X E • 1 0 © 2 0 0 3 C O M M I S S I O N O N F I R E A C C R E D I T A T I O N I N T E R N A T I O N A L , I N C .
span of eight months or so, and the chief was left reacting to the recommendations at the eleventh hour. The chiefswere not going to embrace the recommendations because they were uninvolved in the process, and as a result, itwas hard for them to implement recommendations of which they were not a major part and face the consequencesof resulting actions.
Clearly then to be useful, just like mapping technology, analytical models must be embedded within the tools of thecomputer mapping based approach.
Move-Up Modeling Software: Putting It All TogetherAs discussed above, all the different components of the approach must be embedded in convenient tools in orderfor them to be truly useful. In Seattle where the software were applied to test the approach, the tools used were CADAnalyst and FireEMS ADAM by Deccan International, San Diego, CA, USA. CAD Analyst was used as the Incidents &Response Data Analyzer and FireEMS ADAM was used as the Move-Plans Evaluator.
Validating the Evaluation Tools For the computer based mapping approach to be used by field officers, it must prove its validity. Otherwise, its analy-ses could be a pie-in-the-sky projection of move-up impacts. One simple but effective way for the tools to be validat-ed is to use the tools to independently project last year’s performance based on last year’s workloads and last year’sdeployment. If the projections come close to what really happed last year, then it provides one measure of validation.
Another valuable validation method is to have a field officer review the projections for data sanity. Are workloads beingshown more in areas where experience has shown to be so? Are projected first-due coverage close to what are expe-rienced in the field?
Building Disaster ScenariosField officers would build the scenarios. For this, they would use historical disasters and their understanding of whatdisasters could occur in their service area. For the Seattle exercise, two disaster scenarios were considered:
1. Actual disaster: Fire in a 320’ fish processing ship on the south side of the Ship Canal, and2. Projected disaster: Fire in an un-sprinkled 50’ high-rise.
To construct the scenarios in the Evaluator the officers would drag out all apparatus from the service area indicating thatthey are all committed to the disaster. Officers should be able to save the different scenarios and document them.
Building First-Pass Move-Up Preplans for Disaster ScenariosField officers would come up with the first-pass move-up preplans based on their experience and judgment. To con-struct the first-pass preplans in the Evaluator, officers would start with the disaster scenario saved earlier and literallymove-up the apparatus appropriately using drags of the mouse. Officers should be able to save the different preplansand document them.
Evaluating First-Pass Preplans Using A Computer ModelField officers should be able to evaluate preplans by the mere pressing of a button. When the button is pressed allthe analytical computations and projections must be completed in the background and quickly. The results of theanalysis should be displayed in simple color-coded maps. If performing the analysis were not this simple, field offi-cers would be frustrated and the tool will eventually get unused.

© 2 0 0 3 C O M M I S S I O N O N F I R E A C C R E D I T A T I O N I N T E R N A T I O N A L , I N C . A P P E N D I X E • 1 1
Developing New Preplans and Identifying Preferred Ones The evaluations of the first-pass preplans should reveal areas where coverage is below par and where it is above.These revelations should help field officers to easily identify additional move-ups, if they are needed. Each evaluationshould also have some cumulative scores so that two preplans can be compared in an objective manner.
Move-Up Book—Documenting Preplanned Move-Ups For Disasters Once the preplans are finalized they have to be easily retrieved at disaster time. If an operation has a CAD then thepreplans can be stored in it in the form of tables. At time of need, retrieving the move-ups would be a simple act ofa table look-up in the CAD. In Seattle, the preplan move-ups are immediately displayed to the dispatcher whenevera 2nd or more alarm response is ordered. However, the CAD could go down because of power failure or some otherreason. Hence the move-ups should also be stored in the form of a book that a dispatcher can have easy access to.It would have for each zone of the service a move-up preplan line for the each alarm response. Each line would listout which units would be repositioned to which location.
APPLICATION OF COMPUTER MAPPING BASED APPROACH IN SEATTLE, USASeattle LayoutFounded in 1869, the City of Seattle is located in the State of Washington on Puget Sound, 113 miles (182 km) fromthe U.S.-Canadian border. Seattle is a commercial, cultural and advanced technology hub of the U.S. Pacific Northwestand a major port city for trans-Pacific and European trade. Mountains and water surround its land area, which spans84 square miles (218 square km). Its 1997 population was 536,600.
The Seattle Fire Department (SFD) has 33 fire stations. The 1999-2000 budget proposes to operate 31 engine com-panies, 11 ladder companies, six aid units, and six medic units. The department also has units for hazardous materi-als responses; marine responses, including two fireboats on the central waterfront; heavy rescues; and command andcommunications. The department Communications Center dispatched responses to 67,689 emergency calls in 1997.Of these, 52,221 were requests for emergency medical services.
Seattle is long and narrow and is dependent on many bridges that go across water inlets. Some of its major hazardareas are the Port of Seattle which is the fifth largest container port in the United States, downtown which has tall un-splinkled buildings, and Boeing, the aerospace manufacturer.
Overview of the tools that were used: CAD Analyst and ADAMBoth tools were built by Deccan International, San Diego, CA, USA. CAD Analyst was used as the Incidents & ResponseData Analyzer and FireEMS ADAM was used as the Move-Plans Evaluator.
A brief overview of CAD Analyst for Seattle is as follows.
CAD Analyst is mapping based software that runs on the Windows 95 and Windows NT operating system. Its featuresare listed below:1. A workload and response performance calculator that lets a user specify the specific days-of-the-week, times-of-
the-day, seasons of the year, and incident type groups of interest. CAD Analyst then extracts the incidents duringthat time period and of that type and displays their density thematically in a map

A P P E N D I X E • 1 2 © 2 0 0 3 C O M M I S S I O N O N F I R E A C C R E D I T A T I O N I N T E R N A T I O N A L , I N C .
Figure 3. Seattle CAD Analyst Workload and Response Performance Calculator
Figure 4. Seattle Current Response Performance On Medical Priority Calls
2. Average performance buttons that let a user look at specific response type performances such as average firstunit, first EMT, first paramedic, second engine on scene. The performances are thematically displayed in a man-ner that green means averages better than the target performance and red indicates averages below target. Inthe figure shown below, areas with paramedic response times worse than the target of nine minutes are clearlyhighlighted in red.

© 2 0 0 3 C O M M I S S I O N O N F I R E A C C R E D I T A T I O N I N T E R N A T I O N A L , I N C . A P P E N D I X E • 1 3
Figure 5. First Paramedic Average Distribution
3. Percentage performance button that displays percent of incident meeting performance targets are displayed ina manner that green and dark green coloring means at least 75% of the responses are within the target and redand dark red coloring indicates otherwise. The figure shown below color-codes areas based on their percent ofparamedic response time performance.
Figure 6. First Paramedic Percentage Distribution
4. Zoom button that lets a user zoom into a particular area of the response area, and views all the incidents in thatzone. Each incident is colored coded as stars. The user can click on a star to get all details on that incident includ-ing incident number, date of incident, location, etc.
Using CAD Analyst, a field officer can within minutes look at last year’s workloads and response performances on, say,Motor Vehicle Accidents (MVAs) during morning rush in the weekdays.

A P P E N D I X E • 1 4 © 2 0 0 3 C O M M I S S I O N O N F I R E A C C R E D I T A T I O N I N T E R N A T I O N A L , I N C .
A brief overview of ADAM is as follows.Fire/EMS ADAM has the following features:1. Enables the user to specify alternate fire apparatus location scenarios by merely "dragging" apparatus with a
mouse from one location to another.2. For the above scenarios, automatically recalculates and graphically displays response performance.3. Calibrates software so that response performance projections for the current location scenario closely matches
actual recorded performance.4. Automatically color-codes the service area according to hazard type and whether response time goals are being met.5. Estimates response travel distance based on the street system and not "as the crow flies."6. Estimates call-to-scene times under new location scenarios based on past history only, not assumptions on relat-
ed items such as travel speeds.7. Estimates apparatus run-loads and apparatus availability under new location scenarios based on historical distri-
bution of incidents.8. Calculates both average and percentile response performance to various zones within the service area. Example
of percentile performance is "Percentage of incidents with response times less than eight minutes."9. Displays response performances for both fire and medical incidents.10. Enables user to delete, save and retrieve different analysis scenarios.
In order to verify ADAM for Seattle is a reliable evaluator of move-up preplans, its projections for last year’s workloadsand last year’s deployment must closely match last year’s performance. An example of this validation is shown below.Here, ADAM projection of percentage of paramedic response performance is shown. Comparing it with Figure 6reveals that the projections are comparable, and one can apply ADAM with some confidence for preplan evaluations.
Figure 7. ADAM Percentage Projection Of Current Paramedic Response Performance
Next, two disaster scenarios are analyzed and move-up preplans evaluated using ADAM
Disaster Scenario 1: Fire in Ship CanalThis was an actual disaster. A fire started in the Yard Arm Knot, a 320’ fish processing ship. It was moored one blockeast of the Ballard Bridge on the south side of the Ship Canal. The alarm came in at 11:30AM and lasted three days.Seventy five percent of SFD resources were at this incident until 4:00PM the first day. Ten firefighters were exposedto chlorine when ten tanks connected to a manifold failed and filled the fire deck with gas.

© 2 0 0 3 C O M M I S S I O N O N F I R E A C C R E D I T A T I O N I N T E R N A T I O N A L , I N C . A P P E N D I X E • 1 5
The first engine performance scenario following the 2nd alarm response to the fire is shown below. Here the incident loca-tion is shown as a large pin. Observer how all the stations in the west central part of the city is emptied out of all its units– they are all committed on the incidents, a total of 11 engines, four ladder trucks, three medical units, and four field chiefs.
Figure 8. Projected Percentage Engine Performance Following 2nd Alarm Response To Ship Fire
Also observe in the figure above the impact on engine coverage across a wide areas surrounding the fire. If there wereanother fire in that swath of area then engine response times would be poor. Move-ups are clearly needed. Threeengines and three ladders were moved-up. Their impact on engine coverage is shown below:
Figure 9. Engine Percentage Response Performance Following Six Apparatus Move-Up In Ship Fire ResponseFollowing the move-ups, ADAM’s evaluation of engine coverage performance increased from 75% before the move-ups to 80% after. Clearly the move-ups resulted in improved engine coverage.

A P P E N D I X E • 1 6 © 2 0 0 3 C O M M I S S I O N O N F I R E A C C R E D I T A T I O N I N T E R N A T I O N A L , I N C .
Disaster Scenario 2: Fire on 30th floor of 50 story un-sprinkled high-riseThis building is the Seafirst building in downtown Seattle. The assumption is a fire starts on the 30th floor of this un-sprinklered building at 10:00PM. Rescues of on-duty engineers, cleaning and maintenance people, and possibly somelate workers may be required. The building is potentially occupied by 3,000 people during working hours.
The Initial Attack Force (IAF) coverage following a second alarm response to the fire is shown below. IAF, in Seattledefined for low hazard areas as two Engines, one Ladder Truck and at least 12 firefighters, specifies the minimumequipment and staffing that are needed before a fire can be fought in an adequate fashion. Observe the poor IAFcoverage in east central part of the city.
Figure 10. Initial Attack Coverage Following 2nd Alarm Response to Seafirst Building Fire
Current move-up preplans call for six engines and four ladders to be moved-up. ADAM’s evaluation of these move-ups is shown below. As can be seen, the impact seems minor. In fact, IAF coverage drops from 77% to 69%. Clearlythese preplanned move-ups have to be re-examined.
Figure 11. Initial Attack Coverage Following Move-Ups After 2nd Alarm Response to Seafirst Building Fire

© 2 0 0 3 C O M M I S S I O N O N F I R E A C C R E D I T A T I O N I N T E R N A T I O N A L , I N C . A P P E N D I X E • 1 7
Challenges Of Switching To Computer Mapping Based ApproachTo be successful, the approach should get the full support of field personnel – they are after all the ones who feelthe impact at move-up time. Crews generally do not like to move if they are not responding. Thus, a key part of usingthe computer based mapping approach is to have both field and dispatch personnel fully involved in the process rightfrom the start. Other challenges include extracting needed data from the CAD, obtaining needed maps.
Benefits Of Computer Mapping Based ApproachSuch an approach enables a fire operation to leap frog from seat-of-the-pant methods of move up preplanning to arigorous data-driven analysis of move up preplans. It enables an operation to explore move-up opportunities thatwould never be considered doing the traditional process. As was seen in the Seattle example, sometimes experience-based move-up preplans actually worsen the situation.
Issues Involved In Adapting Computer Mapping Based Approach To Asia & EuropeWhen adapting the approach to Asia, Europe and Australia, the following five issues must be addressed: 1. Alternate Command and Control Culture2. Alternate Equipment Capabilities3. Alternate Fire-fighting Tactics4. Availability Of Digital Maps5. Availability of CAD data
Future WorkThere are two possible extensions to the Computer Mapping based approach: (1) integrating the approach into CADs,and (2) providing move-up recommendations. The integration with the CAD will enable the approach to tap into theactual status of the various field units and tailor analysis to this situation. Move-up recommendations will enable thepreplanning committee to quickly hone in on optimal move-up preplans.
ConclusionsMove-up preplanning is essential for fire departments. Based on our experience with the Seattle case study theComputer based Mapping Approach is clearly a giant improvement in this process. It would be interesting to explorethe applicability of this approach in Asia, Europe and Australia.
AcknowledgmentsWe would like to express our gratitude to the Seattle Fire Department for allowing us to share their experience in thispaper. We would like to specifically thank Fire Chief James Sewell as well as Battalion Chief Wesley Goss for helpingus assimilate this paper. It was Chief Goss who prepared the Seattle scenarios for this paper.
References1. Dormont, Peter, Jack Housner, and Warren Walker, Firehouse Site Evaluation Model: Description and User Manual,
The New York City – Rand Institute, New York, NY, USA, May 1975.2. Rider, Kenneth, A Parametric Model for the Allocation of Fire Companies, The New York City-Rand Institute,
New York, NY, USA, April 1975.3. PTI Fire Station Location Package, Public Technology Incorporated, Washington, DC, USA


© 2 0 0 3 C O M M I S S I O N O N F I R E A C C R E D I T A T I O N I N T E R N A T I O N A L , I N C . A P P E N D I X F • 1
APPENDIX FDOWNERS GROVE FIRE DEPARTMENT
Risk and Hazard AssessmentIntroductionThe Village of Downers Grove is located approximately 20 miles west of downtown Chicago. The Downers GroveFire Department was officially founded around May 1, 1898. Today the Fire Department is a full service organizationthat is staffed by 85 sworn and civilian fire service professionals. The Department provides fire suppression, emer-gency medical services and other services to approximately 50,000 permanent residents. The daytime populationswells to approximately 125,000 due to the wide variety of commercial, industrial and residential occupancies overan area of 14.5 square miles. The Village of Downers Grove is a part of the Chicagoland metropolitan area and ispredominately suburban in community type.
On duty staffing is provided 24 hours a day, seven days a week by a total of 73 sworn company officers, firefighter/para-medics and firefighter/emergency medical technicians, who operate out of four fire stations located throughout theVillage. The response area is divided into four “still” districts. Station 1 is located in the western part of the responsearea and responds with a tower ladder truck/heavy rescue squad company. Stations 2, 3, and 5 all are staffed withthree member engine companies (two of which are advanced life support (ALS) capable and ALS ambulances).
In March 2000 the Downers Grove Fire Department initiated a new program to identify potential hazards and thelevel of risk within the Village. The Risk, Hazard and Value Evaluation (RHAVE) program is administered by the FirePrevention Bureau. All data collection is performed by the on-duty fire companies, who survey buildings and com-plete the required forms. The available water supply is verified in conjunction with each RHAVE survey.
The purpose of this document is to provide an analysis of information gathered from RHAVE surveys and existing records.
Section 1 of the Risk and Hazard Assessment describes potential non-fire risks the Village of Downers Grove and theDowners Grove Fire Department may be challenged with in the future. Natural hazards, security hazards and tech-nological/human hazards are among the topics covered.
Section 2 is an assessment of fire and non-fire risks in each of the fire response grids (planning zones) located with-in the jurisdiction of the Downers Grove Fire Department. The “Worst” fire risk(s) in each grid is identified and locat-ed. The “Worst” fire risk(s) are hazards that require the maximum amount of resources or would result in the great-est loss of life or property. A worst case fire-flow has been established and the primary hydrant at the location wastested to identify available pressure, gallonage, and whether the fire flow is available or not. The “Routine” (most com-mon), and specific non-fire risks are identified in each grid as well. A RHAVE classification rating is provided for each“worst” and “routine” risk.
The Downers Grove Fire Department is currently building a database for the information gathered from the RHAVEsurveys. The software uses the data to calculate an Occupancy Vulnerability Assessment Profile (OVAP) score. Fivefactors are considered in the formula. The building factor includes areas such as the construction of the structure,exposure hazards, accessibility and square footage. The life safety factor covers areas such as occupancy load, occu-pant mobility, fire alarm information and egress acceptability. The risk factor includes both the probability and conse-quence of a serious fire incident. The fire load and the Fire Department’s capacity to control a particular incident atan occupancy is considered in the risk factor. The water demand factor involves finding the required fire flow for anoccupancy based on the construction materials and square footage of the structure. The final factor included in the
CFAI Downers Grove FD-F 10/16/03 5:28 PM Page 1

A P P E N D I X F • 2 © 2 0 0 3 C O M M I S S I O N O N F I R E A C C R E D I T A T I O N I N T E R N A T I O N A L , I N C .
OVAP formula deals with the potential impact a large fire or life loss would have on the community. The programclassifies the occupancy according to the OVAP score. The higher scores, 60 and higher, will be classified as a “Worst”hazard occupancy. The occupancies with a score ranging anywhere from 40 to 59 will be classified as a “Key” haz-ard occupancy. The majority of the occupancies found in the Village of Downers Grove will have scores rangingbetween 15 and 39 and would be classified as “Routine” hazard occupancies. Scores lower than 15 represent“Remote” hazard occupancies.
NATURAL HAZARD ASSESSMENTThe following natural hazards have been identified as risks to the Village of Downers Grove. These hazards have theability to create conditions that would strain the resources of the Downers Grove Fire Department.
1) SEVERE THUNDERSTORMThe Village of Downers Grove is located in Northeastern Illinois and is vulnerable to severe thunderstorms. While thishazard is most common in the spring and summer months, it can occur at almost any given time of the year depend-ing on climate conditions at the time. Severe thunderstorms usually bring high winds, lightning, flooding rains, and occa-sionally hail. Lightning strikes are common with severe thunderstorms and may cause structure fires, loss of electricityand other utilities, and even death. Loss of utilities may result in a delay of response if phone lines are damaged.
The Village of Downers Grove is vulnerable to the adverse effects severe thunderstorms may produce. The DownersGrove Fire Department has the capability of providing services for fire and medical emergencies caused by severeweather. If needed, resources are available from surrounding communities via mutual aid.
2) TORNADOThe Village of Downers Grove is potentially at risk for severe weather, including tornadoes. While this is a rare occur-rence, it is classified as a high consequence. Downers Grove has experienced tornadoes in the past but never any-thing severe in nature. The Downers Grove Fire Department has preplanned for an incident involving a tornado byadopting a mass-casualty incident plan. The plan involves the use of mutual aid ambulances and other resources toassist the Department. The Village of Downers Grove has an advantage other communities may not have in the closeproximity to Good Samaritan Hospital. Good Samaritan Hospital is a comprehensive medical center with a Level-1trauma center. Good Samaritan Hospital is located directly across from the Fire Department Headquarters.
The Downers Grove Fire Department has a mass casualty incident preplan that will be utilized in the event of a tor-nado. Medical assistance is available if needed from mutual aid departments.
3) FLOODThe Village of Downers Grove is at risk for severe weather that may include torrential rainfall and flooding. The stormwater management program in Downers Grove is adequate. Floods have occurred in the past and a serious risk asso-ciated with this hazard is the delay in response time caused by rerouting around closed or impassible streets.
The Village of Downers Grove is vulnerable to flooding. The Downers Grove Fire Department will proceed with nec-essary actions if the situation arises and will continue to provide fire and medical emergency services to the citizensof Downers Grove to the best of its ability.
4) DROUGHTThe Village of Downers Grove is vulnerable to drought conditions at any given time depending on climate patterns.The risk of this hazard is low to moderate. Downers Grove has a reliable and adequate water supply in Lake Michigan.The water is treated and sold by the City of Chicago and is transported via pipeline where it enters the village at var-ious connection points. There are currently six elevated storage tanks with a capacity of seven million gallons.
CFAI Downers Grove FD-F 10/16/03 5:28 PM Page 2

© 2 0 0 3 C O M M I S S I O N O N F I R E A C C R E D I T A T I O N I N T E R N A T I O N A L , I N C . A P P E N D I X F • 3
The Downers Grove Public Works Department oversees the water supply system for the Village of Downers Grove.There is a water conservation plan in the event of a serious threat to the water supply caused by drought condi-tions. It has been implemented in the past prior to the connection with the Lake Michigan water supply.
5) WINTER STORMThe Village of Downers Grove is located in an area known for harsh winters. Downers Grove is likely to experiencesevere winter weather conditions that may hamper firefighting efforts. Rapid snow accumulation may slow initialresponse time for fire and medical emergencies. Severe cold can make firefighting activities hazardous and thus putfirefighters in danger.
The Downers Grove Public Works Department has an effective and efficient snow removal and street maintenanceprogram when winter storms occur. Precautions are taken when icy conditions are present.
6) EARTHQUAKEThe Village of Downers Grove is located in a low-risk area for earthquakes. According to NFPA 13, 1999 ed., north-ern Illinois, including the Chicagoland area, is in the category 0 for seismic activity. The area could feel the effects ofa major earthquake should one occur in southern Illinois where the risk is much greater. The effects would be limit-ed, if any, should it occur.
The Downers Grove Fire Department is capable of handling a situation caused by the effects of an earthquake. Therisk of this hazard is extremely low and existing response plans will be utilized should an earthquake occur.
TECHNOLOGICAL/HUMAN HAZARD ASSESSMENTThe following manmade hazards were identified as potential risks to the citizens of Downers Grove. These hazardshave the ability to strain the resources of the Village should they occur.
1) HAZARDOUS MATERIALS – FIXED AND MOBILEThe Village of Downers Grove is vulnerable to incidents involving hazardous materials. With the amount of peopletraveling through the village, a truck transporting hazardous materials within the fire department’s jurisdiction is a dailyevent. There are facilities within the fire department’s response area that work with hazardous materials on a regularbasis. The risk for a hazardous materials incident is low to moderate with the consequence, should one occur, beingmoderate to high.
The Downers Fire Department has a specialty team that deals specifically with hazardous materials incidents. Ahazardous materials trailer is available to respond 24 hours a day, 7 days a week with trained hazardous materialstechnicians available at each of the four fire stations in the village.
2) UTILITY FAILUREThe Village of Downers Grove is vulnerable to a utility failure whether it be water, gas, phone or electricity. The riskfor this particular hazard is low to moderate with the consequence being moderate to high. A utility failure could affectthe response time of emergency services. The failures that have occurred in the past have lasted only a few hours;but the possibility of a longer incident is there.
There are programs in place and used by the Village of Downers Grove in the event of a utility failure. The villagehas six backup wells should a disruption in the water supply take place. The Village Operations Center has a powerbackup system to avoid a delay in dispatching of emergency services.
CFAI Downers Grove FD-F 10/16/03 5:28 PM Page 3

A P P E N D I X F • 4 © 2 0 0 3 C O M M I S S I O N O N F I R E A C C R E D I T A T I O N I N T E R N A T I O N A L , I N C .
3) STRUCTURE FIRES – CONFLAGRATIONThe Downers Grove Fire Department provides protection for nearly 14 square miles of commercial, industrial and res-idential structures. The fire department responds to an average of 40 structure fires per year. The risk of a structurefire is moderate while the consequence being moderate as well. The Village has few areas of building configuration,size and type that would create a conflagration situation.
The fire department has the resources to deal with the hazard of structure fires. Should a conflagration occur, fur-ther resources are available upon the implementation of the Mutual Aid Box Alarm System Box cards.
4) TRANSPORTATION: AIR, RAIL AND HIGHWAYAIRThe Village of Downers Grove is exposed to large aircraft flight patterns from Chicago-O’Hare and Midwayairports. The potential for a passenger or cargo plan to go down within the response area is a risk theDowners Grove Fire Department and surrounding area departments must deal with. The risk for this par-ticular hazard is low with the consequence being very high.
The Downers Grove Fire Department is a member of the Mutual Aid Box Alarm System (MABAS), whichhas a disaster response plan for incidents such as a plane crash. With the amount of residents in DownersGrove, the potential for a mass casualty incident should a plane go down is a reality.
RAILROADThe Burlington Northern-Santa Fe (BNSFRR) railway runs through an entire cross-section of Downers Grove.The BNSFRR is one of the busiest freight haulers in the country. Many freight trains and passenger or com-muter trains travel through Downers Grove within a 24-hour period. There are five separate railroad gradecrossings in the Village.
There is the potential for an incident involving either freight or commuter trains at any given time within theresponse area. There have been incidents in the past where vehicles and/or pedestrians have been struckby trains. There is also the potential for a derailment that would put many lives at risk with the amount ofresidential and commercial buildings located in close proximity to the tracks. There are presently three ofthe four fire stations located south of the tracks, which poses a problem with response times by vehiclesbeing held up by trains.
The Downers Grove Fire Department has a mass casualty plan for incidents that would include a train derail-ment. Mutual aid would likely be called upon for further resources that would be needed should an eventlike this take place.
HIGHWAYThe Downers Grove Fire Department provides service for two major Interstate toll ways within the bound-aries of the village. The toll ways are considered to be high-traffic “arteries” of the Chicago Metropolitan trans-portation system.
The fire department is capable of providing service to the toll ways on a contract basis. The risk to the com-munity should an event occur on one of the toll ways would be low.
CFAI Downers Grove FD-F 10/16/03 5:28 PM Page 4

© 2 0 0 3 C O M M I S S I O N O N F I R E A C C R E D I T A T I O N I N T E R N A T I O N A L , I N C . A P P E N D I X F • 5
5) PIPELINESThere are numerous pipelines carrying natural gas that run below the Village of Downers Grove. There have been inci-dents in the past where pipelines have ruptured and evacuations have taken place as the result of a natural gas leak.The risk of this particular hazard to the community is low with the consequence should it occur being moderate to high.
Depending on the size of the incident the department will respond with either a “still” or “full still” alarm response.The “still” alarm responds with one engine while the “full still” response has two engines, a truck and squad com-pany, an ambulance and a battalion chief.
SECURITY HAZARD ASSESSMENTThe following hazards have been identified as risks to the Village of Downers Grove. Although many of the hazardsidentified below have little or no chance of occurring, the Village of Downers Grove Fire and Police Departments areaware of these risks and will act accordingly should the situation take place. These hazards have the ability to strain theresources of the Village of Downers Grove.
1) CIVIL DISORDERThe Village of Downers Grove is a middle class suburb west of the City of Chicago. Current estimates indicate that thereare approximately 50,000 permanent residents. The daytime population swells to approximately 125,000 persons dueto the wide variety of commercial, industrial and residential occupancies. The risk of an event involving civil disorder inthe Village of Downers Grove is low with the consequence being very high.
Civil disorder would include riots, violent protests, and large outbreaks of vandalism and/or malicious behavior. Thisparticular hazard would be the responsibility of the Downers Grove Police Department. The Downers Grove FireDepartment will not have any involvement with crowd suppression. The fire department would be responsible for fireand emergency services should they be requested.
Traditional firefighting operations would be utilized if the resources were available. The activation of the Mutual AidBox Alarm System (MABAS) would be inevitable.
2) INCREASED READINESSThe Village of Downers Grove has in the past exercised increased readiness procedures. Village officials determinewhen a particular situation could pose a threat to the citizens of Downers Grove and will suggest extra resources beavailable should an incident occur. An example would be the extra police patrols and the staffing of the fire depart-ment’s reserve engine for the Y2K event preparation.
The Village of Downers Grove Community Events Department hosts the Heritage Festival on an annual basis. Thefestival draws thousands of people from surrounding communities. The village prepares for the festival by staffingextra police officers and fire personnel at the scene of the festival.
3) NUCLEAR ATTACKThe Village of Downers Grove is part of a major metropolitan where the possibility of a nuclear attack does exist but isnot probable. The risk of a nuclear attack is low with the consequence, should one occur, being very high. This haz-ard has the ability to strain the resources of the Village of Downers Grove in every aspect.
There is little the Downers Grove Fire Department could do in the event of a nuclear attack. The fire department maybe called upon to assist with the evacuation of residents or to assist with state or federal actions.
CFAI Downers Grove FD-F 10/16/03 5:28 PM Page 5

A P P E N D I X F • 6 © 2 0 0 3 C O M M I S S I O N O N F I R E A C C R E D I T A T I O N I N T E R N A T I O N A L , I N C .
4) TERRORISMThe bombing of the Murrah Federal Building in Oklahoma City demonstrated the acts of terrorism could occur any-where at anytime. The Village of Downers Grove is vulnerable to an act of terrorism. The risk of this particular hazardis low with the consequence, should one occur, being high.
The Downers Grove Fire Department and the Downers Grove Police Department will work together should an act ofterrorism occur. The fire department will be responsible for fire and medical emergencies along with search and res-cue operations should the situation exist. The police department will be responsible for any activities that involve bombdiffusion and/or evidence collection and suspect arrest.
Risk and Hazard AssessmentGRID #10
Overview:Fire grid #10 is the northernmost response grid of the Downers Grove Fire Department. Grid #10 is included in thestill district of Station 3. A variety of occupancies are located within the boundaries of grid #10. Industrial and manu-facturing companies, strip malls, restaurants and large mercantile buildings are representative of the structures found ingrid #10. Automatic sprinkler systems and early warning fire alarm systems protect the majority of occupancies locat-ed in the grid. The entire grid consists of commercial occupancies.
The Downers Grove Fire Department typically responds to medical emergencies and activated fire alarms in grid #10.The grid includes a portion of I-355, which since its construction nearly 10 years ago has seen a remarkable increasein traffic volume due to its accessibility from the northwestern, western and southwestern suburbs of Chicago.
Worst Fire Risk(s):A fire in the Home Depot home supply warehouse has the potential to become a large incident should it ever occur.The warehouse offers a variety of home and garden supplies including an indoor lumberyard. The building has highrack storage and is adequately protected by sprinklers. There are exposure hazards to the Home Depot. Adjacent tothe building to the west is a large pet supply store. There are limited hazards within the pet store. Should a fire occurat the Home Depot, the required fire flow would be 2,450 gallons per minute (gpm). If an automatic sprinkler systemwere not in use, the fire flow would be doubled. The Home Depot rated a 40.3 on the Occupancy VulnerabilityAssessment Profile (OVAP), the test used on the Risk Hazard and Value Evaluation (RHAVE) software. The OVAP scoreindicates that the Home Depot is classified as a key hazard due to the high fire load present in the indoor lumberyard.Flow test data of the primary hydrant at this location indicated that it would flow 2,770 gpm at 26 psi.
Route Fire Risk(s):A structure of noncombustible construction, occupied by a mercantile, industrial or commercial business. It is safe toassume that a fire occurring at one of these occupancies will be contained by an automatic sprinkler system. The aver-age OVAP score for the routine fire risk(s) in grid #10 is 34.2.
Non-Fire Risk(s):There are buildings located in grid #10 where processes utilizing hazardous materials are present. Processes utilizingcorrosives, flammable liquids and oxidizers are located along Centre Circle Drive in the gird. A fire at any one of theselocations could have the potential for creating an environmental concern and possible evacuation.
The potential for a significant hazardous materials incident involving either a cargo or tanker truck exists on Interstate355 as well as Butterfield and/or Finley Road.
CFAI Downers Grove FD-F 10/16/03 5:28 PM Page 6

© 2 0 0 3 C O M M I S S I O N O N F I R E A C C R E D I T A T I O N I N T E R N A T I O N A L , I N C . A P P E N D I X F • 7
The Downers Grove Fire Department responds to the grid regularly for emergency medical service incidents. Theprocesses that exist in the grid make the potential for a multiple-victim incident a reality for the Fire Department. Anincident involving a vehicle accident with multiple casualties can occur at any time.
Risk and Hazard AssessmentGRID #11
Overview:Fire grid #11 is located in the northwest corner of the Downers Grove Fire Department’s response area. Grid #11 islocated in the Station 3 still district. The area is bordered by Butterfield Road (IL Rt. 56) to the north and the Lisle-Woodridge Fire Protection District to the south and west. Grid #11 is a forest preserve maintained by Du Page County.There is little if any hazards located in the area.
Worst Fire Risk(s):The possibility of a wildland fire caused by either lightning strike or human negligence is a risk. This is considered to bea low risk because of the amount of fuel available compared to the amount of fire suppression resources in the area.
Route Fire Risk(s):The routine fire risk in grid #11 is a fire involving a vehicle or a small grass fire along Butterfield Road.
Non-Fire Risk(s):The potential for a significant hazardous materials incident involving either a cargo or tanker truck exists on Butterfield Road.
The Downers Grove Fire Department responds to the grid regularly for emergency medical service incidents. An inci-dent involving a vehicular accident with multiple casualties can occur at any time.
Risk and Hazard AssessmentGRID #12
Overview:Grid #12 is included in the still district of Station 3. This area in the Village of Downers Grove has developed rapidly inthe last ten years. Office complexes and a moderately large hotel are the primary structures within the grid. All struc-tures are constructed of noncombustible or fire-resistive materials and are protected with automatic sprinkler systemsand fire alarm systems. Vysis, located at 3100 Woodcreek Drive, is a laboratory that works with live Tuberculosis virus.The trained professionals employed there take extreme safety precautions and there are little if any problems fire serv-ice related, with the building. Commercial occupancies are the primary structures found in grid #12.
Worst Fire Risk(s):The Double Tree Guest Suites hotel is the greatest fire risk located in grid #12. The amount of people able to occupy thebuilding would warrant a mass casualty incident should a fire or other emergency occur. The building is constructed ofnoncombustible materials and is protected by an automatic sprinkler system and centrally wired fire alarm system. Shoulda fire occur at this location the fire flow required would be 2,875 gpm. The OVAP score for the hotel is 31.7 making it aroutine hazard classification. Flow test data of the primary hydrant demonstrates that it will flow 2,770 gpm at 26 psi.
CFAI Downers Grove FD-F 10/16/03 5:28 PM Page 7

A P P E N D I X F • 8 © 2 0 0 3 C O M M I S S I O N O N F I R E A C C R E D I T A T I O N I N T E R N A T I O N A L , I N C .
Routine Fire Risk(s):A fire occurring at any one of the commercial occupancies located in grid #12 would be contained by an automaticsprinkler system until the Fire Department arrived. The average OVAP score for the commercial occupancies located inthe grid is 23.6.
Non-Fire Risk(s):Emergency Medical Services may be requested at any time with the amount of people working in fire grid #12.
There is the remote risk of a hazardous materials incident occurring in fire grid #12.
The potential for a biological materials incident exists at the Vysis Corporation.
Risk and Hazard AssessmentGRID #13
Overview:The tallest building protected by the Downers Grove Fire Department is located in grid #13. The Esplanade Tower,2001 Butterfield Road, soars to nineteen stories and is the second tallest building in Du Page County behind theOakbrook Terrace Tower. Other notable high-rises within the grid are the 1901 Butterfield Road building, which standseleven stories high, and the Spiegel building located at 3500 Lacey Road. All of the high-rise structures were con-structed using noncombustible or fire-resistant materials and are protected by automatic sprinkler systems and fire alarmsystems. There are two hotels located in fire grid #13 along with numerous other single-story office complexes.
Worst Fire Risk(s):The Esplanade Tower poses the greatest risk to life safety should a worst-case fire scenario occur. The building is ade-quately protected by sprinklers and is primarily constructed of fire resistive materials. Should the sprinkler system failfor any reason, the Fire Department has a mass-casualty plan including the implementation of MABAS Box cards forextra resources. The Fire Department’s Tower Ladder is capable of reaching six to seven story tall buildings dependingon the accessibility for rescue operations. The Fire Department also has pre-plans covering high-rise firefighting opera-tions. The fire flow required for the Esplanade Tower is 3,875 gpm. It can be anticipated that an ordinary fire could becontained with one or two sprinkler heads opening. The OVAP score for the Esplanade Tower is 45.06, a key hazardclassification.
Routine Fire Risk(s):A small fire occurring at one of the other commercial occupancies located in the grid. The majority of the buildings locat-ed in the grid were constructed within the last ten years and therefore it can be assumed that a fire would be containedby the automatic sprinkler system until the Fire Department arrived. The average OVAP score for the commercial occu-pancies found in grid #13 is 37.4, which is a routine hazard classification but close to being classified as a key hazard.
Non-Fire Risk(s):The Downers Grove Fire Department may be called upon for emergency medical services at any one of the occupan-cies within grid #13. With I-355 running through the middle of the grid, vehicle accidents with multiple casualties area potential hazard.
CFAI Downers Grove FD-F 10/16/03 5:28 PM Page 8

© 2 0 0 3 C O M M I S S I O N O N F I R E A C C R E D I T A T I O N I N T E R N A T I O N A L , I N C . A P P E N D I X G • 1
APPENDIX GMODEL RESOLUTION
A RESOLUTION ADOPTING THE (Name of Agency) FIRE DEPARTMENT’S STANDARDS OF RESPONSE COVERAGE
Whereas, _________________________ has a mission statement, goals and objectives and value statements toguide the organization in providing fire and medical services to our community; and,
Whereas, the _________________________ Fire Department has a standard operating procedures, emergencyoperating procedures and operational guidelines that establish specific service level objectives for response to fires,emergency medical services incidents, hazardous materials and other non-emergency operations; and,
Whereas, _________________________ has applied for accreditation through the Commission on FireAccreditation International (CFAI); and,
Whereas, the developmental Standard of Response Coverage document is a critical element of the accreditationprocess; and,
Whereas, the _________________________ has developed the attached Standards of Response Coverage docu-ment which consolidate the _________________________ department’s service level objectives into a single docu-ment to guide its future planning and resource development.
Now therefore be it resolved, that the (Board) (Council) adopts the attached Standards of Response CoverageDocument, which define the______________________Fire Department’s written polices and procedures that established distribution and concentration of fixed and mobile resources for the fire agency. This resolution waspassed at the _________________________ meeting conducted on___________________________.
.Adopted this _____________________ day of ______________________at a meeting of the (Board) (Council).
Signature Block.(s)
Date

© 2 0 0 3 C O M M I S S I O N O N F I R E A C C R E D I T A T I O N I N T E R N A T I O N A L , I N C . B I B L I O G R A P H Y • 1
APPENDIXESBIBLIOGRAPHY
The following is a partial listing of deployment articles that have been produced over the years. Some may now beout of print, or no longer state of the art. They are included here for the reader to appreciate two things. First, muchof the foundation of this manual rests on prior work. Secondly, that for an industry that spends so much tax moneyin deployment, there has not been a lot of research on deployment and outcomes and in fact, we rely too much,on too few, aging studies.
Blum, Edward H. "Urban Fire Protection: Studies of the Operations of the New York City Fire Department." Rand Institute, January 1971
Booth, George W. "Relation of Fire Department Equipment and Personnel to Population." Fire Engineering magazine, December 11, 1929
City of Tacoma Fire Department, "Fire Apparatus Response Modeling." (no date)
Coleman, Ronny J. "Systems Approach to Staffing and Manning." Fire Chief magazine, August 1985
Dallas Fire Department Staffing Level Study. McManis Associates, June 1984
Dessent, Geoff. "The Development and Use of the Home Office Fire Cover Computer Model." Home Office Science and Technology Group, London
Dormont, Peter, Hausner, Jack, Walker, Warren E. Fire House Site Evaluation Model: Users Manual. Department of Housing and Urban Development, Rand Institute, June 1975
Establishing the Cost of Services. MIS Report, Volume 22/Number 5, May 1990
Fire Management Review. International City/County Management Association, Summer 1978
Freeman, Michael. "Staffing Study Impact." Fire Command magazine, June 1985
Getz, Malcolm. Issues in Urban Fire Service Delivery. Vanderbilt University, Nashville, Tennessee, January 8, 1975
Gribbin, Peter. "A Review of Fire Cover System Needed So Supply Can Be Aimed at Demand, Fire Magazine, March 1991
Haurum, Gunnar. "Standards of Fire Cover." Fire Safety Journal, Number 8. 1984/85: pages 239-245
Hubble, Michael W., Richards, Michael E. "Forecasting Service Demand in Your Fire Department." Fire Chief magazine, August 1991
Hughes, Heiss & Associates. "Fire Service Response Planning Factors." City of Redmond Washington, October 14, 1991.

B I B L I O G R A P H Y • 2 © 2 0 0 3 C O M M I S S I O N O N F I R E A C C R E D I T A T I O N I N T E R N A T I O N A L , I N C .
Karter, Michael J. Jr. "U.S. Fire Department Profile Through 1989." National Fire Protection Association, December 1990.
Kimball, Warren Y. "Working Schedules of Fire Departments." NFPA Firemen magazine, December 1959, January and February, 1960
Kimball, Warren Y. "Manning for Fire Attack." National Fire Protection Association, Boston, Mass., FSD-6, 1969
Kolesar, Peter, Blum, Edward H. "Square Root Laws for Fire Company Travel Distances." Rand Institute, June 1975
Kolesar, Peter. "A Model for Predicting Average Fire Company Travel Distances." Rand Institute, June 1975
Manpower Staffing Standards System, (U.S. Army) HQDA DCSPER. Washington, D.C. December, 1982
Moeller, Bruce. "Benchmark Challenge." Fire Chief magazine, August 2002
Municipal Fire Service Workbook. National Science Foundation, RANN, Division of Advanced Productivity Research and Technology, Superintendent of Documents. Washington D.C., Stock Number 038-000-00330-5
NAVMAT Instructions 11320.15 Structural Fire Fighting Requirements for the Protection of Naval Shore Installations. 27 June, 1983
O'Hagan, John T. "Staffing Levels, A Major new study, Part 1." Fire Command magazine. November 1984
O'Hagan, John T. "Staffing Levels, A Major new study, Part 2." Fire Command magazine. December 1984
O'Hagan, John T. "Staffing Levels, A Major new study, Part 3." Fire Command magazine. January 1985
O'Hagan, John T. "Staffing Levels, A Major new study, Part 4." Fire Command magazine. February 1985
O'Hagan, John T. "Staffing Levels, A Major new study, Part 5." Fire Command magazine. March 1985
O'Hagan, John T. "Staffing Levels, A Major new study, Part 6." Fire Command magazine. May 1985
Pickett, J. Optimal Quantity of Fire Department Services. University of Missouri, Columbia. PHD Dissertation, 1970
"Performance Auditing for Local Government." MIS Report, Volume 21/ Number 1, ICMA. Washington, D.C.
Police and Fire Work Scheduling. ICMA Bulletin, Volume 47, Number 12, December 1985
Program to Develop Fire Defense Planning and Design Criteria. Public Technology, Inc., Washington D.C., March 1974
Report of the Joint Committee on Standards of Fire Cover. London Home Office, Central Fire Brigades Councils for England, Wales and Scotland, 1985
Rider, Kenneth Lloyd. "A Parametric Model for the Allocation of Fire Companies." Rand Institute, April 1975
Rider, Kenneth Lloyd. "A Parametric Model for the Allocation of Fire Companies: Executive Summary." Rand Institute, August 1975

© 2 0 0 3 C O M M I S S I O N O N F I R E A C C R E D I T A T I O N I N T E R N A T I O N A L , I N C . B I B L I O G R A P H Y • 3
Rider, Kenneth Lloyd. "A Parametric Model for the Allocation of Fire Companies: Users Manual." Rand Institute, August 1975
Schaaf, J. van der, Wiekems, B.J. "The Relationship Between the Attendance (Response) Time and the Fire Spread."Dutch Home office, SAVE Consulting Scientists
"Study of Fire Department Needs for Fire Stations and Companies and Utilization of Manpower for City and County of San Francisco." Gage-Babcock and Associates, Report #7004, November 1969
Swersey, A. J., Ignall, E.J., Corman, H., et. al. "Fire Protection and Local Government: an Evaluation of Policy Related Research." RAND Institute, September 1975
"The Case for Better Utilization of Fire Manpower." City of San Diego, June 1, 1961
Vonada, Michael. "How Municipalities in California Determine Their Level of Service: Fire Protection." Master Thesis, California State University—Hayward, June 1991
Walker, Warren E. "Fire House Site Evaluation Model: Executive Summary." Department of Housing and Urban Development, Rand Institute, June 1975
Will, Robert, Erwin, Scalar. "Economies and Urban Service Requirements: A Method for Determining the Economies of Scale Associated with Municipal Services, When Offered at Required, Standard Levels, with an Empirical Application to the Fire Protection Services." Yale University PHD dissertation, 1965
Yahr, Harold Theodore. "Aspects of Organizational Structure and Organizational Efficiency: A Study of Municipal Fire Departments." New York University PHD dissertation, 1965
References — WildlandThe following references are the basis for the hazard components and the methodology outlined in the WildlandHazard Assessment Process. These publications give details on a variety of hazard-rating systems and may beused as additional information.
Babrauskas, Vyteris. Council, Hugh. "Performance-Based Fire Safety Engineering Design and its Effects on Fire Safety." Unpublished Study
Babrauskas, V. "Fire Performance of Materials: Appropriate Selection through the Use of Modem Reaction to Fire Test Methods." presented at Brannvemkonferansen '94, Trondheim, Norway, 1994
Babrauskas, V. "Fire Modeling Tools for Fire Safety Engineering: Are They Good Enough?" Fire Protection Engineering 8, 87-95, 1996
Bukowski, Richard, W. Babrauskas, Vyteris. "Developing Rational Performance-Based Fire Safety Requirements in Model Building Codes." Unpublished Study
Bukowski, Richard W, P.E. "What Every Chief Should Know About Performance-Based Codes." Fire Chief magazine, December 1996

B I B L I O G R A P H Y • 4 © 2 0 0 3 C O M M I S S I O N O N F I R E A C C R E D I T A T I O N I N T E R N A T I O N A L , I N C .
Butler, C. P. "The Urban/Wildland Fire Interface in Western States Section/Combustion Institute Papers."Vol. 74, No. 15, 1974
Butler, C.P. "The Urban/Wildland Fire Interface, Fire Prevention Notes." Officer of the Director, California Department of Forestry and Fire Protection, September 1976
Bukowski R. W. and Tanaka, T. "Towards the Goal of a Performance Fire Code." Fire and Materials 15, 175-180, 1991
Slaughter, Rodney. California’s I-Zone—Wildland/Urban Fire Prevention and Mitigation. Office of the State FireMarshal, 1996. This book was funded by a hazard mitigation grant from the Federal Emergency ManagementAgency and involved several agencies. It is a reference manual that addresses: model codes; hazard zoningand enforcement; building standards and technology; domestic and wildland fuels; and community programs.It is available from CFESTES Bookstore, 7171 Bowling Drive, Sacramento, Calif. 95823-2034.
California Fire Plan: A Framework for Minimizing Costs and Losses from Wildland Fires. California State Board ofForestry, 1996. This document gives a detailed framework for evaluating and prioritizing wildfire hazards includingstructures, watersheds, timber, range land, air quality, recreation potential, sensitive habitats and cultural resources.It includes a process for developing assessments that involve multiple jurisdictions and interested parties.
Clarke, F, B., Bukowski, R. W., Stiefel, S. W., Hall J. R. and Steele, S.A. "The National Fire Risk Assessment ResearchProject Final Report." Available from the National Fire Protection Research Foundation, Quincy, Mass., 1990
Cohen, Jack D, Butler, Bret. "Modeling Potential Structure Ignitions Form Flame Radiation Exposure with Implications forWildland/Urban Interface Fire Management." 13th Fire and Forest Meteorology Conference, Lorne, Australia, 1996
Colorado Wildland Interface Pre-Plan Initiative. Colorado State Forest Service (CSFS), 1997. This system is taughtthrough classroom and field sessions. It provides a simple method to rate homes within the wildland/urbaninterface on their ability to withstand wildfire. This system uses the Wildland Home Fire Risk Meter, a ratingsheet developed jointly by CSFS and the Fire Protection Districts and the Fire Hazard Severity Form as shownin the 1997 Urban/Wildland Interface Code.
Conceptual Community Vegetation Management Plan, Prescott, Ariz.
Howard, Ronald A., et al. "Decision Analysis of Fire Protection, Strategy for the Santa Monica Mountains: An InitialAssessment." Stanford Research Institute, Menlo Park, Calif., October 1973
Development Strategies in the Wildland/Urban Interface. International Association of Fire Chiefs and Western FireChiefs Association, 1996. This handbook was designed to be an educational tool for the fire service and aca-demic and development professionals protecting or developing wildland or forested areas. It provides strate-gies for land-use decisions, risk assessment, vegetation management, public education and fire operations.
Everyone’s Responsibility: Fire Protection in Wildland/Urban Interface. NFPA, 1994. This is a combination video-tape/book program discussing how three communities dealt with the interface problem, each using differentmethods but all focusing on cooperation and improved safety. The Virginia Forestry’s Woodland Home FireHazard Rating Form is included.
Fire Department Planning for Operations in Wildland/Urban Interface Fires, Georgia Forestry Commission

© 2 0 0 3 C O M M I S S I O N O N F I R E A C C R E D I T A T I O N I N T E R N A T I O N A L , I N C . B I B L I O G R A P H Y • 5
Fire Risk Rating for Existing and Planned Wildland Residential Interface Development. Montana Department ofNatural Resources and Conservation, Missoula, Mont., March 1993. This rating system allows prevention plan-ners to assess interface areas for risks and hazards, rank them according to their risk score, and then set prioritiesfor prevention resources and actions. It organizes physical site information—such as road access, topography,fuels, construction and water sources—so that the fire managers can easily review all the information at once.
"Fire Safe Guides for Residential Development in California." California Department of Forestry and Fire Protection,P.O. Box 94244, Sacramento, CA 94244-2460, 1980.
Foote, Ethan I. D., Cole, Dana. "Making a Case for the Interface, in Hazard Mitigation at the Interface." Fire Chief, October 1993
Foote, Ethan, I. "The Defensible Space Factor Study; a Survey Instrument for Post-Fire Structure Loss Analysis."Proceedings, 11th Conference on Fire and Forest Meteorology, Society of Amercian Foresters, Bethesda Md.
Fire Safety Considerations for Residential Development in Forested Areas—A Guide for Fire Agencies, PlanningBoards and Subdivision or Housing Developers. New Hampshire Rural Fire Protection Task Force. February,1997. This guide lists minimum fire safety considerations for woodland development, guidelines for a samplesubdivision rating and a wildfire hazard rating form for subdivisions.
Glossary of Wildland Fire Management Terms Used in the United States, Society of American Foresters. 5400Grosvenor Lane, Washington, D.C. 20014, 1990
ICC Building Performance Code Draft, Intl. Code Council, Inc., Falls Church Va. August 1998
IFCI Urban/Wildland Interface Code. International Fire Code Institute, 1996. This wildland interface code providesspecifications for water supplies, defensible space and access in wildland interface areas. It includes a table torate the severity of the hazard based on vegetation, slope, fire and weather frequency, and fuel models.
Incline Village/Crystal Bay Defensible Space Handbooks: A Volunteer’s Guide to Reducing the Wildfire Threat.University of Nevada Cooperative Extension Service, 1991. This handbook, designed as a reference guide forneighborhood leaders, provides guidance in understanding the threat of wildfire, implementing defensiblespace and developing the role of leadership in neighborhood efforts.
NFPA 299: Protection of Life and Property from Wildfire. National Fire Protection Association, 1997. This document,developed by the NFPA Forest and Rural Fire Protection Committee, provides criteria for fire agencies, land useplanners, architects, developers and local governments to use in the development of areas that may be threat-ened by wildfire.
North Whitefish Fire Risk Ration GIS Project. Fire and Aviation Management Office, Montana Department of NaturalResources and Conservation, Missoula, Mont., 1995. This project applies geographic information systems (GIS)to Montana’s Fire Risk Rating System (FRA). Twenty-eight key variables are assigned a weighted score and thescores are added to achieve a composite score. This publication is useful for agencies wishing to automate allor part of an existing fire hazard rating system.
Ordinance Amending the County Fire Code; Wildland/Urban Interface Standards, County of San Diego, December 1999

B I B L I O G R A P H Y • 6 © 2 0 0 3 C O M M I S S I O N O N F I R E A C C R E D I T A T I O N I N T E R N A T I O N A L , I N C .
Protecting Life and Property from Wildfire: An Introduction to Designing Zoning and Building Standards for LocalOfficials. Great Lakes Forest Fire Compact. This document focuses on planning needs and considerations forassessing the urban interface and includes recommendations for firewise landscapes, access, water suppliesand structural design. The appendix provides ideas for risk assessment and a sample risk rating system for asubdivision or development.
Moore, Howard E. "Protecting Residences from Wildfires: A Guide for Homeowners, Lawmakers and Planners."General Technical Report PSW-50, United States Department of Agriculture, Forest Service, Pacific SouthwestForest and Range Experiment Station, 1960 Addison St., Berkeley, Calif. 94704.
Ramachandran, G. "Probability-Based Building Design for Fire Safety: Part 1." Fire Technology, Third Quarter 1995,National fire Protection Association, Quincy, Mass.
Ramachandran, G. "Probability-Based Building Design for Fire Safety: Part 2." Fire Technology, Fourth Quarter 1995,National fire Protection Association, Quincy, Mass.
Ramsay, Dr. G. Caird. "Building Survival in Bushfires." Fire Science 86, 4th Australian National Biennial Conference,21-24 October
"Regulatory Reform and Fire Safety Design in the United States. Project Report on the second Conference on fireSafety Design in the 21st Century." Society of Fire Protection Engineers, Worcester, Mass.
SFPE Engineering Guide to Performance-Based Fire Protection Analysis and Design, the Draft for Comments. SFPE,Bethesda, Md., 1998
Takeyoshi Tanaka. "The Concept of a Performance-Based Design Method for Building Fire Safety." Proceedings ofthe I Ith UJNR Panel on Fire Research and Safety, San Francisco, Calif., 1989
Thomas, R., and Bowen, R. "Objective-Based Codes: The Canadian Direction." pp. 1-1 I in Proc. 1996 Intl. Conf. onPerformance-Based Codes and Fire Safety Design Methods, Society of Fire Protection Engineers, Boston, 1997
Uniform Building Code Standard 7-1, Fire Tests of Building Construction and Materials
White, R. "Analytical Methods for Determining Fire Resistance of Timber Members." The SFPE Handbook of FireProtection Engineering. National Fire Protection Association, Quincy, Mass., 1995.
"Wildland/Urban Interface Fire Protection: A National Problem with Local Solutions." August 1988, National FireAcademy, Federal Emergency Management Agency, Washington, D.C.
"Wildland Fire Protection Analysis." Georgia Forestry Commission, Box 819, Macon, Ga.
Williamson, Robert, Brady. "Advances in Assessment Methods for Fire Safety." Fire Safety Journal, 20, 1993