Embed Size (px)
Citation preview

Dr Teresa Anderson
Chief Executive
October 2014
Creating an Innovative and Sustainable Healthcare Model
Context
Increasing demand for health care services due to:
– ageing populations
– the increased burden of chronic disease
– continued advances in medical technology (including the rapid expansion of
information systems)
– ever growing community expectations
Health care expenditure of most health systems is growing at a rate greater than
GDP (OECD 2008).
Most countries appear to be grappling with how they can create an innovative and
sustainable health system for the future.

Context
Today’s presentation provides:
An overview of reform occurring within the Australian and New South Wales (NSW)
Public Healthcare Systems, which includes devolution to Local Health Districts, a
smaller and more focused Ministry of Health, increased transparency and funding
reform
An overview of SLHD
Challenges facing health services
What we are doing to address these challenges
Examples of innovations and new models of care

Australian Health Care System
• A mix of public and private sector health services
• A range of funding and regulatory mechanisms. Almost
70% of the total health expenditure in Australia is
funded by government
• Financed through a combination of income tax, a
specific income levy (the Medicare Levy) and private
financing by individuals through private health insurance
(PHI) premiums and out of pocket payments
• 1,340 hospitals, 752 public hospitals accounting for 68%
of hospital beds (57,772) and 588 private hospitals
accounting for about 32% of beds (28,000 private
hospital beds) (2009–10 data)
National Hospital Reform
• National Health and Hospital Agreement (2011)
• National Health and Hospitals Network
• National introduction of Activity Based Funding from 1 July 2012
• National Independent Pricing Authority
- National Efficient Price
- Value for money
- National comparability
- Transparency
- Efficiency
• National Health Performance Authority
• Patient Controlled Electronic Health Record

Health and Hospital Reform
The reforms aimed at achieving:
• better access to services
• improved local accountability and
transparency
• increased clinician engagement
• greater responsiveness to local
communities
• a stronger financial basis for the health
system into the future through
increased Commonwealth funding
• effective and accessible ICT to support
the provision of high quality health
services

Reform of the NSW Health System
• One of the largest, most complex and
significant reforms that has occurred in
the last 25 years in any jurisdiction in
Australia.
• First state to transition to local health
networks
• Transition from large area health
services to smaller Local Health
Networks (now Districts), initially with
Governing Councils (now Boards)
• Governance Review
Major themes of Governance Review
1. Devolution of authority and responsibility to the Local Health Districts
2. Changed role and structure for the Ministry of Health
3. Increased clinical leadership, engagement and support
4. Investment in our people
5. Greater transparency and utility of health information
6. Realising the potential of statewide (shared) services
7. Recognising eHealth as the way of the future

Areas to Districts

Sydney Local Health District
• Established on 1 January 2011
• Located in the centre and inner west of Sydney
• A well-established reputation for excellence in the provision of healthcare services
and for managerial and fiscal responsibility
• Strong and well recognised leadership roles in research and education
• Delivers quaternary, tertiary, acute, primary care and health improvement services,
many of which are recognised internationally and nationally
• Our services are highly complex and many are resource intensive
• Responsible for providing health care to more than 580,000 people
• Characterised by socio-economic diversity, with pockets of both extreme
advantage and extreme disadvantage
Sydney Local Health District
SLHD provides health services 24 hours a day, 7 days per week, 365 days per
year
A long history of providing tertiary and quaternary healthcare services to
patients from other parts of NSW, including the provision of telemedicine and
outreach clinics to rural areas
Over 25% of our inpatient activity is for patients residing in other Sydney LHDs,
8% for NSW patients residing outside Sydney and 3% for interstate and
overseas patients
Each of our hospitals and services are unique with different areas of expertise
and networked to ensure that our patients have access to the services they
need
Our clinicians, support staff and managers are constantly planning and
implementing improvements to achieve our vision of excellence in health care
for all


A typical day
Every day SLHD on average:
• Treats over 5,500 outpatients.
• Provides over 400 case weighted separations in our Eds.
• Receives over 110 ambulances.
• Provides 453 inpatient case weighted separations.
• Has over 1620 patients in its beds.
• Performs more than 140 operations.
• Delivers around 20 babies at Royal Prince Alfred and Canterbury.
• Spends around $3.79 million on health care including:
• $2.37 million on our staff (SLHD has 10,000 employees)
• $1.15 million on goods and services
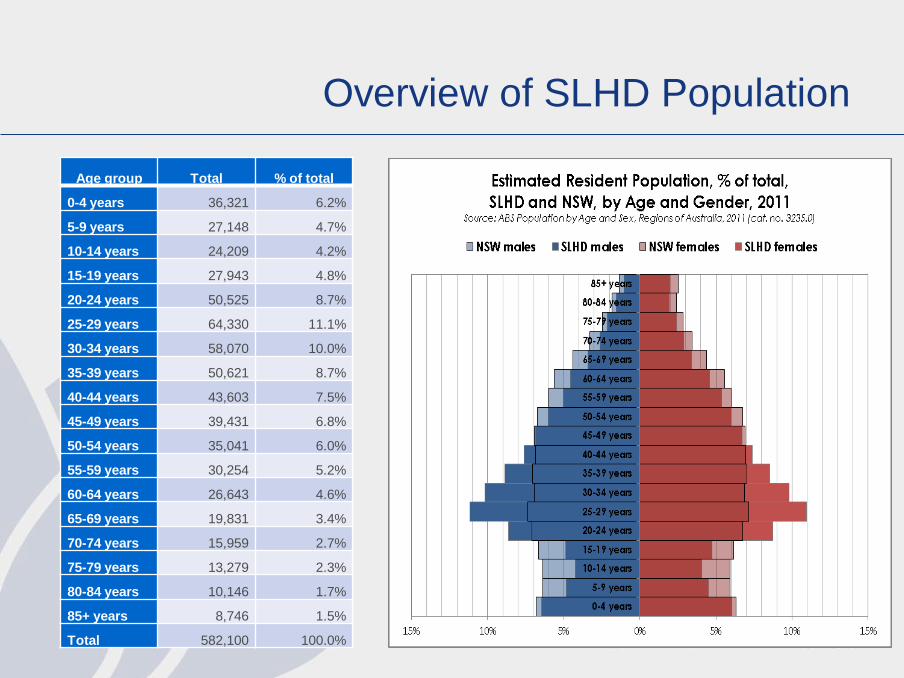
Overview of SLHD Population
Age group Total % of total
0-4 years 36,321 6.2%
5-9 years 27,148 4.7%
10-14 years 24,209 4.2%
15-19 years 27,943 4.8%
20-24 years 50,525 8.7%
25-29 years 64,330 11.1%
30-34 years 58,070 10.0%
35-39 years 50,621 8.7%
40-44 years 43,603 7.5%
45-49 years 39,431 6.8%
50-54 years 35,041 6.0%
55-59 years 30,254 5.2%
60-64 years 26,643 4.6%
65-69 years 19,831 3.4%
70-74 years 15,959 2.7%
75-79 years 13,279 2.3%
80-84 years 10,146 1.7%
85+ years 8,746 1.5%
Total 582,100 100.0%
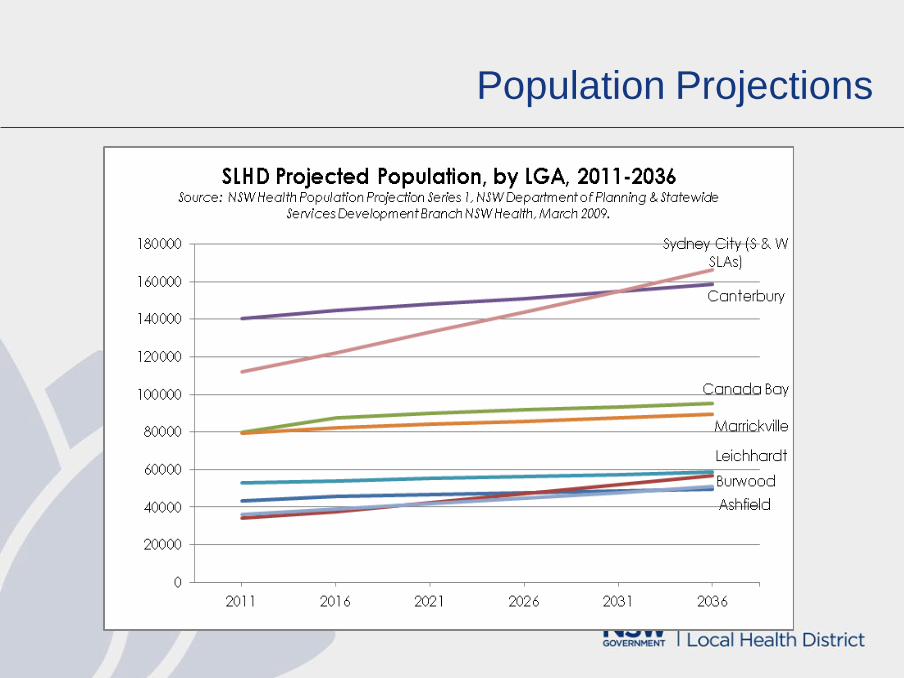
Population Projections

New Dwellings
The SLHD catchment encompassed
– 17.5% and 18.5% of all new dwelling constructions in the Sydney region in 2011 and 2012 respectively
– 24% of all new dwelling approvals in the year ending 2012
– In 2012, Green Square (895 new homes) and Rhodes (816 new homes) topped the list of growth locations across the Sydney region
City of Sydney LEP plans for an additional 50,000 new homes (including Glebe Affordable Housing Project) and 52,000 jobs
Canada Bay Council over 10,000 dwellings
Burwood Council over 5,000 additional dwellings
Strathfield Council 4,110 homes
Marrickville Council over 4,000 new homes and 1,100 new jobs
Ashfield Council over 2000 dwellings and 1,400 jobs
Continued development in Green Square and Rhodes; urban consolidation along the Parramatta Road corridor, Breakfast Point, Burwood, Strathfield/Homebush, Redfern/Waterloo, the former Carlton United Brewery site in Broadway and the Harold Park Raceway site in Glebe.

Housing
Ash
fie
ld
Bu
rwo
od
Ca
na
da
Ba
y
Ca
nte
rbu
ry
Le
ich
ha
rdt
Ma
rric
kville
Str
ath
fie
ld
Syd
ne
y*
SL
HD
NS
W
Dwellings owned 56.5% 59.7% 64.1% 59.3% 57.3% 54.2% 59.9% 38.5% 54.6% 66.5%
Dwellings rented 40.1% 36.6% 33.1% 36.5% 40.6% 43.0% 36.5% 58.7% 42.2% 30.1%
Dwellings rented from Housing
NSW
1.5% 2.9% 2.6% 5.8% 4.3% 2.9% 4.0% 11.6% 5.4% 4.4%
Homelessness
• 3,307 homeless people in City of Sydney
• 1,430 homeless people in Strathfield-Burwood-Ashfield
• 910 in Marrickville-Sydenham-Petersham
• 663 in Canterbury
• 319 in Leichhardt
• 171 in Canada Bay

Index of Social Disadvantage

A diverse population
Aboriginal people
Cadigal and Wangal people of the Eora nation
4,875 either Aboriginal or Torres Strait Islander
24% of the Aboriginal population is aged under 15 years and less than 1% is
aged over 65 years
CALD communities
43% of residents speak a language other than English at home
7.7% of the population speak little or no English
Mandarin (28,712 people), Arabic (26,665 people), Greek (24,654 people)
and Cantonese (22,881 people)
34.1% of the SLHD population born in non-English speaking countries, with
20.8% of this grouping residing in Australia for less than five years.

Selected Health and Lifestyle Facts
Estimated 106,960 people with a disability live in SLHD, of whom 23,264 people
require assistance with core activities of daily living
44,960 SLHD people identified themselves unpaid carers
14.9% of SLHD residents aged over 16 smoke
23.9% of SLHD residents aged over 16 years consume more than two standard
drinks a day. Higher than state rate of alcohol-related hospitalisations
46.7% of people in SLHD are overweight or obese
Vaccination rates within the SLHD are low
9.8% of people in SLHD considered themselves to have high or very high
psychological distress,
81.3% of SLHD residents over 16 consider themselves to have excellent, very
good or good health
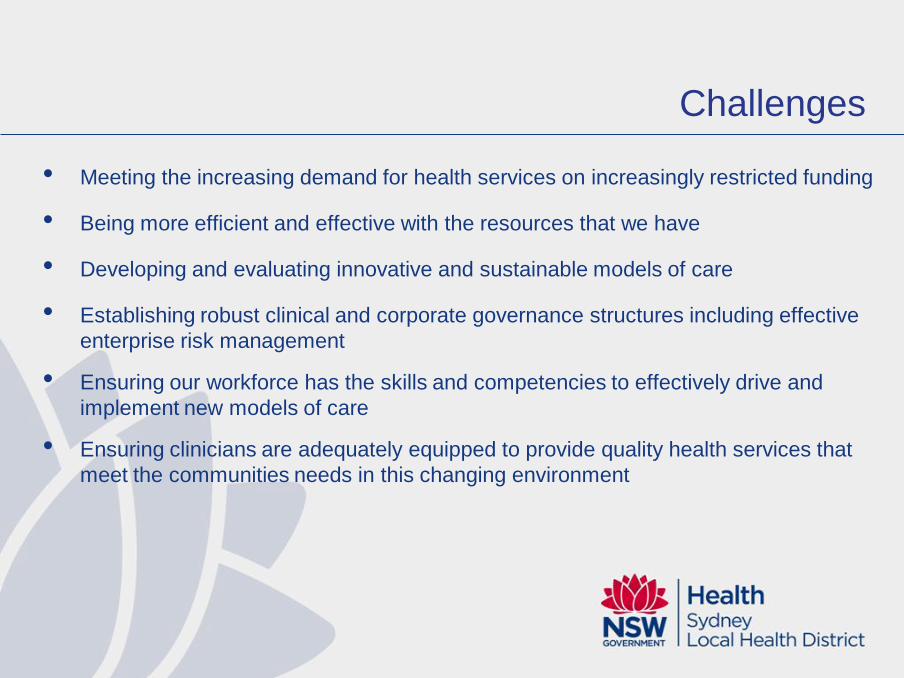
Challenges
• Meeting the increasing demand for health services on increasingly restricted funding
• Being more efficient and effective with the resources that we have
• Developing and evaluating innovative and sustainable models of care
• Establishing robust clinical and corporate governance structures including effective
enterprise risk management
• Ensuring our workforce has the skills and competencies to effectively drive and
implement new models of care
• Ensuring clinicians are adequately equipped to provide quality health services that
meet the communities needs in this changing environment

Challenges
• Establishing effective relationships with a multitude of stakeholders including the
community, the Ministry, central agencies, NGOs and private organisations
• Ensuring that senior executives and managers are adequately equipped and have
the competencies to effectively manage and lead these new organisations
• Ensuring robust and transparent reporting, analytics and decision support tools
• Facilitating increased clinician and community input into decision making and
strategic planning
• Adapting to new technology and genetics - genomics
• Getting the balance right between prevention, acute care and chronic disease
management

Our Focus To keep the patient, their family
and carer(s) at the centre of the
care we provide and to ensure
their emotional support, their
physical comfort and the
coordination and delivery of their
care is of the highest possible
standard.
What are we doing?
Our Vision Excellence in healthcare for all

What are we doing?
Ambulatory Care and Hospital Alternatives
Increasing investment in integrated care in the community – hospital in the home,
Sydney District Nursing, community mental health
Increasing investment in Ambulatory Care/Work with medicare local (GPs and
other primary care providers)
Health Pathways (60 pathways in 2013/14) – data system linking with GPs and
other primary care providers

What are we doing?
Increasing Hospital Efficiency
- using data analytics (QLIKview/STARS)
Systematically addressing Clinical Variation
Continuing to improve hospital efficiency e.g. NEAT /Whole of system programs
Ensuring clinical quality and safety standards are of the very highest
Supporting technology and data and eMR interconnectivity
Supporting upgrades in Imaging/Diagnostics – ensuring all equipment can
interface with the eMR – ECG carts; haemodynamic equipment

What are we doing?
Planning and Strategy Development with other government and
nongovernment agencies
– Child Health and Youth Health Inter-sectoral Plans
– Homelessness Strategy
– Whole of District Health Improvement Plan
– Community and Private Health Partnerships
– Lifehouse
– Charles Perkins/USydney
Underpinning this is the need for ICT connectivity with other organisations
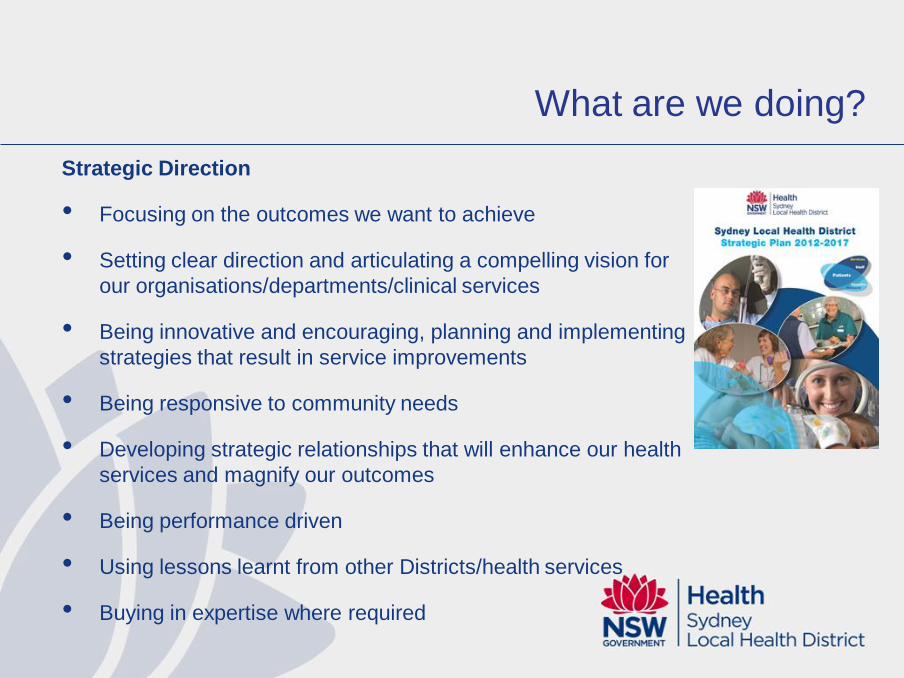
What are we doing?
Strategic Direction
• Focusing on the outcomes we want to achieve
• Setting clear direction and articulating a compelling vision for
our organisations/departments/clinical services
• Being innovative and encouraging, planning and implementing
strategies that result in service improvements
• Being responsive to community needs
• Developing strategic relationships that will enhance our health
services and magnify our outcomes
• Being performance driven
• Using lessons learnt from other Districts/health services
• Buying in expertise where required
What are we doing?
Organisational capabilities
• Building and maintaining an effective and dynamic team
• Effectively managing our relationships – internally and externally
• Promoting effective information and communication management
• Being credible with clinicians and managers- listening and using evidence
• Creating a culture of enquiry and enthusiasm
• Developing a learning organisation
• Managing organisational change and ensure business and clinical continuity

What are we doing?
Organisational effectiveness
• Developing corporate and clinical governance structures that support the effective
operation of our Districts and their services
• Developing and utilising sound business judgement and effective business skills-
ensuring our staff know how to write compelling business cases
• Developing robust enterprise risk management systems and processes

What are we doing?
Financial performance
• Ensuring all staff understand their and their District’s budgets!
• Managing finances and having appropriate financial controls (come in on budget!)
• Ensuring we have the capacity to adapt to new funding regimes
• Effectively managing and being responsible for resources
• Developing new and more efficient models of care
• Analysing and monitoring trends
• Enhancing our financial literacy and quantitative problem solving skills
• Engaging clinicians and other team members in financial management
• Reducing clinical variation

What are we doing?
Effective relationships with internal and external stakeholders
• Developing effective relationships with the community, patients and their families
and the public (and the media)
• Supporting the skill and knowledge development of our clients, team members,
partner organisations
• Developing and maintaining effective partnerships within the District, MoH, Pillars
and other Districts
• Developing strategic partnerships with other organisations including Private Allied
Health, Specialists, Medicare Locals, NGOs, other human services and private
companies
• Developing effective governance arrangements with partner organisations for shared
projects eg FACS
• Developing best practice contract management

What are we doing?
Best Practice
• Evaluating what we do – have our new models of care delivered us the
benefits that we anticipated
• Developing effective measures and monitor outcomes of our services/
programs
• Participating in and supporting research on our services and practices
• Participating in and supporting research on new models of care

What are we doing?
• Investment in Research and Education
• Sydney Research Hub
• Collaborative establishment of the Charles Perkins Clinical Research Facility
• New Mental Health and Lifehouse Research roles
• Institute for Academic Surgery
• Sydney Health Care Partners
Investment in Innovation and new models of care
– Performance Monitoring Systems, Improvement and Innovation Unit
– Investment in analytics- STARS
– Innovations Steering Committee
– Innovation Symposium
– The Pitch

The Pitch video
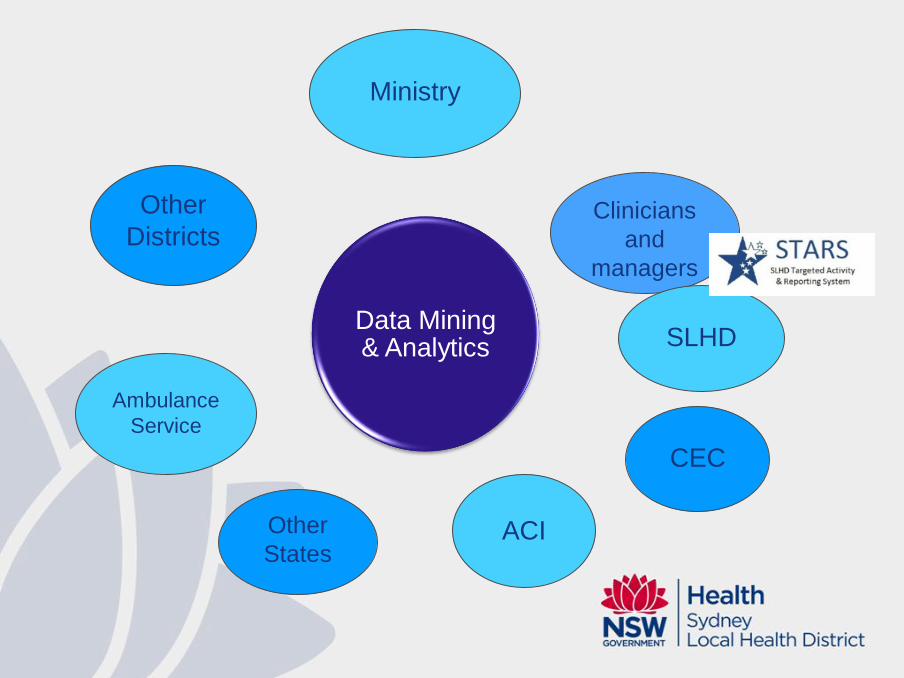
Clinicians
and
managers
Ministry
SLHD
CEC
ACI
Data Mining & Analytics
Other
States
Ambulance
Service
Other
Districts


The holy grail: access to timely, accurate data
Limitations of Current System
Labour intensive
Limited data able to be reviewed
Unable to respond to different needs of different departments
No real time access to data
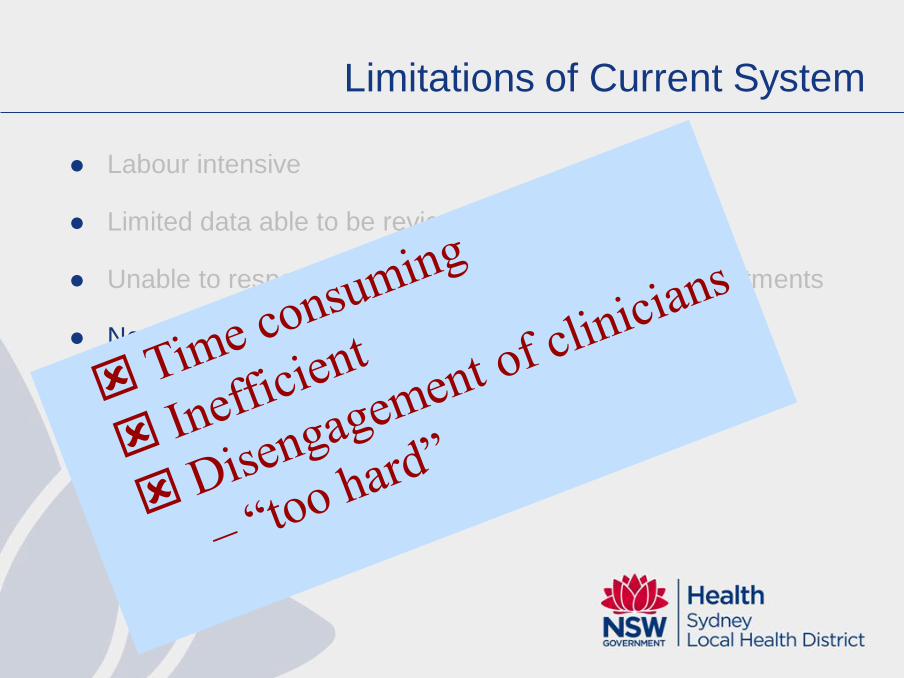
Limitations of Current System
Labour intensive
Limited data able to be reviewed
Unable to respond to different needs of different departments
No real time access to data

Why STARS?
We can’t manage what we can’t analyse/monitor
Managing processes in real time
Efficient insight into data
Combines and manages multiple sources of data

Data Source Collections
Incidents related to:
•Falls
•Medication
•Pressure Ulcers
Data Collections:
•Non Admitted Patient Data
Data Collections:
•Admitted Patient Data
•Emergency Department Feeder Systems:
•Pathology
•Imaging
•Pharmacy
•Prosthesis
•Blood
•Operating Theatre
Data Extracts:
•Overdue Patients (Weekly)
•Financial Class (3 times a Day)
•NEAT (Daily)
•Orders and Results
Standalone Clinical
Databases

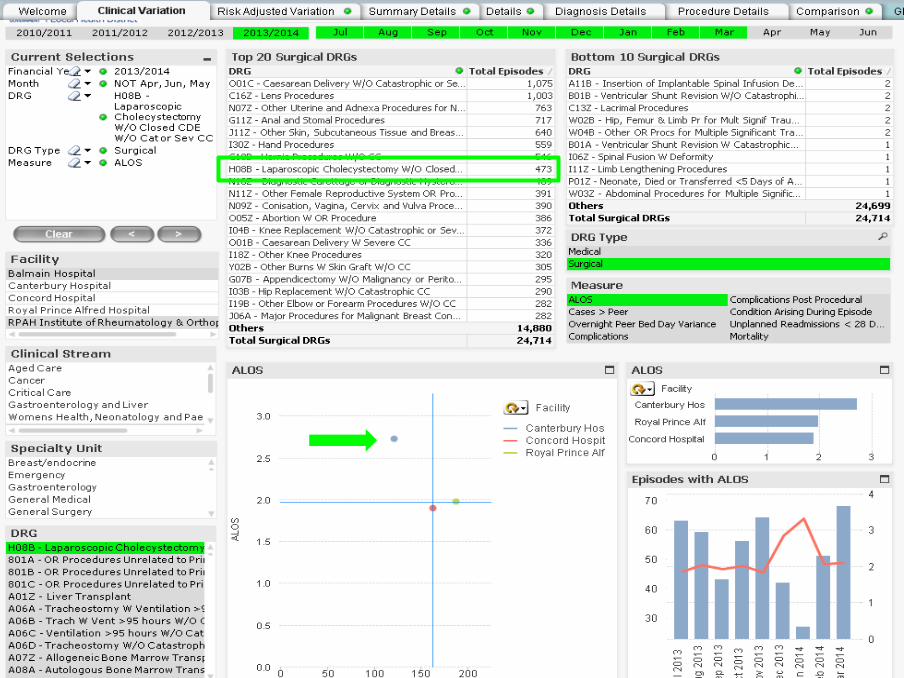
What does STARS offer clinicians & managers?
A tool to help:
– increase our collective knowledge about our services
– identify clinical variation / reduce unwarranted clinical
variation
– strengthen / implement ‘best-practice’ models of care, &
monitor outcomes
– improve clinical outcomes
– drive efficiencies
– link clinical databases
– identify cost savings
– support research to improve
clinical practice

What does STARS offer clinicians?
Real time access to a huge amount of data
User driven and flexible design
Link to clinical databases
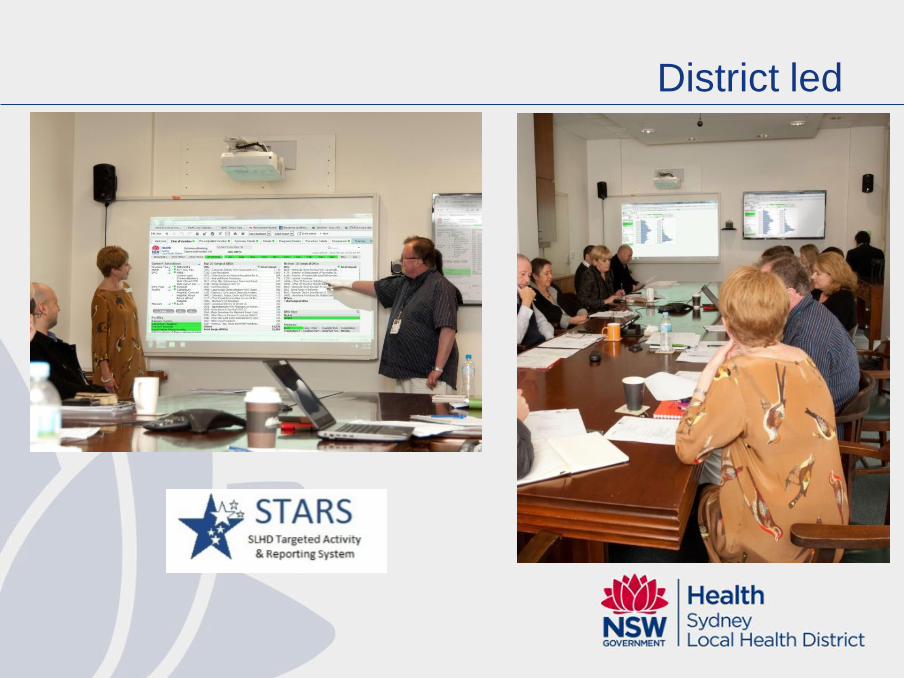
District led

Specialty / Clinician driven

-78.24

What are we doing?
Examples of innovations and new models of care
Orthopaedic Re-fracture Program
Living Well, Living Longer
Enhanced Recovery After Surgery
Sydney District Nursing and Hospital in the Home
Population Health Observatory
Health Equity Development Unit
Organ donation
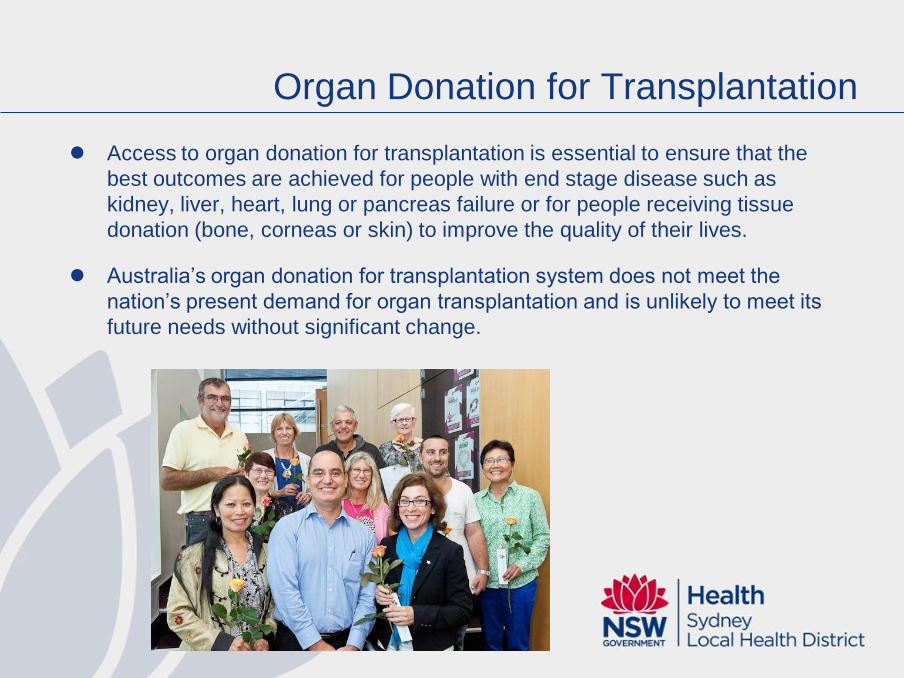
Organ Donation for Transplantation
Access to organ donation for transplantation is essential to ensure that the
best outcomes are achieved for people with end stage disease such as
kidney, liver, heart, lung or pancreas failure or for people receiving tissue
donation (bone, corneas or skin) to improve the quality of their lives.
Australia’s organ donation for transplantation system does not meet the
nation’s present demand for organ transplantation and is unlikely to meet its
future needs without significant change.

Organ donation for transplantation in Australia: The gap between Australia and world-leading countries.
Global ranking of deceased donors per million 2013
1 35.1 dpmp
2 – 3 30 - 35 dpmp
4 - 7 25 – 29.9 dpmp
8 - 10 23 – 24.9 dpmp
11 - 14 20 – 22.9 dpmp
15 – 19 17 – 19.9 dpmp
Additional Australians who could receive a
transplant every year*
1100
800
500
400
200
100
20 16.9 dpmp 0
Source: INTERNATIONAL REGISTRY IN ORGAN DONATION AND TRANSPLANTATION. International rankings for 2013 based on deceased organ donors per million of population. Prepared by ShareLife Australia, July 2014. www.sharelife.org.au * 2.7 transplants per donor
Australia
Italy, Norway, UK, Czech R
Estonia, Austria, Slovenia
Belgium, Portugal, France, United States
Croatia, Malta
Spain
Ireland, Uruguay, Belarus,
Finland, Latvia

Australia: Increase only marginally ahead of population
growth and a disturbing decline in the last 16 months.
359
819
0
100
200
300
400
500
600
700
800
900
DEC
JAN
FEB
MAR
APR
MAY
JUN
JUL
AUG
SEP
OCT
NOV
DEC
JAN
FEB
MAR
APR
MAY
JUN
JUL
AUG
SEP
OCT
NOV
DEC
JAN
FEB
MAR
APR
MAY
JUN
JUL
AUG
SEP
OCT
NOV
DEC
JAN
FEB
MAR
APR
MAY
JUN
JUL
AUG
SEP
OCT
NOV
DEC
JAN
FEB
MAR
APR
MAY
JUN
JUL
AUG
SEP
OCT
NOV
DEC
JAN
FEB
MAR
APR
MAY
JUN
JUL
AUG
SEP
OCT
NOV
DEC
2009 2010 2011 2012 2013 2014
DeceasedDonorsper12m
onths
DeceasedDonors-MovingAnnualTrend
AUSTRALIA
LeadingPerformanceat35dpmp


Kidney Waiting List
How is this possible?
0
2000
4000
6000
8000
10000
12000
14000
199
9
200
0
200
1
200
2
200
3
200
4
200
5
200
6
200
7
200
8
200
9
201
0
2011
201
2
201
3
Is this possible?
Kidney waiting list
dialysis
Organ Donation for Transplantation
Sydney Local Health District (SLHD) is committed to being an Australian
leader in organ donation to support the world leading transplantation
services that are provided by Royal Prince Alfred Hospital (RPA).
Yet it is clear that significant progress will need to be made to achieve
this goal.

Organ utilisation rate 2009 to 30 June 2014
99% 99%96%
97%
98% 93%
50%
55%
60%
65%
70%
75%
80%
85%
90%
95%
100%
0
50
100
150
200
250
300
350
2009 2010 2011 2012 2013 2014 YTD
Organ Utilisation Rate in NSW
(not including Islets)
Total Retrievals
Total Transplants
Organ Utilisation Rate
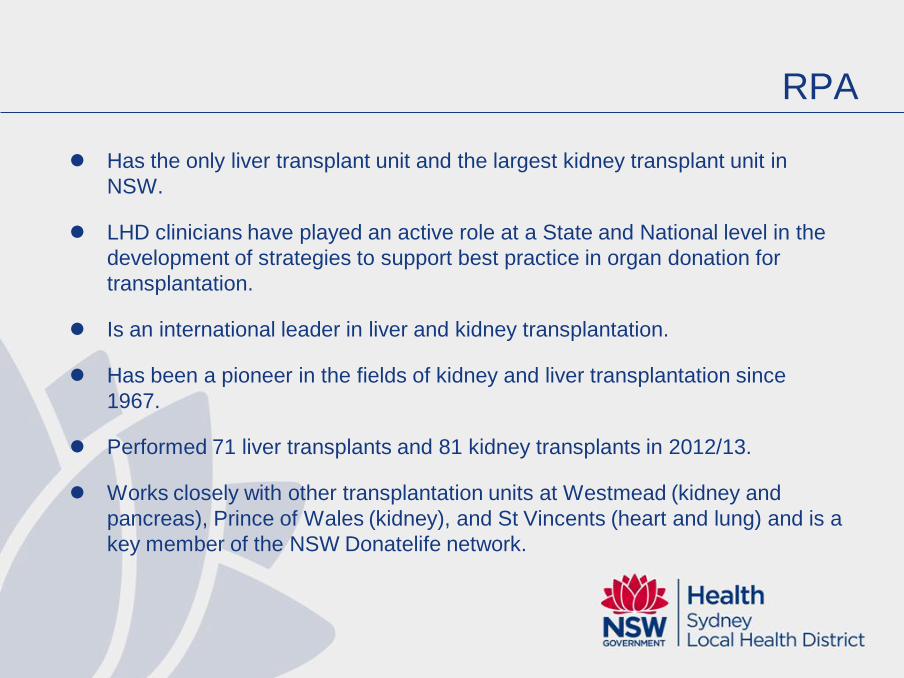
RPA
Has the only liver transplant unit and the largest kidney transplant unit in
NSW.
LHD clinicians have played an active role at a State and National level in the
development of strategies to support best practice in organ donation for
transplantation.
Is an international leader in liver and kidney transplantation.
Has been a pioneer in the fields of kidney and liver transplantation since
1967.
Performed 71 liver transplants and 81 kidney transplants in 2012/13.
Works closely with other transplantation units at Westmead (kidney and
pancreas), Prince of Wales (kidney), and St Vincents (heart and lung) and is a
key member of the NSW Donatelife network.

NSW Organ and Tissue Donation Service
Request Rates
89%
64%100%
100%
83%
100%
75%
100%
75%
93%
82%
50%
88%
75%
100%82%
94%
100%
93%
88%
88%
A
B
C
D
E
F
G
H
I
J
K
L
M
N
O
Royal Prince Alfred
Royal North Shore
R
S
T
Total NSW Hospitals
Request Rate - 2013 Full Year

NSW Organ and Tissue Donation Service
Consent Rates
38%
29%
100%
75%
40%50%
100%
75%
67%
36%56%
0%
62%
78%47%
50%94%
55%31%
64%
58%
A
B
C
D
E
F
G
H
I
J
K
L
M
N
O
Royal Prince Alfred
Royal North Shore
R
S
T
Total NSW Hospitals
Consent Rate - 2013 Full Year
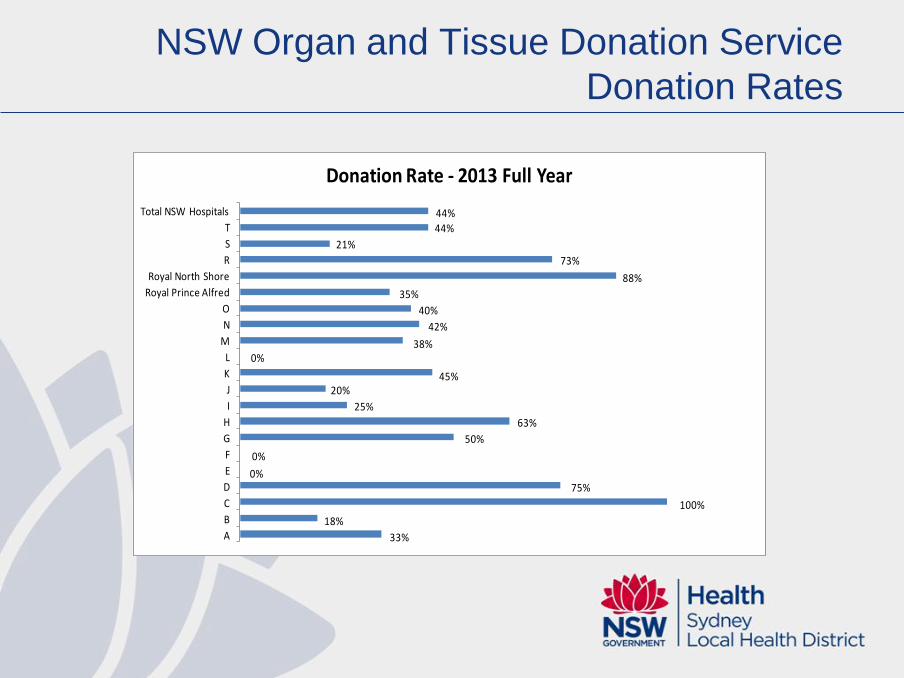
NSW Organ and Tissue Donation Service
Donation Rates
33%
18%
100%
75%0%
0%
50%
63%
25%
20%45%
0%38%
42%
40%
35%
88%
73%
21%
44%
44%
A
B
C
D
E
F
G
H
I
J
K
L
M
N
O
Royal Prince Alfred
Royal North Shore
R
S
T
Total NSW Hospitals
Donation Rate - 2013 Full Year
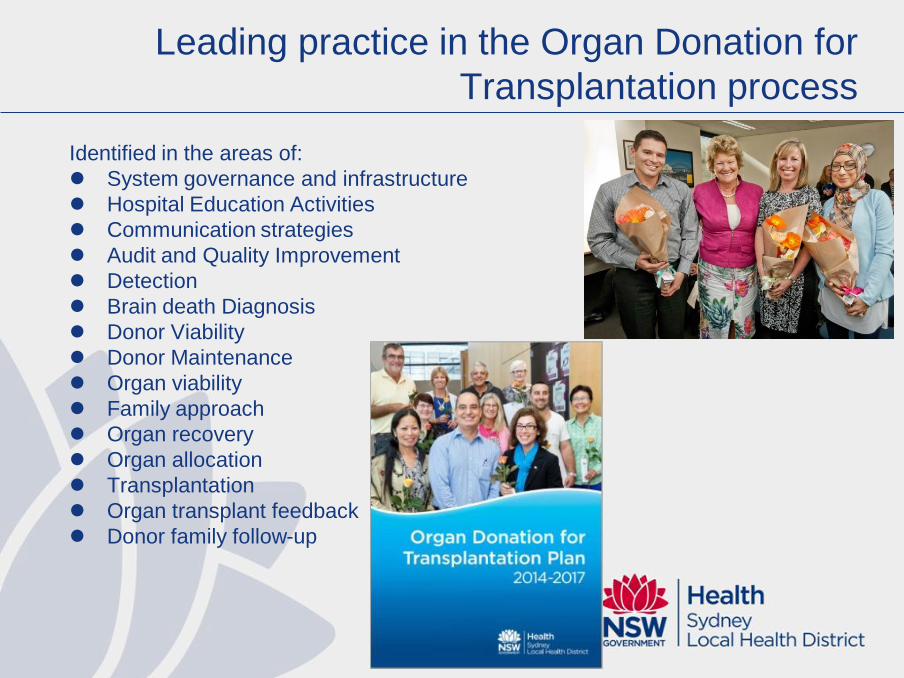
Leading practice in the Organ Donation for
Transplantation process
Identified in the areas of:
System governance and infrastructure
Hospital Education Activities
Communication strategies
Audit and Quality Improvement
Detection
Brain death Diagnosis
Donor Viability
Donor Maintenance
Organ viability
Family approach
Organ recovery
Organ allocation
Transplantation
Organ transplant feedback
Donor family follow-up

Strategies
A dedicated Organ Donation for Transplantation Unit
A Director of the Organ Donation for Transplantation Unit -a clinical
academic who will provide leadership in the development of best practice
organ donation within RPA.
The re-establishment of the Organ Donation for Transplantation Steering
Committee
24/7 coverage
Support for data collection, development of educational resources and audit.
Whole of Hospital approach
Review of the education
Enhanced audit and review RPA/SLHD practices for identifying potential
donors and our practices for obtaining consent.

Where to from here
Although the District recognises
that the targets it has set itself are
ambitious, the working party
believes that they are achievable
with the implementation of the
District’s Organ Donation for
Transplantation Plan.
The strategies contained in the
SLHD Organ Donation for
Transplantation Plan will enhance
its ability to be an Australian leader
in organ donation to support the
world leading transplantation
services that are provided by
Royal Prince Alfred Hospital.
0
10
20
30
40
50
60
70
80
90
100
2010 2011 2012 2013 2014 2015 2016 2017
%
RPA Organ Donation Rates Trajectory
Actual Request Rate (%)
Forecast Request Rate (%)
Actual Consent rate (%)
Forecast Consent rate (%)
Actual Donation Rate (%)
Forecast Donation Rate (%)