Embed Size (px)
Citation preview
ARTICLE
Creatine loading elevates the intracellular phosphorylationpotential and alters adaptive responses of rat fast-twitchmuscle to chronic low-frequency stimulationCharles T. Putman, Maria Gallo, Karen J.B. Martins, Ian M. MacLean, Michelle J. Jendral, Tessa Gordon,Daniel G. Syrotuik, and Walter T. Dixon
Abstract:This study tested the hypothesis that elevating the intracellular phosphorylation potential (IPP = [ATP]/[ADP]free) within ratfast-twitch tibialis anterior muscles by creatine (Cr) loading would prevent fast-to-slow fibre transitions induced by chronic low-frequency electrical stimulation (CLFS, 10 Hz, 12 h/day). Creatine-control and creatine-CLFS groups drank a solution of 1% Cr + 5%dextrose, ad libitum, for 10 days before and during 10 days of CLFS; dextrose-control and dextrose-CLFS groups drank 5% dextrose. Crloading increased total Cr (P< 0.025), phosphocreatine (PCr) (P< 0.003), and the IPP (P< 0.0008) by 34%, 45%, and 64%, respectively. PCrand IPP were 46% (P< 0.002) and 76% (P< 0.02) greater in creatine-CLFS than in dextrose-CLFS. Higher IPP was confirmed by a 58%reduction in phospho-AMP-activated protein kinase (Thr172) (P< 0.006). In dextrose-CLFS, myosin heavy chain (MyHC) I and IIatranscripts increased 32- and 38-fold (P< 0.006), respectively, whereas MyHC-IIb mRNA decreased by 75% (P< 0.03); the correspondingMyHC-I and MyHC-IIa protein contents increased by 2.0- (P< 0.03) and 2.7-fold (P< 0.05), respectively, and MyHC-IIb decreased by 30%(P< 0.03). In contrast, within creatine-CLFS, MyHC-I and MyHC-IIa mRNA were unchanged and MyHC-IIb mRNA decreased by 75%(P< 0.003); the corresponding MyHC isoform contents were not altered. Oxidative reference enzymes were similarly elevated (P< 0.01)in dextrose-CLFS and creatine-CLFS, but reciprocal reductions in glycolytic reference enzymes occurred only in dextrose-CLFS(P< 0.02). Preservation of the glycolytic potential and greater SERCA2 and parvalbumin contents in creatine-CLFS coincided withprolonged time to peak tension and half-rise time (P< 0.01). These results highlight the IPP as an important physiological regulator ofmuscle fibre plasticity and demonstrate that training-induced changes typically associated with improvements in muscular endur-ance or increased power output are not mutually exclusive in Cr-loaded muscles.
Key words:CLFS, myosin heavy chain, SDS-PAGE, real-time RT-PCR, parvalbumin, SERCA1, SERCA2, metabolic reference enzymes,contractile function.
Résumé :Cette étude vérifie l'hypothèse selon laquelle l'augmentation du potentiel de phosphorylation intracellulaire (PPI =[ATP]/[ADP]libre) dans les fibres asecousse rapide du jambier antérieur d'un rat par une charge de créatine (Cr) prévient la transition desfibres musculaires de rapides alentes causée par l'électrostimulation chronique abasse fréquence (CLFS, 10 Hz, 12 h/d). Les groupesrecevant la créatine (contrôle et CFLS) boiventad libitumune solution contenant1%deCret5%dedextrose, et ce, 10 jours avant la CFLSet durant les 10 jours de CFLS; les groupes recevant le dextrose (contrôle et CFLS) boivent une solution contenant 5 % de dextrose. Lacharge de créatine suscite une augmentation de la Cr totale (P< 0,025), de la PCR (P< 0,003) et du PPI (P< 0,0008) de 34 %, 45 % et 64 %,respectivement. Dans le groupe créatine-CFLS, PCr et PPI demeurent plus élevés de 46 % (P< 0,002) et 76 % (P< 0,02) comparativementau groupe dextrose-CFLS. La diminution de 58 % de phospho-AMPK(Thr172) ratifie davantage le plus haut PPI (P< 0,006). Dans legroupe dextrose-CFLS, les transcrits de MyHC-I et de MyHC-IIa augmentent de 32 et 38 fois respectivement (P< 0,006) alors que l'ARNmde MyHC-IIb diminue de 75 % (P< 0,03); le contenu protéique de MyHC-I et de MyHC-IIa augmente de 2,0 (P< 0,03) et 2,7 fois (P< 0,05)respectivement et celui de MyHC-IIb diminue de 30 % (P< 0,03). Par contre, dans le groupe créatine-CFLS, l'ARNm de MyHC-I et deMyHC-IIa ne varie pas et l'ARNm de MyHC-IIb diminue de 75 % (P< 0,003); le contenu des isoformes correspondants de MyHC ne variepas dans le groupe créatine-CFLS. On observe aussi une augmentation (P< 0,01) des enzymes de référence dans les groupes dextrose-CLFS et créatine-CLFS, mais on observe une diminution réciproque des enzymes glycolytiques de référence que dans le groupedextrose-CFLS (P< 0,02). La préservation du potentiel glycolytique et le contenu plus élevé en SERCA2 et en parvalbumine dansle groupe créatine-CFLS coïncident avec une augmentation des valeurs du temps de montée de la tension de crête (P< 0,01). Cesrésultats soulignentl'importance du PPI en tant que régulateur physiologique de la plasticité des fibres musculaires et démontrentque les modifications typiques suscitées al'entraînement par l'amélioration de l'endurance musculaire et l'augmentation de lapuissance produite ne sont pas mutuellement exclusives dans les muscles chargés de créatine. [Traduit par la Rédaction]
Mots-clés :CFLS, chaîne lourde de myosine, PAGE en présence de SDS, RT-PCR en temps réel, parvalbumine, SERCA1, SERCA2,enzymes métaboliques de référence, fonction contractile.
Received 18 August 2014. Accepted 27 January 2015.
C.T. Putman.Exercise Biochemistry Laboratory, Faculty of Physical Education and Recreation, University of Alberta, Edmonton, AB T6G 2H9, Canada;The Centre for Neuroscience, Faculty of Medicine and Dentistry, University of Alberta, Edmonton, AB T6G 2E1, Canada.M. Gallo, K.J.B. Martins, I.M. MacLean, M.J. Jendral, and D.G. Syrotuik.Exercise Biochemistry Laboratory, Faculty of Physical Education andRecreation, University of Alberta, Edmonton, AB T6G 2H9, Canada.T. Gordon.The Centre for Neuroscience, Faculty of Medicine and Dentistry, University of Alberta, Edmonton, AB T6G 2E1, Canada; Division of PhysicalMedicine and Rehabilitation, Faculty of Medicine and Dentistry, University of Alberta, Edmonton, AB T5G 0B7, Canada.W.T. Dixon.Department of Agricultural, Food and Nutritional Science, University of Alberta, Edmonton, AB T6G 2P5, Canada.
Corresponding author:Charles T. Putman (e-mail:[email protected]).
671
Appl. Physiol. Nutr. Metab.40: 671–682 (2015)dx.doi.org/10.1139/apnm-2014-0300
Appl. Physiol. Nutr. Metab. Downloaded from www.nrcresearchpress.com by University of Alberta on 07/12/16
Published at www.nrcresearchpress.com/apnm on 13 February 2015.
For personal use only.

Introduction
Evidence from a number of studies supports the hypothesis thatmuscle fibre phenotype is regulated by variations in the intracel-lular energy potential. Correlative data have revealed a strongrelationship between a reduction in the muscle fibre energy po-tential and fast-to-slow fibre type transitions in rabbit models ofchronic muscle training.Henriksson et al. (1988)reported thatATP and phosphocreatine (PCr) levels were reduced in rabbit tib-ialis anterior (TA) muscles undergoing fast-to-slow fibre type tran-sitions induced by chronic low-frequency electrical stimulation(CLFS: 10 Hz, 10 h daily). Building on those observations, Pette et al.(Green et al. 1992;Hämäläinen and Pette 1997) used a similarexperimental model to investigate the temporal relationshipbetween the ratio [ATP]/[ADP]free, which they termed the intra-cellular phosphorylation potential (IPP), and related phenotypicadaptations within mixed fast-twitch rabbit TA. They showed thatCLFS induced a large decrease in the IPP that preceded (Greenet al. 1992) and then paralleled fast-to-slow myosin heavy chain(MyHC) fibre type transitions, increased oxidativepotential(Green and Pette 1997), and increased slow sarco(endo)plasmicreticulum Ca2+-ATPase (SERCA2) isoform content (Hämäläinenand Pette 1997). Those phenotypic changes were accompanied bygradual decreases in glycolytic potential, parvalbumin content(Huber and Pette 1996;Carroll et al. 1999), and SERCA1 (fast iso-form) protein expression (Hämäläinen and Pette 2001).Prolonged feeding of the creatine (Cr) antagonist -guanidinepropionate (-GPA) has been shown to cause a substantial reduc-tion in the IPP in rodent muscles, revealing a causal link betweenthe cellular energy potential and muscle phenotype (Ren et al.1995;Brault et al. 2003). In those studies, decreases in the muscleIPP resulted in the transition of mixed fast-twitch muscles towarda slower, more oxidative phenotype (Ren et al. 1995). Further-more, when muscle training was superimposed, the extent offast-to-slow phenotypic transformation was augmented (Rousselet al. 2000). Further support for the involvement of the IPP indetermining muscle phenotype is found in single-fibre studiesconducted byConjard et al. (1998), who reported the IPP was great-est in the fast fibre populations, increasing from IIA to IID(X) to IIBfibres. They also reported that a large CLFS-induced decrease ofthe IPP occurred within the fast type IID(X) and IIB fibre popula-tions before their transition into slower oxidative type IIA fibres.Based on those collective observations, we recently investigatedwhether increasing the cellular energy potential within rat plan-taris, by long-term Cr loading, would attenuate fast-to-slow phe-notypic transitions typically associated with long-term voluntarywheel running of an intermittent, high-frequency nature (Galloet al. 2006,2008). In those studies, prolonged muscle Cr loadingattenuated running-induced fast-to-slow fibre type transitions. Al-though Cr feeding induced a 20% increase in total muscle Cr con-tent (TCr), a corresponding increase in the IPP was not detected inwhole-muscle extracts. This was attributed to the phasic, high-frequency nature of voluntary run training facilitating preferen-tial Cr uptake into heavily recruited type IIB fibres (Gallo et al.2008). Because the IIB population represented only 23% of all fi-bres in rat plantaris, the maximum increase in whole-muscle IPPwas limited to 4.6%.Thus, the purpose of the present study was to extend our pre-vious work by investigating the effects of maximum Cr loading onthe whole-muscle IPP and related phenotypic changes induced by10 days of CLFS, a critical stimulation period in this model offorced contractile activity that is known to induce the maximumrate of fast-to-slow fibre type transitions (Conjard et al. 1998;Martins et al. 2012). Because fibre contraction is a determinant ofCr uptake (Snow and Murphy 2003), and CLFS imposes the samecontraction parameters onto all fibres (Pette and Vrbová 1999), wereasoned that Cr uptake by muscle fibres would be ubiquitous,resulting in greater intracellular Cr accretion. Under these intra-
cellular conditions, the creatine kinase (CK; EC 2.7.3.2) equilib-rium favours PCr and ADP production while a linked reactioncatalysed by adenylate kinase (AK; EC 2.7.4.3) converts 2 ADP toAMP and ATP, leading to an increase in the [ATP]/[ADP]freeratio(i.e., IPP) (Hardie et al. 1999). Cr loading was achieved by ad libitumdrinking of a 1% Cr solution, sweetened with 5% dextrose, for10 days before and during 10 days of CLFS. Here we report thelargest documented increase in TCr to date (i.e., 34%) and an asso-ciated 64% increase in the IPP. The novel experimental modelemployed in our study allowed us to test the hypothesis thatincreasing the IPP in rat fast-twitch TA muscles would change theadaptive response to CLFS by preventing fast-to-slow MyHC tran-sitions as well as the associated changes in metabolism and theCa2+regulatory proteins SERCA1, SERCA2, and parvalbumin.
Materials and methods
Animals and careTwenty-four male Sprague–Dawley rats (237 ± 3.5 g) were usedin this study. All experiments were completed in accordance withthe guidelines of the Canadian Council on Animal Care. Ethicsapproval was received from theUniversity of AlbertaHealthSciences Animal Welfare and PolicyCommittee. Animals wereindividually housed under controlled environmental conditions(22 °C and alternating 12-h light and dark periods); high-proteinrat chow and drinking solutions were consumed ad libitum.
Experimental designAnimals were randomly assigned to 1 of 4 treatment groups.Two groups consumed, ad libitum, a solution of 5% dextrose (ve-hicle) (Fisher Scientific, Fairlawn, N.J., USA); one of those groupsreceived 10 days of CLFS applied to the left hind limb on days 11–20(dextrose-CLFS,n= 6), while the second received a sham operationof the left hind limb (dextrose-control,n= 5). Throughout thestudy the third and fourth groups consumed, ad libitum, a solu-tion of 1% Cr (Createam, NutraSense Inc., Shawnee Mission, Kans.,USA) that was sweetened with 5% dextrose to increase palatabilityand maximise Cr intake (Gallo et al. 2006,2008). Ten days of CLFSwas applied to the left hind limb of the third group (creatine-CLFS,n= 7) and the fourth group received a sham operation of the lefthind limb (creatine-control,n= 6). The right contralateral hindlimbs served as internal controls.
Surgery and chronic low-frequency stimulationCLFS (10 Hz, impulse width 380 s, 12 h/day) was applied aspreviously described (Putman et al. 2004,2007;Martins et al.2012). While rats were under general anaesthesia, bipolar elec-trodes were implanted lateral to the common peroneal nerve ofthe left hind limb, externalised, and connected to a small portablestimulator; animals recovered for 7 days. On days 1 to 10, animalsconsumed solutions of either 5% dextrose or 5% dextrose + 1% Cr;CLFS was applied on days 11–20.
Measurement of isometric muscle contractile propertiesIsometric functional measures were completed according toGallo et al. (2006). Animals were anaesthetised, incisions weremade along the dorsum of the right and left hind limbs, and theankle tendons of the TA muscles were separated and individuallytied with 2.0 silk, while the extensor digitorum longus was dener-vated. A silastic nerve cuff embedded with 2 multi-stranded stain-less steel wires (AS632, Cooner, Chatsworth, Calif., USA) waspositioned around the sciatic nerve for electrical stimulation. The2.0 silk was then attached to a Kulite strain gauge (model KH-102,Kulite Semiconductor Products Inc., Leonia, N.J., USA) for sequen-tial force recordings of maximum twitch force (TWf, millinew-tons), time to peak tension (TTP, milliseconds), half-rise time(½RT, milliseconds), and half-fall time (½FT, milliseconds).
672 Appl. Physiol. Nutr. Metab. Vol. 40, 2015
Appl. Physiol. Nutr. Metab. Downloaded from www.nrcresearchpress.com by University of Alberta on 07/12/16
Published by NRC Research Press
For personal use only.

Muscle samplingUpon completion of each experiment, animals were allowed torecover. TA muscles were collected from anaesthetised animals(75 mg ketamine and 8 mg xylazine per kilogram body weight),weighed, rapidly frozen in melting isopentane cooled in liquidnitrogen (–159 °C), and stored in liquid N2. Animals were immedi-ately euthanised with Euthanyl (100 mg/kg body weight).
Total muscle creatine contentTA muscles were analysed for TCr (Gallo et al. 2008). Neutralisedperchloric acid (PCA) extracts of freeze-dried, powdered TA mus-cles were added to 1 mol/L nitric acid, boiled for 40 min, cooled to4 °C, and cleared by centrifugation (12 000gfor 5 min, 4 °C). Sam-ples were diluted with 1.55 mol/L NaOH, 60 mmol/L Na2PO4, and11.5 mmol/L picric acid, and absorption was read at 513 nm (Ultra-spec 3000, Fisher Scientific).
ATP, ADP, PCr, Cr, and [ATP]/[ADP]free(IPP)Portions of TA muscles stored in liquid N2were pulverised un-
der liquid N2and dissected free of blood and connective tissue.ATP, ADP, PCr, and Cr were spectrophotometrically (Ultraspec3000, Fisher Scientific) determined in the neutralised (1 mol/LKHCO3) PCA extracts (Putman et al. 1998). Muscle intracellularwater content, calculated according toCieslar et al. (1998), was0.659 mL/g wet weight, or 87.3% of total tissue water (0.755 mL/g).[ADP]freewas calculated using the CK equilibrium (Cieslar andDobson 2000;Sahlin and Harris 2011).
Calculation of the mass action ratio ( MM-CK) andtransformed Gibbs free energy of the CK reaction(GMM-CK)A parameter that reflects the accumulation of reaction productsrelative to substrates in vivo, MM-CK, was calculated according toNewsholme et al. (1978)andNewsholme and Crabtree (1979),assummarised ineq. 1.
(1) MM-CK
[ATP] × [Cr][ADP] × [PCr]
The resulting MM-CK value was used to calculate GMM-CK ac-cording toNewsholme et al. (1978)andNewsholme and Crabtree(1979), as summarised ineq. 2.
(2) GMM-CK RTlnKeq
MM-CK
where Keq = 166 when [Mg2+] = 1.0 mmol/L, osmolarity =
250 mOsm/L, pH = 7.0, andR= 8.314 J/(mol·K) at 311 K.
-subunit phosphorylation (Thr172) of 5=-AMP-activatedprotein kinase (AMPK)Western blot analyses of phospho-AMPK (Thr172) and AMPK--pan were conducted as previously described (Putman et al.2007). Extracts of TA were denatured in reducing buffer (5 min at95 °C). Protein (87 g/lane) was resolved on 9% SDS-polyacrylamide gelsat 115 V (Mini-PROTEAN 3, Bio-Rad Laboratories, Mississauga, Ont.,Canada), electro-transferred onto nitrocellulose membranes (Bio-Rad), stained with Ponceau-S (Sigma-Aldrich, Oakville, Ont., Can-ada), and photographed (Syngene ChemiGenius, Cambridge, UK).Destained membranes were blocked in Tris-buffered saline (0.1%Tween 20, 5% bovine serum albumin (BSA), pH 7.4), followed bysequential incubations with anti-phospho-AMPK(Thr172) (1.0g/mL;2531, Cell Signaling Technology, Inc., Danvers, Mass., USA) andhorseradish peroxidase (HRP)-labelled anti-rabbit IgG (1.0 g/mL;PI-1000, Vector Laboratories, Burlington, Ont., Canada); immuno-reactivity was visualised with Immobilon Western Chemilumi-nescent HRP Substrate (Millipore Corp., Billerica, Mass., USA) and
quantified (Syngene). Membranes were subsequently stripped andreprobed with anti-AMPK--pan (1.0 g/mL; 07-181, Upstate CellSignaling Solutions, Lake Placid, N.Y., USA), and total AMPK- wasquantified. Phospho-AMPK (Thr172) and AMPK--pan correspondedto 63 kDa (Precision Plus Protein Prestained Standards, Bio-Rad). Allantibodies were diluted in blocking solutions.
Electrophoretic analysis of MyHC isoform contentQuantitative MyHC isoform analyses were completed as previ-ously described (Gallo et al. 2006) using a ChemiGenius imagingsystem (Syngene).
Western blot analyses of parvalbumin, SERCA1, andSERCA2Parvalbumin (12 kDa), SERCA1 (110 kDa), and SERCA2 (110 kDa)were quantified as previously described (Gallo et al. 2008). Ex-tracts were prepared as before and 10 g, 50 g, or 80 g loadedper lane for parvalbumin, SERCA1, or SERCA2 on 15% (w/v) (parv-albumin) or 7% (SERCA1 or SERCA2) SDS-polyacrylamide mini-gels(3.5% stacking gel; Mini-PROTEAN 3, Bio-Rad). Resolved proteinswere electro-transferred onto polyvinylidenedifluoride mem-branes. Parvalbumin (PBS-Tween 20, 5% skim milk powder, pH 7.4)and SERCA1 or SERCA2 (PBS-Tween 20, 2.5% skim milk powder,1% BSA, Sigma-Aldrich)membranes were blocked, incubated withanti-parvalbumin (0.1 g/mL; ab11427, Abcam, Cambridge, Mass.,USA), anti-SERCA1 (0.2 g/mL; ab2818, Abcam), or anti-SERCA2(0.25 g/mL; ab2861, Abcam), and developed using HRP-labelledanti-rabbit IgG (0.5 g/mL; PI-1000, Vector Laboratories), HRP-labelled anti-mouse IgG (0.5g/mL; PI-2000, Vector Laboratories),or biotinylated anti-mouse IgG (2.5 g/mL; BA-2000, Vector Labo-ratories) with HRP-labelled streptavidin (0.2g/mL; 474-3000, KPL,Gaithersburg, Md., USA). The respective internal loading controlswere -actinin (100 kDa) (anti--actinin, 7.5g/mL, clone EA-53,Sigma; anti-mouse IgG, 0.5 g/mL, PI-2000, Vector Laboratories),-actin (42 kDa) (anti--actin, 0.5g/mL,ab8227, Abcam;biotinyl-ated anti-rabbit IgG, 0.5 g/mL, BA-1000, Vector Laboratories), anddesmin (55 kDa) (anti-desmin, 16 g/mL, DE-U-10, Sigma; biotinyl-ated anti-mouse IgG, 2.5 g/mL, BA-2000, Vector Laboratories).
MyHC mRNA analyses by real-time reverse transcriptasepolymerase chain reaction (RT-PCR)Patterns of MyHC isoform expression were analysed at themRNA level using real-time RT-PCR (Martins et al. 2012). Real-timeRT-PCR was performed in duplicate using an ABI 7900HT thermo-cycler (Applied Biosystems). Fold changes in MyHC isoform ex-pression were determined using the 2– Ctmethod and 18S rRNAas the endogenous control. Baseline control values of “1 ± 0” wereestablished for each MyHC isoform as the average 2– Ctof theright contralateral TA of the dextrose (dextrose-base-control,n=11) or creatine (Cr-base-control,n= 13) groups. Data are expressedas follows: left-sham/dextrose-base-control (dextrose-control),left-stimulated/dextrose-base-control (dextrose-CLFS), Cr-loaded-left-sham/Cr-base-control (creatine-control), and Cr-loaded-left-stimulated/Cr-base-control (creatine-CLFS). This allowed quantificationof experimental effects and the associated variances.
Metabolic reference enzymesMaximal activities of citrate synthase (CS, EC 2.3.3.1), 3-hydroxyacyl-CoA dehydrogenase (HADH, EC 1.1.1.35), phos-phofructokinase(PFK, EC 2.7.1.11), glyceraldehyde-3-phosphatedehydrogenase (GAPDH, EC 1.2.1.12) (Putman et al. 2003,2004;Gallo et al. 2008), and creatine kinase (CK, EC 2.7.3.2) were mea-sured (Lowry et al. 1978) as previously described.
Statistical analysesData are presented as the mean ± SEM. Samples were analysedin duplicate or triplicate. Because ATP, ADP, and [ATP]/[ADP]freedid not differ between the right contralateral control and leftsham within dextrose groups, or between the right contralateral
Putman et al. 673
Appl. Physiol. Nutr. Metab. Downloaded from www.nrcresearchpress.com by University of Alberta on 07/12/16
Published by NRC Research Press
For personal use only.

control and left sham within creatine groups, data inFig. 3aresummarised as follows: dextrose-control (average of right con-tralateralcontrol and left sham), dextrose-CLFS(CLFS only),creatine-control (average of right contralateral control and leftsham), and creatine-CLFS (CLFS only). Data inFigs. 3–5and7aresummarised as sham/contralateral control or CLFS/contralateralcontrol. Data were analysed by ANOVA; when a significantFratiowas found, differences between group means were compared us-ing Fisher's post hoc analysis for planned comparisons. Data inFig. 3Dwere analysed by multivariate regression. Because thedirection and magnitude of effects were established a priori forTCr and [ATP]/[ADP]free, data were analysed using a one-tailed in-dependent samplesttest. Differences were considered significantatP< 0.05, butPvalues are reported.
Results
Body and muscle massMean body weight increased by 117 ± 5.1 g (Fig. 1A) and did notdiffer between groups. Average TA weight was 642 ± 10.3 mg anddid not differ within rats or between experimental groups.
Solution intake and daily creatine consumptionThe total daily volume of solution consumed (Fig. 1B) did notdiffer between the dextrose-control and dextrose-CLFS groups.Similarly, the total daily fluid volume consumed did not differbetween creatine-control and creatine-CLFS. However, rats whodrank 5% dextrose consumed 33% more fluid throughout thestudy than rats who drank 1% Cr + 5% dextrose (1453 ± 429.7 mL vs.967 ± 121.8 mL, main effectP< 0.001;Fig. 1B). At the beginning ofthe study, Cr intake was 2.2 g/(kg·day) (Fig. 1C), which equatedto 7.3 times the recommended human Cr-loadingdose of0.3 g/(kg·day) (Harris et al. 1992). Between 8 and 20 days, Cr intakeremained stable at 1.6 g/(kg·day) (Fig. 1C) and was equivalent to
5.3 times the recommended human Cr-loading dose. CumulativeCr intake in the present study (Fig. 1D) was 10.2 ± 0.54 g and 9.0 ±0.56 g for the creatine-control and creatine-CLFS groups, respec-tively.
ATP, ADP, TCr, PCr, Cr, and [ATP]/[ADP]free(IPP)TCr increased by 43 mmol/kg wet weight, or 34%, in Cr-loadedTA muscles (Fig. 2). Ten days of CLFS induced a 22% decrease in ATPcontent within the dextrose treatment condition (Table 1) but notin Cr-loaded muscles (Table 1). Total muscle ADP contents werenot altered by Cr loading or CLFS (Table 1). However, [ADP]freewassignificantly reduced by Cr loading (main effectP< 0.002;Table 1).
Fig. 1.(A) Body weight of Sprague–Dawley rats during creatine (Cr) loading and chronic low-frequency stimulation (CLFS): dextrose-control(empty circle), dextrose-CLFS (empty triangle), creatine-control (filled circle), and creatine-CLFS (filled triangle) groups. (B) Daily fluid volumeconsumed. (C) Daily Cr intake. (D) Cumulative Cr intake.
Fig. 2.Total creatine (Cr) content within tibialis anterior muscles ofdextrose-fed control rats (n= 11; dextrose-control and dextrose-CLFSgroups) and Cr-fed rats (n= 13; creatine-control and creatine-CLFSgroups).
674 Appl. Physiol. Nutr. Metab. Vol. 40, 2015
Appl. Physiol. Nutr. Metab. Downloaded from www.nrcresearchpress.com by University of Alberta on 07/12/16
Published by NRC Research Press
For personal use only.
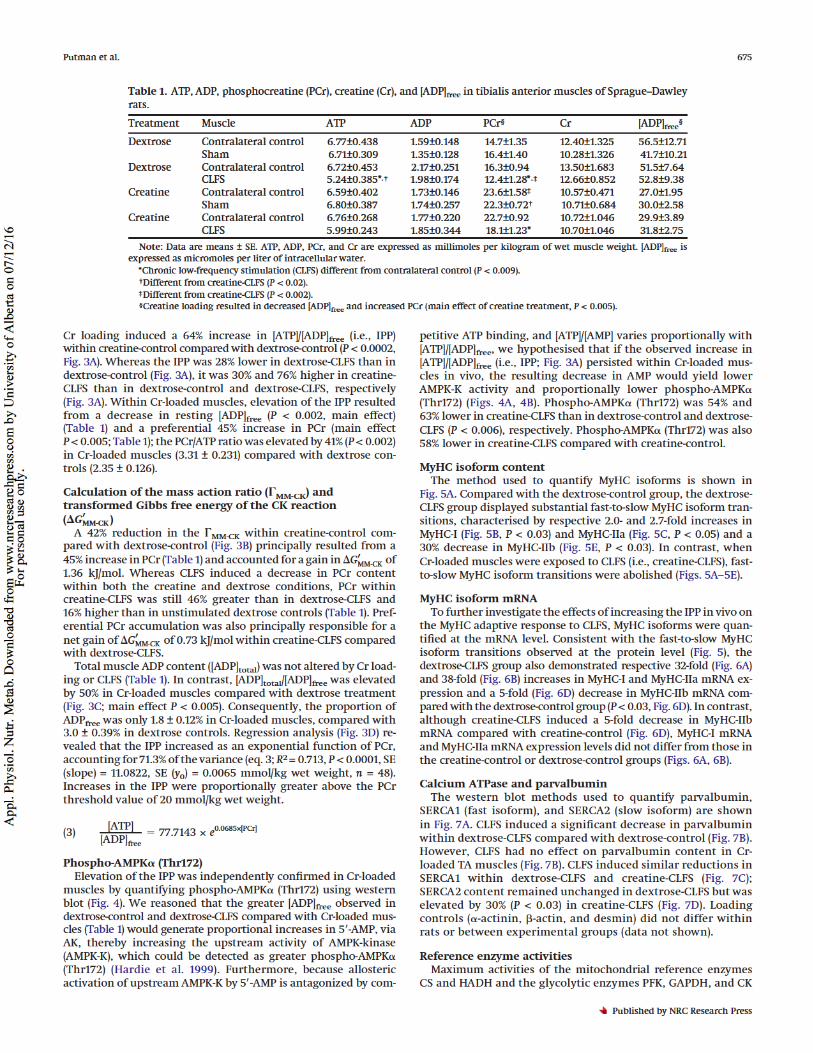
Cr loading induced a 64% increase in [ATP]/[ADP]free(i.e., IPP)within creatine-control compared with dextrose-control (P< 0.0002,Fig. 3A). Whereas the IPP was 28% lower in dextrose-CLFS than indextrose-control (Fig. 3A), it was 30% and 76% higher in creatine-CLFS than in dextrose-control and dextrose-CLFS, respectively(Fig. 3A). Within Cr-loaded muscles, elevation of the IPP resultedfrom a decrease in resting[ADP]free(P< 0.002, main effect)(Table 1) and a preferential 45% increase in PCr (main effectP< 0.005;Table 1); the PCr/ATP ratio was elevated by 41% (P< 0.002)in Cr-loaded muscles (3.31 ± 0.231) compared with dextrose con-trols (2.35 ± 0.126).
Calculation of the mass action ratio ( MM-CK) andtransformed Gibbs free energy of the CK reaction(GMM-CK)A 42% reduction in the MM-CK within creatine-control com-pared with dextrose-control (Fig. 3B) principally resulted from a45% increase in PCr (Table 1) and accounted for a gain inGMM-CKof1.36 kJ/mol. Whereas CLFS induced a decrease in PCr contentwithin both the creatine and dextrose conditions, PCr withincreatine-CLFS was still 46% greater than in dextrose-CLFS and16% higher than in unstimulated dextrose controls (Table 1). Pref-erential PCr accumulation was also principally responsible for anet gain of GMM-CK of 0.73 kJ/mol within creatine-CLFS comparedwith dextrose-CLFS.Total muscle ADP content ([ADP]total) was not altered by Cr load-ing or CLFS (Table 1). In contrast, [ADP]total/[ADP]freewas elevatedby 50% in Cr-loaded muscles compared with dextrose treatment(Fig. 3C; main effectP< 0.005). Consequently, the proportion ofADPfreewas only 1.8 ± 0.12% in Cr-loaded muscles, compared with3.0 ± 0.39% in dextrose controls. Regression analysis (Fig. 3D) re-vealed that the IPP increased as an exponential function of PCr,accounting for 71.3% of the variance (eq. 3;R2= 0.713,P< 0.0001, SE(slope) = 11.0822, SE (y0) = 0.0065 mmol/kg wet weight,n= 48).Increases in the IPP were proportionally greater above the PCrthreshold value of 20 mmol/kg wet weight.
(3)[ATP][ADP]free
77.7143 ×e0.0685×[PCr]
Phospho-AMPK (Thr172)Elevation of the IPP was independently confirmed in Cr-loadedmuscles by quantifying phospho-AMPK (Thr172) using westernblot (Fig. 4). We reasoned that the greater [ADP]freeobserved indextrose-control and dextrose-CLFS compared with Cr-loaded mus-cles (Table 1) would generateproportional increases in 5=-AMP, viaAK, thereby increasing the upstream activity of AMPK-kinase(AMPK-K), which could be detected as greater phospho-AMPK(Thr172) (Hardie et al. 1999). Furthermore,because allostericactivation of upstream AMPK-K by 5=-AMP is antagonized by com-
petitive ATP binding, and [ATP]/[AMP] varies proportionally with[ATP]/[ADP]free, we hypothesised that if the observed increase in[ATP]/[ADP]free(i.e., IPP;Fig. 3A) persisted within Cr-loaded mus-cles in vivo, the resulting decrease in AMP would yield lowerAMPK-K activity and proportionally lower phospho-AMPK(Thr172) (Figs. 4A,4B). Phospho-AMPK (Thr172) was 54% and63% lower in creatine-CLFS than in dextrose-control and dextrose-CLFS (P< 0.006), respectively. Phospho-AMPK (Thr172) was also58% lower in creatine-CLFS compared with creatine-control.
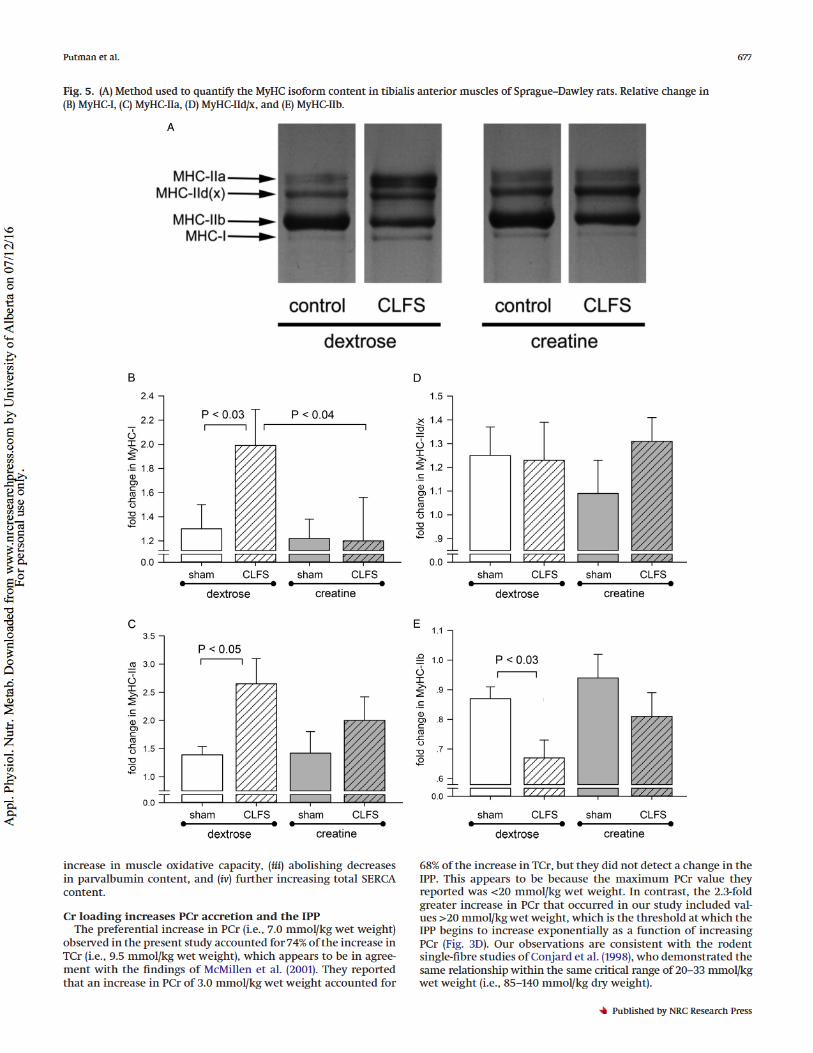
MyHC isoform contentThe method used to quantify MyHC isoforms is shown inFig. 5A. Compared with the dextrose-control group, the dextrose-CLFS group displayed substantial fast-to-slow MyHC isoform tran-sitions, characterised by respective 2.0- and 2.7-fold increases inMyHC-I (Fig. 5B,P< 0.03) and MyHC-IIa (Fig. 5C,P< 0.05) and a30% decrease in MyHC-IIb (Fig. 5E,P< 0.03). In contrast, whenCr-loaded muscles were exposed to CLFS (i.e., creatine-CLFS), fast-to-slow MyHC isoform transitions were abolished (Figs. 5A–5E).
MyHC isoform mRNATo further investigate the effects of increasing the IPP in vivo onthe MyHC adaptive response to CLFS, MyHC isoforms were quan-tified at the mRNA level. Consistent with the fast-to-slow MyHCisoform transitions observed at the protein level (Fig. 5), thedextrose-CLFS group also demonstrated respective 32-fold (Fig. 6A)and 38-fold (Fig. 6B) increases in MyHC-I and MyHC-IIa mRNA ex-pression and a 5-fold (Fig. 6D) decrease in MyHC-IIb mRNAcom-pared with the dextrose-control group (P< 0.03,Fig. 6D). In contrast,although creatine-CLFS induced a 5-fold decrease in MyHC-IIbmRNA compared with creatine-control (Fig. 6D), MyHC-I mRNAand MyHC-IIa mRNA expression levels did not differ from those inthe creatine-control or dextrose-control groups (Figs. 6A,6B).
Calcium ATPase and parvalbuminThe western blot methods used to quantify parvalbumin,SERCA1 (fast isoform), and SERCA2 (slow isoform) are showninFig. 7A. CLFS induced a significant decrease in parvalbuminwithin dextrose-CLFS compared with dextrose-control (Fig. 7B).However, CLFS had no effect on parvalbumin content in Cr-loaded TA muscles (Fig. 7B). CLFS induced similar reductions inSERCA1 within dextrose-CLFS and creatine-CLFS (Fig. 7C);SERCA2 content remained unchanged in dextrose-CLFS but waselevated by 30% (P< 0.03) in creatine-CLFS (Fig. 7D). Loadingcontrols (-actinin,-actin, and desmin) did not differ withinrats or between experimental groups (data not shown).
Reference enzyme activitiesMaximum activities of the mitochondrial reference enzymesCS and HADH and the glycolytic enzymes PFK, GAPDH, and CK
Table 1.ATP, ADP, phosphocreatine (PCr), creatine (Cr), and [ADP]freein tibialis anterior muscles of Sprague–Dawleyrats.
Treatment Muscle ATP ADP PCr§ Cr [ADP]free§
Dextrose Contralateral control 6.77±0.438 1.59±0.148 14.7±1.35 12.40±1.325 56.5±12.71Sham 6.71±0.309 1.35±0.128 16.4±1.40 10.28±1.326 41.7±10.21
Dextrose Contralateral control 6.72±0.453 2.17±0.251 16.3±0.94 13.50±1.683 51.5±7.64CLFS 5.24±0.385*,† 1.98±0.174 12.4±1.28*,‡ 12.66±0.852 52.8±9.38
Creatine Contralateral control 6.59±0.402 1.73±0.146 23.6±1.58‡ 10.57±0.471 27.0±1.95Sham 6.80±0.387 1.74±0.257 22.3±0.72† 10.71±0.684 30.0±2.58
Creatine Contralateral control 6.76±0.268 1.77±0.220 22.7±0.92 10.72±1.046 29.9±3.89CLFS 5.99±0.243 1.85±0.344 18.1±1.23* 10.70±1.046 31.8±2.75
Note:Data are means ± SE. ATP, ADP, PCr, and Cr are expressed as millimoles per kilogram of wet muscle weight. [ADP]freeis
expressed as micromoles per liter of intracellular water.
*Chronic low-frequency stimulation (CLFS) different from contralateral control (P< 0.009).†Different from creatine-CLFS (P< 0.02).‡Different from creatine-CLFS (P< 0.002).§Creatine loading resulted in decreased [ADP]freeand increased PCr (main effect of creatine treatment,P< 0.005).
Putman et al. 675
Appl. Physiol. Nutr. Metab. Downloaded from www.nrcresearchpress.com by University of Alberta on 07/12/16
Published by NRC Research Press
For personal use only.

(Table 2) were within the ranges of previous reports (Lowryet al. 1978;Putman et al. 2003,2004;Gallo et al. 2008). CLFSinduced 89% and 34% increases (P< 0.01) in the respective max-imum activities of CS and HADH in dextrose-CLFS and similar77% and 58% increases (P< 0.01) in creatine-CLFS. CK activitiesdeclined to similar levels in dextrose-CLFS and creatine-CLFS(P< 0.03). In contrast, whereas CLFS induced 22% reductionsin PFK (P< 0.01) and GAPDH (P< 0.02) within dextrose-CLFS, PFK(P> 0.94) and GAPDH (P> 0.51) activities remained unchangedin creatine-CLFS.
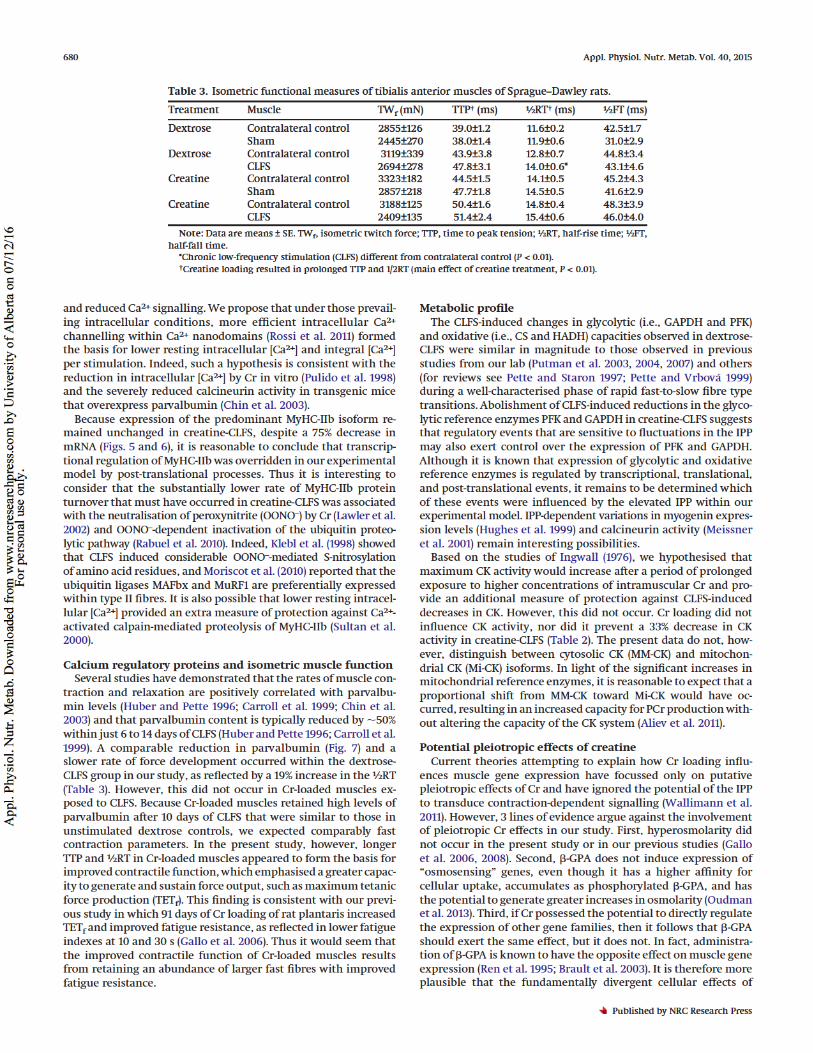
Isometric functional measuresMeasures of isometric muscle power output (TWf) and contractile
speed (TTP, ½RT, ½FT) are summarised inTable 3. Neither the Cr-loading nor CLFS treatments alone had any significant effects onTWf. Cr loading did, however, prolong the TTP by 7.6 ms (20%,main effectP< 0.01) and the ½RT by 2.6 ms ( 22%, main effectP< 0.001).
Discussion
This study is the first to investigate whether increasing theIPP in rat fast-twitch TA muscle can prevent CLFS-induced fast-to-slow transitions. Twenty days of Cr feeding proved to be asuccessful experimental model to increase TCr, PCr, and theIPP. Furthermore, the application of CLFS to Cr-loaded TA mus-cles on days 11–20 proved to be a very good experimental modelin which to investigate activity-induced fibre type transitionsin the presence of an increased IPP. The novel findings of thisstudy are that chronic elevation of the IPP in rat fast-twitch mus-cles significantly changed the adaptive response to 10 days of CLFSby (i) abolishing fast-to-slow MyHC transitions, (ii) preventing areduction in glycolytic potential but not at the expense of an
Fig. 3.(A) The intracellular phosphorylation potential (IPP), expressed as [ATP]/[ADP]free; (B) mass action ratio of creatine kinase (MM-CK);(C) [ADP]total/[ADP]free; and (D) multivariate regression analysis of [ATP]/[ADP]freeas a function of [PCr]. *, Creatine-CLFS greater than dextrose-control (P< 0.05).
Fig. 4.(A) Representative western blot demonstrating the methodused to quantify phospho-AMPK (Thr172). (B) Relative changes inphospho-AMPK (Thr172) within tibialis anterior muscles ofSprague–Dawley rats. *, Creatine-CLFS greater than dextrose-control(P< 0.05).
676 Appl. Physiol. Nutr. Metab. Vol. 40, 2015
Appl. Physiol. Nutr. Metab. Downloaded from www.nrcresearchpress.com by University of Alberta on 07/12/16
Published by NRC Research Press
For personal use only.
increase in muscle oxidative capacity, (iii) abolishing decreasesin parvalbumin content, and (iv) further increasing total SERCAcontent.
Cr loading increases PCr accretion and the IPPThe preferential increase in PCr (i.e., 7.0 mmol/kg wet weight)observed in the present study accounted for 74% of the increase inTCr (i.e., 9.5 mmol/kg wet weight), which appears to be in agree-ment with the findings ofMcMillen et al. (2001). They reportedthat an increase in PCr of 3.0 mmol/kg wet weight accounted for
68% of the increase in TCr, but they did not detect a change in theIPP. This appears to be because the maximum PCr value theyreported was <20 mmol/kg wet weight. In contrast, the 2.3-foldgreater increase in PCr that occurred in our study included val-ues >20 mmol/kg wet weight, which is the threshold at which theIPP begins to increase exponentially as a function of increasingPCr (Fig. 3D). Our observations are consistent with the rodentsingle-fibre studies ofConjard et al. (1998), who demonstrated thesame relationship within the same critical range of 20–33 mmol/kgwet weight (i.e., 85–140 mmol/kg dry weight).
Fig. 5.(A) Method used to quantify the MyHC isoform content in tibialis anterior muscles of Sprague–Dawley rats. Relative change in(B) MyHC-I, (C) MyHC-IIa, (D) MyHC-IId/x, and (E) MyHC-IIb.
Putman et al. 677
Appl. Physiol. Nutr. Metab. Downloaded from www.nrcresearchpress.com by University of Alberta on 07/12/16
Published by NRC Research Press
For personal use only.

The creatine-induced increase in the IPP appears to have re-sulted from the integration of 3 intracellular systems. (i) Sequen-tial reactions catalysed by the near-equilibrium enzymes CK (Cr0+ATP4–¡ PCr2–+ ADP3–+H+) and AK (2ADP3–¡ ATP4–+ AMP2–)(Golding et al. 1995;Nabuurs et al. 2010) should have ensuredremoval of cytosolic ADPfree; further reductions in availableADPfree(Fig. 3C) most likely resulted from low-affinity binding ofADP to soluble proteins, which is known to increase in response totraining (Sahlin and Harris 2011). (ii) Likewise, the CK-generatedH+most certainly was removed or “buffered”according to thephysiochemical principles that govern acid-base balance inmus-cle (Lindinger et al. 2005). (iii) Finally, a 41% increase in thePCr/ATP ratio without corresponding increases in Cr and ATPcould have occurred only if the larger PCr pool was accommo-dated by an increase inintracellular binding to low-affinity sites,such as zwitterionic phospholipids (Tokarska-Schlattner et al.2012).
Thermodynamic consequences of Cr loading on the CKsystemPreferential PCr accumulation (Table 1) was principally respon-sible for a 35% decrease in the MM-CKrelative to theKeq MM–CKinthe creatine-control group (Fig. 3B) and a 25% decrease in thecreatine-CLFS group (Fig. 3B). The respective 13% and 7% gains inGMM-CK should have enhanced the functional capacity and kineticproperties of the CK system as a spatial and temporal energybuffer of ATP (Wallimann et al. 1992;Aliev et al. 2011). Further-more, because ADPfreeis only transiently available in vivo(Nabuurs et al. 2010) and the magnitude of spikes in ADPfreeis
inversely proportional to [PCr] (Sahlin and Harris 2011), these cal-culated gains in GMM-CK must be considered minimum values.Thus it would seem that the major benefit derived from a moreuniform distribution of a higher IPP relates to an increase inthermodynamic efficiency of ATP hydrolysis within muscle fibres(Wallimann et al. 1992).
MyHC fibre type transitionsAs an experimental model of muscle training, CLFS has provenindispensable in revealing the adaptive potential of muscle fibresand providing important temporal clues to the physiological sig-nals and molecular events that determine postnatal fibre remod-elling (Pette and Vrbová 1999). In the present study, CLFS-inducedfast-to-slow MyHC isoform transitions, at the protein (Fig. 5) andmRNA (Fig. 6) levels, were similar to those previously reported(Putman et al. 2003,2004;Martins et al. 2012). Compared withvoluntary running, which was used in our previous study (Galloet al. 2008) to investigate fast-to-slow fibre type transitions withinplantaris of the same rat strain, CLFS induced more advancedfibre type conversion over a much shorter time period and provedto be a better experimental model. In our previous study, 91 daysof Cr feeding induced a 20% increase in TCr, which was sufficientto attenuate but not abolish running-induced fast-to-slow MyHCfibre type transitions in the plantaris (Gallo et al. 2006,2008). Inthe present study, however, a 34% increase in TCr elevated the IPPwithin TA muscles and abolished CLFS-induced fast-to-slow MyHCisoform transitions (Figs. 5and6).Our findings point to the interesting possibility that MyHC-I,MyHC-IIa, and MyHC-IIb expression levels are transcriptionally
Fig. 6.Changes in MyHC mRNA expression for (A) MyHC-I, (B) MyHC-IIa, (C) MyHC-IId/x, and (D) MyHC-IIb.
678 Appl. Physiol. Nutr. Metab. Vol. 40, 2015
Appl. Physiol. Nutr. Metab. Downloaded from www.nrcresearchpress.com by University of Alberta on 07/12/16
Published by NRC Research Press
For personal use only.

regulated by an energy-sensitive response element. Whethersuchregulation is direct or is part of an integrated, universalsignal remains an intriguing question. In this regard, it is inter-esting to consider the relationship between the IPP and intracel-lular [Ca2+]. During contractions, SERCA activity is dependent onthe maintenance of high local IPP and is inversely proportional tocytoplasmic [Ca2+](Pulido et al. 1998;Duke and Steele 1999). The
application of CLFS for a time period similar to that used in thepresent study has been shown to lower PCr, lower the IPP (Conjardet al. 1998), and induce 2-fold increases in resting intracellular[Ca2+] (e.g., 0.75 to 1.6mol/L) and integral [Ca2+] per stimulationpulse (Carroll et al. 1999). Thus, increases in PCr and IPP coupledwith higher parvalbumin content in creatine-CLFS should haveincreased the rate of ATP-dependent Ca2+re-uptake by SERCAs
Fig. 7.(A) Representative immunoblots of parvalbumin, SERCA1, and SERCA2 in tibialis anterior muscles of Sprague–Dawley rats. Changes inthe contents of (B) parvalbumin, (C) SERCA1, and (D) SERCA2.
Table 2.Maximum activities of citrate synthase (CS, EC 2.3.3.1), 3-hydroxyacyl-CoA dehydrogenase (HADH, EC 1.1.1.35),phosphofructokinase (PFK, EC 2.7.1.11), glyceraldehyde-3-phosphate dehydrogenase (GAPDH, EC 1.2.1.12), and creatinekinase (CK, EC 2.7.3.2) in tibialis anterior muscles of Sprague–Dawley rats.
Treatment Muscle CS HADH PFK GAPDH CK
Dextrose Contralateral control 35.9±3.4 11.6±0.7 23.1±4.4 507±33 3927±91Sham 40.6±1.6 14.5±1.5 22.2±2.7 485±37 3587±138
Dextrose Contralateral control 29.3±2.9 11.9±0.6 29.4±4.3 464±26 3745±184CLFS 55.5±3.1* 16.0±1.9* 22.8±4.0* 364±35* 3160±215*
Creatine Contralateral control 26.6±3.2 10.9±0.8 26.9±3.2 464±38 4120±233Sham 37.0±3.9 13.9±1.2 34.4±3.5 452±31 3718±104
Creatine Contralateral control 26.7±2.5 10.4±0.8 19.4±2.6 492±40 3830±84CLFS 47.3±3.5* 16.4±1.4* 19.2±2.8 469±39 2881±184*
Note:Data are means ± SE. Enzyme activities are expressed as units (i.e., 1 mol/min at 30 °C) per gram of wet muscleweight.
*Chronic low-frequency stimulation (CLFS) different from contralateral control (P< 0.01).
Putman et al. 679
Appl. Physiol. Nutr. Metab. Downloaded from www.nrcresearchpress.com by University of Alberta on 07/12/16
Published by NRC Research Press
For personal use only.
and reduced Ca2+signalling. We propose that under those prevail-ing intracellularconditions, more efficient intracellular Ca2+
channelling within Ca2+nanodomains (Rossi et al. 2011) formedthe basis for lower resting intracellular [Ca2+] and integral [Ca2+]per stimulation. Indeed, such a hypothesis is consistent with thereduction in intracellular [Ca2+] by Cr in vitro (Pulido et al. 1998)and the severely reduced calcineurin activity in transgenic micethat overexpress parvalbumin (Chin et al. 2003).Because expression of the predominant MyHC-IIb isoform re-mained unchanged in creatine-CLFS, despite a 75% decrease inmRNA (Figs. 5and6), it is reasonable to conclude that transcrip-tional regulation of MyHC-IIb was overridden in our experimentalmodel by post-translational processes. Thus it is interesting toconsider that the substantially lower rate of MyHC-IIb proteinturnover that must have occurred in creatine-CLFS was associatedwith the neutralisation of peroxynitrite (OONO–)byCr(Lawler et al.2002) and OONO–-dependent inactivation of the ubiquitin proteo-lytic pathway (Rabuel et al. 2010). Indeed,Klebl et al. (1998)showedthat CLFS induced considerable OONO–-mediated S-nitrosylationof amino acid residues, andMoriscot et al. (2010)reported that theubiquitin ligases MAFbx and MuRF1 are preferentially expressedwithin type II fibres. It is also possible that lower resting intracel-lular [Ca2+] provided an extra measure of protection against Ca2+-activated calpain-mediated proteolysis of MyHC-IIb (Sultan et al.2000).
Calcium regulatory proteins and isometric muscle functionSeveral studies have demonstrated that the rates of muscle con-traction and relaxation are positively correlated with parvalbu-min levels (Huber and Pette 1996;Carroll et al. 1999;Chin et al.2003) and that parvalbumin content is typically reduced by 50%within just 6 to 14 days of CLFS (Huber and Pette 1996;Carroll et al.1999). A comparable reduction in parvalbumin (Fig. 7) and aslower rate of force development occurred within the dextrose-CLFS group in our study, as reflected by a 19% increase in the ½RT(Table 3). However, this did not occur in Cr-loaded muscles ex-posed to CLFS. Because Cr-loaded muscles retained high levels ofparvalbumin after 10 days of CLFS that were similar to those inunstimulated dextrose controls, we expected comparably fastcontraction parameters. In the present study, however, longerTTP and ½RT in Cr-loaded muscles appeared to form the basis forimproved contractile function, which emphasised a greater capac-ity to generate and sustain force output, such as maximum tetanicforce production (TETf). This finding is consistent with our previ-ous study in which 91 days of Cr loading of rat plantaris increasedTETfand improved fatigue resistance, as reflected in lower fatigueindexes at 10 and 30 s (Gallo et al. 2006). Thus it would seem thatthe improved contractile function of Cr-loaded muscles resultsfrom retaining an abundance of larger fast fibres with improvedfatigue resistance.
Metabolic profileThe CLFS-induced changes in glycolytic (i.e., GAPDH and PFK)and oxidative (i.e., CS and HADH) capacities observed in dextrose-CLFS were similar in magnitude to those observed in previousstudies from our lab (Putman et al. 2003,2004,2007) and others(for reviews seePette and Staron 1997;Pette and Vrbová 1999)during a well-characterised phase of rapid fast-to-slow fibre typetransitions. Abolishment of CLFS-induced reductions in the glyco-lytic reference enzymes PFK and GAPDH in creatine-CLFS suggeststhat regulatory events that are sensitive to fluctuations in the IPPmay also exert control over the expression of PFK and GAPDH.Although it is known that expression of glycolytic and oxidativereference enzymes is regulated by transcriptional, translational,and post-translational events, it remains to be determined whichof these events were influenced by the elevated IPP within ourexperimental model. IPP-dependent variations in myogeninexpres-sion levels (Hughes et al. 1999) and calcineurin activity (Meissneret al. 2001) remain interesting possibilities.Based on the studies ofIngwall (1976), we hypothesised thatmaximum CK activity would increase after a period of prolongedexposure to higher concentrations of intramuscular Cr and pro-vide an additional measure of protection against CLFS-induceddecreases in CK. However, this did not occur. Cr loading did notinfluence CK activity, nor did it prevent a 33% decrease in CKactivity in creatine-CLFS (Table 2). The present data do not, how-ever, distinguish between cytosolic CK (MM-CK) and mitochon-drial CK (Mi-CK) isoforms. In light of the significant increases inmitochondrial reference enzymes, it is reasonable to expect that aproportional shift from MM-CK toward Mi-CK would have oc-curred, resulting in an increased capacity for PCr production with-out altering the capacity of the CK system (Aliev et al. 2011).
Potential pleiotropic effects of creatineCurrent theories attempting to explain how Cr loading influ-ences muscle gene expression have focussed only on putativepleiotropic effects of Cr and have ignored the potential of the IPPto transduce contraction-dependent signalling (Wallimann et al.2011). However, 3 lines of evidence argue against the involvementof pleiotropic Cr effects in our study. First, hyperosmolarity didnot occur in the present study or in our previous studies (Galloet al. 2006,2008). Second,-GPA does not induce expression of“osmosensing” genes, even though it has a higher affinity forcellular uptake, accumulates as phosphorylated -GPA, and hasthe potential to generate greater increases in osmolarity (Oudmanet al. 2013). Third, if Cr possessed the potential to directly regulatethe expression of other gene families, then it follows that-GPAshould exert the same effect, but it does not. In fact, administra-tion of-GPA is known to have the opposite effect on muscle geneexpression (Ren et al. 1995;Brault et al. 2003). It is therefore moreplausible that the fundamentally divergent cellular effects of
Table 3.Isometric functional measures of tibialis anterior muscles of Sprague–Dawley rats.
Treatment Muscle TWf(mN) TTP†(ms) ½RT†(ms) ½FT (ms)
Dextrose Contralateral control 2855±126 39.0±1.2 11.6±0.2 42.5±1.7Sham 2445±270 38.0±1.4 11.9±0.6 31.0±2.9
Dextrose Contralateral control 3119±339 43.9±3.8 12.8±0.7 44.8±3.4CLFS 2694±278 47.8±3.1 14.0±0.6* 43.1±4.6
Creatine Contralateral control 3323±182 44.5±1.5 14.1±0.5 45.2±4.3Sham 2857±218 47.7±1.8 14.5±0.5 41.6±2.9
Creatine Contralateral control 3188±125 50.4±1.6 14.8±0.4 48.3±3.9CLFS 2409±135 51.4±2.4 15.4±0.6 46.0±4.0
Note:Data are means ± SE. TWf, isometric twitch force; TTP, time to peak tension; ½RT, half-rise time; ½FT,
half-fall time.
*Chronic low-frequency stimulation (CLFS) different from contralateral control (P< 0.01).†Creatine loading resulted in prolonged TTP and 1/2RT (main effect of creatine treatment,P< 0.01).
680 Appl. Physiol. Nutr. Metab. Vol. 40, 2015
Appl. Physiol. Nutr. Metab. Downloaded from www.nrcresearchpress.com by University of Alberta on 07/12/16
Published by NRC Research Press
For personal use only.

-GPA and Cr on muscle gene expression are a function of theopposite effects they exert on the IPP.
Conclusion and knowledge translation
This study is the first to show that when mixed fast-twitchmuscles are Cr-loaded before and during prolonged exposure toan endurance-training stimulus, they maintain a fast-twitch gly-colytic phenotype but also adapt to the training stimulus by in-creasing oxidative capacity. Thus the IPP would seem to play animportant role in determining the adaptive response of skeletalmuscle fibres to a chronic training stimulus that encompassesimprovements in both muscular endurance and muscular powerthat are not mutually exclusive. The findings of this study areparticularly relevant to human inherited neuromuscular pathol-ogies such as amyotrophic lateral sclerosis, spinal muscular atro-phy, and muscular dystrophies that typically include chroniccycles of muscle fibre inflammation, degeneration, and regenera-tion, particularly within fast fibre populations. Under these cir-cumstances, muscle creatine depletion develops secondary to theprimary lesion but nevertheless contributes to pathogenesis. Inlight of the ability of PCr and Cr to weakly bind to zwitterionicphospholipids andprotect membrane permeability (Tokarska-Schlattner et al. 2012), oral creatine supplementation shouldprove to be a beneficial adjunct therapy to quickly replenish mus-cle PCr and Cr stores, restore the IPP, and enhance cell signalling.
AcknowledgementsThis study was funded by grants from the Natural Sciences andEngineering Research Council (NSERC) of Canada to C.T.P. andW.T.D. and from Alberta Innovates–Health Solutions (AIHS) toC.T.P. and T.G. The authors thank Y. Shu and N. Tyreman forcompleting animal experiments and Z. Kenwell for constructingCLFS stimulation units. M.G. was supported by Izaak Walton Kil-lam and NSERC PGS-D scholarships. K.J.B.M. was supported byAIHS and NSERC PGS-Dscholarships. M.J.J. was supported byconsecutive USRA, PGS-M, and CGS-D NSERC scholarships. C.T.P.is a Senior Scholar of AIHS.
ReferencesAliev, M., Guzun, R., Karu-Varikmaa, M., Kaambre, T., Wallimann, T., andSaks, V. 2011. Molecular system bioenergics of the heart: experimental stud-ies of metabolic compartmentation and energy fluxes versus computer mod-eling. Int. J. Mol. Sci.12(12): 9296–9331. doi:10.3390/ijms12129296. PMID:22272134.
Brault, J.J., Abraham, K.A., and Terjung, R.L. 2003. Muscle creatine uptake andcreatine transporter expression in response to creatine supplementation anddepletion. J. Appl. Physiol.94(6): 2173–2180. doi:10.1063/1.1591071, 10.1152/japplphysiol.01171.2002. PMID:12611762.
Carroll, S.L., Nicotera, P., and Pette, D. 1999. Calcium transients in single fibersof low-frequency stimulated fast-twitch muscle of rat. Am. J. Physiol. CellPhysiol.277(6): C1122–C1129. PMID:10600763.
Chin, E.R., Grange, R.W., Viau, F., Simard, A.R., Humphries, C., Shelton, J., et al.2003. Alterations in slow-twitch muscle phenotype in transgenic mice over-expressing theCa2+buffering protein parvalbumin. J. Physiol.547(2): 649–663. doi:10.1113/jphysiol.2002.024760. PMID:12562945.
Cieslar, J.H., and Dobson, G.P. 2000. Free [ADP] and aerobic muscle work followat least second order kinetics in rat gastrocnemius in vivo. J. Biol. Chem.275(9): 6129–6134. doi:10.1074/jbc.275.9.6129. PMID:10692403.
Cieslar, J., Huang, M.T., and Dobson, G.P. 1998. Tissue spaces in rat heart, liver,and skeletal muscle in vivo. Am. J. Physiol. Regul. Integr. Comp. Physiol.275(5): R1530–R1536. PMID:9791070.
Conjard, A., Peuker, H., and Pette, D. 1998. Energy state and myosin heavy chainisoforms in single fibres of normal and transforming rabbit muscles. PflügersArch.436(6): 962–969. doi:10.1007/s004240050730. PMID:9799414.
Duke, A.M., and Steele, D.S. 1999. Effects of creatine phosphate on Ca2+regula-tion by the sarcoplasmic reticulum in mechanically skinned rat skeletalmuscle fibres. J. Physiol.517(2): 447–458. doi:10.1111/j.1469-7793.1999.0447t.x.PMID:10332094.
Gallo, M., Gordon, T., Syrotuik, D., Shu, Y., Tyreman, N., Maclean, I., et al. 2006.Effects of long-term creatine feeding and running on isometric functionalmeasures and myosin heavy chain content of rat skeletal muscles. PflügersArch.452(6): 744–755. doi:10.1007/s00424-006-0079-0. PMID:16688465.
Gallo, M., Maclean, I., Tyreman, N., Martins, K.J., Syrotuik, D., Gordon, T., andPutman, C.T. 2008. Adaptive responses to creatine loading and exercise in
fast-twitch rat skeletal muscle. Am. J. Physiol. Regul. Integr. Comp. Physiol.294(4): R1319–R1328. doi:10.1152/ajpregu.00631.2007. PMID:18216140.
Golding, E.M., Teague, W.E., Jr., and Dobson, G.P. 1995. Adjustment of K' tovarying pH and pMg for the creatine kinase, adenylate kinase and ATP hy-drolysis equilibria permitting quantitative bioenergetic assessment. J. Exp.Biol.198(8): 1775–1782. PMID:7636446.
Green, H.J., and Pette, D. 1997. Early metabolic adaptations of rabbit fast-twitchmuscle to chronic low-frequency stimulation. Eur. J. Appl. Physiol. Occup.Physiol.75(5): 418–424. doi:10.1007/s004210050182. PMID:9189729.
Green, H.J., Düsterhöft, S., Dux, L., and Pette, D. 1992. Metabolite patterns re-lated to exhaustion, recovery and transformation of chronically stimulatedrabbit fast-twitch muscle. Pflügers Arch.420(3–4): 359–366. doi:10.1007/BF00374471. PMID:1598191.
Hämäläinen, N., and Pette, D. 1997. Coordinated fast-to-slow transitions of my-osin and SERCA isoforms in chronically stimulated muscles of euthyroid andhyperthyroid rabbits. J. Muscle Res. Cell Motil.18(5): 545–554. doi:10.1023/A:1018663218477. PMID:9350007.
Hämäläinen, N., and Pette, D. 2001. Myosin and SERCA isoform expression indenervated slow-twitch muscle of euthyroid and hyperthyroid rabbits.J. Muscle Res. Cell Motil.22(5): 453–457. doi:10.1023/A:1014543507149. PMID:11964070.
Hardie, D.G., Salt, I.P., Hawley, S.A., and Davies, S.P. 1999. AMP-activated proteinkinase: an ultrasensitive system for monitoring cellular energy charge.Biochem. J.338(3): 717–722. doi:10.1042/0264-6021:3380717. PMID:10051444.
Harris, R.C., Soderlund, K., and Hultman, E. 1992. Elevation of creatine in restingand exercised muscle of normal subjects by creatine supplementation. Clin.Sci.83: 367–374. PMID:1327657.
Henriksson, J., Salmons, S., Chi, M.Y., Hintz, C.S., and Lowry, O.H. 1988. Chronicstimulation of mammalian muscle: changes in metabolite concentrations inindividual fibers. Am. J. Physiol Cell Physiol.255(4): C543–C551. PMID:3177628.
Huber, B., and Pette, D. 1996. Dynamics of parvalbumin expression in low-frequency-stimulated fast-twitch rat muscle. Eur. J. Biochem.236(3): 814–819.doi:10.1111/j.1432-1033.1996.t01-2-00814.x. PMID:8665899.
Hughes, S.M., Chi, M.M., Lowry, O.H., and Gundersen, K. 1999. Myogenin inducesa shift of enzyme activity from glycolytic to oxidative metabolism in musclesof transgenic mice. J. Cell Biol.145(3): 633–642. doi:10.1083/jcb.145.3.633.PMID:10225962.
Ingwall,J.S.1976.Creatine and the control of muscle-specific protein synthesisin cardiac and skeletal muscle. Circ. Res.38(5 Suppl. 1): I-115–I-123. PMID:1269086.
Klebl, B.M., Ayoub, A.T., and Pette, D. 1998. Protein oxidation, tyrosine nitration,and inactivation of sarcoplasmic reticulum Ca2+-ATPase in low-frequencystimulated rabbit muscle. FEBS Lett.422(3): 381–384. doi:10.1016/S0014-5793(98)00053-2. PMID:9498821.
Lawler, J.M., Barnes, W.S., Wu, G., Song, W., and Demaree, S. 2002. Direct anti-oxidant properties of creatine. Biochem. Biophys. Res. Commun.290(1): 47–52. doi:10.1006/bbrc.2001.6164. PMID:11779131.
Lindinger, M.I., Kowalchuk, J.M., and Heigenhauser, G.J. 2005. Applying physi-cochemical principles to skeletal muscle acid-base status. Am. J. Physiol.Regul. Integr. Comp. Physiol.289(3): R891–R894. doi:10.1152/ajpregu.00225.2005. PMID:16105823.
Lowry, C.V., Kimmey, J.S., Felder, S., Chi, M.M., Kaiser, K.K., Passonneau, P.N.,et al. 1978. Enzyme patterns in single human muscle fibers. J. Biol. Chem.253(22): 8269–8277. PMID:152314.
Martins, K.J., St-Louis, M., Murdoch, G.K., MacLean, I.M., McDonald, P.,Dixon, W.T., et al. 2012. Nitric oxide synthase inhibition prevents activity-induced calcineurin-NFATc1 signalling and fast-to-slow skeletal muscle fibretype conversions. J. Physiol.590(6): 1427–1442. doi:10.1113/jphysiol.2011.223370. PMID:22219342.
McMillen, J., Donovan, C.M., Messer, J.I., and Willis, W.T. 2001. Energetic drivingforces are maintained in resting rat skeletal muscle after dietary creatinesupplementation. J. Appl. Physiol.90(1): 62–66. PMID:11133894.
Meissner, J.D., Gros, G., Scheibe, R.J., Scholz, M., and Kubis, H.P. 2001. Calcineu-rin regulates slow myosin, but not fast myosin or metabolic enzymes, duringfast-to-slow transformation in rabbit skeletal muscle cell culture. J. Physiol.533(1): 215–226. doi:10.1111/j.1469-7793.2001.0215b.x. PMID:11351029.
Moriscot, A.S., Baptista, I.L., Bogomolovas, J., Witt, C., Hirner, S., Granzier, H.,and Labeit, S. 2010. MuRF1 is a muscle fiber-type II associated factor andtogether with MuRF2 regulates type-II fiber trophicity and maintenance.J. Struct. Biol.170(2): 344–353. doi:10.1016/j.jsb.2010.02.001. PMID:20149877.
Nabuurs, C., Huijbregts, B., Wieringa, B., Hilbers, C.W., and Heerschap, A. 2010.31P saturation transfer spectroscopy predicts differential intracellular mac-romolecular association of ATP and ADP in skeletal muscle. J. Biol. Chem.285(51): 39588–39596. doi:10.1074/jbc.M110.164665. PMID:20884612.
Newsholme, E.A., and Crabtree, B. 1979. Theoretical principles in the approachesto control of metabolic pathways and their application to glycolysis in mus-cle. J. Mol. Cell. Cardiol.11(9): 839–856. doi:10.1016/0022-2828(79)90480-2.PMID:490659.
Newsholme, E.A., Beis, I., Leech, A.R., and Zammit, V.A. 1978. The role of creatinekinase and arginine kinase in muscle. Biochem. J.172: 533–537. PMID:210761.
Oudman, I., Clark, J.F., and Brewster, L.M. 2013. The effect of the creatine ana-logue beta-guanidinopropionic acid on energy metabolism: a systematic
Putman et al. 681
Appl. Physiol. Nutr. Metab. Downloaded from www.nrcresearchpress.com by University of Alberta on 07/12/16
Published by NRC Research Press
For personal use only.

review. PLoS One,8(1): e52879.doi:10.1371/journal.pone.0052879. PMID:23326362.
Pette, D., and Staron, R.S. 1997. Mammalian skeletal muscle fiber type transi-tions. Int. Rev. Cytol.170: 143–223. doi:10.1016/S0074-7696(08)61622-8. PMID:9002237.
Pette, D., and Vrbová, G. 1999. What does chronic electrical stimulation teach usabout muscle plasticity? Muscle Nerve,22(6): 666–677. doi:10.1002/(SICI)1097-4598(199906)22:6<666::AID-MUS3>3.0.CO;2-Z. PMID:10366220.
Pulido, S.M., Passaquin, A.C., Leijendekker, W.J., Challet, C., Wallimann, T., andRuegg, U.T. 1998. Creatine supplementation improves intracellular Ca2+han-dling and survival in mdx skeletal muscle cells. FEBS Lett.439(3): 357–362.doi:10.1016/S0014-5793(98)01399-4. PMID:9845353.
Putman, C.T., Jones, N.L., Hultman, E., Hollidge-Horvat, M.G., Bonen, A.,McConachie, D.R., and Heigenhauser, G.J. 1998. Effects of short-term sub-maximal training in humans on muscle metabolism in exercise. Am. J.Physiol. Endocrinol. Metab.275(1): E132–E139. PMID:9688884.
Putman, C.T., Kiricsi, M., Pearcey, J., MacLean, I.M., Bamford, J.A., Murdoch, G.K.,et al. 2003. AMPK activation increases uncoupling protein-3 expression andmitochondrial enzyme activities in rat muscle without fibre type transitions.J. Physiol.551(1): 169–178. doi:10.1113/jphysiol.2003.040691. PMID:12813156.
Putman, C.T., Dixon, W.T., Pearcey, J., MacLean, I.M., Jendral, M.J., Kiricsi, M.,et al. 2004. Chronic low-frequency stimulation up-regulates uncouplingprotein-3 in transforming rat fast-twitch skeletal muscle. Am. J. Physiol.Regul. Integr. Comp. Physiol.287(6): R1419–R1426. doi:10.1152/ajpregu.00421.2004. PMID:15308491.
Putman, C.T., Martins, K.J., Gallo, M.E., Lopaschuk, G.D., Pearcey, J.A.,MacLean, I.M., et al. 2007. Alpha-catalytic subunits of 5=AMP-activated pro-tein kinase display fiber-specific expression and are upregulated by chroniclow-frequency stimulation in rat muscle. Am. J. Physiol. Regul. Integr. Comp.Physiol.293(3): R1325–R1334. doi:10.1152/ajpregu.00609.2006. PMID:17553841.
Rabuel, C., Samuel, J.L., Lortat-Jacob, B., Marotte, F., Lanone, S., Keyser, C., et al.2010. Activation of the ubiquitin proteolytic pathway in human septic heartand diaphragm. Cardiovasc. Pathol.19(3): 158–164. doi:10.1016/j.carpath.2009.01.002. PMID:19375358.
Ren, J.M., Ohira, Y., Holloszy, J.O., Hämäläinen, N., Traub, I., and Pette, D. 1995.Effects of beta-guanidinopropionic acid-feeding on the patterns of myosinisoforms in rat fast-twitch muscle. Pflügers Arch.430(3): 389–393. doi:10.1007/BF00373914. PMID:7491263.
Rossi, A.E., Boncompagni, S., Wei, L., Protasi, F., and Dirksen, R.T. 2011. Differ-ential impact of mitochondrial positioning on mitochondrial Ca2+uptakeand Ca2+spark suppression in skeletal muscle. Am. J. Physiol Cell Physiol.301(5): C1128–C1139. doi:10.1152/ajpcell.00194.2011. PMID:21849670.
Roussel, D., Lhenry, F., Ecochard, L., Sempore, B., Rouanet, J.L., and Favier, R.2000. Differential effects of endurance training and creatine depletion onregional mitochondrialadaptations in rat skeletal muscle. Biochem. J.350(2): 547–553. doi:10.1042/0264-6021:3500547. PMID:10947970.
Sahlin, K., and Harris, R.C. 2011. The creatine kinase reaction: a simple reactionwith functional complexity. Amino Acids, 40(5): 1363–1367. doi:10.1007/s00726-011-0856-8. PMID:21394603.
Snow, R.J., and Murphy, R.M. 2003. Factors influencing creatine loading intohuman skeletal muscle. Exerc. Sport Sci. Rev.31(3): 154–158. doi:10.1097/00003677-200307000-00010. PMID:12882483.
Sultan, K.R., Dittrich, B.T., and Pette, D. 2000. Calpain activity in fast, slow,transforming, and regenerating skeletal muscles of rat. Am. J. Physiol. CellPhysiol.279: C639–C647. PMID:10942714.
Tokarska-Schlattner, M., Epand, R.F., Meiler, F., Zandomeneghi, G.,Neumann, D., Widmer, H.R., et al. 2012. Phosphocreatine interacts with phos-pholipids, affects membrane properties and exerts membrane-protectiveeffects. PLoS One,7(8): e43178. doi:10.1371/journal.pone.0043178. PMID:22912820.
Wallimann, T., Wyss, M., Brdiczka, D., Nicolay, K., and Eppenberger, H.M. 1992.Intracellular compartmentation, structure and function of creatine kinaseisozymes in tissues with high and fluctuating energy demands: the ‘phospho-creatine circuit’ for cellular energy homeostasis. Biochem. J.281: 21–40.PMID:1731757.
Wallimann, T., Tokarska-Schlattner, M., and Schlattner, U. 2011. The creatinekinase system and pleiotropic effects of creatine. Amino Acids,40(5): 1271–1296. doi:10.1007/s00726-011-0877-3. PMID:21448658.
682 Appl. Physiol. Nutr. Metab. Vol. 40, 2015
Appl. Physiol. Nutr. Metab. Downloaded from www.nrcresearchpress.com by University of Alberta on 07/12/16
Published by NRC Research Press
For personal use only.


![The Use of Creatine Monohydrate · 2021. 2. 25. · 4 Creatine Monohydrate Creapure [Fig. 1] Fig.1.Body-own Creatine synthesis and Creatine metabolism gradient by a sodium dependent](https://img.dokumen.tips/doc/110x75/6108e3bc190f19375e7bfe13/the-use-of-creatine-monohydrate-2021-2-25-4-creatine-monohydrate-creapure-fig.jpg)