Embed Size (px)
Citation preview
December 2020
Investor Presentation
2
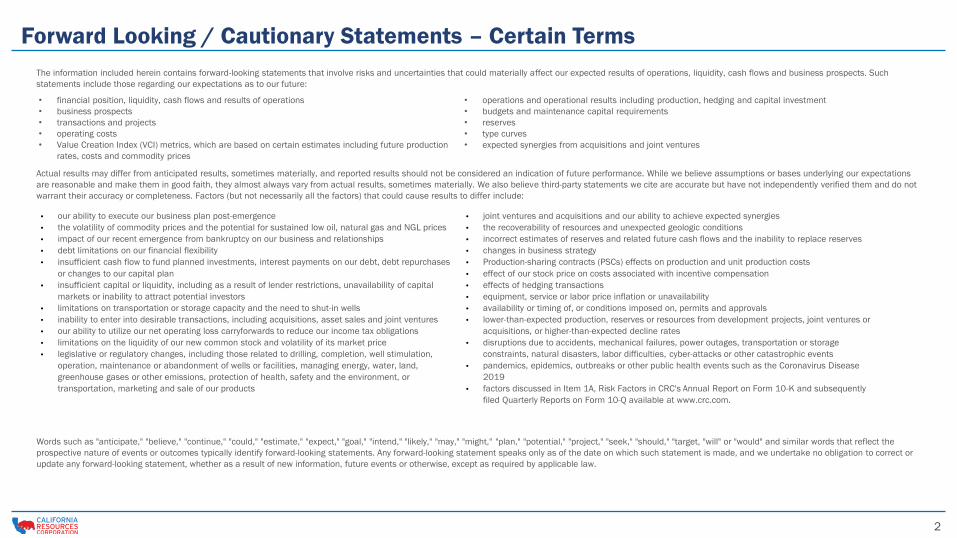
Forward Looking / Cautionary Statements – Certain Terms
The information included herein contains forward-looking statements that involve risks and uncertainties that could materially affect our expected results of operations, liquidity, cash flows and business prospects. Such
statements include those regarding our expectations as to our future:
Actual results may differ from anticipated results, sometimes materially, and reported results should not be considered an indication of future performance. While we believe assumptions or bases underlying our expectations
are reasonable and make them in good faith, they almost always vary from actual results, sometimes materially. We also believe third-party statements we cite are accurate but have not independently verified them and do not
warrant their accuracy or completeness. Factors (but not necessarily all the factors) that could cause results to differ include:
Words such as "anticipate," "believe," "continue," "could," "estimate," "expect," "goal," "intend," "likely," "may," "might," "plan," "potential," "project," "seek," "should," "target, "will" or "would" and similar words that reflect the
prospective nature of events or outcomes typically identify forward-looking statements. Any forward-looking statement speaks only as of the date on which such statement is made, and we undertake no obligation to correct or
update any forward-looking statement, whether as a result of new information, future events or otherwise, except as required by applicable law.
• financial position, liquidity, cash flows and results of operations
• business prospects
• transactions and projects
• operating costs
• Value Creation Index (VCI) metrics, which are based on certain estimates including future production
rates, costs and commodity prices
• operations and operational results including production, hedging and capital investment
• budgets and maintenance capital requirements
• reserves
• type curves
• expected synergies from acquisitions and joint ventures
• our ability to execute our business plan post-emergence
• the volatility of commodity prices and the potential for sustained low oil, natural gas and NGL prices
• impact of our recent emergence from bankruptcy on our business and relationships
• debt limitations on our financial flexibility
• insufficient cash flow to fund planned investments, interest payments on our debt, debt repurchases
or changes to our capital plan
• insufficient capital or liquidity, including as a result of lender restrictions, unavailability of capital
markets or inability to attract potential investors
• limitations on transportation or storage capacity and the need to shut-in wells
• inability to enter into desirable transactions, including acquisitions, asset sales and joint ventures
• our ability to utilize our net operating loss carryforwards to reduce our income tax obligations
• limitations on the liquidity of our new common stock and volatility of its market price
• legislative or regulatory changes, including those related to drilling, completion, well stimulation,
operation, maintenance or abandonment of wells or facilities, managing energy, water, land,
greenhouse gases or other emissions, protection of health, safety and the environment, or
transportation, marketing and sale of our products
• joint ventures and acquisitions and our ability to achieve expected synergies
• the recoverability of resources and unexpected geologic conditions
• incorrect estimates of reserves and related future cash flows and the inability to replace reserves
• changes in business strategy
• Production-sharing contracts (PSCs) effects on production and unit production costs
• effect of our stock price on costs associated with incentive compensation
• effects of hedging transactions
• equipment, service or labor price inflation or unavailability
• availability or timing of, or conditions imposed on, permits and approvals
• lower-than-expected production, reserves or resources from development projects, joint ventures or
acquisitions, or higher-than-expected decline rates
• disruptions due to accidents, mechanical failures, power outages, transportation or storage
constraints, natural disasters, labor difficulties, cyber-attacks or other catastrophic events
• pandemics, epidemics, outbreaks or other public health events such as the Coronavirus Disease
2019
• factors discussed in Item 1A, Risk Factors in CRC's Annual Report on Form 10-K and subsequently
filed Quarterly Reports on Form 10-Q available at www.crc.com.

3
Forward Looking / Cautionary Statements – Certain Terms (cont’d)
The market data and certain other statistical information used throughout this presentation includes industry data that are based on independent industry publications, government publications or other published independent
sources. Some data is also based on our good faith estimates. Although we believe these third-party sources are reliable as of their respective dates, we have not independently verified the accuracy or completeness of this
information. The industry in which we operate is subject to a high degree of uncertainty and risk due to a variety of factors that could cause results to differ materially from those expressed in these publications.
This presentation contains certain financial measures that are not prepared in accordance with generally accepted accounting principles (“GAAP”). These measures include (i) adjusted EBITDAX, (ii) PV-10, (iii) free cash flow, (iv)
leverage ratio and (v) net debt. See “Appendix” for the descriptions and reconciliations of these non-GAAP measures to the most directly comparable financial measures calculated in accordance with GAAP.
This presentation includes preliminary estimates of our proved reserve volumes and the related PV-10 of cash flows as of December 1, 2020, based on strip pricing. These reserves were prepared on the same basis as our
estimated proved reserves and PV-10 of cash flows based on SEC pricing, except for the use of pricing based on closing month futures prices as reported on the ICE Brent for oil and NGLs and NYMEX Henry Hub for natural gas on
December 1, 2020, without giving effect to derivative transactions. These reserves were prepared by our internal reserve engineers and have not been audited by our independent petroleum reserve engineers. There were
material changes to our December 1, 2020 reserve estimates when compared to our December 31, 2019 reserve estimates due to factors including (i) price-related impacts, (ii) the impact of reductions in 2020 capital budget
and volumes shut in during 2020, (iii) our post-emergence rebooking of proved undeveloped reserves under the SEC’s five-year rule and (iv) lower operating costs as of December 1, 2020 compared to December 31, 2019. There
could be further material changes to our 2020 estimated volumes as a result of our year-end annual reserve audit by our independent petroleum engineers.
See the Investor Relations page at www.crc.com for additional information about 3P reserves and other hydrocarbon resource quantities, PV-10 and standardized measure, finding and development (F&D) costs, recycle ratio
calculations, reserve replacement ratios, VCI, debt-adjusted shares calculations and drilling locations.
Note: For reference, the 12/1/2020 NYMEX Strip was used for ICE Brent and Gas. The average strip prices used were: $47.00/Bbl for oil for December 2020, $47.37 for 2021, $47.34 for 2022, $47.68 for 2023, $48.10 for
2024, $48.43 for 2025, and $48.87 for 2026 and thereafter held flat; and $2.87/MMBtu for natural gas for December 2020, $2.83 for 2021, $2.69 for 2022, $2.52 for 2023, $2.54 for 2024, $2.56 for 2025, and $2.55 for
2026 and thereafter held flat. Also taken into account currently prevailing pricing differentials for purposes of realized prices.
44
60% 13%
27%
70%
10%
20%
71%
9%
20%
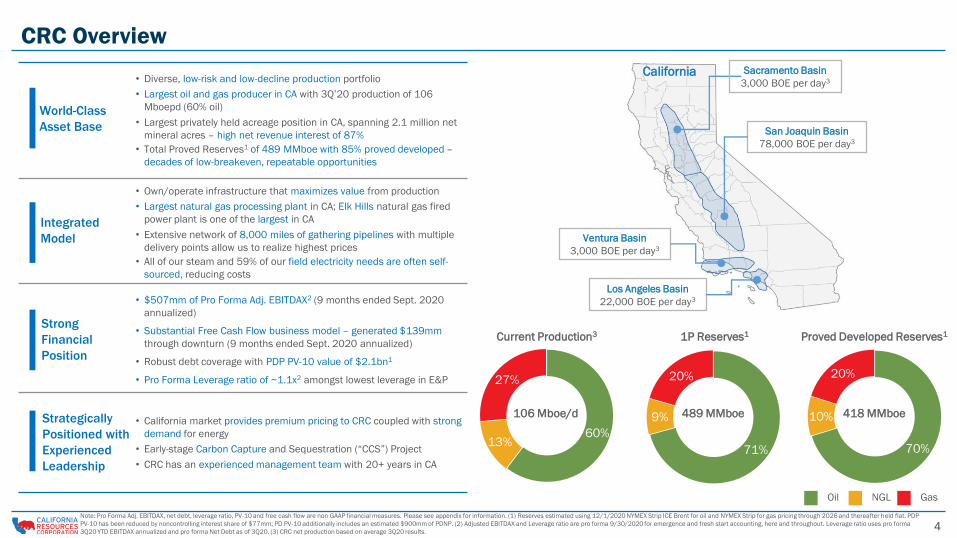
CRC Overview
• Diverse, low-risk and low-decline production portfolio
• Largest oil and gas producer in CA with 3Q’20 production of 106
Mboepd (60% oil)
• Largest privately held acreage position in CA, spanning 2.1 million net
mineral acres – high net revenue interest of 87%
• Total Proved Reserves1 of 489 MMboe with 85% proved developed –
decades of low-breakeven, repeatable opportunities
Note: Pro Forma Adj. EBITDAX, net debt, leverage ratio, PV-10 and free cash flow are non GAAP financial measures. Please see appendix for information. (1) Reserves estimated using 12/1/2020 NYMEX Strip ICE Brent for oil and NYMEX Strip for gas pricing through 2026 and thereafter held flat. PDP
PV-10 has been reduced by noncontrolling interest share of $77mm; PD PV-10 additionally includes an estimated $900mm of PDNP. (2) Adjusted EBITDAX and Leverage ratio are pro forma 9/30/2020 for emergence and fresh start accounting, here and throughout. Leverage ratio uses pro forma
3Q20 YTD EBITDAX annualized and pro forma Net Debt as of 3Q20. (3) CRC net production based on average 3Q20 results.
• Own/operate infrastructure that maximizes value from production
• Largest natural gas processing plant in CA; Elk Hills natural gas fired
power plant is one of the largest in CA
• Extensive network of 8,000 miles of gathering pipelines with multiple
delivery points allow us to realize highest prices
• All of our steam and 59% of our field electricity needs are often self-
sourced, reducing costs
• $507mm of Pro Forma Adj. EBITDAX2 (9 months ended Sept. 2020
annualized)
• Substantial Free Cash Flow business model – generated $139mm
through downturn (9 months ended Sept. 2020 annualized)
• Robust debt coverage with PDP PV-10 value of $2.1bn1
• Pro Forma Leverage ratio of ~1.1x2 amongst lowest leverage in E&P
• California market provides premium pricing to CRC coupled with strong
demand for energy
• Early-stage Carbon Capture and Sequestration (“CCS”) Project
• CRC has an experienced management team with 20+ years in CA
Oil GasNGL
106 Mboe/d 489 MMboe 418 MMboe
World-Class
Asset Base
Integrated
Model
Strong
Financial
Position
Strategically
Positioned with
Experienced
Leadership
Current Production3 1P Reserves1 Proved Developed Reserves1
Ventura Basin
3,000 BOE per day3
Los Angeles Basin
22,000 BOE per day3
San Joaquin Basin
78,000 BOE per day3
California Sacramento Basin
3,000 BOE per day3

55Source: Company filings, Enverus.
(1) 5-year (2015-2019) average decline rates; peers include: CLR, COG, CPE, DEN, EOG, FANG, HES, MRO, MUR, NBL, PDC, PE, QEP, RRC, SM, SWN, WLL, WPX and XEC. Maintenance capital per flowing barrel calculated using company disclosed annual maintenance capital
amounts as of 1Q20 over 2019 total liquids production. (2) Value Creation Index (VCI) is calculated by dividing the net present value of the project’s expected pre-tax cash flow over its life by the net present value of project investments, each using a 10% discount rate.
CRC
0%
5%
10%
15%
20%
25%
30%
35%
40%
45%
De
clin
e R
ate
1(%
)
CRC’S SUSTAINABLE FOUNDATION IS EXPECTED TO DELIVER
Sustainable Operational Excellence• Record Safety Performance
• Consistent Focus on Controlling Costs
• Quality Portfolio Built on Technological Innovation
Strong Financial Fundamentals• Pristine Balance Sheet Metrics
• Disciplined Capital Allocation
• Margin Maximization to Deliver Free Cash Flow
ESG Leadership• Culture Supports ESG Principles
• E&P Leading Sustainability Projects
• Foster and Emulate our Communities
Value Focus• Focus on Returns
• Value-Creation Index (VCI) Driven Projects(2)
• Diversified & Broad Energy Portfolio
CRC – New Foundation
CRC
$10
$12
$14
$16
$18
$20
$22
$24
$26
$28
$30
Ma
inte
na
nce
Ca
pit
al
($/fl
ow
ing b
arr
el)
New Strong
Balance Sheet
Flatter Organization
with Leaner Structure
Sustainable Operations
with Enduring Cost
Reductions
Peers CRC
Low Corporate Decline Rate1
Low Liquids Maintenance Capital1
6
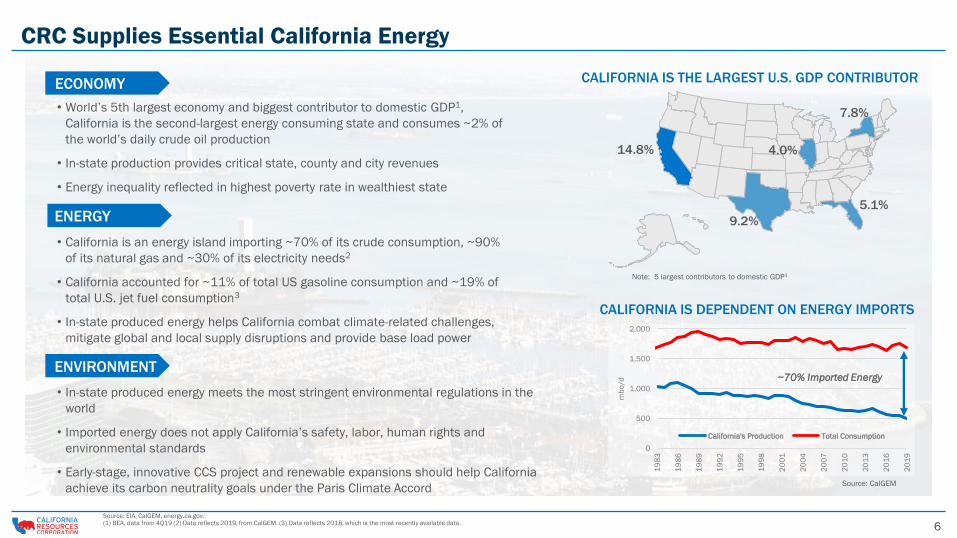
CRC Supplies Essential California Energy
14.8%
7.8%
9.2%
5.1%
4.0%
Note: 5 largest contributors to domestic GDP1
0
500
1,000
1,500
2,000
19
83
19
86
19
89
19
92
19
95
19
98
20
01
20
04
20
07
20
10
20
13
20
16
20
19
mb
o/d
California's Production Total Consumption
~70% Imported Energy
Source: CalGEM
• California is an energy island importing ~70% of its crude consumption, ~90%
of its natural gas and ~30% of its electricity needs2
• California accounted for ~11% of total US gasoline consumption and ~19% of
total U.S. jet fuel consumption3
• In-state produced energy helps California combat climate-related challenges,
mitigate global and local supply disruptions and provide base load power
ENERGY
• World’s 5th largest economy and biggest contributor to domestic GDP1,
California is the second-largest energy consuming state and consumes ~2% of
the world’s daily crude oil production
• In-state production provides critical state, county and city revenues
• Energy inequality reflected in highest poverty rate in wealthiest state
ECONOMY
• In-state produced energy meets the most stringent environmental regulations in the
world
• Imported energy does not apply California’s safety, labor, human rights and
environmental standards
• Early-stage, innovative CCS project and renewable expansions should help California
achieve its carbon neutrality goals under the Paris Climate Accord
ENVIRONMENT
CALIFORNIA IS THE LARGEST U.S. GDP CONTRIBUTOR
CALIFORNIA IS DEPENDENT ON ENERGY IMPORTS
Source: EIA, CalGEM, energy.ca.gov. (1) BEA, data from 4Q19 (2) Data reflects 2019, from CalGEM. (3) Data reflects 2018, which is the most recently available data.
77
- 5.00 10.00 15.00 20.00 25.00 30.00
Niobrara
Barnett
Anadarko - Woodford
Haynesville - Bossier
Utica
Marcellus Shale
Eagle Ford
Bakken
Permian (Wolfcamp + Spraberry)
California
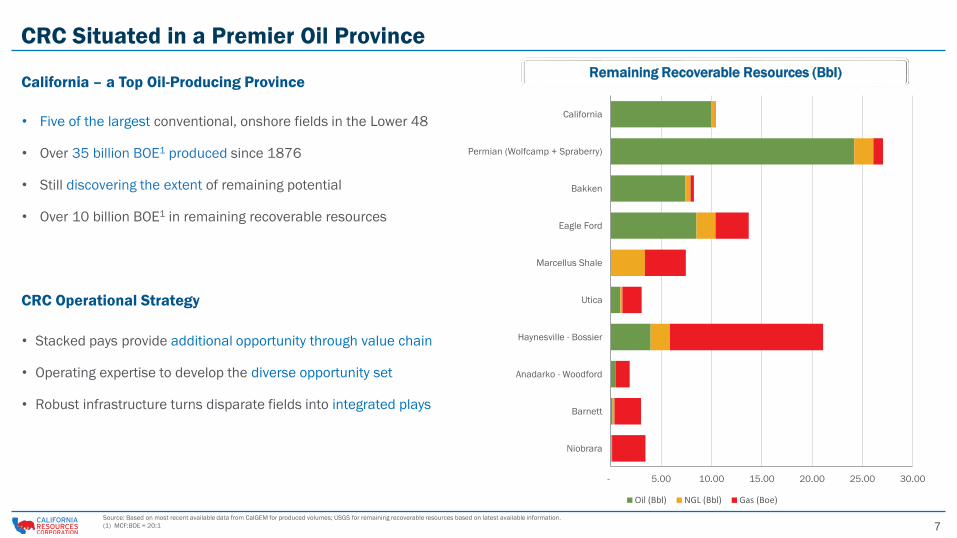
Remaining Recoverable Resources (BBOE)
Oil (Bbl) NGL (Bbl) Gas (Boe)
CRC Situated in a Premier Oil Province
• Five of the largest conventional, onshore fields in the Lower 48
• Over 35 billion BOE1 produced since 1876
• Still discovering the extent of remaining potential
• Over 10 billion BOE1 in remaining recoverable resources
California – a Top Oil-Producing Province
CRC Operational Strategy
• Stacked pays provide additional opportunity through value chain
• Operating expertise to develop the diverse opportunity set
• Robust infrastructure turns disparate fields into integrated plays
Source: Based on most recent available data from CalGEM for produced volumes; USGS for remaining recoverable resources based on latest available information.
(1) MCF:BOE = 20:1
Remaining Recoverable Resources (Bbl)
8
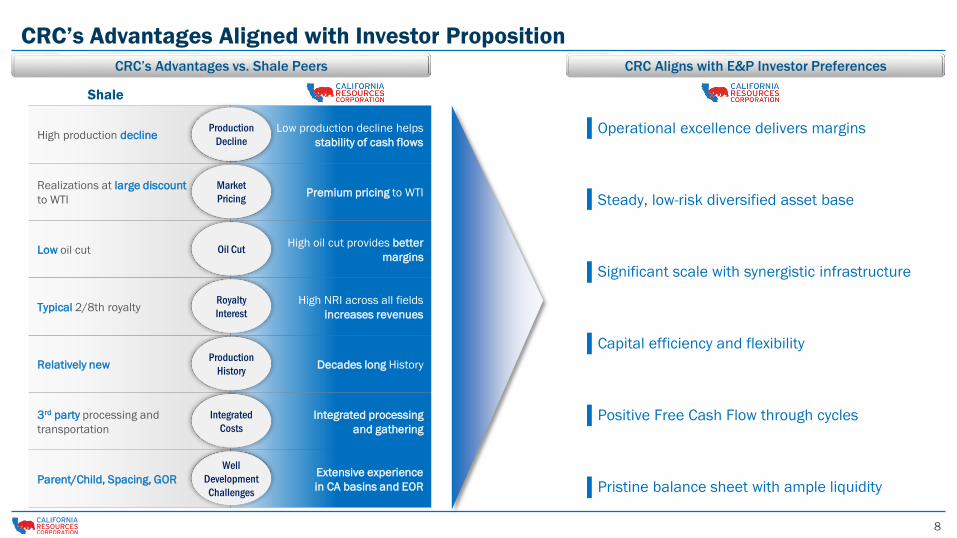
CRC’s Advantages Aligned with Investor Proposition
Shale
CRC’s Advantages vs. Shale Peers CRC Aligns with E&P Investor Preferences
Operational excellence delivers margins
Steady, low-risk diversified asset base
Pristine balance sheet with ample liquidity
Capital efficiency and flexibility
Positive Free Cash Flow through cycles
Significant scale with synergistic infrastructure
Integrated processing
and gathering
3rd party processing and
transportation
Low production decline helps
stability of cash flowsHigh production decline
Production
Decline
High oil cut provides better
marginsLow oil cut Oil Cut
Premium pricing to WTIRealizations at large discount
to WTI
Market
Pricing
Decades long HistoryRelatively newProduction
History
Extensive experience
in CA basins and EORParent/Child, Spacing, GOR
Integrated
Costs
High NRI across all fields
increases revenuesTypical 2/8th royalty
Royalty
Interest
Well
Development
Challenges
99
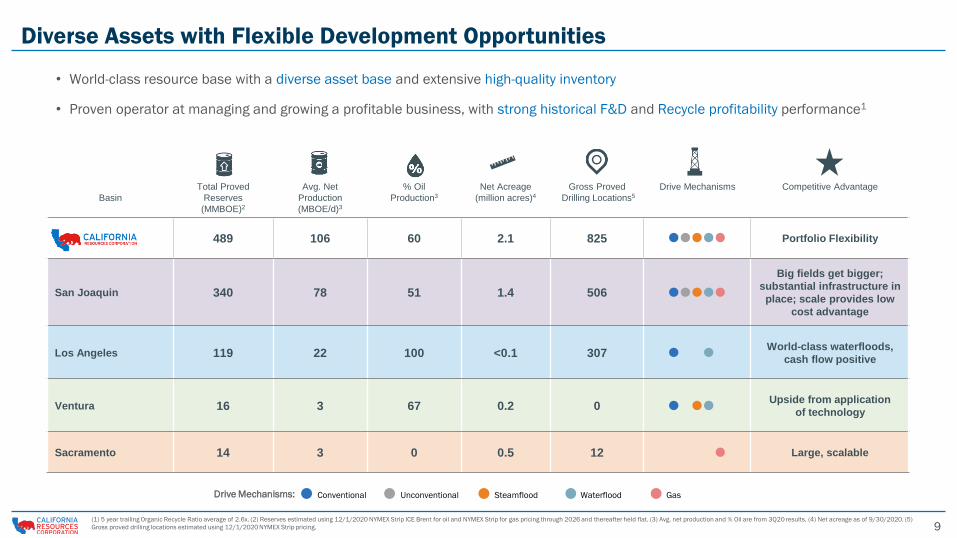
Diverse Assets with Flexible Development Opportunities
Basin
Total Proved
Reserves
(MMBOE)2
Avg. Net
Production
(MBOE/d)3
% Oil
Production3
Net Acreage
(million acres)4
Gross Proved
Drilling Locations5
Drive Mechanisms Competitive Advantage
489 106 60 2.1 825 Portfolio Flexibility
San Joaquin 340 78 51 1.4 506
Big fields get bigger;
substantial infrastructure in
place; scale provides low
cost advantage
Los Angeles 119 22 100 <0.1 307World-class waterfloods,
cash flow positive
Ventura 16 3 67 0.2 0Upside from application
of technology
Sacramento 14 3 0 0.5 12 Large, scalable
Drive Mechanisms: Conventional Unconventional Steamflood Waterflood Gas
(1) 5 year trailing Organic Recycle Ratio average of 2.6x. (2) Reserves estimated using 12/1/2020 NYMEX Strip ICE Brent for oil and NYMEX Strip for gas pricing through 2026 and thereafter held flat. (3) Avg. net production and % Oil are from 3Q20 results. (4) Net acreage as of 9/30/2020. (5)
Gross proved drilling locations estimated using 12/1/2020 NYMEX Strip pricing.
• World-class resource base with a diverse asset base and extensive high-quality inventory
• Proven operator at managing and growing a profitable business, with strong historical F&D and Recycle profitability performance1
10
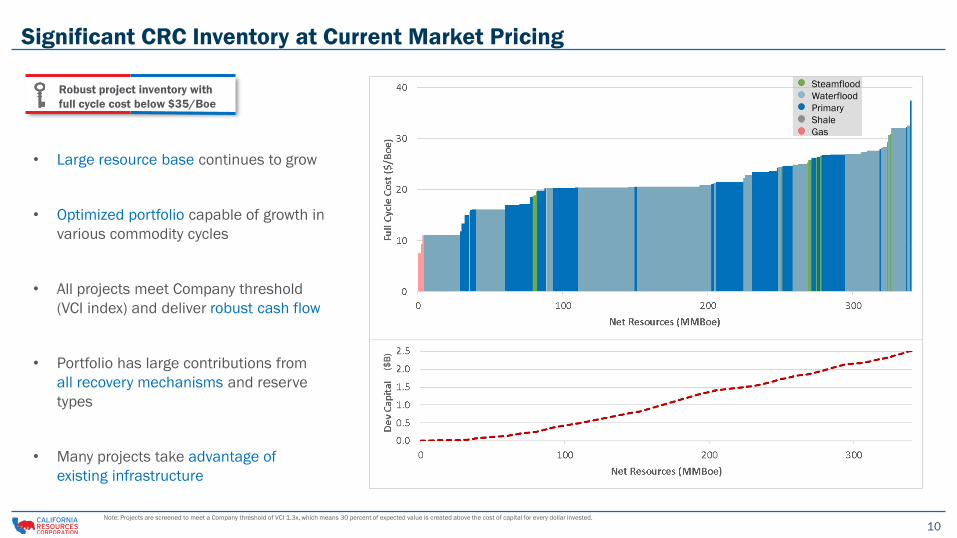
Significant CRC Inventory at Current Market Pricing
• Large resource base continues to grow
• Optimized portfolio capable of growth in
various commodity cycles
• All projects meet Company threshold
(VCI index) and deliver robust cash flow
• Portfolio has large contributions from
all recovery mechanisms and reserve
types
• Many projects take advantage of
existing infrastructure
Steamflood
Waterflood
Primary
Shale
Gas
($B
)
Note: Projects are screened to meet a Company threshold of VCI 1.3x, which means 30 percent of expected value is created above the cost of capital for every dollar invested.
Robust project inventory with
full cycle cost below $35/Boe

11
250500
1000
2014
2015
2016 20172
20182
20192
$600
$700
$800
$900
$1,000
$1,100
$1,200
$1,300
$1,400
$1,500
$1,600
$20 $40 $60 $80 $100 $120LO
E a
nd
G&
A
($M
M)
Brent $/Bbl
$600
$750
$900
$1,050
$1,200
$1,350
$1,500
Margin Improvement
• Reduced costs by $300+ million1 – majority will be sustainable
savings in production and G&A, and continuing cost optimization
• Actively managing fields and capital investment in response to
commodity prices
• Hedging strategy to protect medium-term margins
• Flexible operations, owned and controlled infrastructure and shallow
base decline allow for quick response to commodity prices while
preserving value
Cost Reductions
• Driving sustainable savings and targeting additional $20 million in
cost reductions
• Significant headcount efficiencies since spin-off (~50%), leaner
model with technical staff and streamlined field operations
• Organization retooled for $40 Brent
Maximize Margins and Free Cash Flow through Active Cost Management
Mar-20Apr-20
May-20
Jun-20
Jul-20 Aug-20
Sep-20
$0
$5
$10
$15
$20
$25
$30
$15 $20 $25 $30 $35 $40Op
era
tin
g M
arg
in (
$/B
oe
)
Realized Blended Price ($/Boe)
2014-2019 Data Points 2020 Data Points
(1) Reflects annualized savings in Production and G&A when comparing 3-months ended production and G&A expenses in 3Q19 vs. 3Q20. (2) Includes JV capital. (3) Represents 3Q20 YTD actuals annualized.
Capital
Investment
Scale ($MM)
20202,3
Operating Margins Higher At Similar Realized Prices
Improved Cost Base
12
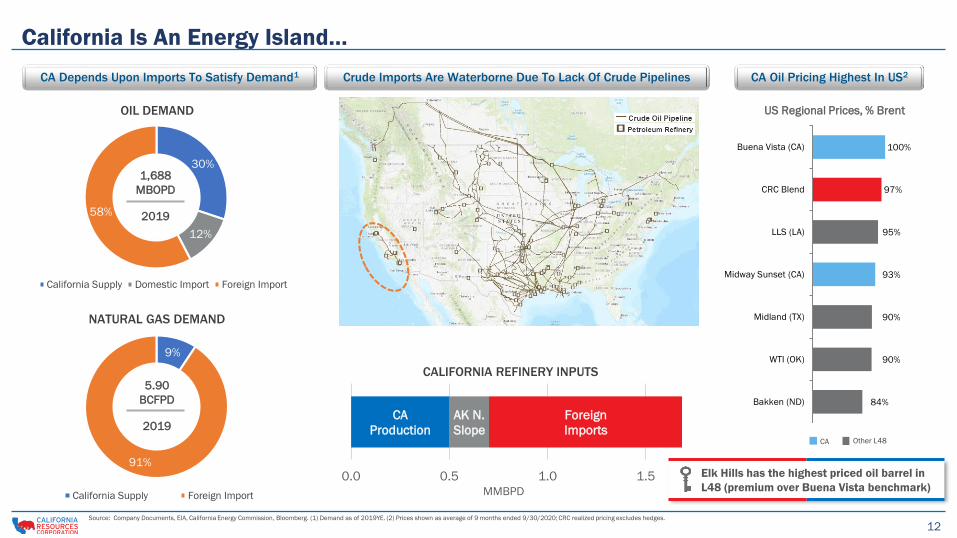
Elk Hills has the highest priced oil barrel in
L48 (premium over Buena Vista benchmark)
30%
12%
58%
California Supply Domestic Import Foreign Import
9%
91%
California Supply Foreign Import
California Is An Energy Island…
Source: Company Documents, EIA, California Energy Commission, Bloomberg. (1) Demand as of 2019YE. (2) Prices shown as average of 9 months ended 9/30/2020; CRC realized pricing excludes hedges.
US Regional Prices, % Brent
CA
Production
AK N.
Slope
Foreign
Imports
0.0 0.5 1.0 1.5
MMBPD
OIL DEMAND
1,688
MBOPD
2019
NATURAL GAS DEMAND
5.90
BCFPD
2019
CA Depends Upon Imports To Satisfy Demand1 Crude Imports Are Waterborne Due To Lack Of Crude Pipelines CA Oil Pricing Highest In US2
CALIFORNIA REFINERY INPUTS
CA Other L48
84%
90%
90%
93%
95%
97%
100%
Bakken (ND)
WTI (OK)
Midland (TX)
Midway Sunset (CA)
LLS (LA)
CRC Blend
Buena Vista (CA)
13
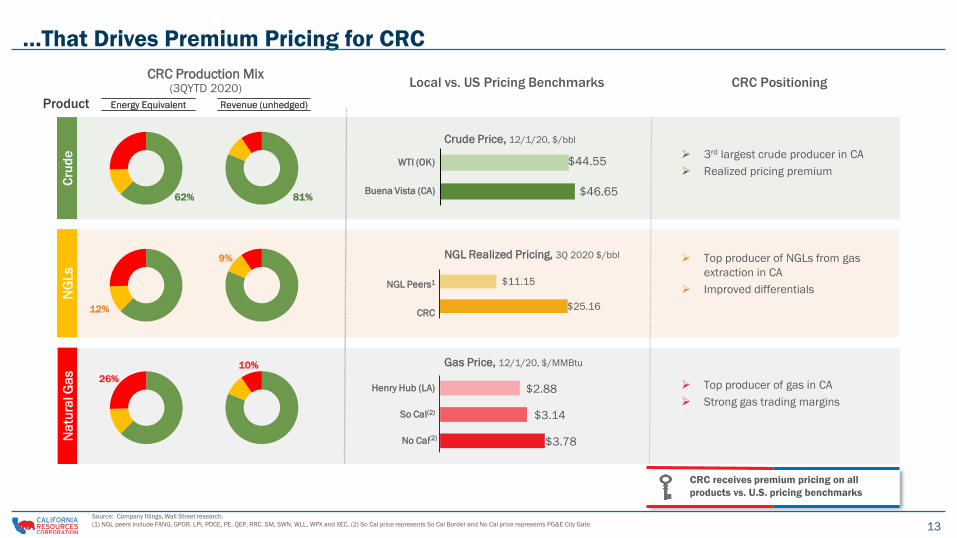
$44.55
$46.65
$11.15
$25.16
…That Drives Premium Pricing for CRC
Product
CRC Production Mix(3QYTD 2020) Local vs. US Pricing Benchmarks CRC Positioning
NGL Peers1
CRC
WTI (OK)
Buena Vista (CA)
Henry Hub (LA)
So Cal(2)
No Cal
NGL Realized Pricing, 3Q 2020 $/bbl
Gas Price, 12/1/20, $/MMBtu
Source: Company filings, Wall Street research.
(1) NGL peers include FANG, GPOR, LPI, PDCE, PE, QEP, RRC, SM, SWN, WLL, WPX and XEC. (2) So Cal price represents So Cal Border and No Cal price represents PG&E City Gate.
Energy Equivalent Revenue (unhedged)
Crude Price, 12/1/20, $/bbl
3rd largest crude producer in CA
Realized pricing premium
Top producer of NGLs from gas
extraction in CA
Improved differentials
Top producer of gas in CA
Strong gas trading margins
CRC receives premium pricing on all
products vs. U.S. pricing benchmarks
$3.78
$3.14
$2.88
Na
tura
l Ga
s
62%
26%
12%
NG
Ls
Energy Equivalent Revenue (unhedged)
81%
9%
10%
Cru
de
(2)
1414
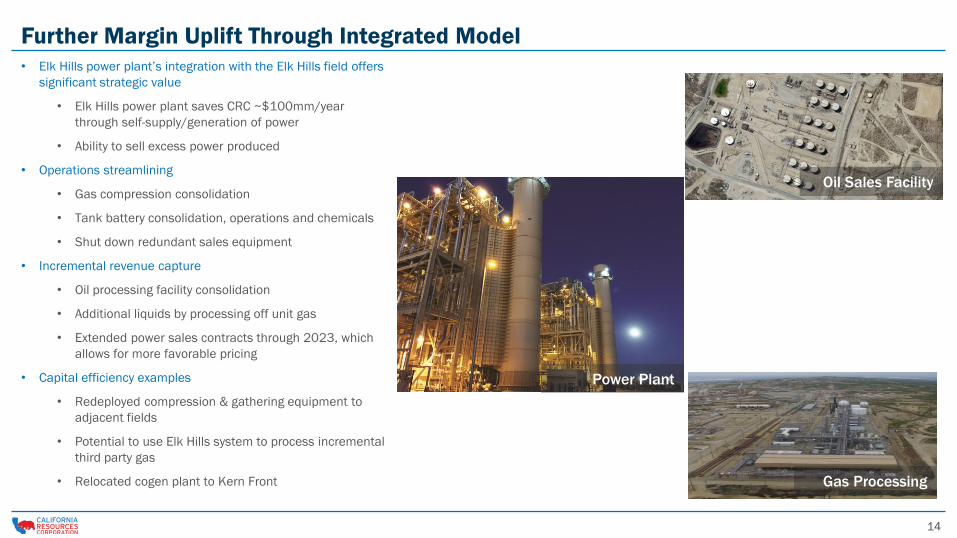
Further Margin Uplift Through Integrated Model
• Elk Hills power plant’s integration with the Elk Hills field offers
significant strategic value
• Elk Hills power plant saves CRC ~$100mm/year
through self-supply/generation of power
• Ability to sell excess power produced
• Operations streamlining
• Gas compression consolidation
• Tank battery consolidation, operations and chemicals
• Shut down redundant sales equipment
• Incremental revenue capture
• Oil processing facility consolidation
• Additional liquids by processing off unit gas
• Extended power sales contracts through 2023, which
allows for more favorable pricing
• Capital efficiency examples
• Redeployed compression & gathering equipment to
adjacent fields
• Potential to use Elk Hills system to process incremental
third party gas
• Relocated cogen plant to Kern Front Gas Processing
Oil Sales Facility
Power Plant
15
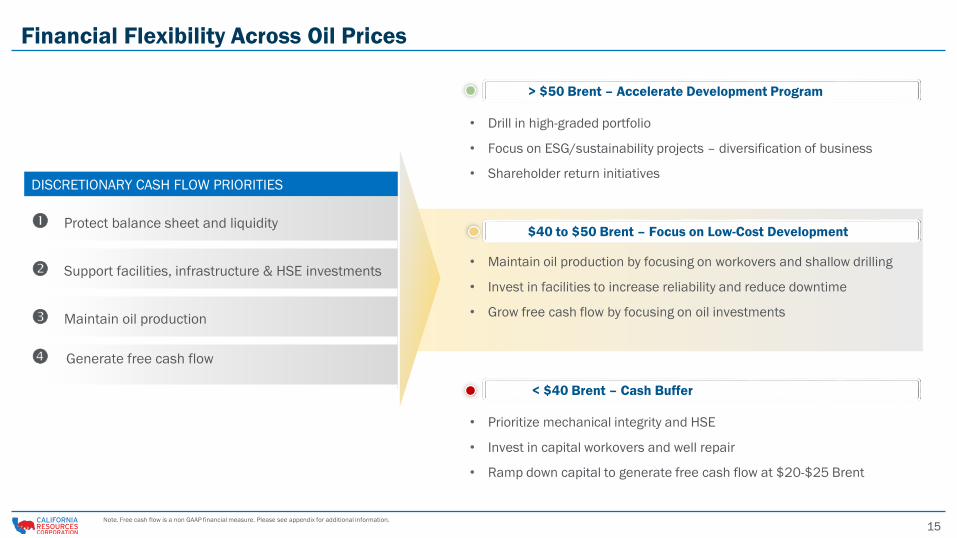
• Prioritize mechanical integrity and HSE
• Invest in capital workovers and well repair
• Ramp down capital to generate free cash flow at $20-$25 Brent
Financial Flexibility Across Oil Prices
DISCRETIONARY CASH FLOW PRIORITIES
Protect balance sheet and liquidity
Support facilities, infrastructure & HSE investments
Maintain oil production
Generate free cash flow
• Maintain oil production by focusing on workovers and shallow drilling
• Invest in facilities to increase reliability and reduce downtime
• Grow free cash flow by focusing on oil investments
• Drill in high-graded portfolio
• Focus on ESG/sustainability projects – diversification of business
• Shareholder return initiatives
> $50 Brent – Accelerate Development Program
$40 to $50 Brent – Focus on Low-Cost Development
< $40 Brent – Cash Buffer
Note. Free cash flow is a non GAAP financial measure. Please see appendix for additional information.
16
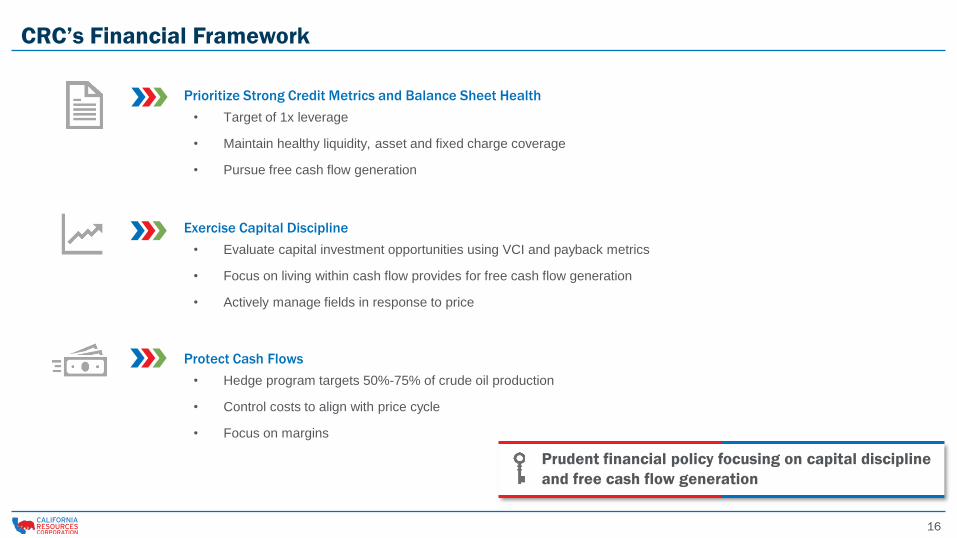
Prioritize Strong Credit Metrics and Balance Sheet Health
• Target of 1x leverage
• Maintain healthy liquidity, asset and fixed charge coverage
• Pursue free cash flow generation
Exercise Capital Discipline
• Evaluate capital investment opportunities using VCI and payback metrics
• Focus on living within cash flow provides for free cash flow generation
• Actively manage fields in response to price
Protect Cash Flows
• Hedge program targets 50%-75% of crude oil production
• Control costs to align with price cycle
• Focus on margins
Prudent financial policy focusing on capital discipline
and free cash flow generation
CRC’s Financial Framework
1717
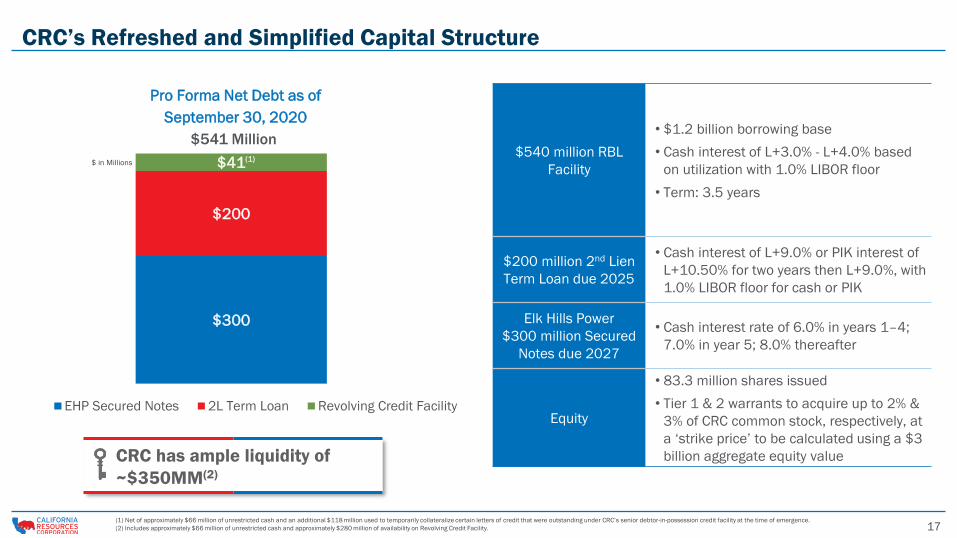
$300
$200
$41
$0
$100
$200
$300
$400
$500
$600
EHP Secured Notes 2L Term Loan Revolving Credit Facility
CRC’s Refreshed and Simplified Capital Structure
$540 million RBL
Facility
• $1.2 billion borrowing base
• Cash interest of L+3.0% - L+4.0% based
on utilization with 1.0% LIBOR floor
• Term: 3.5 years
$200 million 2nd Lien
Term Loan due 2025
• Cash interest of L+9.0% or PIK interest of
L+10.50% for two years then L+9.0%, with
1.0% LIBOR floor for cash or PIK
Elk Hills Power
$300 million Secured
Notes due 2027
• Cash interest rate of 6.0% in years 1–4;
7.0% in year 5; 8.0% thereafter
Equity
• 83.3 million shares issued
• Tier 1 & 2 warrants to acquire up to 2% &
3% of CRC common stock, respectively, at
a ‘strike price’ to be calculated using a $3
billion aggregate equity value
$541 Million
(1) Net of approximately $66 million of unrestricted cash and an additional $118 million used to temporarily collateralize certain letters of credit that were outstanding under CRC’s senior debtor-in-possession credit facility at the time of emergence.
(2) Includes approximately $66 million of unrestricted cash and approximately $280 million of availability on Revolving Credit Facility.
$ in Millions
Pro Forma Net Debt as of
September 30, 2020
(1)
CRC has ample liquidity of
~$350MM(2)
18
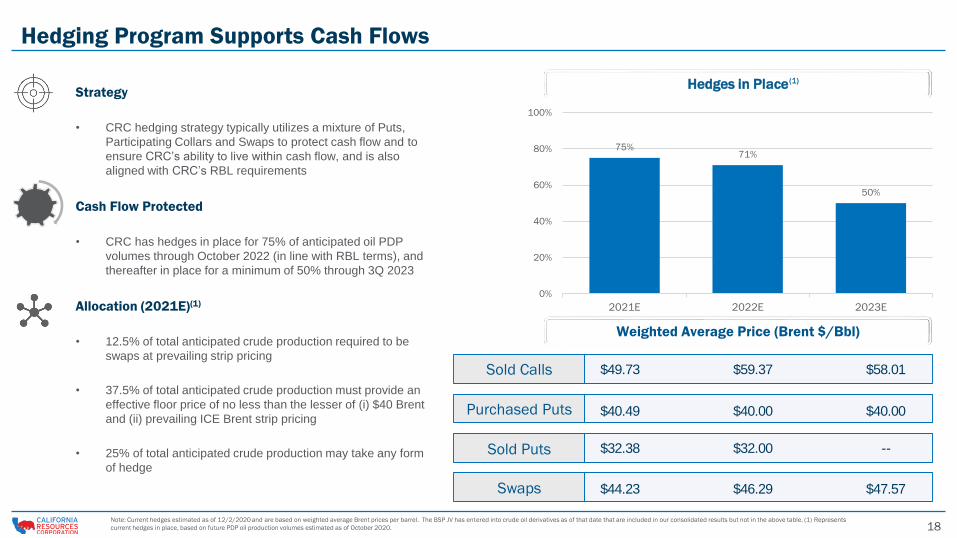
Hedges in Place
Hedging Program Supports Cash Flows
Note: Current hedges estimated as of 12/2/2020 and are based on weighted average Brent prices per barrel. The BSP JV has entered into crude oil derivatives as of that date that are included in our consolidated results but not in the above table. (1) Represents
current hedges in place, based on future PDP oil production volumes estimated as of October 2020.
Strategy
• CRC hedging strategy typically utilizes a mixture of Puts,
Participating Collars and Swaps to protect cash flow and to
ensure CRC’s ability to live within cash flow, and is also
aligned with CRC’s RBL requirements
Cash Flow Protected
• CRC has hedges in place for 75% of anticipated oil PDP
volumes through October 2022 (in line with RBL terms), and
thereafter in place for a minimum of 50% through 3Q 2023
Allocation (2021E)(1)
• 12.5% of total anticipated crude production required to be
swaps at prevailing strip pricing
• 37.5% of total anticipated crude production must provide an
effective floor price of no less than the lesser of (i) $40 Brent
and (ii) prevailing ICE Brent strip pricing
• 25% of total anticipated crude production may take any form
of hedge
75% 71%
50%
0%
20%
40%
60%
80%
100%
2021E 2022E 2023E
Sold Calls
Weighted Average Price (Brent $/Bbl)
Purchased Puts
Swaps
$49.73 $59.37 $58.01
$40.49 $40.00 $40.00
$44.23 $46.29 $47.57
Sold Puts $32.38 $32.00 --
(1)
Weighted Average Price (Brent $/Bbl)
A

19
Leading Financial Metrics
Production (Q3’20, Mboepd) Adj. EBITDAX (3Q20 YTD Annualized, $mm)2Total Proved Reserves (2019YE, MMBoe)
Total Debt / Enterprise Value (3Q20, %)3 Leverage Ratio (x)4Total Proved Reserves PV-10 (2019YE) / Total
Debt (3Q20, x)
CRC CRC
CRC CRC CRC
Gas PeersOil Peers
CRC
Source: Company filings, FactSet as of 12/4/2020. Oil peers include BRY, MGY, MTDR, MUR, PDCE, PE and WPX; Gas peers include CNX and CRK. (1) Reserves estimated using 12/1/2020 NYMEX Strip pricing. SEC YE 2019 PV-10 used for benchmarking given available latest data – average benchmark Brent was $63.15 per
barrel and average NYMEX Henry Hub was $2.58 per MMBTU. (2) For CRC, showing pro forma Adj. EBITDAX per Appendix. (3) Enterprise value comprises of equity value (as of 12/4) and total debt/other. For CRC, total debt/other uses pro forma debt at emergence of $607mm, post-emergence share count, cash of $66mm,
and $77mm of noncontrolling interest. (4) Represents 3Q20 Net Debt / 3Q20 YTD Annualized Adj. EBITDAX. For CRC, reflects pro forma leverage and Adj. EBITDAX per Appendix.
106
0
60
120
180
240
21%
0%
20%
40%
60%
80% 11.2x
0.0x
3.0x
6.0x
9.0x
12.0x
644
0
400
800
1,200
1,600
1.1x
0.0x
1.0x
2.0x
3.0x
4.0x
$507
$0
$500
$1,000
$1,500
$2,000CRC Total Proved Reserves of
489 MMboe based on
12/1/2020 Strip1
CRC PV-10 coverage of 5.6x, based
on Total Proved Reserves of 489
MMboe on a 12/1/2020 Strip
basis1
2020
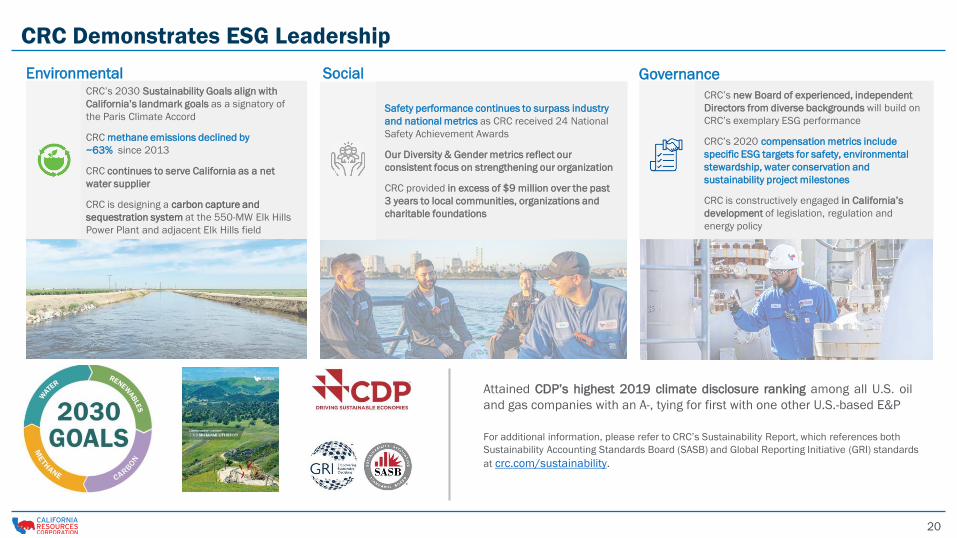
CRC’s 2030 Sustainability Goals align with
California’s landmark goals as a signatory of
the Paris Climate Accord
CRC methane emissions declined by
~63% since 2013
CRC continues to serve California as a net
water supplier
CRC is designing a carbon capture and
sequestration system at the 550-MW Elk Hills
Power Plant and adjacent Elk Hills field
CRC Demonstrates ESG Leadership
Safety performance continues to surpass industry
and national metrics as CRC received 24 National
Safety Achievement Awards
Our Diversity & Gender metrics reflect our
consistent focus on strengthening our organization
CRC provided in excess of $9 million over the past
3 years to local communities, organizations and
charitable foundations
CRC’s new Board of experienced, independent
Directors from diverse backgrounds will build on
CRC’s exemplary ESG performance
CRC’s 2020 compensation metrics include
specific ESG targets for safety, environmental
stewardship, water conservation and
sustainability project milestones
CRC is constructively engaged in California’s
development of legislation, regulation and
energy policy
Attained CDP’s highest 2019 climate disclosure ranking among all U.S. oil
and gas companies with an A-, tying for first with one other U.S.-based E&P
For additional information, please refer to CRC’s Sustainability Report, which references both
Sustainability Accounting Standards Board (SASB) and Global Reporting Initiative (GRI) standards
at crc.com/sustainability.
Environmental Social Governance
2121
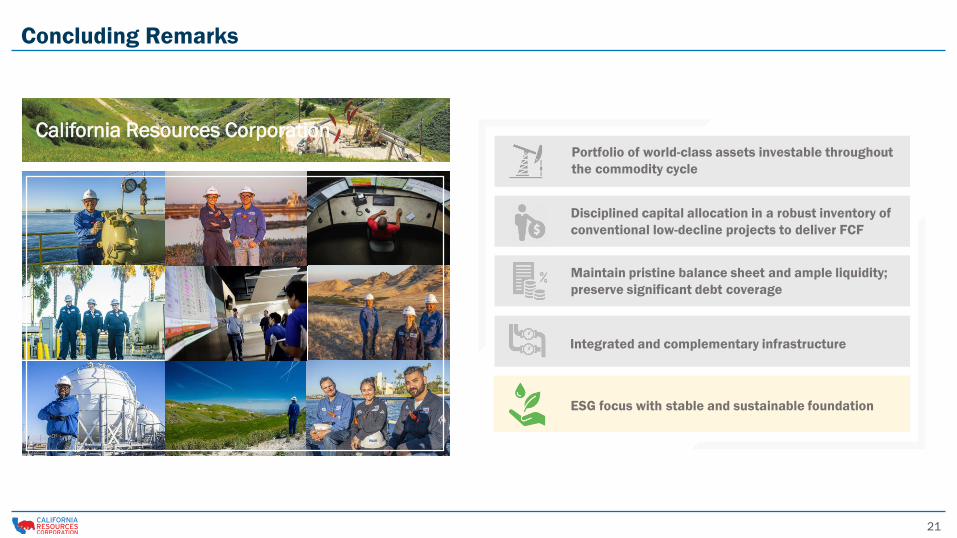
Concluding Remarks
California Resources Corporation
Integrated and complementary infrastructure
Portfolio of world-class assets investable throughout
the commodity cycle
ESG focus with stable and sustainable foundation
Disciplined capital allocation in a robust inventory of
conventional low-decline projects to deliver FCF
Maintain pristine balance sheet and ample liquidity;
preserve significant debt coverage

22
Appendix
23
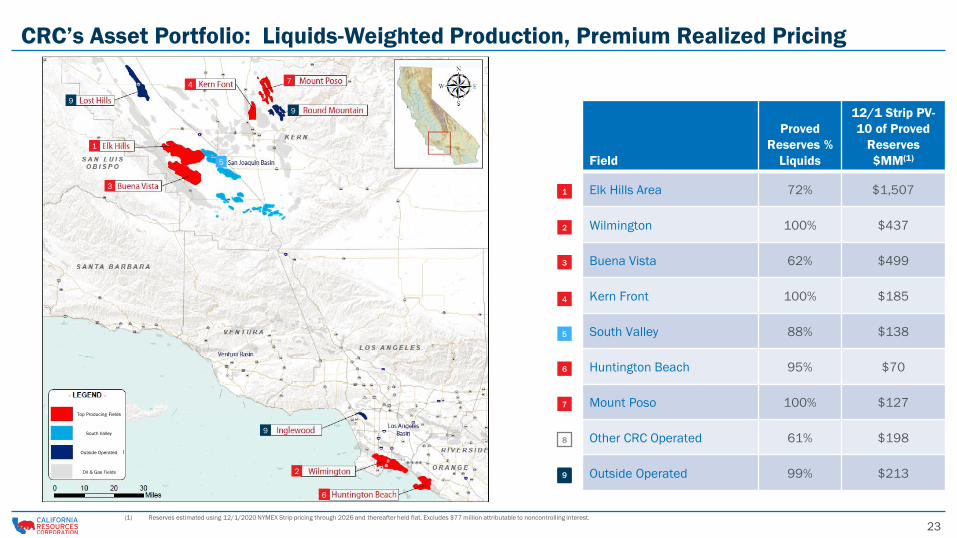
CRC’s Asset Portfolio: Liquids-Weighted Production, Premium Realized Pricing
1
2
3
4
5
7
9
9
1
9
9
6
1
2
3
4
5
6
7
9
8
Field
Proved
Reserves %
Liquids
12/1 Strip PV-
10 of Proved
Reserves
$MM(1)
Elk Hills Area 72% $1,507
Wilmington 100% $437
Buena Vista 62% $499
Kern Front 100% $185
South Valley 88% $138
Huntington Beach 95% $70
Mount Poso 100% $127
Other CRC Operated 61% $198
Outside Operated 99% $213
(1) Reserves estimated using 12/1/2020 NYMEX Strip pricing through 2026 and thereafter held flat. Excludes $77 million attributable to noncontrolling interest.
South Valley
Top Producing Fields
Outside Operated
Oil & Gas Fields
24
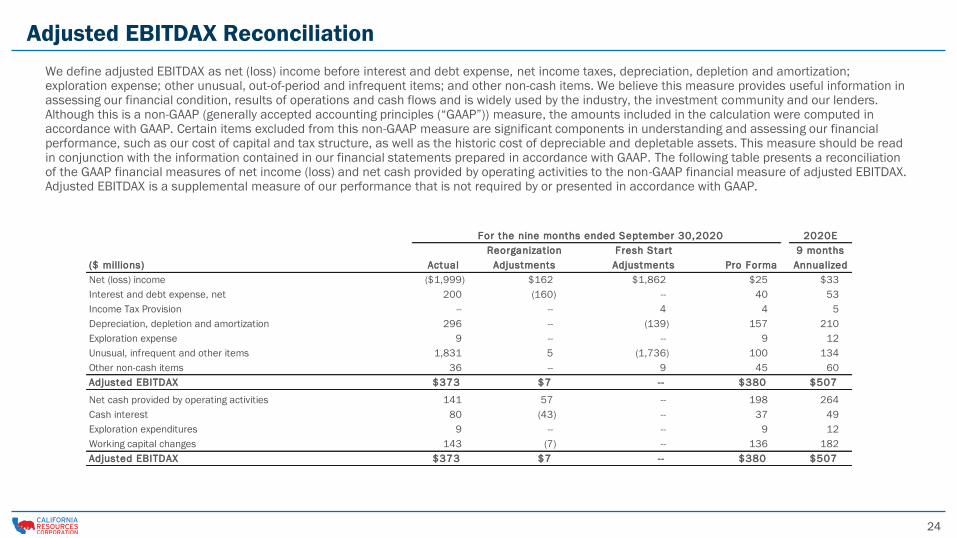
For the nine months ended September 30,2020 2020E
Reorganization Fresh Start 9 months
($ millions) Actual Adjustments Adjustments Pro Forma Annualized
Net (loss) income ($1,999) $162 $1,862 $25 $33
Interest and debt expense, net 200 (160) -- 40 53
Income Tax Provision -- -- 4 4 5
Depreciation, depletion and amortization 296 -- (139) 157 210
Exploration expense 9 -- -- 9 12
Unusual, infrequent and other items 1,831 5 (1,736) 100 134
Other non-cash items 36 -- 9 45 60
Adjusted EBITDAX $373 $7 -- $380 $507 0
Net cash provided by operating activities 141 57 -- 198 264
Cash interest 80 (43) -- 37 49
Exploration expenditures 9 -- -- 9 12
Working capital changes 143 (7) -- 136 182
Adjusted EBITDAX $373 $7 -- $380 $507
Adjusted EBITDAX Reconciliation
We define adjusted EBITDAX as net (loss) income before interest and debt expense, net income taxes, depreciation, depletion and amortization; exploration expense; other unusual, out-of-period and infrequent items; and other non-cash items. We believe this measure provides useful information in assessing our financial condition, results of operations and cash flows and is widely used by the industry, the investment community and our lenders. Although this is a non-GAAP (generally accepted accounting principles (“GAAP”)) measure, the amounts included in the calculation were computed in accordance with GAAP. Certain items excluded from this non-GAAP measure are significant components in understanding and assessing our financial performance, such as our cost of capital and tax structure, as well as the historic cost of depreciable and depletable assets. This measure should be read in conjunction with the information contained in our financial statements prepared in accordance with GAAP. The following table presents a reconciliation of the GAAP financial measures of net income (loss) and net cash provided by operating activities to the non-GAAP financial measure of adjusted EBITDAX. Adjusted EBITDAX is a supplemental measure of our performance that is not required by or presented in accordance with GAAP.

25
($ millions) Actual Pro Forma
Face value of debt $733 $725
Cash used to collateralize letters of credit — (118)
Available cash (98) (66)
Net debt $635 $541
Annualized adjusted EBITDAX 497 507
Leverage ratio 1.3x 1.1x
Nine Months Ended September 30,2020
We calculate the leverage ratio by dividing net debt by adjusted EBITDAX for the applicable period. We define net debt as the face value of our debt less cash used to collateralize letters of credit outstanding and available cash. We believe the leverage ratio is an important metric of the operational and financial health of our Company and is useful to investors as an indicator of our ability to incur additional debt and to service our existing debt. The following table presents a reconciliation of our leverage ratio, both on a historical basis and after giving effect to the pro forma adjustments. Leverage ratio is a supplemental measure of our performance that is not required by or presented in accordance with U.S. generally accepted accounting principles (“GAAP”).
Other Reconciliations
Management uses free cash flow, which is defined by us as net cash provided by operating activities less capital investments, as a measure of liquidity. The following table presents a reconciliation of our net cash provided by operating activities to free cash flow. Free cash flow is a supplemental measure of our performance that is not required by or presented in accordance with U.S. generally accepted accounting principles (“GAAP”).
Leverage and Net Debt
Free Cash Flow
($ millions) Actual Annualized
Net cash provided by operating activities $141 $188
Capital Investments (37) (49)
Free cash f low 104 139
BSP funded capital -- --
Free cash f low, after internally funded capital $104 $139
Nine Months Ended September 30,2020
26
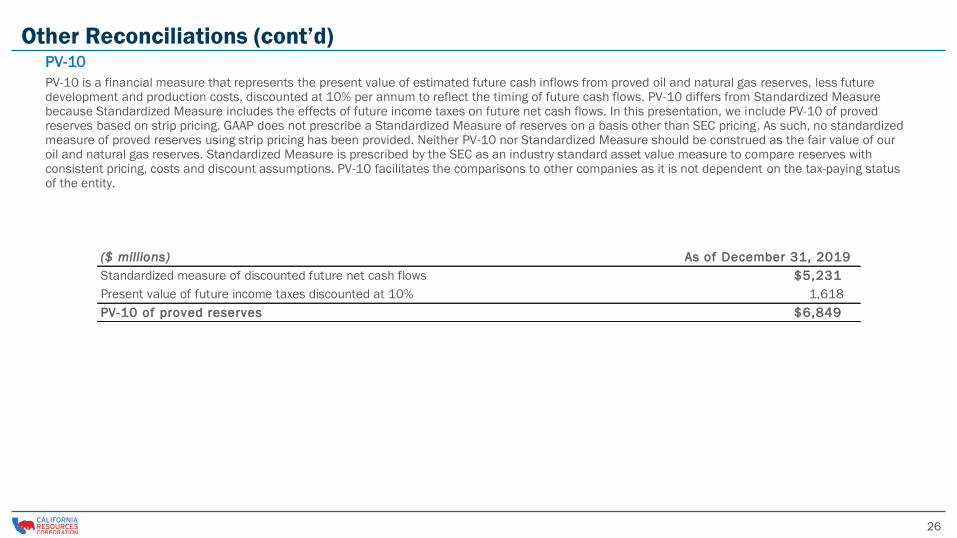
PV-10 is a financial measure that represents the present value of estimated future cash inflows from proved oil and natural gas reserves, less future development and production costs, discounted at 10% per annum to reflect the timing of future cash flows. PV-10 differs from Standardized Measure because Standardized Measure includes the effects of future income taxes on future net cash flows. In this presentation, we include PV-10 of proved reserves based on strip pricing. GAAP does not prescribe a Standardized Measure of reserves on a basis other than SEC pricing. As such, no standardized measure of proved reserves using strip pricing has been provided. Neither PV-10 nor Standardized Measure should be construed as the fair value of our oil and natural gas reserves. Standardized Measure is prescribed by the SEC as an industry standard asset value measure to compare reserves with consistent pricing, costs and discount assumptions. PV-10 facilitates the comparisons to other companies as it is not dependent on the tax-paying status of the entity.
Other Reconciliations (cont’d) PV-10
($ millions) As of December 31, 2019
Standardized measure of discounted future net cash flows $5,231
Present value of future income taxes discounted at 10% 1,618
PV-10 of proved reserves $6,849