Embed Size (px)
Citation preview
Crawling and Social Ranking
CSCI 572 Class Project
Huy PhamPhD @ USC
April 28th, 2011

Part 1: Crawling and USC Servers’ Analysis
• Written in Java• Each Crawler has 30 threads that work in
parallel – multi-threading programming• Shared resources are synchronized• Java Sockets are used to make Crawlers
communicate and exchange data• 3 crawlers: USC, Viterbi and LAS (Dornsife)

Warning MessageMessage from USC regarding the traffic during the run
• Your dynamic2-216-072 host had significant network HTTP activity between 10:14 and 10:24. It connected to 197 hosts, with 38900 port 80/HTTP connections, and 1000 connections a second.
• We suspect that your host may be compromised, or may be misconfigured.
• If so, you may have to reinstall your system, install updated service packs, and any relevant security patchs, as other backdoors may have been installed by hackers. If your host causes network problems, it will be blocked.
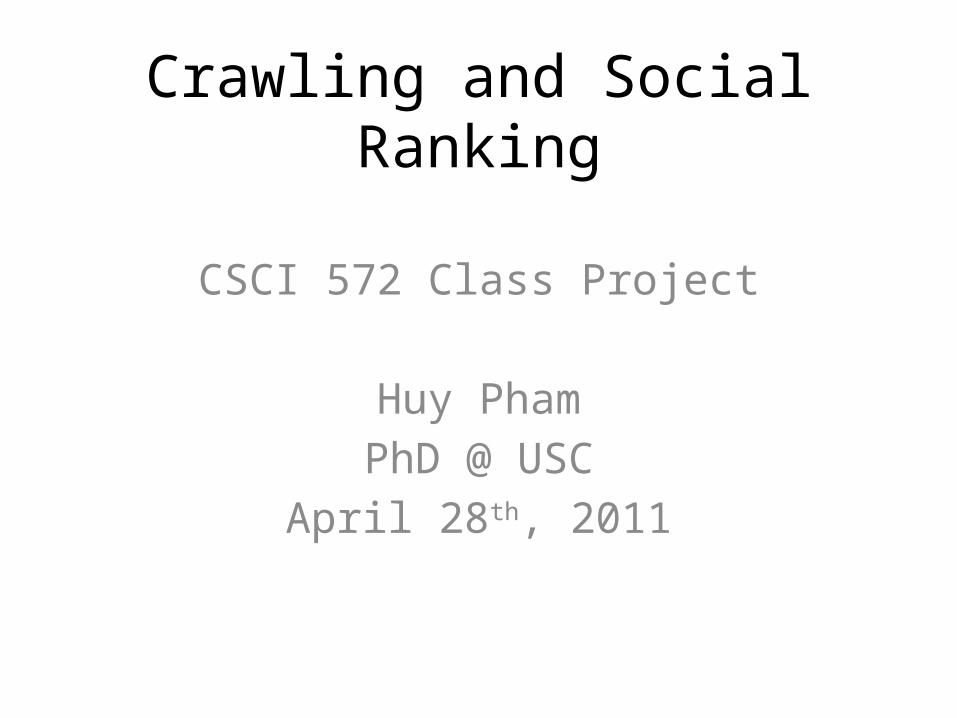
T(minutes) LAS(pages downloaded) USC(pages downloaded)Viterbi(pages downloaded)
20 800 14000 1340030 1000 17200 1640034 1200 18600 1900040 1400 22400 2260042 1400 23000 2300047 1600 26400 2640058 1800 27800 3220064 2000 28600 3580074 2200 33200 4080088 2600 38600 48600
269 8200 77800 120800290 8200 80200 124400308 8400 82200 127800349 8800 86600 134800452 10000 96600 150800483 10600 99400 155200523 12000 102600 161200602 14000 108400 171800633 14800 110600 175400660 16800 112200 178400
1272 56200 146800 237800
Details of the performances of the three servers: LAS, USC, ViterbiPerformance of LAS Server is much worse than those of USC and Viterbi (time to processa query and return a response to a request

LAS, USC and Viterbi Servers’ Performances for the table of data above
0 200 400 600 800 1000 1200 14000
50000
100000
150000
200000
250000
Number of pages downloaded vs. time in minutes
LASUSCViterbi
Time in minutes
Num
ber o
f pag
es d
ownl
oaed
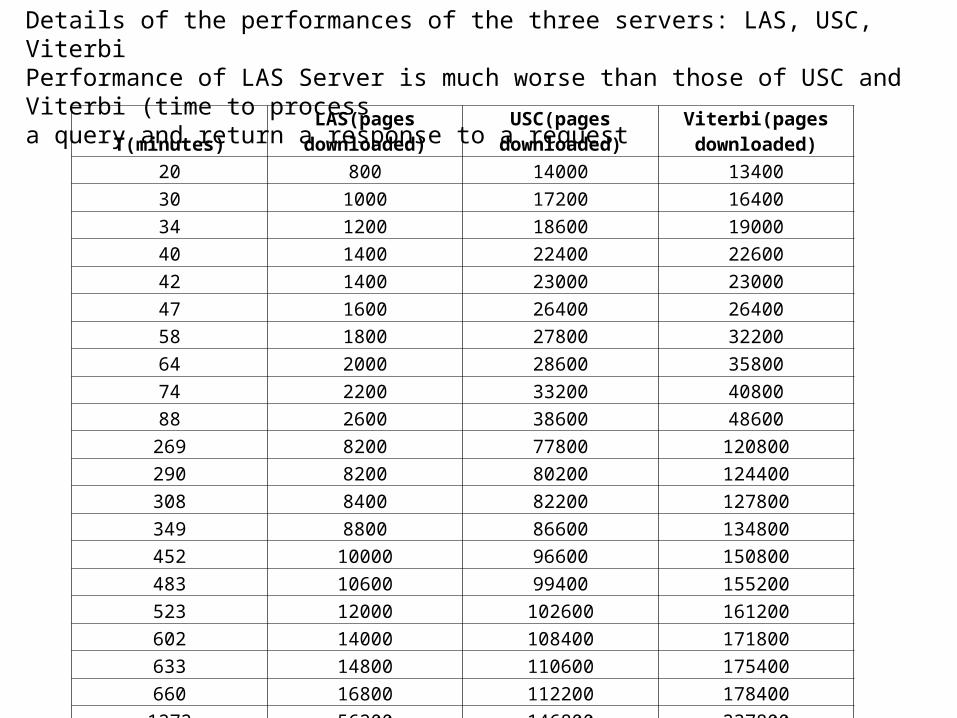
Zombi Links: Links that are included in pages but don’t work (removed or expired)
0 200 400 600 800 1000 1200 14000
20000
40000
60000
80000
100000
120000
140000
160000
For USC: Number of pages downloaded (blue)and number of zombie links (red)
DownloadedZombie links
Time in minutes
Num
ber o
f pag
es (b
lue)
and
zom
bie
links
(red
)

http://www/usc.edu/programs/cerpp/Enrollhttp://www/usc.edu/hpcc/man`/bas12c.htmlhttp://www/usc.edu/its/email/applemail/Academichttp://www/usc.edu/French/dd/ais/bfindexf.htm
0 20000 40000 60000 80000 100000 120000 140000 1600000
0.05
0.1
0.15
0.2
0.25
0.3
0.35
0.4
0.45
0.5
Ratio zombies/downloaded for www.usc.edu
Ratio zombies/downloaded
downloaded pages
Ratio
What doesthe peak say????

Explanation for the peak in thegraph of the previous slide
• The seed page (initial page) is www.usc.edu, and all the links found later are added to a queue and then later get processed as first come – first serve. The seed and its close pages get updated often, and they get processed first by the crawlers, therefore less zombies on the left side.
• When we get further from the seed, pages get old or expired because they don’t get updated, that’s why zombies increase significantly and that creates the peak.
• For the descending part of the graph, the number of zombie links increase slowly after the peak because most of them have been examined by the crawler before, but the number of downloaded pages increases, and that leads to the descending branch.
First Conclusion: Crawlers are a powerful tool to analyze servers:
• Performance: time it takes the server to process a query and return a response
• Characteristics: Live and dead links that exist in the server. Some part of the server is out of date and many pages were removed or expired, but the links to those pages still remain in other pages – this lead to high portion of zombie links

Firewall Mode
• http://www.usc.edu/a-> d• http://www.usc.edu/e-> h…
…a->d e->h k->n The rest…

Explanation for the previous slide
• First, there is 1 crawler for each site: USC and Viterbi
• Then, two crawlers for each, then 4, 8, 16. The way a site is divided into divisions is as follow: usc.edu/a->d (after the site’s name is anything that starts with letter a, b, c or d), the second crawler is usc.edu/e->h,…and so on. That last crawler includes any non-alphabetical signs such as ~, number…
• The coverage is the ratio of the number of unique pages downloaded over the total number of pages it is supposed to download.

Coverage I/E
0 2 4 6 8 10 12 14 16 180
0.2
0.4
0.6
0.8
1
1.2
Coverage
USCViterbi
Number of Crawlers
I/E

Explanation of the coverage graph• When n = 1 (1 crawler for USC and 1 for Viterbi), the
coverage of Viterbi is much higher than that of USC, which says that USC has more pages that are not reachable from the seed usc.edu and those pages are reachable from some links from Viterbi and LAS, on the other hand Viterbi has high coverage because most pages are reachable from inside the Viterbi domain.
• When n = 2, USC coverage drops dramatically while Viterbi’s coverage does not. This says that USC divides its data into divisions or clusters (academics, admission, finance…) and pages within a division point to each other more than those that belong to different division. Pages of Viterbi are less clustered, they are more uniformly linked to each other throughout the domain.
Characteristics
• USC: Has more clusters that are somehow independent – different divisions: academics, admission, undergraduates,
graduates. Reasons for clustering is because USC has more data to handle than Viterbi and clustering data is necessary. Firewall mode does not work well for USC.
• Viterbi: Data are more uniformly distributed over the link structure, therefore firewall mode works well for Viterbi.

Cross-overOverlap is defined as the ratio of the total downloaded pages
(including duplicates) over the number of unique pages downloaded
0 2 4 6 8 10 12 14 16 180
1
2
3
4
5
6
7
8
9
10
Overlap
USCViterbi
Number of crawlers
D/E

Observations• When n = 1, 1 crawler for USC, 1 for Viterbi,
then overlapping in USC is bigger => more links points to USC from outside (Viterbi and LAS) than for the case of Viterbi
• When n > 1 when a domain itself is divided into parts and each part has its own crawler. Since Viterbi has a more uniform linking structure => different parts still point to each other => big overlap. Parts from USC less point to each other => less overlap.

Exchange Mode• Communication overhead: number of links exchanged (received) per
downloaded page (x axis – number of crawlers n)
0 2 4 6 8 10 12 14 16 180
5
10
15
20
25
30
35
40
45
USC
Viterbi
n USC Viterbi
1 1.464578 1.059714
2 1.852861 2.417998
Sample data of overlap for n =1 and n = 2

Replicate most popular links
• Reduce the communication overhead by not exchanging the post popular pages because those pages have very high probability of being downloaded by their own crawlers
• Most popular pages are those that have the most in-links. How to find these most popular pages?
• Search engines use link structures to rank their results. Pages that have more in-links have high ranking scores.
• Use Google Search to find most popular pages for USC and Viterbi.• Examples of most popular pages for USC are shown below. When Vitervi crawler
sees those links, it will not send it to the USC Crawler, hence reduce the traffic.http://www.usc.edu/http://www.usc.edu/admission/undergraduate/http://www.usc.edu/admission/undergraduate/apply/index.htmlhttp://www.usc.edu/admission/graduate/http://www.usc.edu/admission/undergraduate/.../dates_deadlines.htmlhttp://www.usc.edu/research/http://www.usc.edu/communities/http://www.usc.edu/arts/http://www.usc.edu/about/administration/http://www.usc.edu/admission/fa/faqs.html

New achievement in reducing communication overhead
• For the case when there is one crawler for each site (USC or Viterbi) the green cells are the results after reducing communication overhead by replicating (not exchanging) the most popular links (pages) of each site.
• LAS site is not examined due to its slow responses – it takes too long to crawl LAS. Its server’s performance is compared graphically to those of Viterbi and USC in the 5th slide.
n USC Viterbi USC Viterbi
1 1.464578 1.059714 1.144414 1.055509

Conclusions for Crawling• Crawling is an excellent tool to analyze server’s
performance and characteristics of web sites.• For sites with uniform (non-clustered) linking structures,
Firewall Mode outperforms Cross-over mode, saves network traffic compared to exchange mode -> therefore we can dynamically determines what type of crawling (firewall or exchange) to apply for each site in the future by first crawling the site to determine if it has uniform linking structure or not.
• For sites with clusters such as USC, one must use exchange mode (almost always avoid cross-over mode: overlap is too heavy compared to information exchange traffic)

Part 2: Social Ranking• Introduce a ranking algorithm for a new type of data• If we are able to crawl Facebook (user IDs and the
locations they have been to (checked in) then this algorithm determines how strongly two people are connected to each other based on the locations they went to at the same time, therefore suggest friendship for Facebook taking into account geospatial network.
• The same applies to Amazon: If two users A and B buy many same products, each product for multiple times, then we can suggest (advertise) products that A has bought but B has not.

Example for Amazon• There are three products: grey, blue and white• We have the purchase history of users: A and B both bought
grey for 4 times, blue for 4 times and white for 6 times. Similar for C and D, while E and F bought grey for 16 times and none for blue and white.
• The questions is: Do A and B have more or less common interests than C and D or E and F? And how do we rank the similarities of interests among these pairs of people?
4
44
4 6
16
10
A and B
C and D
E and F

Example for Facebook
• The same situation: if we imagine each box is a place, and the number in its is the number that two users happen to be in that place at the same time.
• How closely two people are connected based on the number of different places whey went to at the same time and the number of times they went to each place at the same time?

For Facebook, divide the area of interest into cellsDifferent Scales of Cells
Cell has size of campus (USC, Hollywood, Grove center..) Cell has size building, center, club
1
7
2 4 5 63
A(2,4,1,0,0,0,2)
B(0,4,4,0,2,0,2)
C(0,0,0,0,2,0,0)
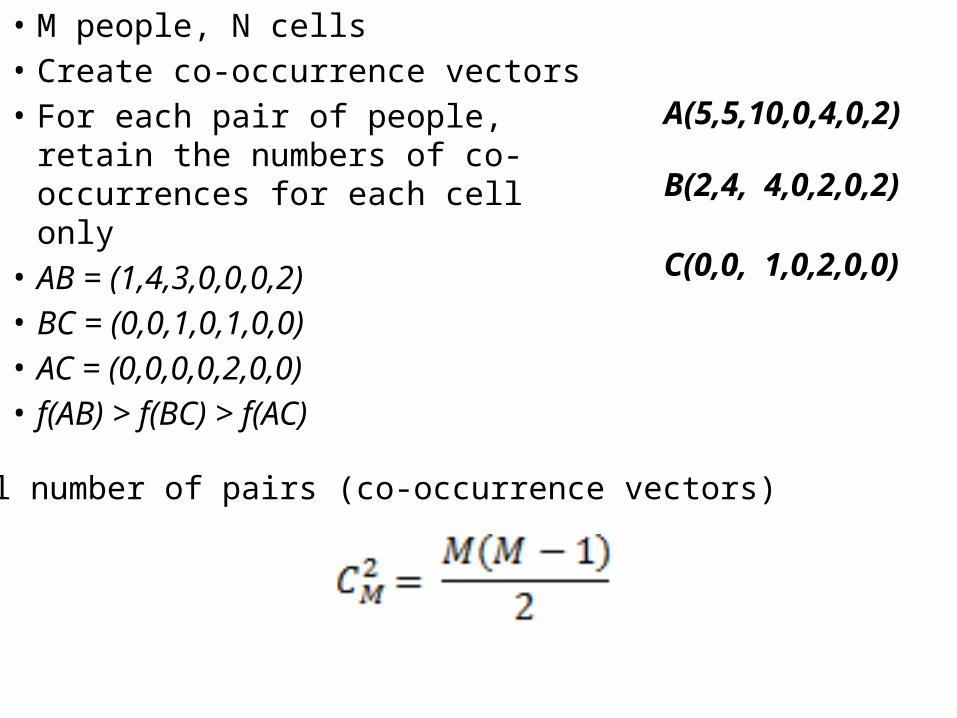
• M people, N cells• Create co-occurrence vectors• For each pair of people, retain the
numbers of co-occurrences for each cell only
• AB = (1,4,3,0,0,0,2)• BC = (0,0,1,0,1,0,0)• AC = (0,0,0,0,2,0,0)• f(AB) > f(BC) > f(AC)
A(5,5,10,0,4,0,2)
B(2,4, 4,0,2,0,2)
C(0,0, 1,0,2,0,0)
Total number of pairs (co-occurrence vectors)

Similarity Based on Euclidean Distance
Projected Pure Euclidean Distance (PPED)Optional: Memory Saving and Computation Efficiency
Pure Euclidean Distance (PED)

Master Vector
• Calculate and compare the similarities between Ci and V• The less distance from Ci to V (closer), the higher the chance
of the two people having a social connection.
…

Demo for the case of 2 cellsPoints inside the circle have high number of co-occurrences in each cell, and
also have more uniform distribution of co-occurrences over cells
0 5 10 15 20 25 300
5
10
15
20
25
Series1-Series5
Increasing number of co-occurrences in cell 2
Distributing co-occurrences over two cells

Social Constraints Satisfied by the Metric
• The more the number of cells of co-occurrences, the less PED
• C1(1,1,1,…,1,0,… ,0) (k non-zero cells)• C2(1,1,1,…,1,1,0,…,0) (k+1 non-zero cells)

• Co-occurrences at the same cell also count for the similarity
• C1(1,1,1,…,1,0,… ,0)• C2(a,1,1,…,1,0,… ,0) (a>1)

• Co-occurrences at different cells are weighted more than those at the same cell
• C1(k,0,0,…,0,0,… ,0) (k co-occurrences at the same cell)• C2(1,1,1,…,1,0,…,0) (k co-occurrences at diff. cells)
• C1(a,0,0, …0,0,0,… ,0) (1 cell)• C2(b1,b2,b3,…, bk,0,…,0) ( k cells)• Sum(bi) = a

How are co-occurrences at the same cell and at different cells related?
• C1 (x,0,… ,0) • C2(1,1,…1,0,…,0) y non-zero cells• How much of y would make C2 equivalent to C1?
Independent of N
1 2 3 4 5 6 7 8 9 10 11 12 13 14 15 16 17 18 19 20 210
5
10
15
20
25Series1
Series2
x
y m = 20, x <= m
y=x
Saturated point helps avoiding coincidences
The two meet at x=1, y=1

Using PPED to save memory and increase computational efficiency
• For the master vector, instead of N, use P = maximum number of non-zero cells over the co-occurrences vectors
• Hence the size of each co-occurrence vector can be reduced to P, P << N

How to cut off the uninterested portions for different sets of input data
• m is different for different inputs• Number of friends (potential chance to be
friends) fluctuate around an average????
Challenges – Future Work• Crawl Facebook for users and get their check-ins and
relationships. Not all data available to public• Amazon: User’s purchase history is private, protected by
Amazon. Using their comments on products to determine what they bought? Not all users post comments and impossible to know how many times a user has bought this product.
• Flickr: Photos have information about dates and coordinates, but not social connections available to test, and not all photos were taken by the user who uploaded them.
• The model works well for the owner of the data, or any third parties that have access to the data to make advertisements to related users.


![Dynamo: Amazon’s Highly Available Key-value Store Giuseppe DeCandia et al. [Amazon.com] Jagrut Sharma jagrutsh@usc.edu CSCI-572 (Prof. Chris Mattmann)](https://img.dokumen.tips/doc/110x75/56649e0d5503460f94af6ab5/dynamo-amazons-highly-available-key-value-store-giuseppe-decandia-et-al.jpg)