Embed Size (px)
Citation preview

14th International LS-DYNA Users Conference Table of Contents
June 12-14, 2016 1-1
Crash Testing and Simulation of a Cessna 172 Aircraft: Pitch Down Impact onto Soft Soil
Edwin L. Fasanella* And
Karen E. Jackson**
Affiliations
National Institute of Aerospace* NASA Langley Research Center**
Hampton, VA
Abstract During the summer of 2015, NASA Langley Research Center conducted three full-scale crash tests of Cessna 172 (C-172) aircraft at the NASA Langley Landing and Impact Research (LandIR) Facility. The first test represented a flare-to-stall emergency or hard landing onto a rigid surface. The second test, which is the focus of this paper, represented a controlled-flight-into-terrain (CFIT) with a nose-down pitch attitude of the aircraft, which impacted onto soft soil. The third test, also conducted onto soil, represented a CFIT with a nose-up pitch attitude of the aircraft, which resulted in a tail strike condition. These three crash tests were performed for the purpose of evaluating the performance of Emergency Locator Transmitters (ELTs) and to generate impact test data for model validation. LS-DYNA finite element models were generated to simulate the three test conditions. This paper describes the model development and presents test-analysis comparisons of acceleration and velocity time-histories, as well as a comparison of the time sequence of events for Test 2 onto soft soil.
Introduction The crash test series of three Cessna 172 (C-172) aircraft conducted at NASA Langley Research Center in the summer of 2015 generated data for use in updating the performance specifications for the next generation of Emergency Locator Transmitter (ELT) systems [1-3]. ELT systems are present on all General Aviation (GA) aircraft and are intended to transmit a distress signal during emergency scenarios such as a crash landing. The first crash test in the series represented a flare-to-stall emergency or hard landing onto a rigid surface [3]. The second test represented a controlled-flight-into-terrain (CFIT) with a nose down pitch attitude of the aircraft, which impacted onto soft soil. The third test was also conducted onto soft soil and represented a CFIT with a nose up pitch attitude of the aircraft, which resulted in an initial tail strike condition. These crash tests were performed for the purpose of evaluating the performance of Emergency Locator Transmitters (ELTs) and to generate impact test data for model validation. LS-DYNA [4, 5] finite element models were generated to simulate the three test conditions. The Cessna 172 Skyhawk is a four-seat, single engine, high-wing airplane, manufactured by the Cessna Aircraft Company. More Cessna 172s have been built than any other aircraft, and the first production models were delivered in 1956. As of 2015, Cessna and its partners have built more than 43,000 airframes. The wide availability of these aircraft was one reason that they were selected for the test series. A second reason for the selection was that research showed no correlation between airplane make or model and ELT performance. It is also noted that NASA
https://ntrs.nasa.gov/search.jsp?R=20160010792 2018-07-09T09:42:05+00:00Z

Table of Contents 14th International LS-DYNA Users Conference
1-2 June 12-14, 2016
had previously conducted a series of crash tests using C-172 aircraft in the 1970’s [6, 7] and these tests helped to guide the development of the lifting hardware used in the current tests. This paper will provide a brief description of the second C-172 full-scale crash test (Test 2), a summary of the finite element model development, and test-analysis comparisons of inertial properties, time sequence of events, soil deformation, and time-history responses.
Test Description
A pre-test photograph of the C-172 aircraft for Test 2, nose down impact into soil, is shown in Figure 1. The aircraft contained two crew seats, two Anthropomorphic Test Devices (ATDs), an onboard data acquisition system (DAS) box, five ELTs that were mounted throughout the cabin, and ballast weights to represent fuel loading in the wings. The total weight of the aircraft was approximately 2,114-lb. The left side of the aircraft was painted white, with 1-in.-diameter black dots added to provide a speckle pattern for the purpose of collecting three-dimensional photogrammetry data during the test. Sixty-four channels of data were collected at 10,000 samples per second using the onboard DAS. The DAS was located behind the pilot and co-pilot seats in the location where luggage would normally be stored, or passenger seats would be added. Thus, the DAS provided ballast to the airframe. Additional lead weight was added over the wing to simulate fuel. The lead, along with the main swing hardware, accounted for approximately 100 lb. of weight over each wing, which simulated fuel tanks above 75% full. Onboard and external high-speed video coverage was obtained from internal and exterior cameras. Finally, a 2-ft. high soil bed was spread above the concrete surface. The soil was a sand/clay mixture that was wetted one hour before the test. Details of the swing-cable methodology used for the crash test are provided in Reference 2. As in many high-wing crash tests into soft soil, the airplane flipped over and landed upside down at the end of the impact event. Also, the tail of the fuselage buckled early in the crash. Buckling initiated at the bulkhead behind the end of the floor, and by 0.240 seconds the buckle was fully formed.
Figure 1. Pre-test photograph of C-172 crash Test 2 airplane at impact attitude.
Finite Element Model
The LS-DYNA [4, 5] model used to represent Test 2 is shown in Figure 2. The model was constructed using three-dimensional laser scans to form point clouds of the outer mold lines. The internal structure was added with the help of diagrams available on the internet and from
14th International LS-DYNA Users Conference Table of Contents
June 12-14, 2016 1-3
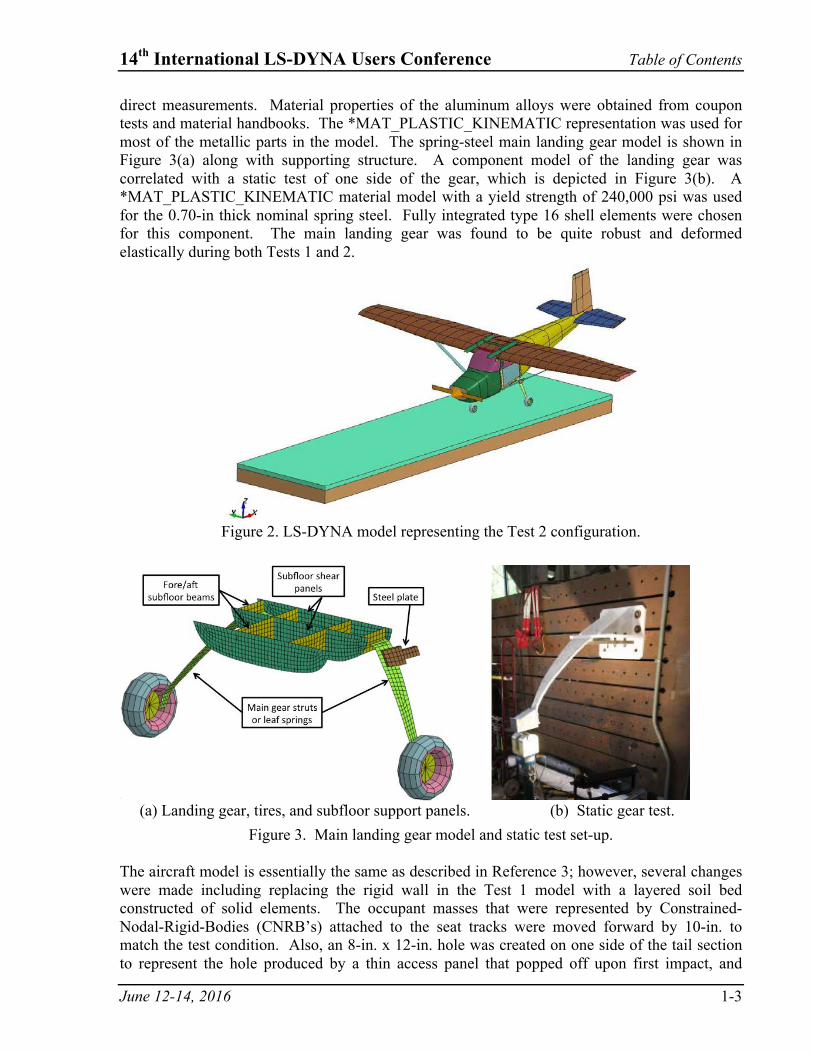
direct measurements. Material properties of the aluminum alloys were obtained from coupon tests and material handbooks. The *MAT_PLASTIC_KINEMATIC representation was used for most of the metallic parts in the model. The spring-steel main landing gear model is shown in Figure 3(a) along with supporting structure. A component model of the landing gear was correlated with a static test of one side of the gear, which is depicted in Figure 3(b). A *MAT_PLASTIC_KINEMATIC material model with a yield strength of 240,000 psi was used for the 0.70-in thick nominal spring steel. Fully integrated type 16 shell elements were chosen for this component. The main landing gear was found to be quite robust and deformed elastically during both Tests 1 and 2.
Figure 2. LS-DYNA model representing the Test 2 configuration.
(a) Landing gear, tires, and subfloor support panels. (b) Static gear test.
Figure 3. Main landing gear model and static test set-up. The aircraft model is essentially the same as described in Reference 3; however, several changes were made including replacing the rigid wall in the Test 1 model with a layered soil bed constructed of solid elements. The occupant masses that were represented by Constrained-Nodal-Rigid-Bodies (CNRB’s) attached to the seat tracks were moved forward by 10-in. to match the test condition. Also, an 8-in. x 12-in. hole was created on one side of the tail section to represent the hole produced by a thin access panel that popped off upon first impact, and

Table of Contents 14th International LS-DYNA Users Conference
1-4 June 12-14, 2016
model representations of the nose cone and propeller were added. A material model (*MAT_SOIL_AND_FOAM) was assigned to each of the two layers of soil. The material properties of the top layer, Gantry Unwashed Sand (GUS), had previously been calibrated and documented at a specific density and moisture content by a commercial company [8], and used in LS-DYNA models in Reference 9. The softer bottom layer soil properties were reported in Reference 10. An important modification made to the material model in Reference 8 was to increase the unloading modulus to prevent excessive rebound. Note that changes in the moisture and density can vary the bearing strength considerably. Thus, a dynamic cone penetrometer was used to determine the bearing strength of the soil as a function of depth. Since water accumulated at the bottom of the soil, the bottom layer of soil was made much softer than the top layer. Other changes made to the model included the addition of a fifth ELT, and the addition of an automatic single surface contact. Finally, prior to Test 2, the actual nose gear was essentially locked into place due to leakage problems. Consequently, the nose gear in the model was fixed. The final model had over 200,000 elements and was simulated for 0.35 seconds with a time step of approximately 1.5e-07 seconds. All nodes forming the aircraft model were assigned the same initial velocity conditions as measured for the test (823.2-in/s forward velocity and 344.4-in/s vertical velocity). In addition, a pitch angular velocity of 16.1-degrees/second was assigned about the Center-of-Gravity (CG) of the model representing the measured condition. The aircraft was also pitched by 12.2° (nose down) to match the orientation of the test article at impact. The wing fuel, engine, two seats, and the two dummy occupants were simulated as concentrated masses. The model was executed on a Linux workstation computer with 8 processors, running LS-DYNA V971 R7.1.2 SMP double precision, and required approximately 19 hours of clock time to simulate 0.35 seconds. Nodal output requests for the simulation included acceleration- and velocity-time histories in the appropriate accelerometer local-axis system. During the test, the airplane nose gear impacted the soil first and began to plow into it. The nose of the airplane impacted the soil shortly after initial nose gear contact with the soil. The nose and nose gear plowing into the soil continued to occur until the left wing broke away from the fuselage. Next, the tail began to buckle and at 0.240-sec. after impact the airplane started to flip over. At some point during the impact events, the nose gear broke away from the rest of the airplane. Obviously, the success of the modeling and simulation effort will depend heavily on accurate prediction of the soil behavior and the interaction of the soil with the aircraft.
Test-Analysis Comparisons
Test-analysis comparisons are presented in four categories: inertial properties of the test article and model, the time sequence of events, soil deformations, and time-history plots of forward and vertical acceleration. For the acceleration time histories, both the test data and analytical predictions in the local axis system were filtered using a Society of Automotive Engineers (SAE) Channel Filter Class (CFC) 20-Hz low-pass filter [11]. In addition, the global vertical and horizontal velocities near the CG, based on photogrammetric analysis, are plotted versus the predicted responses. Photogrammetry provides more accurate velocity data than integration of accelerometers. Inertial Properties As a preliminary check of model fidelity, the inertial properties of the test article and the model

14th International LS-DYNA Users Conference Table of Contents
June 12-14, 2016 1-5
are compared in Table 1. The largest difference is in the location of the vertical CG. However, the location of the vertical CG is quite difficult to measure accurately. Note that the x-coordinate of the CG is measured from the firewall and the z-coordinate of the CG is measured from the ground. The y-coordinate of the CG is measured along the centerline of the aircraft. As can be seen in Table 1, the model closely matches the test measurements. Table 1. Inertial properties of model as compared to test.
PARAMETER MODEL TEST DIFFERENCE % DIFF Weight, lb 2120 2114 6.0 0.3 CGx, in. 39.1 39.5 0.4 1.0 CGy, in. -0.04 0.0 0.04 - CGz, in. 49.7 48.1 1.6 3.3
Time Sequence of Events A comparison of a time sequence of events is shown in Figure 4. This figure highlights four major events during the time sequence including: initial nose gear impact, the time of main gear impact, time of nose cone impact, and end time of the major crash acceleration pulse at 0.240 seconds. A side view of the model is shown at the time of each event for comparison. As can be seen, the model captures the kinematics of the impact quite well.
Figure 4. Time sequence of events comparison. Soil Deformation The tire tracks in the soil (see Figure 5(a)) can be compared with model predictions, as shown in Figure 5(b). The numerical comparisons and percent differences are summarized in Table 2. As

Table of Contents 14th International LS-DYNA Users Conference
1-6 June 12-14, 2016
can be seen, the model predicted the soil deformations quite well considering the complexity of the test conditions and the simplicity of the model.
(a) Photo of deformations. (b) Model predictions.
Figure 5. Soil deformations measured and predicted by model.
Table 2. Comparisons of Test and Model Soil Deformations
Time-History Comparisons Filtered forward and vertical acceleration time-history comparisons are shown in Figures 6-10 matching various accelerometer locations within the test article. Note accelerations are in the local accelerometer axis system unless noted otherwise. The forward acceleration responses obtained during the test exhibit a large negative pulse, beginning at approximately 0.05-s, and achieving a maximum value of between 17- to 33-g at 0.13-s. The predicted responses generally match this overall behavior. For the pilot floor location (see Figure 6(a)), the predicted response overshoots the test response, even though the timing of the two peaks is close. For the DAS box location (see Figure 8(a)), the predicted response lags the test response in time and has a lower magnitude peak (25-g compared with 34-g). The predicted forward acceleration response of the tail, shown in Figure 10(a), exhibits anomalous behavior that is different from the other predicted responses. The predicted response begins with a negative acceleration pulse, but at 0.1-s the curve changes direction and deviates from the test response.

14th International LS-DYNA Users Conference Table of Contents
June 12-14, 2016 1-7
Figure 6. Forward and vertical accelerations on floor near pilot, aircraft axis system.
Figure 7. Forward and vertical accelerations on the floor near copilot, aircraft axis system.
Figure 8. Forward and vertical acceleration comparisons of the DAS Box.

Table of Contents 14th International LS-DYNA Users Conference
1-8 June 12-14, 2016
Figure 9. Forward and vertical acceleration comparisons of the right doorframe.
Figure 10. Forward and vertical acceleration comparisons near the aircraft tail.
As shown in Figures 6-9(b), the vertical acceleration responses obtained during the test generally exhibit a low-magnitude (0- to 5-g) initial response, typically for the first 0.03- to 0.07-s, followed by a higher-magnitude acceleration pulse with peak values of 14- to 19-g. The peak accelerations occur at approximately 0.1-s. Following the peak, the test responses decrease back to low-magnitude values. Unlike the test, the predicted responses generally exhibit a higher magnitude initial response, starting at 10-g and increasing to 15-g. Peak values of between 16- and 20-g are obtained, before the acceleration responses decrease to low-magnitude values. Thus, the model matched the peak accelerations of the test response quite well. It is speculated that the difference in the initial acceleration responses may be attributed to several factors including: propeller, nose, and nose gear contact forces, soil variability, and lumped masses to represent the seats and dummies. For this test, the locked nose gear broke loose from its mounting, which would have required more detailed modeling than time allowed. The vertical acceleration responses of the tail, shown in Figure 10(b), are somewhat different from the other

14th International LS-DYNA Users Conference Table of Contents
June 12-14, 2016 1-9
responses. The model over predicts the test response for the first 0.06-s, but then shows generally good agreement. The exact buckling of the tail influences this behavior. As a final comparison, the global CG horizontal (forward) and vertical velocities are plotted versus predicted global responses from a location that is positioned near the CG, as shown in Figure 11. For these plots, the CG experiment velocities were determined based on photogrammetric analysis. For the horizontal velocity, the model and CG responses agree up to 0.05-s, at which time the CG velocity response exhibits a fairly sharp change in slope and deviates from the predicted response. By the time the CG data ends at 0.15-s, the two curves are in close agreement once again. In general, the CG vertical velocity response and the predicted response are in better agreement. Global Horizontal Velocity, in/s Global Vertical Velocity, in/s
Figure 11. Comparison of predicted global velocities at pilot floor location with
photogrammetry.
Conclusions
A full-scale crash test of a Cessna 172 General Aviation aircraft was conducted at NASA Langley Research Center in the summer of 2015. The purpose of the crash test was to evaluate the performance of Emergency Locator Transmitters (ELTs) and to generate impact test data for model validation. An LS-DYNA finite element model was developed to simulate the impact test conditions of Test 2 with a nose-down pitch attitude onto soil. The finite element model was generated based on three-dimensional laser scan of the test article. The nose gear was fixed, but the main gear was modeled in detail using Type 16 shell elements with a thickness of 0.7 in. Test-analysis comparisons are presented in four categories: inertial properties of the test article and model, the time sequence of events, soil deformations, and time-history plots of forward and vertical acceleration. Major finds are listed, as follows:
1. As a preliminary check of model fidelity, comparisons were made with inertial properties of the test article. The model accurately matched the total weight and Center-of-Gravity (CG) locations of the test article.

Table of Contents 14th International LS-DYNA Users Conference
1-10 June 12-14, 2016
2. The model captured four major events during the time sequence including: initial nose gear impact, the time of main gear impact, time of nose cone impact, and end time of the major crash acceleration pulse. Thus, the model predicted the kinematics of the impact response quite well.
3. The simulation predicted the overall shape and depth of the soil deformation pattern quite well including the nose gear hole depth, the maximum depth of main gear tire, the main gear (left-to-right tire) width, and the post-test distance from the nose gear hole to the propeller.
4. The model generally predicted the overall shape and magnitude of the forward acceleration responses obtained during the test, with some deviations in timing and magnitude of the peaks.
5. The model over predicted the initial low-magnitude vertical acceleration responses obtained during the test, but matched the major peak accelerations quite well.
6. The difference in the initial acceleration responses may be attributed to several factors including: propeller, nose, and nose gear contact forces, soil variability, and lumped masses to represent the seats and dummies.
7. Finally, CG horizontal and vertical velocities, as measured from photogrammetry, were compared with nearby predicted responses. Deviations were observed in the horizontal responses; however, excellent agreement was achieved for the vertical responses.
References
1. Annett M.A., Littell J. D., Stimson C. M., Jackson K.E., and Mason B.H., “Full-Scale Crash Tests and Analyses of Three High-Wing Single Engine Aircraft,” Aerospace Structural Impact Dynamics International Conference, Seville, Spain, November 17-19, 2015. 2. Littell J. D., “Crash Tests of Three Cessna 172 Aircraft at NASA Langley Research Center’s Landing and Impact Research Facility,” NASA/TM-2015-218987, November 2015. 3. Jackson K.E. and Fasanella E. L., “Crash Testing and Simulation of a Cessna 172 Aircraft: Hard Landing onto Concrete,” Proceedings of the 14th International LS-DYNA Users Conference, Dearborn, MI, June 13-14, 2016. 4. Hallquist J. Q., “LS-DYNA Keyword User’s Manual,” Volume I, Version 971, Livermore Software Technology Company, Livermore, CA, August 2006. 5. Hallquist J. Q., “LS-DYNA Keyword User’s Manual,” Volume II Material Models, Version 971, Livermore Software Technology Company, Livermore, CA, August 2006. 6. Thomson, R. G. and Goetz, R. C., “NASA/FAA General Aviation Crash Program – A Status Report.” Journal of Aircraft , Vol. 17, No. 8, pp. 584-590, August 1980. 7. Vaughan, V.L. and Hayduk, R. J., “Crash Tests of Four Identical High-Wing Single-Engine Airplanes,” NASA TP-1699, August 1980. 8. Thomas M. A., Chitty D. E., Gildea M. L., and T’Kindt C. M. “Constitutive Soil Properties for Unwashed Sand and Kennedy Space Center.” NASA/CR-2008-215334, Applied Research Associates, Inc, Albuquerque, NM, 2008. 9. Heymsfield, E., Fasanella, E. L., Hardy, R. C., and Boitnott, R. L., “Assessment of Soil Modeling Capability for Orion Contingency Land Landing,” ASCE Journal of Aerospace Engineering, Vol. 25, No. 1, pp. 125-131, January 2012. 10. Fasanella, E. L., Jackson, K. E., and Kellas, S. “Soft Soil Impact Testing and Simulation of Aerospace Structures,” Proceedings of the 10th International LS-DYNA Users Conf., Dearborn, MI, Livermore Software

14th International LS-DYNA Users Conference Table of Contents
June 12-14, 2016 1-11
Technology Corp., Livermore, CA, 2008. 11. Society of Automotive Engineering. “Instrumentation for Impact Test – Part 1-Electronic Instrumentation,” SAE J211-1, Revision March 1995, SAE International, 400 Commonwealth Drive, Warrendale, PA.