Embed Size (px)
Citation preview

1
1Crash Simulation Methodologies For Aircraft Structures Used withinEuropean Crashworthiness Research
C.M. Kindervater,D. Kohlgrüber and M. Lützenburger
German Aerospace Center (DLR), Institute of Structures and Design, Pfaffenwaldring 38-40, D-70569 Stuttgart
ABSTRACT
Within the Industrial and Material Technology Programs (IMT) „Crashworthiness for CommercialAircraft“ (Framework 3) [1] - and „Commercial Aircraft - Design for Crash Survivability“(CRASURV/Framework 4) [2] sponsored by the European Commission (CEC) - Europeanpartners participated with numerical crash simulation studies of metallic and composite sub-components of aircraft airframes . Both - hybrid simulation techniques (KRASH) as well as FiniteElement (FE) based crash codes were used for the simulations. All simulation studies could or willbe correlated with quasi-static test data and data of crash tests which were or will be performedwithin the programs. The FE based simulation studies and crash test correlation within theFramework 3 program with transport aircraft sub-structures comprised two metallic sub-cargofloor sections, two side shell sections, a rear fuselage bay structure below the passenger floorbetween two frames, and a fuselage section. Hybrid crash simulations using KRASH wereperformed comprising the above mentioned fuselage bay structure and airframe section, and also aso called „stick model“ of a full-scale aircraft (A320) was generated. For the section more than 80correlation of the test results and pre-/post-test simulations were performed. Acceleration andvelocities as well as displacements and forces were compared. Out of the investigations of the testand simulations with different KRASH section models, a design principle for the fuselage framestructure was proposed that should prevent some of the failure mechanisms which were observedin the crash test. With the full-scale aircraft stick model various crash scenarios resulting fromactual accident data were simulated comprising cases with extended and retracted landing gearsand various conditions that lead to separation of the engines from the wing. The FE basedsimulation studies within the Framework 4 program CRASURV are focused on composite sub-structures such as floor sections (GA/helicopters) and sub-cargo/sub-cabin structures (commuterand transport aircraft). The major tasks focus on material studies to increase the database andexplore failure mechanism, failure criteria and the generation of new material models, new designconcepts, numerical simulation studies and the correlation with crash test data. On successfulcompletion the technology can be used for the design of airframes with structural componentsmade out of composite materials.
1 Paper presented at the FAA „International Aircraft Fire and Cabin Safety Research Conference“,Atlantic City, New Jersey, November 16-20, 1998

2
INTRODUCTION
The purpose of the IMT Research Program „Crashworthiness for Commercial Aircraft“ was toprovide guidelines for the improvement of crashworthiness design techniques by the extensive useof analytical studies supported by experimental work on materials, components and full-scalestructure. The 3-years program was performed in the time frame 1993-1995 with the participationof 18 European partners from industry, research establishments and universities. The programintended to develop and validate non-linear dynamic analysis methodology in the commercialaircraft field and provided an integrated approach to the problem by a combination of studies intooverall energy absorption (EA) mechanisms of airframe structures, more detailed studies ofimmediate environment of the occupant and investigations into occupant reaction to crash impulseand interactions with the surrounding structure. The design guidelines resulting from the programwere intended to provide a basis for improved aircraft safety. The program was split into fourmajor Tasks:• Establishment and distribution of background data with respect to airworthiness and human
tolerance to injury.• Establishment, verification and comparison of crash analysis methodologies (fuselage sub-
structures, occupants).• Studies of a major airframe structure comprised a full-scale drop test of a fuselage section and
various numerical simulations of this test with Finite Element crash codes and one hybrid crashcode.
• Studies of occupant and local structure focused on structural crash simulations, occupantresponse to crash impulse and interactions between occupants, their restraint system and localstructure.
All structural components which were tested in the program could be taken out from an A320fuselage which was used before for static testing within the certification process of the aircraft.The A320 is certified and fulfils the requirements of the JAR/FAR Part 25. It should be notedclearly that the crash impact conditions under which the components were tested in the FW3-project go far beyond any currently applied crash safety standards for transport aircraft. Thecomponent test were performed to get substantial damage in the structures and to provide a database to validate the numerical simulation tools applied and developed in the project.
The research program CRASURV with a total number of 22 partners was started in 1996 with a 3years duration to increase the knowledge of the crash behavior of lightweight composite structuresand their application in aircraft fuselages. Besides fundamental work on basic materials andmethodologies generic sub-floor box structures representative for GA-aircraft and helicopters andsub-floor belly structures of a commuter type aircraft and an airliner are being designed incomposite materials, built and dynamically tested. In addition, the test will be simulated usingmodern explicit Finite Element codes (LS-DYNA3D, PAM-CRASH, RADIOSS) with enhancedcomposite materials models that are also developed within the research project. The project is splitinto the following Tasks:
• Material studies (database, failure mechanisms, failure criteria, material models).• Development of energy absorption (EA) concepts and production of test structures.

3
• Analysis of impact loading and validation method.• Structural tests.• Occupant simulation• Assessment of methodology of modelling composite structure due to crash loads.
DLR took part in the research activities of both programs with the generation of background data(crash scenarios, material and crushing data of components), component development andmanufacturing (sub-floor sections), model generation and crash simulations. In the followingsections, first FE and hybrid crash simulation tools are briefly described and second sample casesof both metallic (FW3) and composite (FW4) airframe sub-components are presented todemonstrate the methodology and its current status of validation.
NUMERICAL CRASH SIMULATION TOOLS
FE tools for crash simulation
FE simulation techniques allow the engineer to predict the crash response of a structure directlywithout having to make use of structural test data to calibrate elements in the analysis, as is thecase with hybrid simulation methods. However, the crash behaviour of an aircraft structure isextremely complex, involving both non-linear dynamic materials response and large structuraldeformations. Such analyses are at the limit of validity of current FE analysis codes, especially fornon-metallic structures. The established FE codes in the aircraft industry are the implicit FE codes,such as NASTRAN, which are used widely for structural analysis, buckling calculations, and forprediction of dynamic vibration response. In the last 15 years several commercial FE codes such asLS-DYNA3D [3] and PAM-CRASH [4], RADIOSS, and MSC-DYTRAN have been developedespecially for impact and non-linear dynamic simulations. These newer crash simulation codes areexplicit FE codes which use a Lagrangian formulation with an FE mesh fixed in the material andwhich distorts with it The method requires very small time steps for a stable solution. The mainadvantages of the explicit method is that the governing equations are uncoupled allowing an'element-by-element' solution, with no global stiffness matrix assembly or inversion required. Themethod is generally recognised to be very robust for highly non-linear problems. The codescontain materials models for metals and composites, and most important for crash analysis, contactin the structure is easily and efficiently handled by introducing temporary 'penalty forces' asadditional external forces to resist penetration and control sliding. In response to the needs of theautomotive industry there are also models of safety features such as airbags and occupantdummies which can be incorporated into the structural analysis. As design tools FE crash codeshave gained wide acceptance in the automotive industry for vehicle crash simulations, but are onlyrecently being considered for aircraft structures.
KRASH - A hybrid crash simulation method
The crash simulation program KRASH predicts the response of vehicles to multidirectional crashenvironments. KRASH provides the interaction between rigid bodies through interconnecting

4
structural elements (beams), which are appropriately attached (pinned, clamped). These elementsrepresent the stiffness characteristics of the structure between the masses. The equations of motionare explicitly integrated to obtain the velocities, displacements and rotations of the lumped massesunder the influence of external and internal forces. In the hybrid modelling technique, large regionsof structure are approximated in a simplified manner. Non-linear behaviour (e.g. force-deflectioncurves) of substructures, that is already known from tests or other analyses can be introduced intothe model by use of macro elements like springs, non-linear beams or plastic hinges.
The program KRASH has a history of 25 years. The original version of KRASH was developedand experimentally verified under U.S. Army sponsorship between 1971 - 1974, especially forrotorcraft. Further developments sponsored by the FAA extended the capabilities of KRASH forapplication to general aviation and transport aircraft and culminated in the release of KRASH85[4]. During the last 5 years KRASH was significantly improved by Dynamic Response Inc.,California (DRI). A lot of new features have been added to the code, important especially foraircraft crash simulation. DRI-KRASH now includes additional injury criteria, e.g. HIC and SIcalculations, an expanded oleo-pneumatic landing gear module, a soft soil module as well as awater impact module [5].
KRASH has been validated by more full-scale aircraft crash tests than any other crash impactstructures program, and although originally developed for aircraft applications, it has in themeantime also been used for the crash simulation of cars, trains and other vehicles. The FAA andthe British Air Accident Investigation Board (AAIB) are sponsoring efforts to develop air accidentreconstruction / investigation tools, with KRASH as its core program. Today all American andEuropean helicopter manufacturers as well as some leading aircraft manufacturers use the programKRASH. Representative KRASH models of various aircraft categories are shown in Figure 1.
Figure 1. KRASH models of various aircraft categories
ALUMINIUM FUSELAGE SUB-STRUCTURES AND FULL AIRCRAFT STICK MODEL (FW3)

5
Material properties used in FE simulations
The material properties used in the simulations within the Framework 3-project were generatedfrom the results of a comprehensive material test program performed by Liverpool University.Quasi-static and dynamic material tests have been performed to investigate the influence of thematerial direction of roll and the sensitivity of the properties on the strain rate. Because only asmall influence of both effects could be found, an elastic-plastic material model with isotropichardening has been selected for the simulations with PAM-CRASH. Strain rate effects were nottaken into account.
The results of the material tests in engineering stresses and strains have been converted into truestresses and strains for further use in the simulations. The hardening of the aluminium alloysbeyond the proportional limit is assumed to be governed by a power law of the following form:
σ = K ( εo + εp )n
In this formulation σ and ε are true stress and true strain components, and K and n are materialparameters. The total strain is interpreted as a constant initial yield strain εo calculated from the
Young's modulus and the initial yield stress of the material and the plastic strain εp which is
calculated by PAM-CRASH for every element. Material rupture in the material model can beachieved by eliminating elements whose effective plastic strain reaches a value higher than a givenlimit strain. In Table 1 the material properties used for the simulations are summarised.
Table 1. Materials properties of the aluminiumsub-structures
Material Al 2024 Al 7075
Modulus GPa 73 71Poisson's ratio - 0.33 0.33
Yield stress MPa 306 496Yield strain % 0.418 0.7Max. pl. strain % 16.0 9.2
Parameter K MPa 695 783Parameter n - 0.15 0.092
Rivets: All parts of the fuselage structure were modelled separately and connected with rivetelements. In the FE code PAM-CRASH rigid bodies are used to represent the rivets. Two nodesare linked with such a rigid body and can move (translate and rotate) as a pair. The links betweenthe nodes are allowed to separate upon violation of the following failure criterion:
6
( PN/ PN* )a1 + ( PS/PS* )a2 ≤ 1
In this formulation the calculated normal and shear loads in the rivet PN and PS are related to the
normal and shear failure loads PN* and PS*. By varying the exponents a1 and a2 the interaction
between normal and shear failure can be modelled. In the simulations the following data wereincluded:
Normal failure load PN*: 8 kN
Shear failure load PS* : 5 kN
Rear Fuselage Bay Structure - Component Dynamic Test 1 (D1)
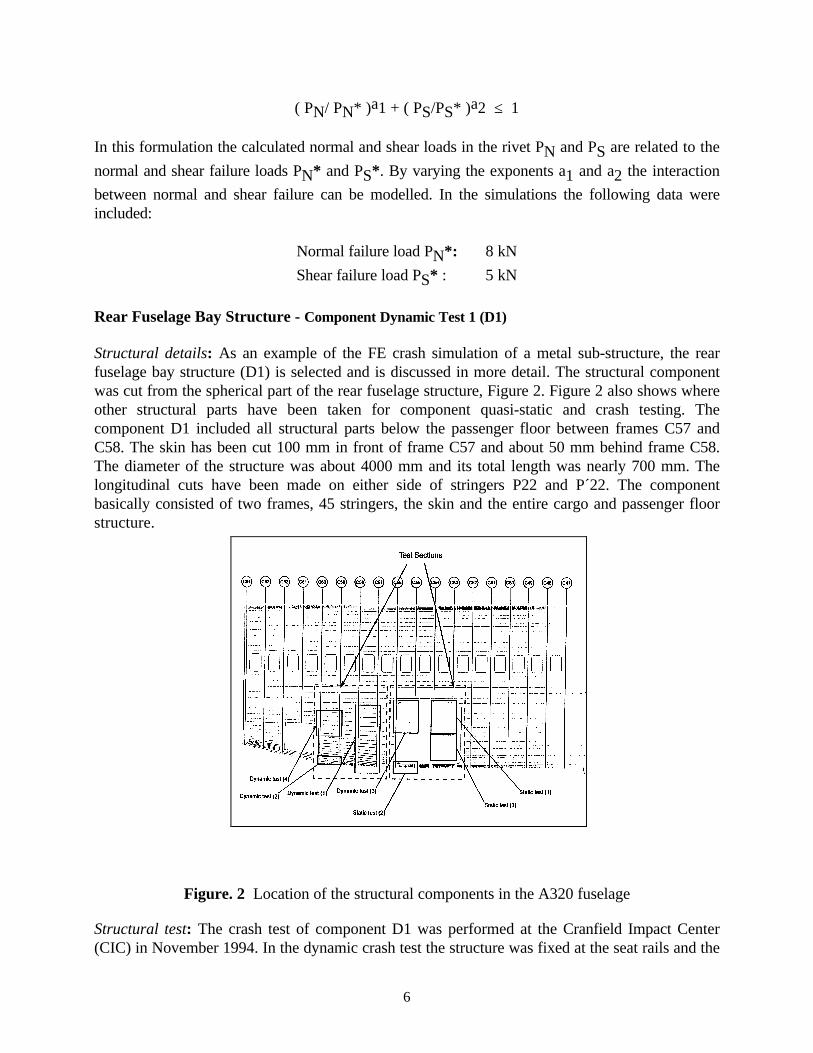
Structural details: As an example of the FE crash simulation of a metal sub-structure, the rearfuselage bay structure (D1) is selected and is discussed in more detail. The structural componentwas cut from the spherical part of the rear fuselage structure, Figure 2. Figure 2 also shows whereother structural parts have been taken for component quasi-static and crash testing. Thecomponent D1 included all structural parts below the passenger floor between frames C57 andC58. The skin has been cut 100 mm in front of frame C57 and about 50 mm behind frame C58.The diameter of the structure was about 4000 mm and its total length was nearly 700 mm. Thelongitudinal cuts have been made on either side of stringers P22 and P´22. The componentbasically consisted of two frames, 45 stringers, the skin and the entire cargo and passenger floorstructure.
Figure. 2 Location of the structural components in the A320 fuselage
Structural test: The crash test of component D1 was performed at the Cranfield Impact Center(CIC) in November 1994. In the dynamic crash test the structure was fixed at the seat rails and the

7
frames on the passenger floor level and was loaded by a trolley hitting the structure with an initialvelocity of 8.12 m/s. Due to the high mass of the trolley (1240 kg) and the limited EA capability ofthe structure the deformation has been limited to 320 mm with a bumper system made ofaluminium honeycombs. During the test, the data of two accelerometers located on the trolley andthree strain gage rosettes were measured. The test specimen was photographed before and afterthe test. Two high speed cameras and one video camera were also used for the documentation ofthe crash sequence.
Finite Element Models of component D1
Based on documents and drawings which were supplied by Daimler Benz Aerospace Airbus (DA),very detailed FE models (half models, whole models) have been created to perform pre- and post-test simulations of the complex behaviour of the structure under the described loading. Alldifferent parts of the structure like skin, stringers, frames and clips were modelled separately andconnected with rivet elements that could fail during the simulation. In Figure 3 the final mesh ofthe whole post-test FE-model is displayed. This final mesh consisted of 66440 nodes, 58884 shellelements and additional 3485 rivets.
The clamping and loading conditions in the simulations were similar to those realised in the crashtest. The displacements of the nodes along all four seat rails and at the frames on the passengerfloor level were suppressed. The trolley was represented by a moving rigid wall with a mass of1240 kg and an initial velocity as measured in the test just before the impact (8.12 m/s) was takeninto account.
Figure. 3 FE model of Dynamic Test 1 (D1)
Correlation of FE simulation runs and crash test data of component D1

8
For the pre-test simulations of the component D1 only two half models of the structure were used,one taking into account rivet failure and a reduced friction coefficient of 0.2 between the rigid walland the structure and for self contact. Although the fuselage structure is not exactly symmetrical itwas assumed that preliminary results obtained with this half models including symmetric boundaryconditions in the x-z-plane could give reasonable results for the trolley accelerations to help CICto instrument the test.
The post-test simulations comprised one half model and nine different whole models of thecomponent D1 taking into account combinations of rivet or no rivet failure, updated material data,material failure, and material definition with the Krupkowsky law. As a result of the post-testsimulations with the whole structure, Figure 4 shows the deformed structure 45 ms after the
impact. With a time increment of 10-3 ms, 45045 cycles were calculated. The total CPU-time on aHP9000/735 workstation was 37.6 h. Plastic deformations start on the left hand side of thestructure between the second and third stringer position, very close to the location where the skinfailed in the test. The plastic deformations in this region enlarge during the simulation andadditional plastification occur just beside reinforcements around the intersection of the struts withthe frames. In general, the correlation between the simulated deformations and those found in thedynamic crash test was very good.
Figure. 4 Deformed component D1 at 45 ms
A comparison of simulations with measured test data is given in Figure. 5. In Figure 5 the time-integrated acceleration signal is plotted together with the velocity of the rigid wall whichrepresents the trolley in the simulations. In the simulation which includes failure (Curve B) thevelocity remains slightly higher after 17 ms when failure of rivets and elements started. While theresults from the first simulation (Curve A; solid line) start to separate from the test curve thesimulation with rivet failure correlates very well with the test up to the point where the aluminium

9
absorbers suddenly stopped the trolley (Curve C, 42 ms). This comparison shows that a goodmodelling of the failure of rivets is necessary to calculate the structural behaviour correctly.
Figure. 5 Comparison of test and simulation of component D1 - trolley velocity
KRASH Simulation of the A320 Fuselage Section
Structural details: The fuselage section used for the crash test and crash simulations was a 3 mlong part of section 17 which is located right after the wing of the aircraft. The diameter of thesection was about 4 m and had a total mass of 2330 kg. It comprised 6 frames (C47 - C52). Thesection was equipped with 6 seat rows (18 seats) and 14 dummies, some of them represented bytheir corresponding masses. Two overhead bins with a mass of 254 kg were installed betweenframes C47 and C51.
Structural test: The drop test of the A320 fuselage section was carried out at CEAT/Toulouse inJuly 1995. The section was vertically dropped with a z-velocity of 7 m/s on a concrete surface. Itwas equipped with a total of 180 measurement channels: 48 at the dummies, 16 at the seats, 80 atthe structure, and 36 at the overhead bins. The data aquisition was done by an onboard systemwith an aquisition frequency of 12,5 kHz. Different views of the test were filmed with standardvideos (25 frames/s) and high speed cameras (500 frames/s).
KRASH Model of the Section
Model description: Three partners in the project simulated the section crash test with FE crashcodes. DLR focused on the KRASH approach for the section. A half model of the test section wasgenerated. In the lower part of the fuselage section where the main deformation of the structureoccurred, all 6 frames (C47 - C52) were represented with KRASH elements (beams, springs,masses). Figure 6 shows a 3-D representation of the KRASH section model. In the region abovethe floor the major load carrying frames 47, 49, 51 (location of the hatrack z-fittings) and 52 were
10
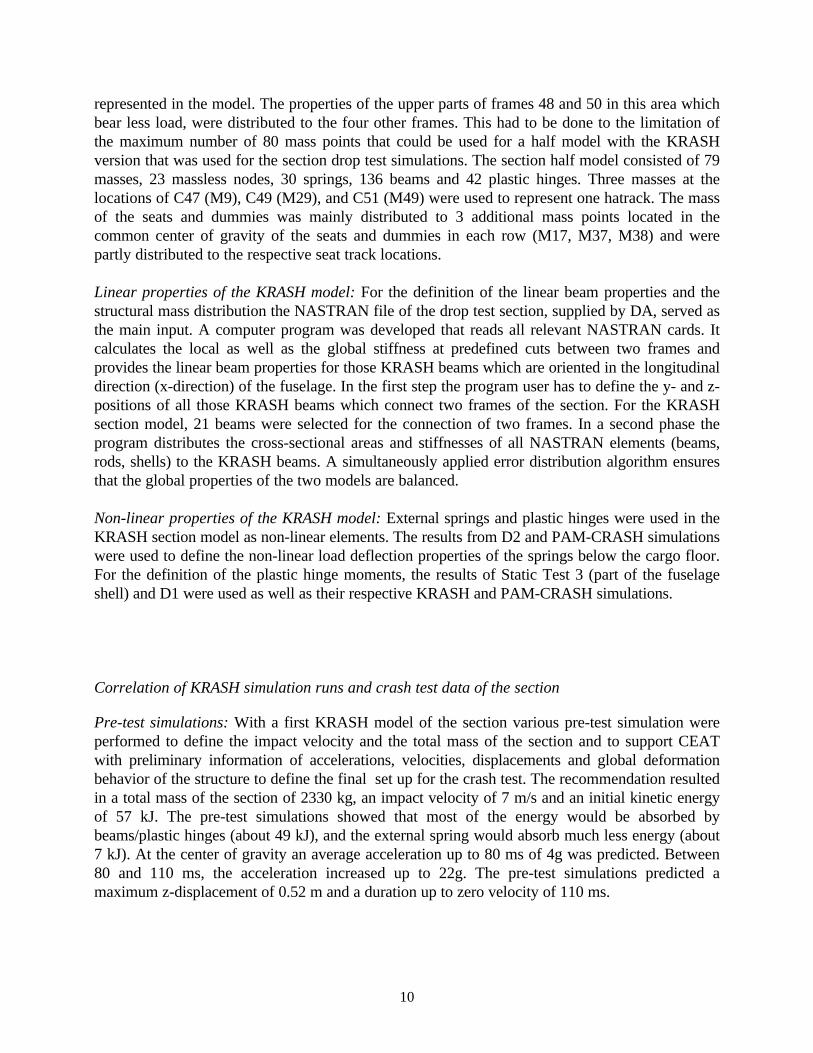
represented in the model. The properties of the upper parts of frames 48 and 50 in this area whichbear less load, were distributed to the four other frames. This had to be done to the limitation ofthe maximum number of 80 mass points that could be used for a half model with the KRASHversion that was used for the section drop test simulations. The section half model consisted of 79masses, 23 massless nodes, 30 springs, 136 beams and 42 plastic hinges. Three masses at thelocations of C47 (M9), C49 (M29), and C51 (M49) were used to represent one hatrack. The massof the seats and dummies was mainly distributed to 3 additional mass points located in thecommon center of gravity of the seats and dummies in each row (M17, M37, M38) and werepartly distributed to the respective seat track locations.
Linear properties of the KRASH model: For the definition of the linear beam properties and thestructural mass distribution the NASTRAN file of the drop test section, supplied by DA, served asthe main input. A computer program was developed that reads all relevant NASTRAN cards. Itcalculates the local as well as the global stiffness at predefined cuts between two frames andprovides the linear beam properties for those KRASH beams which are oriented in the longitudinaldirection (x-direction) of the fuselage. In the first step the program user has to define the y- and z-positions of all those KRASH beams which connect two frames of the section. For the KRASHsection model, 21 beams were selected for the connection of two frames. In a second phase theprogram distributes the cross-sectional areas and stiffnesses of all NASTRAN elements (beams,rods, shells) to the KRASH beams. A simultaneously applied error distribution algorithm ensuresthat the global properties of the two models are balanced.
Non-linear properties of the KRASH model: External springs and plastic hinges were used in theKRASH section model as non-linear elements. The results from D2 and PAM-CRASH simulationswere used to define the non-linear load deflection properties of the springs below the cargo floor.For the definition of the plastic hinge moments, the results of Static Test 3 (part of the fuselageshell) and D1 were used as well as their respective KRASH and PAM-CRASH simulations.
Correlation of KRASH simulation runs and crash test data of the section
Pre-test simulations: With a first KRASH model of the section various pre-test simulation wereperformed to define the impact velocity and the total mass of the section and to support CEATwith preliminary information of accelerations, velocities, displacements and global deformationbehavior of the structure to define the final set up for the crash test. The recommendation resultedin a total mass of the section of 2330 kg, an impact velocity of 7 m/s and an initial kinetic energyof 57 kJ. The pre-test simulations showed that most of the energy would be absorbed bybeams/plastic hinges (about 49 kJ), and the external spring would absorb much less energy (about7 kJ). At the center of gravity an average acceleration up to 80 ms of 4g was predicted. Between80 and 110 ms, the acceleration increased up to 22g. The pre-test simulations predicted amaximum z-displacement of 0.52 m and a duration up to zero velocity of 110 ms.

11
Figure. 6 KRASH model of the A320 crash test section
Post-test simulations: Results from the KRASH pre-test simulations for about 50 differentaccelerometer locations were published before the crash test. After the test, more than 80correlation of test results and KRASH pre-test simulations were performed. The KRASH pre-testmodel was very good in the prediction of the vertical accelerations, velocities and deformations aswell as of the EA mechanisms. However, it did not represent the outward movement of the lowerregion of the struts correctly. Therefore, several changes to a post-test model were made: thebeams below the cargo floor were modelled more accurately with a second beam added andshorter crush spring elements were used. Also, the plastic hinges at the cabin floor level wereremoved. Plastic hinges were added to the model in order to represent the behaviour in the areaof stringers P21. An overlay of the deformed structure gained from the crash test high speed filmand the KRASH post-test model is shown in Figure 7 at 100 ms. The global deformation behavioris represented very well. Compared to the pre-test simulation, the y-displacement of the struts andthe bending of the floor are in much better agreement with the test.

12
Figure. 7 Deformed structure and KRASH model at 100 ms
Figure 8 shows correlation of velocities for different locations within frame 51 (hatrack, floor andstrut). For the hatrack, there is only a difference for the short period between failure of the z-fittings and reloading via the retaining cables. All other correlation are in very good agreementwith the test results.
Figure 8 Velocities at frame 51- test versus KRASH post-test simulation
13
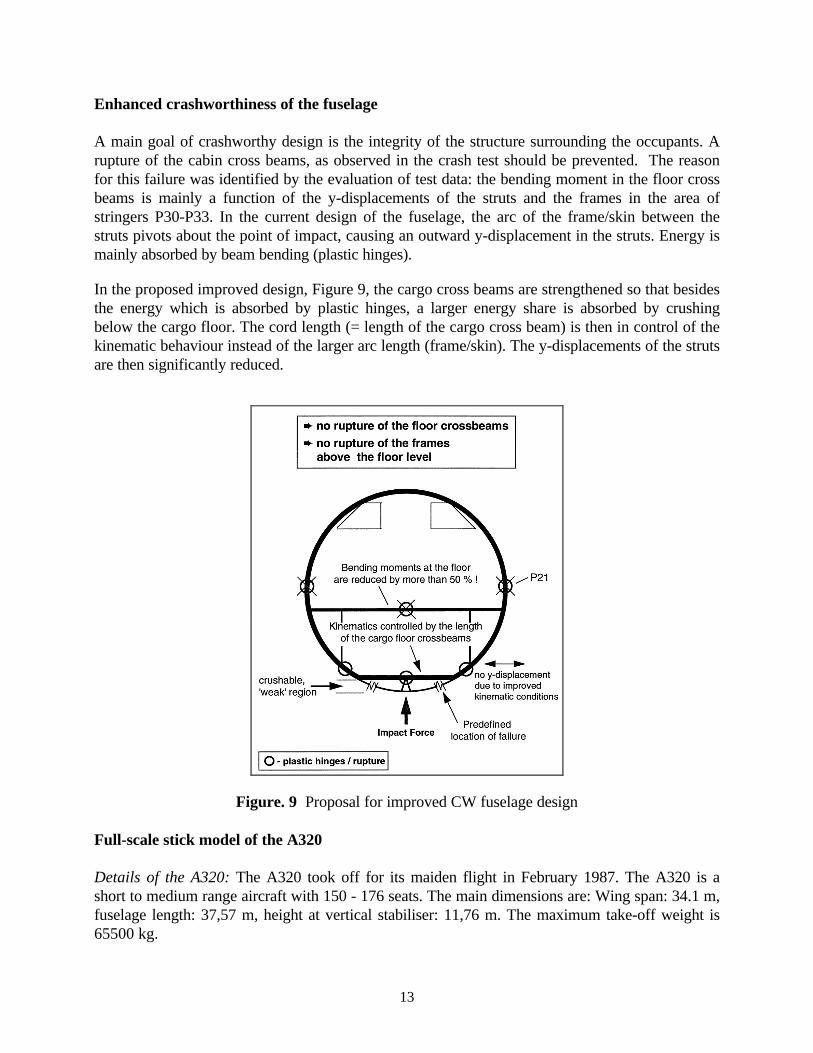
Enhanced crashworthiness of the fuselage
A main goal of crashworthy design is the integrity of the structure surrounding the occupants. Arupture of the cabin cross beams, as observed in the crash test should be prevented. The reasonfor this failure was identified by the evaluation of test data: the bending moment in the floor crossbeams is mainly a function of the y-displacements of the struts and the frames in the area ofstringers P30-P33. In the current design of the fuselage, the arc of the frame/skin between thestruts pivots about the point of impact, causing an outward y-displacement in the struts. Energy ismainly absorbed by beam bending (plastic hinges).
In the proposed improved design, Figure 9, the cargo cross beams are strengthened so that besidesthe energy which is absorbed by plastic hinges, a larger energy share is absorbed by crushingbelow the cargo floor. The cord length (= length of the cargo cross beam) is then in control of thekinematic behaviour instead of the larger arc length (frame/skin). The y-displacements of the strutsare then significantly reduced.
Figure. 9 Proposal for improved CW fuselage design
Full-scale stick model of the A320
Details of the A320: The A320 took off for its maiden flight in February 1987. The A320 is ashort to medium range aircraft with 150 - 176 seats. The main dimensions are: Wing span: 34.1 m,fuselage length: 37,57 m, height at vertical stabiliser: 11,76 m. The maximum take-off weight is65500 kg.

14
Model description: Modeling was started by determining the mass distribution and by defining thelocation and the properties of the beam elements. For the representation of the undercarriagefailure or engine separation, collapse loads were defined for the respective beams in the KRASHmodel. Springs were added to the model in order to represent the crushing zones of the aircraft(the lower part of the fuselage, the landing gear and the engine nacelles). NASTRAN filesprovided by DA were used as basic input to generate the mass distribution and the beamproperties. In the NASTRAN input files, the A320 half model is represented by 66 single masses,94 grid points, 51 beams and 46 rigid bars. The areas connecting the wings and fuselage withstabilizers are represented in a more complex way using 30*30 and 45*45 stiffness matrices. Inorder to automate as much as possible of the modelling process, a computer program (NAS2KR)was developed which reads the relevant NASTRAN files and writes parts of the KRASH inputfile. Figure.10 shows the A320 KRASH stick model which finally comprised 58 masses, 55 nodes,31 springs, and 57 beams. The number of masses had to be condensed, due to the limitation ofmass points (80) that could be used in the KRASH version which was used for the simulations.
Figure 10 A320 KRASH stick model
Beam elements: Most beam properties of the structure could be generated by using the programNAS2KR from the NASTRAN file. The properties of beams which connect the wings andstabilisers to the fuselage were approximated by extrapolation of the wing and stabiliser stiffness,respectively. Different loading conditions under which the landing gear collapses and the enginesseparate from the wings were known. The maximum landing gear loads and the loads when theengines separate from the wing were modelled either as plastic hinges and hinge moments or thedefinition of maximum loads in the relevant beam elements.
Spring elements: DA supplied load-deflection curves for the engine nacelle, the main and the noselanding gear. For the fuselage springs, the load-deflection curves were obtained by evaluation ofthe structural data of the fuselage. The comparison with other aircraft and their respectiveKRASH models was useful in the process of defining the spring characteristics. The sub-structuretests within the IMT research program could only be used to a certain extend, as the deformationsin these tests were small compared to the requirements for the stick model. However, the resultsof the section drop test served as excellent data base for the generation of the global forcedeflection curves.

15
KRASH stick model simulations
Simulations with extended landing gear: The following impact conditions were used for allsimulations with the KRASH stick model:
Velocity [m/s] vx
vy
vz
7508
Attitude [deg] Roll angle Pitch angle yaw angle
02 (nose up)
0
The parameter variations in the simulations included the influence of lift forces and two conditionsfor the engine separation (condition A: drag load failure, condition B: vertical load failure).Representative for the simulation studies, Fig. 11 shows the simulated crash sequence of theaircraft with extended landing gear, a stepwise reduction of the lift forces from 100% (0 ms), 70%(500 ms), and 20% (1000 ms), and the engine failure condition B. The landing gears failedbetween 110 and 130 ms, the engines failed at 140 ms without separation from the wing. The firstground contact of the fuselage occurred at 260 ms, the maximum deformation of 250 - 400 mm ofthe fuselage occurred between 450 and 550 ms. Maximum acceleration peaks reached 15g. Mostof the other peaks were observed between 4g to 6g.
Figure 11 Simulated crash sequence with extended landing gear (KRASH A320 stick model)
A comparison with other simulation studies showed that a complete disconnection of the enginesand the wings (condition A) caused about two times higher fuselage deformation. Also, not takinginto account any lift forces, led to much higher fuselage deformations.

16
Simulations with retracted landing gear: In this crash scenario the aircraft hits first with theengine nacelles. After 80 ms the connection to the wings failed without separation (condition B,further transfer of loads to the wing). The first fuselage contact occurred at 117 ms, a maximumdeformation of 500 - 700 mm of the fuselage was observed. Compared to the scenario withextended landing gear, nearly twice as big wing amplitudes could be observed.
COMPOSITE AIRFRAME SUB-COMPONENTS (FW4)
Modular Sub-floor Section Design Concept
To demonstrate one of the crash simulation methodologies used within the CRASURV project,the modular sub-floor section design concept is briefly described. The development of the conceptwas intensively supported by using PAM-CRASH simulation studies before the manufacturing oftools and crash test components was initiated.
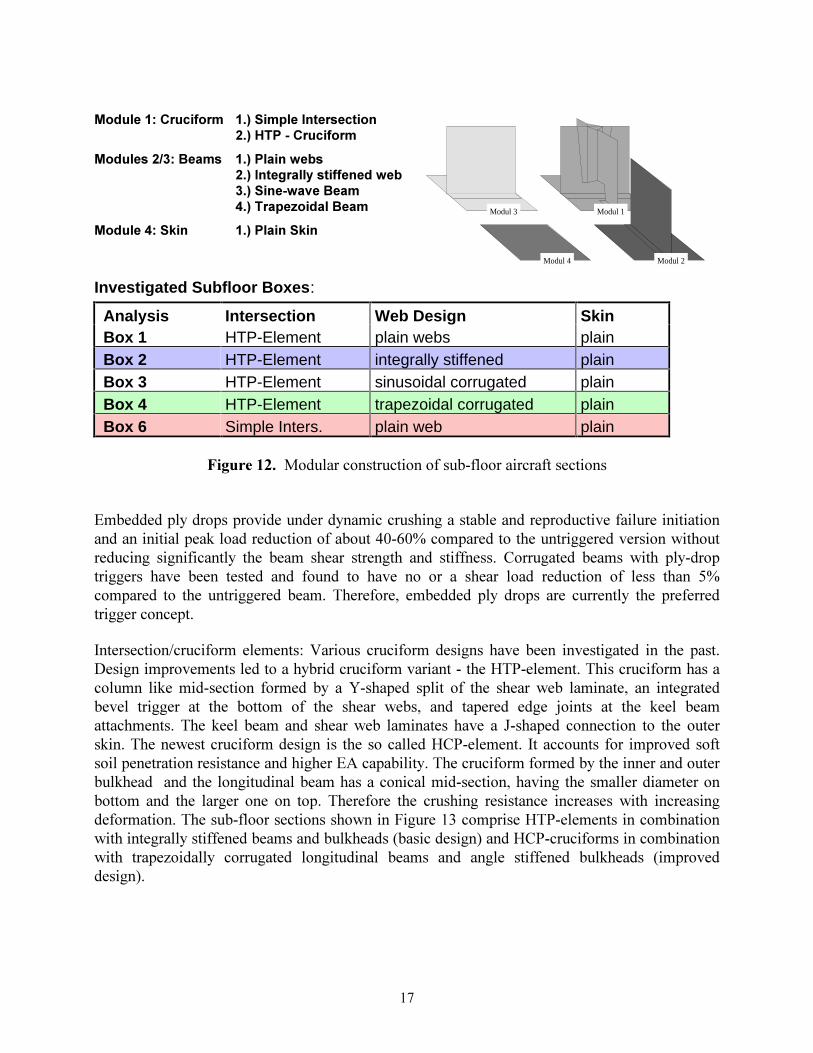
The modular design concept for aircraft sub-floor sections comprises various modules which canbe optimised separately in a first step with regard to EA performance and load carrying capabilityanalytically with FE techniques and which can be assembled in a second step to a sub-floorsection. This design and analysis phase is followed by a selection of promising concepts,manufacturing of structural elements or sub-floor sections, and experimental evaluation of thestructural performance or EA capability under crash loads in a drop tower to prove the conceptsand to validate the analytical predictions. The design concept shown in Figure 12 comprisesmodule 1 as intersections/cruciforms, module 2 as lateral beam or bulkhead section, module 3 aslongitudinal beam, and module 4 as the outer skin. In addition a fifth module representing thecabin floor panel can be considered. Existing modules or module combinations (sections) whichhave been analysed and partly tested to date are also given in Figure 12. The investigated loadcases using FE techniques for whole modular section concepts comprise pure bending, puretorsion and transverse compression/crushing (crash loading normal to cabin floor level). Thecrushing (EA-) performance is evaluated using PAM-CRASH; representative simulation resultsare presented in a later chapter.
Sub-floor element (module) designs
Sub-floor beams and bulkheads: Composite beams with sinusoidal or trapezoidal corrugated websare the most efficient aircraft sub-floor design concepts yet evaluated. They are efficient atcarrying shear and compression loads in normal flight, have high EA under crushing loads and,with hybrid lamination techniques, have good structural post crash integrity. Drawbacks of thesine wave concept, however, are the high fabrication costs, the interface with other structuralelements (i.e. adjacent fuel tank bladders) and the difficulty of incorporating suitable triggermechanisms, which reduce peak loads when the beam is crushed in the web direction duringimpact, without lowering the shear load performance. The determination of the static load capacitywhich in thin shell structures is limited by buckling, the influence of materials hybridisation andgeometry on crush characteristics, and the selection of trigger mechanisms are the main design aspects ofbeams or bulkheads with corrugated webs.
��
������������ ����� ����� �������������� ��������������� ����
�������������� �� ������ ��!�"���������#� ��$��� �������!�"����� ���! %���� �&����� ��'� � ���� �
�������&��( � ������ ���( �
Investigated Subfloor Boxes:
Analysis Intersection Web Design Skin Box 1 HTP-Element plain webs plain Box 2 HTP-Element integrally stiffened plain Box 3 HTP-Element sinusoidal corrugated plain Box 4 HTP-Element trapezoidal corrugated plain Box 6 Simple Inters. plain web plain
������������������� ����������� ������������� ������
���������������� ���������������������� ������ �������������������������������������������������������������������������������������������������������� ���� �������������� ������������ ���� ���� ��� ������� ��� ������ !� "������� ��� � ���� ������������ � ���� ����� �� ���� ��� ������ ��� ���� ��� �� � ��� ���� ��������� ��� �� � ���� #�������� ��� ���� ���������� ���!� $������%� ��������� ���� ��� � �� �������� ���� �������������������!
&��� ������'�������� ������� (�)��� � �������� �� ��� � ���� ����� ���� ������� ��� ���� � �!*� �������������� ����������������������������������+$,��������!�$�� ���������� �������� ��������� ������� ������ ��� � -� ����� ����� ��� ���� ��� ��� ������%� �� �������������� ������ �� ���� ������� ��� ���� ��� �� %� ��� ������ ����� .���� � �� ���� ����� ����������� !� $��� ����� ���� ��� ��� ��� ������ � ���� � /� ����� ����������� ��� ���� ���� ���!�$����� � ������������ ���� � � ���� ��������+",��������!� &�� ������ � ��� �������� ��� ��������������� � ���������������0���������!�$�������������������������������������������� ���� ���� ����������������� ������������� ������%������� ���� ��������������������� ��� ���� ���� ���� ��� ���!� $������� ���� �� ����� � � ����� ���� � � ���� ���� ������������!�$��� �������� ������ � �� �����1������2������ ��+$,�������� �������������� ������������� ������������ ����������� �3� ����� ���4����+",�������� �������������� ���� ���5������� �������� ������������ ��� � ��� ����� ��������� ������� � 3��������� ���4!
Modul 3
Modul 2
Modul 1
Modul 4

18
PAM-CRASH composite Bi-phase model
The so-called composite Bi-phase model in PAM-CRASH was initially developed to model the behaviour ofcomposite plies with unidirectional fibre reinforcements (UD-plies). To model the failure of the fibres andthe matrix individually the composite is assumed to be a heterogenous material with a matrix and a fibrephase. These two phases have their own rheological behaviour and individual representation of failure. Theelastic behaviour of each composite materials ply is calculated by a combination of the orthotropicbehaviour of the matrix phase and a one-dimensional reinforcement in the direction of the fibres. The shareof the fibres in the composite is given by a fibre volume ratio αf.
σ = CUD ε with CUD = Cm + Cf
Both, the matrix phase and the fibres may undergo modulus fracturing damage after an initiallinear elastic phase according to
Basic DLR box designBasic DLR box design iiiiiiiiiiii
Improved DLR box designImproved DLR box design hhihhi
Figure 13. Sub-floor section designs comprising HTP- and HCP-cruciforms

19
Cm(dm) = Cm0 (1-dm)andCf(df) = Cf0 (1-df)
where C is the instantanious modulus matrix in the stress strain matrix relationship σ = CUD ε, C0
is the undamaged initial modulus matrix and d is a scalar damage parameter that depends onstrains. The damage parameters for the matrix and the fibre phase can be expressed as follows:
dm(ε) = dm,v(εv) +dm,s(εs) df(ε) = df,v(εf)
The scalar functions dm,v(εv) and dm,s(εs) for the matrix damage parameters describe the evolutionof damage with respect to the equivalent strains εv and εs. The volumetric equivalent strain εv isthe trace of the total strain tensor (1st invariant) and the equivalent shear strain εs can beinterpreted as the 2nd invariant of the deviatoric strain tensor. The damage parameter for the fibredamage df,v is based on the strain in the fibres. The individual damage functions dm,v, dm,s and df,v
can be defined individually and different in tension and compression. The matrix phase is definedto be in tension when the equivalent volumetric strain εv (first strain invariant) is positive, while thefibres are in tension when the fibre strain is positive. The basic shape of each of the damage curvesis shown in Figure 14.
Figure 14. Schematic fracturing damage function and corresponding stress-strain curve
The damage is assumed to be zero for equivalent strains below the initial threshold strain εi
(volume as well as shear). Then the damage parameter d grows linearly between εi < ε < ε1 andε1 < ε < εu , where ε1 is an intermediate equivalent strain with the corresponding intermediatedamage d1, and εu is the ultimate equivalent strain with the ultimate damage du. This bi-lineargrowth of the damage with increasing strains leads to a shape of the stress-strain curve with twoparabolas. Beyond the ultimate damage du the residual stress in the stress-strain curve is supposedto be constant. Therefore, the damage functions are assumed to grow and asymptotically reach thevalue 1.
As input for each individual ply the equivalent strain parameters εi, ε1 and εu and the damages d1
and du have to be given for both kinds of matrix damage and the fibre damage in tension andcompression. The total number of input parameters just for the description of the damageevolution is therefore 30.

��
������������������� �� ������������������ �����������������
�� �����������������������������������������������������������
����������������������������������������� ���� �������������� ��������� ������������������������������������������������������ �� ����������� ���� ���� ������������ �!���������������������������������"# �$��������������������������� �����%������������� ������������������&�����'�(���� ������� �������� �)������������������������������������������� ���������
*�����+������������,������� �������������������������������������������������*����������� ����� ��� ����-����� *���� &++� ��� ����������� ���� ������ ����� ���� ����� � $��� ��������������������'������������������������������������ �$��������.�������,�������������������� ��������������������������������� ���������������������������������������� �/���������� �������(� ������������� � ������������������ ����������� ����� � ���� ���� �������� ����������� ��� ������ �)���� ��������������� *����&+��������������� ���� ����� ,����� ���������� "��� ��� � � �� �������� ���� ����� ������ *���� '+� ������ ���� ����� ���� ����� ����� ������������������������� ���"(������ ��� ������ �0��������������������������������� �������������������������'��1�
��������� ���� �������� � ������������ ���������� ���� ���� ��� ����������� ��������� ��������������� ��� ������� ��������� ���� ���� ����� �������� ����� �� ����-����� ��������� ,��������*�+�������������������������� ������"�������������������� ���������������������������������������2�3���� �����������*&��#+�*� ���������"4+ �0������������������� ��%������ ���������������������������������������(������������������ �)�������������������������������������� ����� �������������������������������������������������� �/������"'�����������������"������ ������� ���������� �$���� ������������*����������+������������
Z-Velocity (upper mass)[m/s]
-10
-9
-8
-7
-6
-5
-4
-3
-2
-1
0
1
Deformation [mm]0 15 30 45 60 75 90 105 120 135 150
Box1 Box2Box3 Box4Box6

�"
�������� ������������� ������������ �/�����������������������-�����,������������������������������� ���������������������������������������������������������������� ������ ���������������������������0���������
� !�"#�$ !�
�����������������305��60!2���������������������������������������������������������������������� �� ���� ��� �� ������ � $��� ���������� ����� ������ ����� ���� �������� ���������������������������������������������������������������%���� ���������������� ������������ � )��� ����� ������� ���� ��� ���������� ����� ��� ��� ��� ���� ��,�������� �� ��� �����������������������%��������� ��37���� �$������������������������������������������������������� �0������������������������������������������������������������ ��������������� �
$������������������ �������������������������������������������������������������������������������������������������������������������������������������������� �0����������%���� �� ��� �������� ���������� ���� ��� ���� ����������� ����� � )���� ����� ��,� �� �����%���� �� �� ���� ��������� � � ������������ ��������� ���������� ����� ��������� ���� ����������������� ������������������������������ ���������������������������������������������������� ��������������������������� ��� ��������������������������������� �����
�������������� ����� ������������
kN
0
100
200
300
400
500
600
700
800
900
mm0 10 20 30 40 50 60 70 80 90 100
Simul. dlr_r2_v2: Z_load/ DeformationTest dlr_r1: Z-Load/ DeformationSimul. dlr_r1_v3a: Z_load/ Deformation
������� ��������������������������������������������%�3�������������� ������������ ��������*�8"����+

22
new materials models with associated test methods for measuring failure and damage parametersare currently active research areas.
A hybrid code such as KRASH is well established in the aircraft industry and has been developedspecifically for crashworthiness studies. Geometrical models are relatively simple as isdemonstrated by the complete A320 section and full-scale stick model. The designer can carry outin short time parameter variation studies with the program. On the other hand considerableengineering experience is required to obtain good results with hybrid codes. Skill is required in theidealisation of the geometry model, in determining mass distribution and spring stiffnesscharacteristics so that essential structural features are included. Where spring properties are highlynon-linear, as in crush elements, it is necessary to carry out crush tests on critical elements in orderto characterise spring properties. Thus the hybrid method becomes semi-empirical and not acomplete predictive tool.
For future vehicles - cars and aircraft - crash requirements will be of growing importanceconcerning operation licenses. Ultra-light structural concepts will be required to account for lowpollution and effective engine concepts with respect to environmental aspects. Therefore,composite crushing behaviour will be a matter of enlarged interest for the manufacturers. A lot ofdifferent composite element configurations were crash tested in the past and further tests must becarried out. Development of computer codes and approximation formulae must be continued.However, unrealistic emphasis on exaggerated exactness postulation should be avoided due to thetypical scatter of response of crashing structures.
REFERENCES
1. IMT-2002 Crashworthiness for Commercial Aircraft, EU RTD Project, 1993-1995. 2. „CRASURV - Design for Crash Survivability“, EU RTD-Project, 1996-1999 3. LS-DYNA3D, Livermore Software Technology Corp., Livermore, CA 94550. 4. PAM-CRASH, Engineering Systems International GmbH, D-65760 Eschborn. 5. Gamon, M, Wittlin, G., La Barge, B., KRASH 85 User´s Guide - Input/Output Format,
DOT/FAA/CT-85/10, July 1985 (revised May 1986) 6. DRI/KRASH Version 9601 - Users Manual, Dynamic Response Inc., Sherman Oaks,
California, USA, January 1996.