Embed Size (px)
Citation preview

California Rapid Assessment Methodfor Wetlands and Riparian Areas
(CRAM)
Introduction

• Overview of CRAM
• Background and Development
• Wetland Monitoring Framework
Topics for Discussion
California’s Wetland ManagementChallenges
• Numerous State and
Federal programs focus
on regulating and
managing wetlands
• Lots of wetland
monitoring, but
lacking coordination
and standardized
assessment tools

• Are we making a difference?
• Are our programs effective?
• Is additional investment justified?
Millions of public and
private funds expended
on wetland acquisition,
restoration and
enhancement in
California
California’s Wetland ManagementChallenges

Provide rapid, scientifically defensible,standardized, cost-effective assessments of thestatus and trends in the condition of wetlandsand the performance of related policies,programs and projects throughout California.
Goal of Developing CRAM

What Is CRAM?
CRAM is a field-based, diagnostic tool that, whenused as directed, provides rapid, repeatable,numeric assessment of the overall condition of awetland based on visible indicators of its form,structure, and setting, relative to the leastimpacted reference condition.
What is rapid?
CRAM requires a team of 2-3 trainedpractitioners less than 3 hours,maximum, to assess a representativewetland area. That’s 3 hours from thecar to final results.

What Is overall condition?
Overall condition is the capacity or potential ofa wetland to provide the functions andservices expected for the same type ofwetland in its natural setting, assessed relativeto “best” reference condition.

CRAM Modules
Estuaries
● Perennial tidal saline
● Bar-built (lagoons)
Streams
● Confined/unconfined
Depressional Wetlands
Vernal Pools
Lakes (lacustrine)
Slope Wetlands
Wet Meadows
Seeps and Springs
Playas

CRAM is structured to guide the user into andthough a wetland in an orderly and thoroughassessment of its overall condition.
CRAM moves into the wetland through theadjacent landscape and buffer.
In the wetland, CRAM examines structure in 3D.
CRAM Design

CRAM Design
CRAM recognizes four attributes of wetland condition
Each attribute is represented by 2-3 metrics, some ofwhich have sub-metrics.
LandscapeContext
Hydrology PhysicalStructure
BioticStructure
= Overall (Index)Score
WetlandCondition

Each Attribute Score represents a suite ofexpected functions
● e.g., Landscape and Buffer Attribute representsecological connectivity at landscape scale, ability ofbuffer to mediate external stressors, etc.
● e.g., Hydrology Attribute represents hydrologicregime (hydroperiod, water sources, etc.)
Condition = status at specific time point
Function = process occurring over time
Scientific Meaning of CRAM Scores

Fundamental unit of CRAM is theAssessment Area (AA)
100m

LandscapeContext
Hydrology PhysicalStructure
BioticStructure
Buffer
Landscape Connectivity
WetlandCondition
CRAM Design: Metrics

LandscapeContext
Hydrology PhysicalStructure
BioticStructure
Buffer
Landscape Connectivity
% of Area with Buffer
Buffer Condition
Buffer Width
WetlandCondition
CRAM Design: Sub-metrics

AlphabeticScore
NumericScore
Alternative State
A 12 Average buffer width 190-250m
B 9 Average buffer width is 130 – 189m
C 6 Average buffer width is 65 – 129m
D 3 Average buffer width 0 -64m
Sub-metric Scoring Example
Mutually exclusive alternative states
Represent full range of possible condition
Buffer Width

WetlandCondition
LandscapeContext
Hydrology PhysicalStructure
BioticStructure
Vertical Biotic Structure
Horizontal Interspersion
Plant Comm. Composition
A
C
B
12 or 100%
6 or 50%
9 or 75%
=
=
=
75 %47 %30 %57 %
CRAM Scoring:Ratio of metric scores Attribute score
27/36 = 75%of Possible
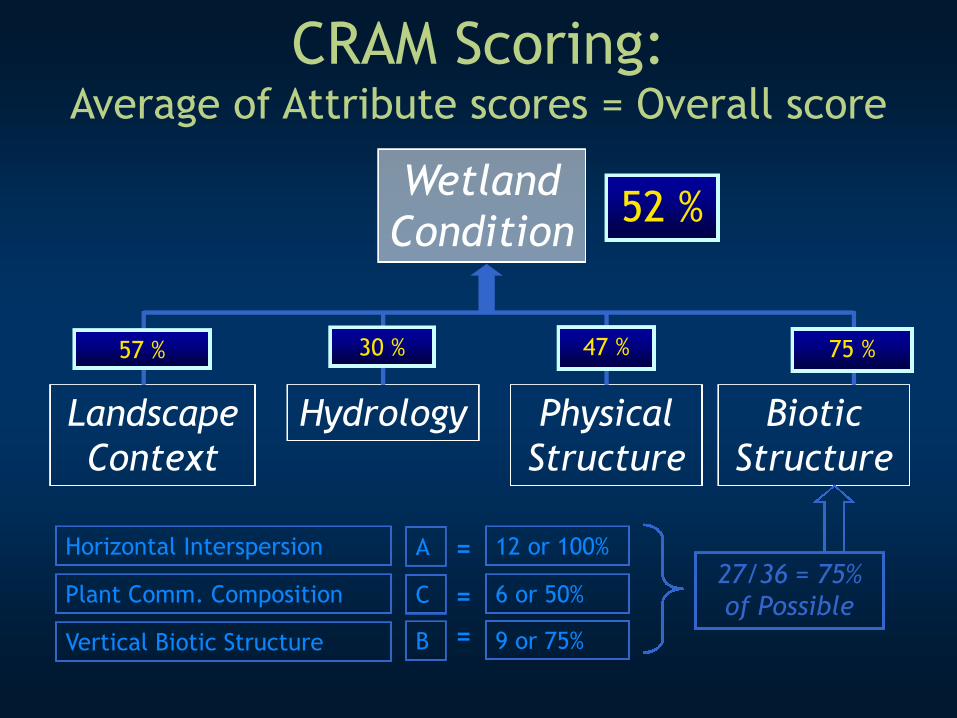
WetlandCondition
LandscapeContext
Hydrology PhysicalStructure
BioticStructure
75 %47 %30 %57 %
52 %
CRAM Scoring:Average of Attribute scores = Overall score
Vertical Biotic Structure
Horizontal Interspersion
Plant Comm. Composition
A
C
B
12 or 100%
6 or 50%
9 or 75%
=
=
=
27/36 = 75%of Possible

CRAM Framework
WetlandCondition
LandscapeContext
Hydrology PhysicalStructure
BioticStructure
Stressor Checklist

Identify possible causes for lowCRAM scores
Identify possible corrective actions
Develop testable hypothesesrelating scores to stressors
Uses of the Stressor Checklist

Download Software,User’s Manual, Field Books
Upload Data, Suggestions
View Results
CRAMwetlands.org

Store, Retrieve, and Visualize Data and Results
cramwetlands.org

CRAM Development

Development of CRAM
1. Develop a strategic plan (USEPA)• Build State capacity• Issue guidance• Encourage implementation
2. Establish Statewide and Regional Teams• Build 1 method per wetland type for all regions• Involve user community
3. Develop conceptual models• Other RAMs• Wetland form and function• Assumptions and tenets of CRAM

Development of CRAM
4. Verify method• Calibrate to BPJ• Field test across range of condition
5. Validate method• Correlate scores to L3 data• Test repeatability within and among teams
6. Implement• Through existing State and federal programs• Through new regional programs• Process for regular review and revision

CRAM Development Process
QAPP for the Development of a Wetland Rapid Assessment Methodin California Phase II (2005)
Rapid Assessment in California (Sutula et al. 2006)

• CRAM currently validated for perennially
tidal estuaries and streams
Development of CRAM
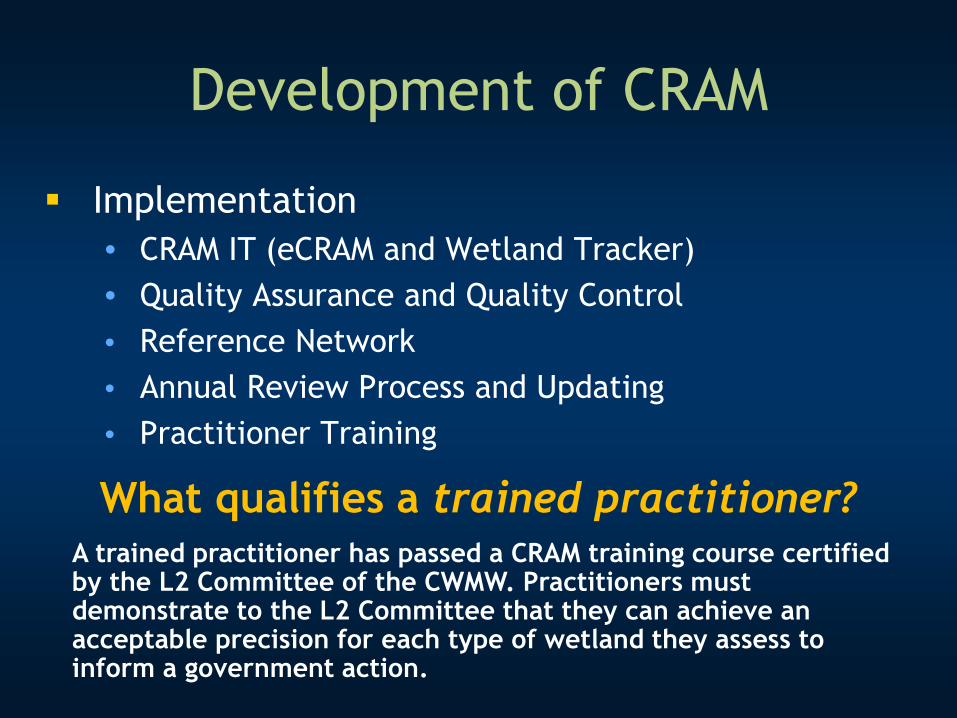
Implementation
• CRAM IT (eCRAM and Wetland Tracker)
• Quality Assurance and Quality Control
• Reference Network
• Annual Review Process and Updating
• Practitioner Training
What qualifies a trained practitioner?A trained practitioner has passed a CRAM training course certifiedby the L2 Committee of the CWMW. Practitioners mustdemonstrate to the L2 Committee that they can achieve anacceptable precision for each type of wetland they assess toinform a government action.

Peer Review
USACE ERDC Review (completed 2008)
SWRCB Review (completed Sept. 2011)

Institutional Support forCRAM

Evolving State Program
California Water Quality Monitoring Council
Established by Ca. Legislature in 2006 (SB 1070)
Co-chaired by Natural Resources and CalEPA
Two Major Goals:
Improve coordination of water quality monitoringprograms in California (10 yr. workplan)
Make information more accessible to agencies andthe public (web portals)

California Water Quality Monitoring Council
CaliforniaWetland
MonitoringWorkgroup
BioaccumulationOversight Group
California WaterQuality
MonitoringCollaboration
Network
GroundwaterAmbient
Monitoring &Assessment
Program
Beach WaterQuality Work
Groups
Theme-specific internet portals
www.CaWaterQuality.net
Theme-specific
workgroups
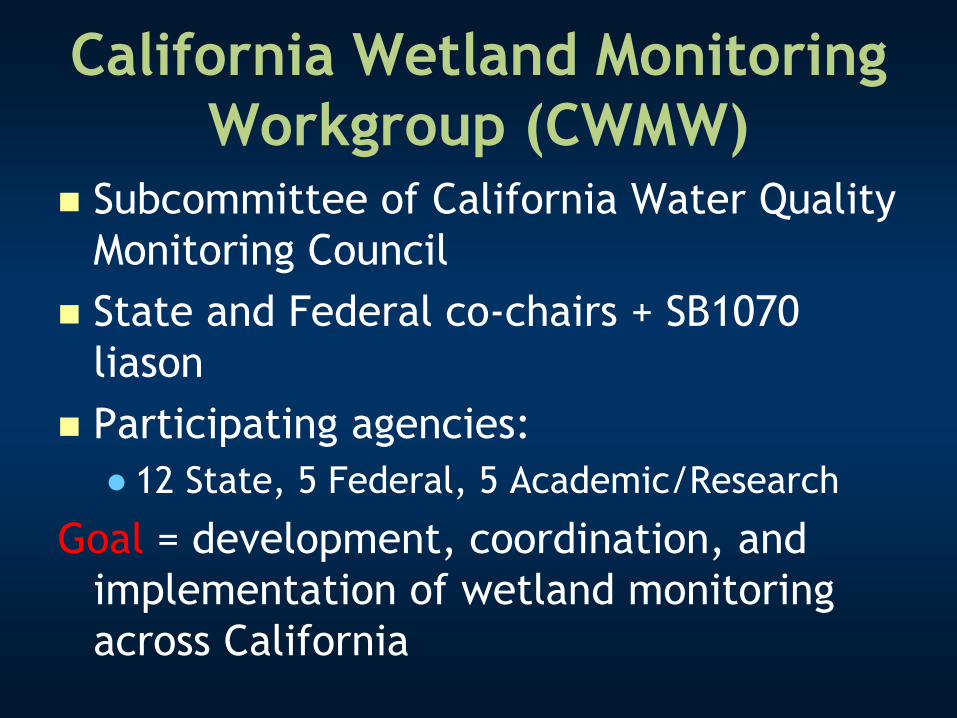
California Wetland MonitoringWorkgroup (CWMW)
Subcommittee of California Water QualityMonitoring Council
State and Federal co-chairs + SB1070liason
Participating agencies:
● 12 State, 5 Federal, 5 Academic/Research
Goal = development, coordination, andimplementation of wetland monitoringacross California

Level 2Rapid assessment of
overall wetland condition
Level 1Resource inventories
and maps
e.g. Does thewetland supportsensitive spp.?
Level 3Intensive assessment of
specific functionality
Ambient Sample Frames
Validate Level 2
Three-tiered Monitoring Frameworkfor Wetlands
What is theregional
condition ofwetlands?
How does theproject compare
to regionalwetland
condition?
Where arewetlands inthe region?
e.g. CRAM
How manywetlands inthe region?

California Wetland Monitoring Workgroup
Level 1Subcommittee
Level 2Subcommittee
Level 3Subcommittee
Aquatic Ecosystem Health Theme
Monitoring/AssessmentCommittees

How Does CRAM Relate toWetland Monitoring?
Part of a comprehensive monitoringand assessment toolkit for WRAMP
WRAMP
Wetland andRiparian Area
Monitoring Program

Wetland and RiparianMonitoring Program (WRAMP)
Question driveno Flexible: support individual agency’s info needso Support, not subsume agency programs
Consistent Statewide Frameworko Common tools and data managemento Focus on Levels 1 and 2 & data management
Regional Implementationo Build on existing programso Customize to meet regional/local needs
Management of Statewide Products Level 1 (mapping) Level 2 (CRAM + other RAMs)
Ongoing Technical Support and Coordination CWMW provides statewide coordination Most “work” occurs through regional teams

Wetland and Riparian AreaProtection Policy (WRAPP)
Policy development via SWRCB
Goals :
develop a consistent statewide wetland policy
provide common framework for wetland andriparian area monitoring and assessment

California Water QualityMonitoring Council
Level 1Committee
California WetlandMonitoring Workgroup
South CoastRegional
Team
My WaterQuality Web
Portals
SF BayRegional
Team
CentralCoast
RegionalTeam
North CoastRegional
Team
SierraRegional
Team
CentralValley
RegionalTeam
Level 2Committee
Level 3Committee
Regional DataCenters
CRAM
CEDEN
WRAMP
StateWetland
andRiparianPolicy
AquaticEcosystem
HealthSWAMP
10 yr. Monitoring Strategy
Integration

Thank You