Embed Size (px)
Citation preview

Craig A. Bond, Aaron Strong, Nicholas Burger, and Sarah Weilant

Limited Print and Electronic Distribution Rights
This document and trademark(s) contained herein are protected by law. This representation of RAND intellectual property is provided for noncommercial use only. Unauthorized posting of this publication online is prohibited. Permission is given to duplicate this document for personal use only, as long as it is unaltered and complete. Permission is required from RAND to reproduce, or reuse in another form, any of its research documents for commercial use. For information on reprint and linking permissions, please visit www.rand.org/pubs/permissions.
The RAND Corporation is a research organization that develops solutions to public policy challenges to help make communities throughout the world safer and more secure, healthier and more prosperous. RAND is nonprofit, nonpartisan, and committed to the public interest.
RAND’s publications do not necessarily reflect the opinions of its research clients and sponsors.
Support RANDMake a tax-deductible charitable contribution at
www.rand.org/giving/contribute
www.rand.org
For more information on this publication, visit www.rand.org/t/RR2130
Library of Congress Cataloging-in-Publication Data is available for this publication.
ISBN: 978-0-8330-9897-9
Published by the RAND Corporation, Santa Monica, Calif.
© Copyright 2017 RAND Corporation
R® is a registered trademark.
Cover image: tranquocphongvn/Fotolia.
Back cover image: Karel Miragaya/Fotolia.

PrefacePolicymakers, program practitioners, and investors who
want to achieve the greatest possible benefits from the
resilience projects that they support lack effective tools
to estimate the net benefits those projects provide
relative to alternatives. The RAND Corporation and the
Rockefeller Foundation formed a partnership to develop
a modeling framework that can be used in a decision
analysis environment, providing a structured way to
think about the benefits and costs of projects developed
with a resilience lens. We developed the Resilience
Dividend Valuation Model (RDVM) to help practitioners
evaluate resilience outcomes by quantifying the
resilience dividend. This guide complements the more
detailed report on the RDVM [Resilience Dividend
Valuation Model: Framework Development and Initial
Case Studies], and it walks through how the RDVM can
be applied by individuals and communities to assess and
evaluate resilience investments. This work was supported
by the Rockefeller Foundation.
RAND Infrastructure Resilience and Environmental PolicyThe research reported here was conducted in the RAND
Infrastructure Resilience and Environmental Policy
program, which performs analyses on urbanization and
other stresses. This includes research on infrastructure
development; infrastructure financing; energy policy;
urban planning and the role of public–private
partnerships; transportation policy; climate response,
mitigation, and adaptation; environmental sustainability;
and water resource management and coastal protection.
Program research is supported by government agencies,
foundations, and the private sector.
This program is part of RAND Justice, Infrastructure, and
Environment, a division of the RAND Corporation
dedicated to improving policy and decisionmaking in a
wide range of policy domains, including civil and criminal
justice, infrastructure protection and homeland security,
transportation and energy policy, and environmental
and natural resource policy.
Questions or comments about this report
should be sent to the co-project leaders, Craig
Bond ([email protected]) or Aaron Strong
([email protected]). For more information about
RAND Infrastructure Resilience and Environmental
Policy, see www.rand.org/jie/irep or contact the director
iiiPreface


ContentsPreface iii
Contents v
Figures vii
Tables vii
SECTION 1 Background and Rationale 1Objectives of This Guide 2Organization of This Guide 3
SECTION 2 Motivating the Resilience Dividend Valuation Model: Inclusive Wealth Theory 5
Components of Inclusive Wealth 5Dynamics of the System 6Inclusive Wealth and the Resilience Dividend 7How the Resilience Dividend Valuation Model Compares to Project Evaluation 8
SECTION 3 Elements of the Resilience Dividend Valuation Model and Case Archetypes 9
Capital Stocks 9Goods and Services 9Production Functions and the Allocation Mechanisms 10
Production Functions 10Allocation Mechanisms 10
Social Welfare Function 12Shocks and Stressors 12Project Interventions 13Example Settings for Applying the Resilience Dividend Valuation Model 13
Ex Post Evaluation of a Project with No Co-Benefits and a Single Shock 13Ex Post Evaluation of a Project with Co-Benefits and a Single Shock 15Ex Post Evaluation of a Project with a Stressor 16Ex Ante Evaluation of Projects 17
vContents

SECTION 4 Using the Resilience Dividend Valuation Model and Data to Assess the Resilience Dividend 19
General Steps in Applying the Resilience Dividend Valuation Model Framework 19Ex Post Cases: Valuing the Dividend after a Project is Complete 20
General Principles 20Using the Resilience Dividend Valuation Model for Ex Post Cases 20
Ex Ante Cases: Valuing the Dividend and Choosing Between Projects 25General Principles 25Using the Resilience Dividend Valuation Model for Ex Ante Cases 25Choosing between Projects 25
SECTION 5 Key Considerations for Decisionmakers 27Skills Needed to Apply the Resilience Dividend Valuation Model 27Model Relationships as Hypotheses 28Working with the Realities of Limited Data 28Recommendations Related to Data Collection 28
Glossary 31
References 33
Contentsvi

FiguresFigure 2.1. Production and Consumption Relationships in an Economic System 6
Figure 2.2. The Path of Social Welfare over Time 7
Figure 2.3. Dynamic Welfare Paths for Project and BAU Cases 7
Figure 3.1. Changes in Outcomes due to Changes in the Allocation Mechanism 11
Figure 3.2. Valuing a Project with No Co-Benefits and a Single Shock 14
Figure 3.3. Valuing a Project with Co-Benefits and a Single Shock 15
Figure 3.4. Valuing a Project with a Stressor 16
Figure 3.5. Valuing a Project Ex Ante Using Expectations 17
TablesTable G.1. Mapping Language Used in the Resilience Community to the Inclusive Wealth Context 31
viiFigures and Tables


SECTION 1
Background and RationaleRAND and the Rockefeller Foundation formed a
partnership to develop the Resilience Dividend Valuation
Model (RDVM), a modeling framework that can be used
to support decisionmaking about resilience investments
by quantifying a resilience dividend. For this work, the
resilience dividend is the difference in net benefits to
society between a resilience project and business as
usual (BAU) (Rodin, 2014).1 The benefits are typically
related to the ability of “people to better withstand
disruption in the future, to improve current situations,
and/or to positively change the trajectory of a place and/
or people’s lives.”2
To put a finer point on it, the resilience dividend can be
defined as the difference in the stream of net benefits to
a society’s well-being between resilience projects and a
counterfactual setting, which can be either a BAU case
or a project that is not developed with a resilience lens.
While resilience dividend benefits often involve
recovering from a particular shock or withstanding a
stressor, a resilience project can have other benefits as
well. Our broader interpretation of the dividend is
more inclusive.
Valuing these additional benefits from a resilience
project requires that we understand how resilience
policy and program interventions change the valuable
elements of any given system over time—through
providing resources, relaxing constraints, or increasing
opportunities to stakeholders—and apply the means of
monetizing these changes. Of particular importance is
the consideration of the linkages between elements of a
system and how the system structure can be leveraged
to create additional co-benefits.
Our working definition of resilience is the capacity of a
system—a household, a community, an organization, or
a coupled natural-human system—to prepare for
disruptions from outside of the system, to recover from
shocks and stresses, and to adapt and grow from a
disruptive experience.
A resilience project is defined as an intervention that, at
least in part, seeks to improve the ability to manage,
respond to, or recover from a shock or stress that might
result in a loss of well-being, and that has the potential
to produce other benefits not directly related to the
shock or stressor. This latter concept—often termed the
“co-benefits” associated with the resilience project—is
a key part of what distinguishes a resilience project from
an intervention that focuses solely on disaster risk
recovery outcomes. In particular, what might be termed
a resilience lens is a view that approaches project
development and investment strategies in a way that
takes into account system properties and addresses
both the risk of loss from a shock or stressor and the
resulting co-benefits the project or investment produces.
From an economic standpoint, good decisionmaking
requires prioritizing feasible projects with the greatest
total net benefits. Failure to fully take resilience dividend
benefits into account will underestimate the total value
1 Rodin, J. (2014). The Resilience Dividend: Being Strong in a World Where Things Go Wrong, Public Affairs, New York.
2 This language was taken from documents provided to the RAND research team by the Rockefeller Foundation.
1Section 1 Background and Rationale

of a project, perhaps leading to suboptimal decisions.
Even if the dividend cannot be explicitly valued (due to,
e.g., data limitations), qualitative information about
these benefits might be useful in describing project
outcomes and choosing among competing courses
of action.
Objectives of This GuideThis document provides a guide to the RDVM that was
developed as part of this research. The RDVM is a
modeling framework designed to help analysts and
practitioners estimate the realized or potential resilience
dividend from a project. Based on the inclusive wealth
theory, the RDVM is a dynamic, systems-based approach
that maps changes in the flow of goods and services
from a resilience project into changes in well-being, and
provides guidance on the data needed to estimate the
resilience dividend. The model provides the theoretical
and empirical basis for estimating the dividend over a
range of projects, settings, and scales. RDVM, which
combines elements of project evaluation and economic
valuation, can be used to guide thinking about the
probable outcomes of resilience investments and how
valuable these outcomes might be to stakeholders that
operate within the system.
This guide is intended for use by practitioners, analysts,
and researchers to understand how to conceptualize
particular systems and interventions in a structural
economic framework, and how to use this information
to plan data collection and modeling efforts for
estimating parts of the resilience dividend. The value of
the model is in thinking critically about how a particular
intervention will change consumptive or productive
activities within the system (quite possibly through
enabling different behaviors), and how these outputs
and outcomes can be monetized—in theory and
in practice.
While the RDVM is based on the theory of inclusive
wealth, which represents the value of a system through
the social value of a system’s capital assets, we do not
use the model to explicitly estimate system wealth.
Rather, the conceptual structure of inclusive wealth, in
which goods and services contribute to human well-
being and are produced through a combination of
capital stocks and technology in a dynamic context, is
used to help understand and illustrate the causal
relationships between system elements. Additionally,
the approach can also generate hypotheses that might
be tested for any given project. As such, the RDVM
provides the “roadmap” for what might happen with a
resilience project/intervention, and guidance for data
collection and monetization of the net benefits (or costs)
of project results versus an assumed counterfactual.
Because the resilience concept is complex and systems
are context-specific and dynamic, the RVDM is not a black box nor a “plug-and-play” tool. Rather, it is a
flexible approach that helps users think about
interventions in a structured, systems-focused way, and
it guides users in how to use data to provide evidence of
the dividend. In some cases, it may only be feasible to
estimate a partial resilience dividend, while in other
cases—particularly those with more data available—a
full estimate may be more feasible.
The advantages of this model over others include:
• an explicit link to project-related resilience benefits;
• a way to identify and measure changed
behaviors; and
• The guidance it provides in terms of modeling,
data collection, and estimation.
Our hope is that the model is useful for practitioners to
provide evidence of a resilience dividend after a project’s
completion, and for decisionmakers evaluating potential
projects.
Section 1 Background and Rationale2

Organization of This GuideSection 2 provides a brief overview of the theory of
inclusive wealth, which shows how system elements are
conceptualized, discusses the evolution of the system
over time, and discusses how the conceptualization
allows for a formal representation of the resilience
dividend. We also discuss the major empirical challenges
and the relationship with dynamic project evaluation. It
is designed to provide a quick overview of the major
elements of the RDVM.
Section 3 provides additional details and walks through
major case archetypes. It is intended to help practitioners
conceptualize and map their own systems of interest,
including the capital stocks, flows of goods and services,
allocation mechanisms, and measures of social welfare.
Section 4 provides a step-by-step walkthrough of how
to apply the RDVM. It is not a toolkit, per se, but rather
guidance for using structured, causal thinking to
generate hypotheses about the elements of the potential
resilience dividend that can be tested with data or
simulated with other types of models. While complex,
we maintain that systemically thinking about the
relationships between system elements and how project
interventions might change underlying behavior
provides practical guidance for data collection efforts
and estimating elements of the dividend.
Section 5 discusses skills that might be useful when
applying the RVDM, some real-world issues in dealing
with the limitations of data in the context of the
conceptual model, and some alternatives for generating
evidence for or against the existence of a resilience
dividend in particularly challenging data environments.
3Section 1 Background and Rationale


SECTION 2
Motivating the Resilience Dividend Valuation Model: Inclusive Wealth TheoryThe RDVM is based on the theory of inclusive wealth.1
Inclusive wealth theory values the capital stocks within a
system, taking into account the manner in which goods
and services are produced from the capital stocks and
how society values those goods and services. Importantly,
the linkages between capital stocks and how
stakeholders respond to changes in them are explicitly
incorporated in a dynamic framework. The framework
does this in a flexible yet consistent manner.2 Here, we
briefly introduce the framework, with further elaboration
of framework elements in Section 3. While implementing
the model can be complex and data-intensive, we
believe the principles that underpin the framework are
useful and actionable for practitioners working with
resilience investments.
1 Dasgupta, P. and K.-G. Mäler (2000). “Net national product, wealth, and social well-being.” Environment and Development Economics 5(01): 69-93.
Dasgupta, P. (2001). “Valuing objects and evaluating policies in imperfect economies.” The Economic Journal 111(471): 1-29.
Arrow, K. J., et al. (2003). “Evaluating projects and assessing sustainable development in imperfect economies.” Environmental and Resource Economics 26(4): 647-685.
Barbier, E. B. (2013). “Wealth accounting, ecological capital and ecosystem services.” Environment and Development Economics 18(02): 133-161.
Components of Inclusive WealthFigure 2.1 provides an example of a system with three
capital stocks and two goods and services that
stakeholders value. The arrows from the blue capital
stock boxes to the red goods and services circles
represent the production relationships in the system as
well as the choice of how much of each good to
produce. The figure also lays out assumptions about the
components in the system that are related. We assume
that good/service #1 is produced using capital stocks #1
and #2, while good/service #2 is produced using all
three capital stocks. The green well-being box is
connected to both goods/services, meaning we assume
that society values each of these in some way.
Fenichel, E. P. and J. K. Abbott (2014). “Natural capital: from metaphor to measurement.” Journal of the Association of Environmental and Resource Economists 1(1/2): 1-27.
Irwin, E. G., et al. (2016). “Welfare, Wealth, and Sustainability.” Annual Review of Resource Economics 8: 77-98.
2 Irwin, E. G., et al. (2016).
5Section 2 Motivating the Resilience Dividend Valuation Model: Inclusive Wealth Theory

Dynamics of the SystemThe inclusive wealth theory is inherently dynamic, which
means it assumes that capital stocks evolve over time
through natural or human-induced processes. For
example, consider an agricultural system. Land (a natural
capital stock) used in the production of agricultural
crops (a valuable good for farmers) can lose fertility over
time. This evolution involves both natural (e.g., nutrient
cycling) and human (e.g., cropping) processes that in
turn affect the ability of a given plot to produce the
valuable crop. Without taking additional actions (such
as adding fertilizer or changing crop rotations), these
dynamics will lead to decreased yields (a change in the
provision of goods and services) and decreased income
(a change in well-being). The human and natural
processes combine to produce changes in either the
quantity or quality of capital stocks.
As the capital stocks and associated flows of goods and
services evolve over time, the path of well-being evolves
as well (see Figure 2.2). Well-being at each point in time
is measured through a social welfare (or utility) function
that serves to value each of the relevant goods and
services represented by the model, and aggregated
across goods and services. This could include the
profitability of firms or consumer surplus.3 Well-being
could be aggregated across all relevant stakeholders or
calculated separately for different groups of stakeholders.
3 Consumer surplus is the difference between what individuals are willing to pay and the price they have to pay for each unit of goods or services consumed. It is a theoretical proxy for welfare.
Section 2 Motivating the Resilience Dividend Valuation Model: Inclusive Wealth Theory6
Figure 2.1.
Production and Consumption Relationships in an Economic System
Capital Stock 1
Capital Stock 2
Capital Stock 3
Good/Service
1
Good/Service
2
Well-Being
Production ofGoods and
Services
Consumption ofGoods and
Services
Source: Authors’ representation.

Figure 2.2.
The Path of Social Welfare over Time
Time
Social Welfare
Source: Authors’ representation.
Figure 2.3.
Dynamic Welfare Paths for Project and BAU Cases
Project
Time
Social Welfare Project Path
BAU Path
Source: Authors’ representation.
Inclusive Wealth and the Resilience DividendEstimating the resilience dividend requires information
about how well-being changes in two states of the
world: one with the resilience project and one with the
BAU case. Figure 2.3 provides an example for how the
welfare paths for a project and the BAU scenario may
diverge once a project is implemented. The area between
these two curves provides a measure of the resilience
dividend.4
4 Here, we have considered a deterministic path to illustrate the idea of a resilience dividend. In the next section, we expand these ideas to consider stochastic shocks, as the focus of resilience is on the ability to absorb as well as recover from shocks.
7Section 2 Motivating the Resilience Dividend Valuation Model: Inclusive Wealth Theory

How the Resilience Dividend Valuation Model Compares to Project EvaluationFormal project evaluation is the system of collecting and
analyzing information about the inputs and outputs
(short-term), outcomes (intermediate-term), and impacts
(long-term) of projects to inform decisions about future
actions.5 Impact evaluations use formal statistical
analysis and focus on causal linkages between the
project and outputs, outcomes, and impacts. Project
evaluations are ex post in nature in that they look back
on a project that is completed.
Using RDVM to evaluate projects ex post has much in
common with project evaluation, albeit in a more
formal, systems dynamic framework. Most formal
evaluations use some sort of a logic model to link
activities of the project (the inputs) with outputs and
outcomes (see Figure 2.1). RDVM does this in a formal
way by specifying the capital stocks, production
relationships and allocation mechanism, and goods and
services of the system, and focusing on the causal
relationships between project activities and changes in
these system elements. It compares changes in the flow
of goods and services between (potentially) observable
outcomes from the project and an appropriately
constructed counterfactual. In both cases, the
assumptions within each type of model form the
linkages of framework components.
There are, however, some unique aspects to the RDVM
compared to project evaluation. First, RDVM is
specifically based in economic theory, in that we
conceptualize the goods and services to be arguments
in the social welfare function(s) of stakeholders. That is,
we view stakeholders as economic agents that derive
well-being from the production or consumption of the
goods and services produced by the capital stocks. This
provides the foundation for valuing the resilience
dividend in a manner similar to traditional benefit-cost
analysis, and for aggregating it across disparate goods
and services. Importantly, the focus is not necessarily on
goods and services traded in markets but on the
non-market goods and services that are provided by
the system.
Second, resilience practitioners are typically concerned
with certain aspects of the concept of resilience,
including but not limited to absorptive and adaptive
capacities and the co-benefits that are generated from
resilience projects. While it is not always possible to
separate the resilience dividend into these concepts, the
RDVM’s dynamic structure does provide some guidance
to estimating and categorizing these benefits.
Third, the RDVM allows estimating the value of the
components of a project. When projects have multiple
mechanisms that affect the system, each part’s value
may be important in and of itself regardless of the value
of the larger project (or portfolio of projects).
Importantly, the framework also allows the analysis of
interdependencies that might affect the value of related
project components. The value of the two projects
together may be less than the sum of the value of the
individual projects; in this case the projects may be
viewed as substitutes. Conversely, when the total value
is greater than the sum individual values, these projects
may be viewed as complements.
5 USAID. Local Systems: A Framework for Supporting Sustained Development. Washington, D.C., April, 2014.
Section 2 Motivating the Resilience Dividend Valuation Model: Inclusive Wealth Theory8

SECTION 3
Elements of the Resilience Dividend Valuation Model and Case ArchetypesThis section describes in more detail the elements of the
RDVM. It provides a few examples and guides
practitioners in how to map out a given system using
the conceptual framework for estimating the
resilience dividend.
Capital StocksCapital stocks are a system’s “capital assets … broadly
defined to include natural, human, and social forms of
capital in addition to reproducible capital,” such as
machines.1 They are durable quantities that, when
combined with particular technologies, contribute to
flows of goods and services over time. Because capital
stocks are assumed to be durable, they have the
potential to evolve over time through both natural and
man-made processes. Capital can have positive values
(assets like human and man-made capital) or negative
ones (stocks such as pollution).
1 Irwin, E. G., et al. (2016). 8: 81.
Practitioners who want to apply the RDVM will need to
identify the capital stocks that characterize the system
of interest, and understand how they a) might evolve;
and b) contribute to the production of goods and
services. Given capital stocks’ role as inputs into
production, collecting data about them both before and
after the project can be valuable as indicators of a
resilience dividend, especially when a particular good or
service is difficult to measure or information on values
are missing. In other words, if it can be shown that a
productive capital stock has increased in quality or
quantity as a result of a resilience project (coupled with
an assumption about productive relationships), then
there is evidence of a resilience dividend.
Goods and ServicesGoods and services are flows produced by combining
capital stocks through a production relationship and
valued by stakeholders. In the resilience context, this can
include such diverse items as market and non-market
goods and services, or protection and mitigation services
provided through private or public infrastructure
or actions.
9Section 3 Elements of the Resilience Dividend Valuation Model and Case Archetypes

Goods and services provide the “physical” measure of
the items that are valued in the system. In economic
terms, value refers to the willingness and ability of a
stakeholder to pay for an extra unit of the good or
service, or the willingness to accept a payment as
compensation for enduring something “bad.” If
stakeholders’ satisfaction increases with the production
or consumption of a good or service, then this good or
service is valuable.2 An individual would be willing to
trade something else of lesser value (such as income) in
order to obtain it and still be made better off.
Practitioners interested in applying the RDVM will need
to identify the goods and services that are expected to
change, either directly or indirectly, as a result of a
resilience project relative to the BAU baseline. Valuing
these changes is the basis for calculating the quantitative
resilience dividend. In some cases, the value of the
change can be directly observed or easily estimated (e.g.,
change in agricultural output as a result of a development
project). In other cases (e.g., changes in benefits from
ecosystem services such as flood protection or recreation),
the physical and monetary values may come from
different sources. Practitioners should identify the most
comprehensive set of potentially changed goods and
services as possible—both measurable and non-
measurable items—but ensure that each good and
service fits into the conceptualization of the system.
Changes in goods and services that cannot be valued
quantitatively can be discussed qualitatively.
Some of these goods and services may only become
apparent in certain contexts. For example, the value of a
levee may only be realized once it has prevented damage
from a storm. Thus, practitioners need to be cognizant
of external forces’ impact on the system and how these
forces interact with capital stocks to produce other
goods and services.
2 In economic terms, satisfaction is typically referred to as “utility.”
Production Functions and the Allocation Mechanisms
Production Functions
Each good or service represented in the system is
produced by combining the capital stocks with other
goods and services. A production function describes
these relationships. For example, the production of
crops involves the capital stocks of land (a natural capital
stock), water (another natural capital stock), labor
(human capital stocks), man-made capital (tools), and
fertilizer (a market good). In a disaster risk reduction
framework, stocks of protective capital such as levees
“gray infrastructure” produce valuable storm protection
services, while “green infrastructure” involving natural
capital can produce not only protection services but also
co-benefits in the form of additional ecosystem services
like recreation.
The logic of the RDVM suggests that practitioners
should, at the very least, have a sense of which capital
stocks combine to produce which goods and services,
and anticipate if a resilience project has the potential to
change these relationships relative to BAU. For example,
a project that introduces new crop choices to agricultural
producers essentially changes the production
technologies used to generate valuable crops if these
practices are adopted. A project that introduces new
protective infrastructure for storms is a public good
(affecting all newly protected stakeholders) that changes
the flow of storm protective services.
Allocation Mechanisms
The allocation mechanisms in the model represent the
formal and informal institutional structures and
behaviors that “determine[s] the current and future
allocation” of the capital stocks and goods and services
flows.3 This includes both private and public goods and
services, and the prices or constraints that economic
agents face. Figure 3.1 provides an illustration.
3 Irwin, E. G., et al. (2016). 8: 84.
Section 3 Elements of the Resilience Dividend Valuation Model and Case Archetypes10
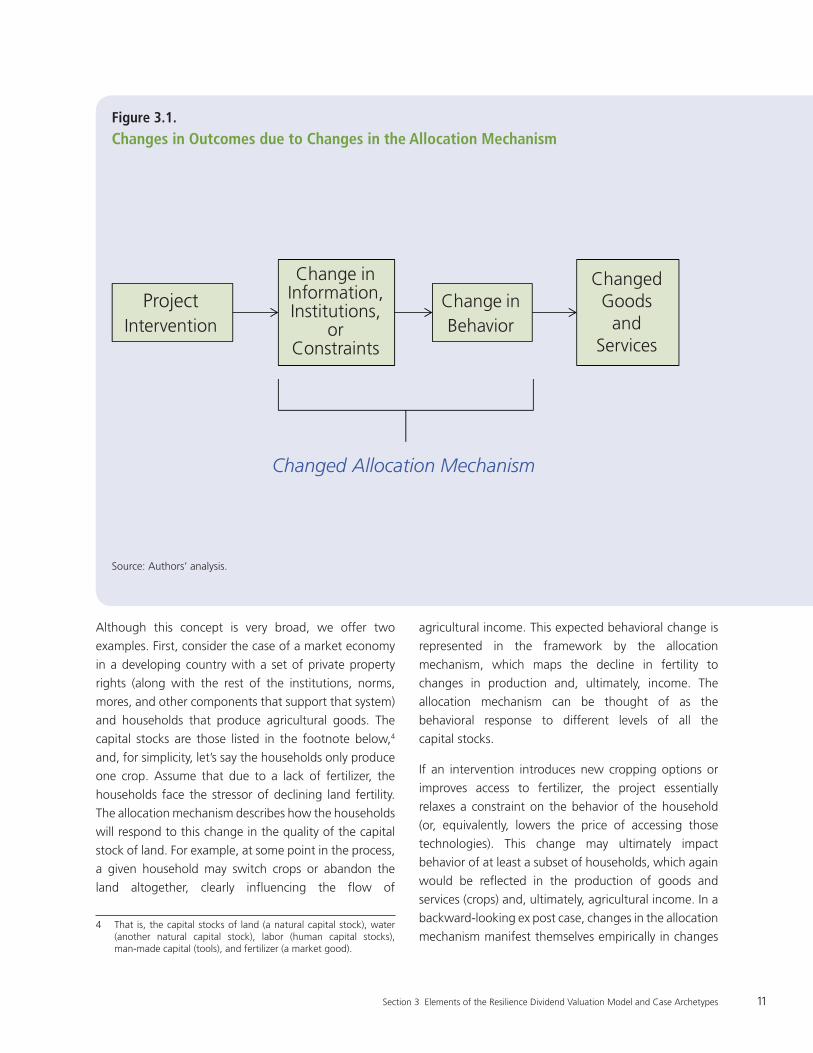
Although this concept is very broad, we offer two
examples. First, consider the case of a market economy
in a developing country with a set of private property
rights (along with the rest of the institutions, norms,
mores, and other components that support that system)
and households that produce agricultural goods. The
capital stocks are those listed in the footnote below,4
and, for simplicity, let’s say the households only produce
one crop. Assume that due to a lack of fertilizer, the
households face the stressor of declining land fertility.
The allocation mechanism describes how the households
will respond to this change in the quality of the capital
stock of land. For example, at some point in the process,
a given household may switch crops or abandon the
land altogether, clearly influencing the flow of
agricultural income. This expected behavioral change is
represented in the framework by the allocation
mechanism, which maps the decline in fertility to
changes in production and, ultimately, income. The
allocation mechanism can be thought of as the
behavioral response to different levels of all the
capital stocks.
If an intervention introduces new cropping options or
improves access to fertilizer, the project essentially
relaxes a constraint on the behavior of the household
(or, equivalently, lowers the price of accessing those
technologies). This change may ultimately impact
behavior of at least a subset of households, which again
would be reflected in the production of goods and
services (crops) and, ultimately, agricultural income. In a
backward-looking ex post case, changes in the allocation
mechanism manifest themselves empirically in changes 4 That is, the capital stocks of land (a natural capital stock), water
(another natural capital stock), labor (human capital stocks), man-made capital (tools), and fertilizer (a market good).
11Section 3 Elements of the Resilience Dividend Valuation Model and Case Archetypes
Figure 3.1.
Changes in Outcomes due to Changes in the Allocation Mechanism
Project Intervention
Change in Information, Institutions,
or Constraints
Change inBehavior
ChangedGoods
and Services
Changed Allocation Mechanism
Source: Authors’ analysis.

in behavior and/or the provision of goods and services in
the framework; in a forward-looking ex ante case, such
behaviors and provisioning would have to be assumed.
A second example is a change in government provision
of public goods, such as building a storm protection
system. In this case, the allocation mechanism describes
how the new capital impacts the provision of storm
protection services, likely through the change in
(expected) damage to life (human capital) and property
(other types of capital). Because this is an example of a
public good, individual agents cannot opt out as in the
first example, so everyone in the system is affected. But
providing storm protection services may change the
value of the protected land, which may change where
production of other goods occurs (for example, if
agricultural land that no longer floods is sold to a
housing developer). The behavioral component is linked
to the dynamic and spatial relationships of other
capital stocks.
However, this link to capital is not always the case. One
example might be a government developing disaster
resilience plans and training that enable particular public
and private behaviors (such as public agencies operating
disaster relief sites or private individuals participating in
search-and-rescue operations). The benefits of the
planning and training exercises (greater protection
services that reduce damage and loss of life) primarily
occur during and immediately after a disaster, but they
rely in part on the behavior of the agencies and
individuals involved. Such changes, relative to BAU,
would have to be estimated or simulated to quantify the
resilience dividend associated with these activities.
Social Welfare FunctionThe social welfare function reflects the full social value
of each good and service represented in the system. This
can theoretically be done by calculating the full producer
and consumer surpluses associated with a good or
service flow at each point in time (including all use and
non-use values of both market and non-market goods
and services), and adding them together.
In practice, full social values (either total or marginal) are
rarely available.5 Prices can serve as a proxy for marginal
values in some cases, and a large amount of literature
exists for valuing any number of non-market goods and
services.6 Whatever values are used to represent the
opportunity costs of the goods and services, practitioners
should be explicit about the values used and endeavor
to follow best practices in monetizing flows, as in
benefit-cost analysis.7
Shocks and StressorsBenefits from resilience projects are related to the ability
of people to better withstand and recover from
disruptions, to improve current situations, and/or to
positively change the trajectory of a place and/or
people’s lives. Thus, the treatment of disruption in
RDVM is important.
From a modeling standpoint, we distinguish the ex ante
and ex post cases as follows:
• Ex Ante: The project case and the base case are
evaluated using the probability distributions of the
assumed set of potential shocks and stressors. This
will require some assumption about the risk
preferences of societies (or perhaps subgroups) in
order to arrive at a single resilience dividend
number. If probability information on the shocks
and stressors is unavailable, a useful alternative
would be to estimate the resilience dividend under
a set of futures independent of probability
distributions (i.e., construct scenarios on the basis
of the uncertain variables and parameters of the
problem) and keep the results scenario-specific.
5 In particular, consumer and producer surplus measures require information about the marginal social benefit and cost curves over the entire span of the quantity change.
6 See Champ et al. (2003) for a broad overview of methods for non-market valuation.
7 Farrow, S. and R. O. Zerbe (2013). Principles and Standards for benefit-cost analysis, Edward Elgar Publishing.
Section 3 Elements of the Resilience Dividend Valuation Model and Case Archetypes12

• Ex Post: The project is evaluated conditional on a
particular shock or stressor path, rather than across
an entire set of potential shocks or stressors. The
(quasi-monetized) resilience dividend is the
difference in wealth between the project and non-
project paths starting from the time of the shock
(or an assumed point along the stressor path).
Note that it is possible to evaluate a project using
the inclusive wealth theory even if a shock has not
happened in the real world, since we can simulate
such an event within the estimation. Validation of
the outputs, however, would require empirical data.
Project InterventionsResilience project interventions can change any elements
of the system that ultimately affect the production or
provision of valuable goods and services in the model,
including:
• Quality or quantities of capital stocks;
• The evolution of the capital stocks;
• The production functions;
• The allocation mechanism(s); and
• The probability distributions of the stocks and
stressors (or the feasible scenarios).
Changes in any of these elements relative to the baseline
case will ultimately result in a change in welfare for at
least a subset of stakeholders. The change in welfare
can be positive or negative, and may be different for
various subsets of stakeholders. When aggregated over
all stakeholders, a positive change in the net present
value of the difference in welfare paths is evidence of a
positive resilience dividend.
Example Settings for Applying the Resilience Dividend Valuation ModelIn this section, we discuss some of the primary case
archetypes that practitioners might encounter. These
examples are not organized by system or project type,
but rather by the nature of the shock/stressor and the
existence or non-existence of “co-benefits” that accrue
as a result of a project even without a shock. These
examples are notional, and additional configurations
are possible.
We look at the following examples:
• Backward-looking ex post evaluations, in which
the objective is to estimate (a portion of) the
resilience dividend after a resilience project is
implemented;8
• Cases with and without a co-benefit from a single
observed shock;
• A case based on a stressor; and
• A forward-looking ex ante case.
Ex Post Evaluation of a Project with No Co-Benefits and a Single Shock
In this subsection, we document the “simple” case of an
ex post evaluation of a resilience project that is assumed
to have no co-benefits (in that the welfare of the system
after project implementation and before a shock is
identical for both the project case and the BAU case).
Figure 3.2 presents an illustration of the case.
8 We say “a portion of” as there are potential benefits that accrue after the shock due to the project, and we are only considering the benefits that have occurred up to the present time and not projecting into the future.
13Section 3 Elements of the Resilience Dividend Valuation Model and Case Archetypes

The vertical axis of the figure represents social welfare,
and the horizontal axis is time. Note that because this is
for an ex post evaluation, present day falls to the right of
both the project implementation (not shown) and the
observed shock. Prior to the shock, the welfare paths of
the resilience project scenario and the BAU scenario
are identical.
After the shock at time t, however, the (partially
observable) path with the project (represented in green)
and the (unobservable) path without the project (the
BAU case, represented in purple) diverge. Around the
time of the shock, this divergence can be conceptualized
as the value of the project in terms of increasing the
capacity to withstand disruption or, equivalently, to
absorb the shock. The vertical distance between the two
paths, measured in units of social welfare, thus provides
one component of the resilience dividend.
However, given potential differences in the quality or
quantity of capital stocks, their state transitions, and/or
changes in the allocation mechanism following the
project and shock, the two paths may continue to
diverge after the shock. As long as the only difference
between them at future points in time is the presence or
absence of the resilience project, this differential at each
point in time is also a component of the resilience
dividend. We note, however, that we are likely to only
have partial empirical evidence about the full dividend,
as we are unable to observe even the project path at
points in the future. This is particularly problematic in
empirically estimating a project’s transformative capacity,
as even if one was sufficiently distant from the shock
and had sufficient data to estimate the BAU path, the
ability to control for all other effects acting on the
system would likely be limited.
Section 3 Elements of the Resilience Dividend Valuation Model and Case Archetypes14
Figure 3.2.
Valuing a Project with No Co-Benefits and a Single Shock
SocialWelfare
timePresent Dayshock at time t
“withstanddisruption”/capacity to
absorb
what did/will happen with the project
what would have happened absent the project
“positivelychange
trajectory”/recover
andtransform
partially-observedpath with project
estimated BAU path
Shock
Source: Authors’ representation.

What we might term the estimable ex post resilience
divided is thus the net present value of the difference in
welfare paths between the project and BAU from time t
to the present day. Any projection of the dividend
beyond the present day would necessarily require ex
ante methods.
The key empirical components in estimating the
resilience dividend in this case are:
• Estimation of the BAU path; and
• The economic valuation of the flows of goods and
services that contribute to the divergence.
Ex Post Evaluation of a Project with Co-Benefits and a Single Shock
This case retains the ex post approach but illustrates a
case where benefits to society do not depend on a shock
occurring. In other words, the project generates
additional benefits (termed co-benefits) that accrue
even in the absence of a shock, relative to the BAU case.
Returning to our example of a green versus gray
infrastructure project for storm protection, green
infrastructure might result in additional recreational and
environmental benefits over the BAU case, even if storm
protection is identical. Figure 3.3 provides an illustration
of this general case, allowing for the possibility that the
resilience case provides greater levels of absorptive
capacity than the BAU case.
15Section 3 Elements of the Resilience Dividend Valuation Model and Case Archetypes
Figure 3.3.
Valuing a Project with Co-Benefits and a Single Shock
SocialWelfare
timePresent Dayshock at time t
project creates co-benefits prior to (and
perhaps after ashock
partially-observedpath with project
estimated BAU path
Project Shock
Source: Authors’ representation.

The primary difference from the previous archetype
illustrated in Figure 3.2 is the divergence in welfare
paths after project implementation and before the
shock. Like the previous case, however, the resilience
dividend is calculated as the net present value of the
difference in welfare over some time period; in this case,
the ex post calculation could be done from the time just
after project implementation to the present day.
Ex Post Evaluation of a Project with a Stressor
This ex post approach illustrates a case where the system
is under the influence of a stressor, rather than a shock.
Consider the example of an excessive depletion of
groundwater due to open access. In this case, the
stressor is the downward trajectory of a stock of natural
capital due to sub-optimal extraction patterns. Figure 3.4
provides an illustration of this general case.
Conceptually, the key difference between this and the
previous shock examples is that the stressor is ever-
present instead of a discrete event. As such, we tend to
think of the project and BAU paths as relatively
continuous over time, rather than exhibiting a discrete
jump at the time of the shock. In other words, absorptive
and adaptive capacities are implicitly given by the slopes
of the welfare paths, rather than in the differences in
welfare immediately following a shock.
Section 3 Elements of the Resilience Dividend Valuation Model and Case Archetypes16
Figure 3.4.
Valuing a Project with a Stressor
SocialWelfare
timePresent Day
stressor is decreasing welfare
partially-observedpath with project
estimated BAU path
Project
Source: Authors’ representation.

Ex Ante Evaluation of Projects
This case conceptualizes the resilience dividend using an
ex ante, rather than an ex post, approach. There is no
information about the performance of the project
because either the implementation is not complete or
ex post data does not exist. Figure 3.5 provides an
illustration.
In this case, the lack of data suggests a different
empirical approach to calculating the resilience dividend.
Unlike ex post cases in which statistical models can be
used to infer relationships between system elements,
this option is not available ex ante. Rather, the
relationships between system elements come from
previously observed or estimated relationships from
other systems or assumed. Of course, if the latter is
used, sensitivity analysis should be used to test the
robustness of the calculated dividend to the assumptions.
Furthermore, in ex ante cases, the model is no longer
necessarily deterministic, but involves stochastic
elements related to potential shocks.9 This allows
modeling of multiple shocks or stressors using the
probability distributions associated with them, and
calculating the resilience dividend as a random variable.
Figure 3.5 provides an example using expectations over
the random elements, in which the expected (partial)
resilience dividend could be estimated.
9 Note that in the ex post cases, we conditioned on an observable shock, set of shocks, or stressor(s). This is not possible for ex ante cases. However, one could, in theory, use degenerate probability distributions for individual shocks (i.e., the probability of the event occurring in the future is one) to model particular scenarios.
17Section 3 Elements of the Resilience Dividend Valuation Model and Case Archetypes
Figure 3.5.
Valuing a Project Ex Ante Using Expectations
SocialWelfare
timePresent Day
estimated expectedpath with projectgiven shockdistribution
estimated expectedBAU path givenshock distribution
Project
could be one or manyshocks with or withoutuncertainty
Shocks
Source: Authors’ representation.


SECTION 4
Using the Resilience Dividend Valuation Model and Data to Assess the Resilience DividendThis section describes the steps for using the
RDVM framework to estimate the resilience dividend.
Practitioners should be aware that this is not a “toolkit”
in which pre-defined tools can be extracted and applied
to a given intervention. Rather, the steps described
below detail the approach to calculating at least part of
the resilience dividend for purposes of decision support
while remaining flexible.
General Steps in Applying the Resilience Dividend Valuation Model FrameworkThere are six major steps to estimating the resilience
dividend using the RDVM:
1. Define the intervention and BAU scenarios
2. Map the system
3. Define the shocks and/or stressors
4. Map out the changes to the system in the
intervention and BAU scenarios
5. Estimate the intervention and BAU paths
6. Aggregate the estimates of well-being.
How these six steps are implemented will depend on the
type of system, type of intervention, and type of
evaluation (post-project or pre-project). The six steps
apply to both pre- and post-project analysis, but the way
they get carried out and the relevant analytical methods
will differ. The biggest difference in terms of steps is
Step 5; estimating the project and BAU paths will be
very different depending on whether the project has
been implemented.
The approach is meant to be a guide for how to estimate
the resilience dividend, not a calculator. This makes the
model more flexible but not as straightforward to use as
some other tools. Our goal is to balance the need for a
broad, flexible approach with clear guidance on how to
implement the model.
19Section 4 Using the Resilience Dividend Valuation Model and Data to Assess the Resilience Dividend

Ex Post Cases: Valuing the Dividend after a Project is Complete
General Principles
As with all project evaluations, estimating the resilience
dividend for a project will be most successful when done
as part of the project planning process. In particular,
baseline data is vitally important to understanding the
state of the system prior to the intervention, and collecting
baseline data after the fact is challenging, costly, and
unlikely to lead to high-quality measurement. We have
emphasized the importance of causality in estimating the
resilience dividend, and incorporating the dividend in the
planning process may make it easier to carry out the
project in a way that supports causal analysis.
Practitioners should strive to quantify the resilience
dividend to the greatest extent possible, which means
collecting quantitative data wherever feasible. Not all
impacts or relationships within the system may be able
to be quantified, and qualitative analysis may be used to
supplement the quantitative aspects.
Recall that resilience is a dynamic concept. There may be
immediate benefits once a project is implemented, while
other benefits may only be realized after a shock occurs.
This means that data collection efforts may need to be
dynamic as well. Additionally, changes in transformative
and adaptive capacity may not be revealed until sufficient
time has passed. For example, an intervention to increase
storm protection capital may have immediate benefits
through the absorptive capacity but may fundamentally
transform land use, which may take time to occur and
observe. Understanding when and how the potential
benefits arise is fundamental to forming a data
collection plan.
Additionally, the data collection plan should be
developed in conjunction with the system mapping. This
allows the practitioner to understand how goods and
services are likely to be affected by the project. The goal
is to understand how the pieces of the system fit
together and impact each other. With this mapping, it is
more likely that the right data will get collected.
Using the Resilience Dividend Valuation Model for Ex Post Cases
While we present this guide as a linear process, the
reality is that developing the conceptualization of the
system is likely iterative, with one consideration later in
the list potentially affecting one or more of the elements
that appear prior to it. Our hope is to provide guidance
for what needs to be considered, but there is no
formulary for estimating the resilience dividend in all
contexts. The RDVM provides a way to conceptualize
the system and consider what data collection and
modeling are needed in order to estimate the impact of
a project on a complex, adaptive, dynamical system. As
we move to more complicated projects and portfolios of
projects, systematically thinking about how the system
and its interdependencies change is vitally important to
estimating the resilience dividend.
1. Define the resilience project and the BAU case
– Define the project activities associated
with the project.
Using project documents and other
materials, define the activities associated
with the resilience project, paying
particular attention to whether project
activities are expected to directly affect the
quality and quantity of capital stocks, any
production technologies, or the allocation
mechanism through changes in
institutions, norms, or social relationships.
–- Define the counterfactual BAU case.
For counterfactuals that use a non-
resilience project as the BAU case, define
the associated activities, as you did with
the project activities.
2. Map the system
– Identify the relevant capital stocks for the
system being modeled.
Define the man-made, natural, human,
and social capital stocks that are used by
stakeholders within the system. Ideally, all
capital stocks that are expected to evolve
or change should be included in the model.
Section 4 Using the Resilience Dividend Valuation Model and Data to Assess the Resilience Dividend 20

– Identify the relevant goods and services for
the system being modeled.
All goods and services that are assumed to
impact the welfare of stakeholders,
whether they are marketed or not, should
ideally be included. These are called “final”
goods and services. Additional
“intermediate” goods and services that
are used to create these final goods should
be included if they will likely change with
the project.
– Identify the stakeholders whose welfare
will be affected by the project intervention.
All stakeholder groups that are affected by
the resilience project should be identified
when mapping the system. Individual
practitioners will have to decide how to
aggregate stakeholders into different
groups. In some cases, a single group may
be appropriate; in others, especially where
distributional issues are important,
more than one stakeholder group may
be appropriate.
– Document the marginal or average values
associated with the goods and services.
Each good and service in the system will
need to be valued in some way in order to
monetize the resilience dividend. For
marketed goods and services, market
prices will often provide a good
approximation of the value of the
incremental unit. For non-market goods
and services, alternative methods (e.g.,
stated preference analysis or benefit
transfer) may be required.
– Map the posited relationships between
capital stocks, goods and services, and
well-being of stakeholders.
This is perhaps the most critical step in the
mapping process, as it provides the
practitioner’s logic model about the key
relationships within the system (see Figures
2.2 and 2.3). Each good and service
represented in the system should map to
either the social welfare of a stakeholder
(or stakeholder group), or be used as an
intermediate input into other production
relationships. Similarly, the production of
the goods and services depends on
intermediate inputs and capital stocks,
and these relationships should be clear.
3. Define the shocks and/or stressors
Conceptualize how the observed shock(s) (if
applicable) and stressor(s) (if applicable) are
expected to change the quantities or qualities
of capital stocks and the production
relationships and/or the allocation
mechanism(s).
In this step, the stocks and stressors threatening
the system are defined in terms of the
disruptions that might occur under should
these events occur at particular magnitudes. In
other words, this step provides the theoretical
logical relationships between the shocks/
stressors and elements of the system.
4. Conceptualize how the BAU case and intervention change the relationships in the system
For evaluations that use a BAU project that is
different than the current state of the system,
this step maps out the relevant relationships for
that project. In ex post cases, it seems likely
that only in rare circumstances would a
practitioner have empirical evidence for both a
resilience project and BAU case. In such
circumstances, it seems likely that either ex
ante approaches or mixed methods may be
most useful.
Resilience project interventions can change any
elements of the system that ultimately affect
the production or provision of valuable goods
and services in the model, including:
• Quality or quantities of capital stocks;
• The evolution of the capital stocks;
• The production functions;
21Section 4 Using the Resilience Dividend Valuation Model and Data to Assess the Resilience Dividend

• The allocation mechanism(s); and
• The probability distributions of the stocks
and stressors (or the feasible scenarios).
That said, using the inclusive wealth theory to
represent dynamic systems suggests that
practitioners may want to consider the types of
changes listed below when developing a model
to estimate the resilience dividend. These
categories should not be considered distinct
and non-overlapping, nor are they necessarily
comprehensive, but project activities should be
mapped to these types of changes. For
additional examples organized in a slightly
different manner, interested readers are
referred to benefits and indicators contained in
Tanner, et al., da Silva and Morera and Cutter.1
Changes in the direct provision of public or
quasi-public goods. In economics, public goods
are described as being non-rival in consumption
(meaning that consuming the good does not
affect its availability for others) and
non-excludable (meaning that they are
accessible to everyone due to a lack of property
rights). Quasi-public goods (e.g., toll roads)
have elements of non-excludability or
non-rivalry, but they are not pure public goods.
Public and quasi-public goods can be provided
by both private individuals/firms, and
organizations, or governments.
Because of their properties, the proper valuation
of a change in the provision of a public good is
to sum the benefits that accrue to every
stakeholder affected. Many public goods are
not traded in a market-making valuation
complex. However, as mentioned earlier,
economists have developed several methods to
value non-market goods and services based on
both stated and revealed preferences.
1 Arup International Development (2014). City Resilience Index: Understanding and measuring city resilience, The Rockefeller Foundation, Arup International Development.
Tanner, T. M., et al. (2015). The Triple Dividend of Resilience: Realising development goals through the multiple benefits of disaster risk management. London, Global Facility for Disaster Reduction and Recovery (GFDRR) at the World Bank and Overseas Development Institute (ODI).
Cutter, Susan S. (2016). The Landscape of Disaster Resilience Indicators in the USA, Natural Hazards 80:741-758.
Major categories of public good provisions that
might be affected by resilience projects include,
but are not limited to:
• Storm and environmental protection
services;
• Other environmental goods and
ecosystem services;
• “Social” goods and services directly
provided by governments or other formal
institutions (e.g., welfare systems and
other transfer payments); and
• Publicly available information (e.g., early
warning systems, information about
alternative crop choices, etc.)
We note that some of these categories can
directly change welfare via changing the
production or allocation of public goods or
resources, while others (such as the provision
of information) enable a change in behavior
that can subsequently be used to alter the
production or consumption of private goods.
Changes in the quantity or quality of man-
made, natural, or human capital stocks.
Changes that augment quantities or qualities
of capital stocks, or alter their evolution over
time, will affect the provision of the goods and
services that these stocks support.2 Both public
and private decisions can change these system
elements. There may be considerable overlap
with the direct provision of public goods listed
above. For example, a city government
constructing infrastructure for storm protection
adds an asset to the stock of man-made capital,
which in turn improves the flow of storm
protection services; additionally, households
could modify their house to avoid damage.
Indirect changes to capital stocks can alter their
evolution. For example, in the case of a natural
resource, a change that results in greater
consumption of the resource will decrease the
quantities available relative to the BAU case.
Similarly, an intervention may slow or reverse
2 This includes both public and private goods and services.
Section 4 Using the Resilience Dividend Valuation Model and Data to Assess the Resilience Dividend 22

depreciation of a stock (such as increased
maintenance of an aging power plant) or
augment its quality (such as an investment in
education improving the productivity of human
capital).
Changes in formal or informal institutions. The
institutional structure of a particular system,
either formal or informal, is conceptualized as
the set of “rules” under which economic actors
can behave. This includes any and all constraints
on behavior, the incentives that people and
firms face, and other aspects that shape
behavioral outcomes. Changes in institutions
indirectly change the flow of goods and services
through changes in behavior, reinforcing the
importance of modeling behavior with RDVM
via the allocation mechanism.
The following categories seem particularly
important in the resilience context:
Changes in incentives. This includes changes in
relative prices in a market economy, as well as
changes in any other reward or punishment
system that ultimately affects behavior. This
can include regulatory structures, taxes and
subsidies, and other government policies.
Changes in access to capital stocks or goods
and services. Although this can be viewed as a
change in incentives, any changes in access can
have behavioral implications. For example, if
social norms or other transaction costs
precluded a particular group of people from
engaging in a production activity or accessing a
resource, overcoming those costs might change
the behavior of some individuals within this
group, allowing for augmented production/
consumption of certain goods and services.
Changes to privately available information.
Some resilience projects may provide
information that is not necessarily public, but
because it is new or packaged in a new way
making it more accessible to a wider audience,
it may affect the behavior of particular
individuals included in the project intervention
going forward.
Changes in access to technology. Access to
methods, techniques, skills, and processes used
to create goods and services can change the
manner in which capital stocks are combined
to create flows of goods and services. This
change may arise from a change in the incentive
structure of the system, as discussed above, or
the introduction of new technologies may be a
direct intervention as an activity of the resilience
of the project.
Changes in social capital. Social capital has
been defined at various levels, in particular as
the “trust, norms and networks that can
improve the efficiency of society by facilitating
coordinated actions” and also as “the
institutions, relationships and norms that shape
(up) the quality and quantity of a society’s social
interaction”.3 It exists as a form of capital that
is productive since it helps achieve certain
outcomes once it is put to use.
Given this definition, we see that there is
considerable overlap between changes in
this category and “changes in formal or
informal institutions” discussed above.
Practically speaking, however, by changing
transaction costs and network structures,
changes in social capital can facilitate
alternative behaviors, thus changing the flow
of goods and services along a project path.
5. Relate and estimate the project and BAU paths
Ultimately, the value of any project activity is
derived from the changed value of the affected
goods and services. As such, an explicit link
between changes in system elements and
changes in goods and services produced or
consumed should be defined. In cases of direct
provision of goods and services, this is trivial. In
other cases (such as changes in social capital,
institutional structure, or system norms), a
specific logic sub-model representing the
allocation mechanism may have to be derived.
3 Agampodi, T. C., et al. (2015). “Measurement of social capital in relation to health in low and middle income countries (LMIC): A systematic review.” Social Science & Medicine 128: 95-104.
23Section 4 Using the Resilience Dividend Valuation Model and Data to Assess the Resilience Dividend

Using the available data, estimate the flow of
goods and services at each possible point in
time after project implementation, and before
an observable shock. The following provides
some guidance about the types of resilience
benefits that may be estimated.
– Estimate project and BAU paths prior to
shock occurring to obtain short-run co-
benefit estimates.
Co-benefits are generally defined as the
value of the changes of the flows of goods
and services that result from a project but
are not directly related to a shock or
stressor (see below). Any goods or services
affected by a resilience project could
theoretically be included in co-benefits.
Given the diversity of resilience projects
and systems, a precise taxonomy of
potential co-benefits has the potential to
be both limiting and misleading. We
instead suggest that practitioners use their
own judgment and the types of changes
described above to consider their project’s
potential co-benefits.
Practitioners should use causal inference
methods to document the relationship
between the flows of goods and services
with and without the project.
– Estimate project and BAU path during
each observed shock to obtain absorptive
capacity benefits.
Absorptive capacity benefits are generally
defined as the benefits that accrue to a
system during or immediately after a shock.
In general, these benefits would take the
form of fewer losses of valued goods and
services. Practitioners should use causal
inference methods to document the causal
relationship between the project and
changes in damages as a result of the
project during or immediately after a shock.
– Estimate recovery paths between each
observed shock to obtain recovery/
transformative benefits.
For projects that have enhanced recovery
as an objective or sub-objective, the speed
of system recovery is an important element
of the resilience dividend. Practitioners
should try to estimate the differences in
flows of goods and services at each point
in time for which data is available to get a
sense of the time path of system recovery
(or of the transformative benefits, in the
case of systems whose welfare levels
exceed what they were before the project).
Again, causal inference methods are
appropriate.
6. Aggregate welfare estimates
– Calculate welfare at each available point
in time.
Apply the marginal/average values to each
good and service to convert into monetary
terms for each estimation step above.
Using the values obtained in the previous
steps, the monetary value of changes in
flows of goods and services calculated in
the previous section can be obtained.
Ideally, these will be indicators of true
welfare of the stakeholders of the system
such as consumer surplus and producer
profits.
- Convert the monetary terms for each
segment of the time path into common
units using discounting.
If changes in goods and services are
calculated over time, and it is desirable to
convert these flows of benefits and costs
into a single, comparable figure, then the
net present value of net benefits should be
calculated.
- Sum in order to calculate the resilience
dividend.
All monetary benefits and costs can be
summed to obtain the resilience dividend.
Section 4 Using the Resilience Dividend Valuation Model and Data to Assess the Resilience Dividend 24

Ex Ante Cases: Valuing the Dividend and Choosing Between Projects
General Principles
The general approach to estimating the resilience
dividend in ex ante cases is similar to the approach for
an ex post case. The biggest difference is that in the ex
post cases, changes in the system and outcomes may be
observed, but in the ex ante case, predicted outcomes
are dependent upon lessons from similar projects in
other locations or results based on simulation models.
Additionally, more than two paths may be of interest;
when stakeholders are trying to choose among multiple
projects with similar goals, each project path must
be estimated.
As with the ex post cases, conceptualizing the system
and how the intervention and BAU cases change the
system provides a framework to follow. It is easier to
return to the framework later and delete an aspect that
was found to be unimportant than to try to retrofit the
framework when alterative impacts or processes have
been identified. To operationalize the conceptualization
of the system, simulation models may be needed to
quantify changes to the system. Systems-level models
can quickly become unyielding when there are too many
components. As such, the essential components need to
be included, but some abstraction may be required so
that the important aspects of the system are considered.
Using the Resilience Dividend Valuation Model for Ex Ante Cases
The steps for using the RDVM in ex ante cases are
identical to those in the ex post cases, with the exception
of estimating the impact of the project and BAU cases
on the system. Specifically, rather than having observed
project impacts after a project is completed and
estimating the BAU baseline, as in ex post cases, we
must estimate both paths. This will involve two key
aspects, calibrating a model to the system being
considered and estimating the dynamic paths of the
intervention and BAU baseline. This calibrated model
may be as extravagant as a coupled hydrologic-ecologic-
economic model or taking the results from a similar
intervention in another area and transferring those
benefits to the intervention at issue. Many disaster risk
reduction projects may already be doing this, for at least
some part of the system. For example, estimating the
reductions in damages from flood risk projects is
standard operating procedure. What this model
advocates is an expansion to understand how the
dynamics of the system change as we expand the
number of sectors/services that are provided. Comparing
green and grey flood infrastructure is about considering
the set of services provided by different capital stocks
that these different interventions provide. Different
interventions may affect the system in very different
ways, and this approach allows for an analysis of very
different interventions.
Choosing between Projects
The choice of a project depends not only on the benefits
that it provides but also the costs that are imposed. The
approach outlined here, in an ideal situation, will allow
stakeholders to estimate the net present value of the net
benefits of the project. These impacts can be
disaggregated across stakeholder groups to better
understand who wins and loses and at what magnitude
in a wide range of potential interventions. Although the
net present value of the net benefits may be larger for
one project than another, the distribution of net benefits
may be just as important to stakeholder decisionmaking.
There are tradeoffs for each project, and even when
these can be converted to a common metric, the choice
between projects may be difficult. These tradeoffs may
include not only differential benefits across stakeholder
groups but also some benefits may only be specific
qualitatively, complicating the choice of project. But
explicitly knowing the dimensions of the tradeoff for
different projects increases the ability of the stakeholders
to make good investments from a resilience perspective.
25Section 4 Using the Resilience Dividend Valuation Model and Data to Assess the Resilience Dividend


SECTION 5
Key Considerations for DecisionmakersThe RDVM admittedly has significant real-world
limitations, but we contend that the use of a conceptual
model based on economic theory and based in a systems
dynamic framework can provide benefits to the resilience
practitioner community in terms of systemically thinking
about resilience projects, and how to provide evidence
of additional benefits that might come from resilience-
based projects relative to the status quo. It is
a complement to, rather than replacement of, other
ways of thinking about the resilience concept. And
while it provides a theoretically-consistent way of
thinking about the resilience dividend, there may be
considerable hurdles to overcome in order to use the
model across a wide variety of circumstances.
Section 4 describes an ideal use of the inclusive wealth
theory to estimate the resilience dividend, but it is
primarily conceptual in nature. Although practitioners
should strive to accomplish each step to the best of their
ability with the resources available, real-world
applications will likely need to be much simpler. For
example, in an ex post case, data may only be available
at two points: pre- and post-project implementation,
with or without a given shock. Even then, relative to the
conceptualization, data may not be available on all
relevant measures. In an ex ante case, even with an
appropriate simulation model that represents expected
behavioral change, a full probabilistic representation of
the expected shocks may be beyond the scope of a
study, or at least its budget.
Below, we document some of the key skills that would
need to be brought to bear in order to use the model to
estimate a resilience dividend, and discuss the likely data
limitations that might be found in the real world
(informed largely by the case studies that we performed
over the course of the research).1 We also talk about
information that could be used to provide evidence for
a resilience dividend, even if information to monetize
the dividend was unavailable.
Skills Needed to Apply the Resilience Dividend Valuation ModelThe RDVM is a complex approach based in economic
and systems theory and requires high-level skills. It
combines aspects of program evaluation with economic
valuation, including structural and empirical dynamic
modeling, causal inference, and benefit-cost analysis.
The approach itself is extremely data intensive, and
because resilience projects often rely on enabling certain
aspects of human behavior, relatively sophisticated
modeling techniques may be necessary. In particular, the
following skills would be helpful in calculating the
resilience dividend using this method:
1 Bond, C., et al. (2017). Resilience Dividend Valuation Model: Framework Development and Initial Case Studies, Santa Monica: RAND Corporation. RR-2129-RF.
27Section 5 Key Considerations for Decisionmakers

• Experience with formal program/project evaluation
• Experience with causal statistical inference
• Experience with simulation modeling
• Experience with benefit-cost analysis and other
economic techniques
• Experience working with imperfect data
Model Relationships as Hypotheses
The map that arises from thinking about relationships
between capital stocks, goods and services, behavior,
and well-being (Figure 2.1) is essentially a hypothesis
map, with each identified relationship representing a
hypothesized linkage. For backward-looking ex post
projects, data could theoretically be collected to test the
linkages and quantify the difference in measurable
system elements between the project and BAU scenarios.
For forward-looking ex ante projects, the linkages are
assumptions that would typically be represented by
simulation models. Ultimately, the dynamic project and
BAU paths (see, e.g., Figure 2.3) are aggregations of the
value of changes provided by changes in the
system elements.
Working with the Realities of Limited Data
The full theoretical resilience dividend requires
calculating the net present value of the differences in
net benefits (or costs) between the project intervention
and BAU cases, quite possibly in a probabilistic
framework that represents future shocks. However, the
data requirements to calculate the theoretical ideal are
likely too extreme for most projects.
Practitioners operating in an ex post environment will
likely need to prioritize both the types of data collected
and the points in time that the data is collected. The
following lists some of the major elements that should
be considered:
• Types of benefits that are most important/most
salient to the project
• Timing of the data (when and for how long
to collect)
• Treatment of distribution of future shocks
• Monetizing vs. not monetizing changes in the flow
of goods and services
• Quantitative vs. qualitative data
Any evidence of a differential between the BAU path
and project path due to the intervention is evidence of a
potential resilience dividend.2 Given restrictions on data
availability, the estimable dividend may be a subset of
the full dividend (e.g., only a subset of potentially
valuable outcomes is monetized or evidence only exists
at one or a small number of discrete points over time). In
these cases, practitioners have the option of including
additional assumptions in order to more completely
characterize the resilience dividend (for example,
assuming that the value of a set of co-benefits will
persist at each point into the future), or perhaps more
simply, reporting the empirical evidence that they have
and recognizing that the estimate is not complete.
Recommendations Related to Data Collection
First, we recommend that the evaluation mechanism for
a backward-looking project be developed in conjunction
with the systems approach. The RDVM can be used to
prioritize data collection efforts related to the capital
stocks, goods and services, and behaviors that are likely
to be affected by an intervention. Issues of quantification
and measurement should be addressed at the early
stages of the development of an empirical strategy, and
care should be taken to identify the public and private
goods and services, capital stocks, and behavioral
changes that are anticipated as a result of the project.
2 Note that a negative change in welfare is interpreted as a net cost, or a negative resilience dividend.
Section 5 Key Considerations for Decisionmakers28

Second, we recommend that practitioners prioritize the
most salient aspects of the system they are analyzing
and design any data collection mechanism accordingly
and in conjunction with the project budget. There is a
trade-off between the extent to which the resilience
dividend can be characterized and the resources used to
estimate it. As such, prioritization is in order. For
example, in some cases, it may be desirable to focus
attention broadly on various aspects of co-benefits as
opposed to the temporal dimension of recovery,
suggesting that cross-sectional data may be sufficient.
In other cases, the temporal path of welfare may be
paramount, in which case time series data may
be necessary.
Finally, we urge practitioners to use the conceptual
model as a hypothesis/assumption map that provides
empirical guidance as to what data should be collected
and what aspects of the dividend should be included in
calculations. The idea is to avoid tautologies and provide
a means of testing hypotheses about relationships
within the system. If users cannot document the links
between an intervention and valuable goods and service
flows for at least some subset of stakeholders, then
there is no falsifiable hypothesis to test. This should
be avoided.
29Section 5 Key Considerations for Decisionmakers


GlossaryTable G.1.
Mapping Language Used in the Resilience Community to the Inclusive Wealth Context
Resilience Community Language Inclusive Wealth Language
Adapt Changing the “economic program” of response to changes in particular capital stocks; may require a sub-framework to describe changes in response
Co-benefits The additional benefits (costs) associated with a resilience project other than those relating to withstanding or recovery from shocks and stressors
Direct Benefits The benefits provided by both a resilience project and related to withstanding or recovery from shocks and stressors
Entity System being frameworked (collection of capital stocks, flows, and values)
Final Services A service that is directly provided by one or more capital stocks and directly enters the social welfare function
Grow Positive changes in inclusive wealth or overall welfare
Indirect Benefits Synonym for co-benefits
Intermediate services Linkages between capital stocks and flows of goods and services that do not directly enter the social welfare function
Inter-system Linkages in capital stocks between quasi-separable subsystems
Intra-system Linkages in capital stocks between a given (sub)system
Prepare for disruptions Policy levers within the system that change: a) system dynamics; b) the “economic program”, or how we assume the human system responds to changes in the capital stocks; c) the probability distributions described in the system; or d) the values embodied in the framework
31Glossary

Resilience Community Language Inclusive Wealth Language
Resilience The capacity of a system—a household, a community, an organization, or a coupled natural-human system—to prepare for disruptions from outside of the system, to recover from shocks and stresses, and to adapt and grow from a disruptive experience
Resilience Capacities – Absorptive Reflected by either ex ante or ex post project performance evaluation, generally related to the ability to either reduce damage from a stock or slow/stop/reverse a stressor
Resilience Capacities – Adaptive Reflected by either ex ante or ex post project performance evaluation, generally related to the ability of the human system to respond to changes in capital stocks
Resilience Capacities – Transformative Reflected by either ex ante or ex post project performance evaluation, generally related to the overall dynamic path of the system
Resilience Dividend The difference in the stream of net benefits to well-being between resilience projects and a counterfactual setting
Resilience Lens A view of the world that approaches project development and investment strategies in a way that takes into account system properties and addresses both the risk of loss from a shock or stress outside the system and the resulting co-benefits the project produces
Resilience Project An intervention that at least in part targets improved ability to manage, respond to, or recover from a shock or stress outside of a system that, with some probability, results in a loss of well-being and that has the potential to produce other benefits not directly related to the shock
Shocks A discrete, probabilistic event exogenous to the system
Stresses A long term trend in one or more capital stocks frameworked within the system (endogenous depreciation)
Glossary32

ReferencesAgampodi, T. C., et al. (2015). “Measurement of social capital in relation to health in low and middle
income countries (LMIC): A systematic review.” Social Science & Medicine, 128: 95-104.
Anderies, J., et al. (2013). “Aligning key concepts for global change policy: robustness, resilience,
and sustainability.” Ecology and society, 18(2).
Arrow, K. J., et al. (2003). “Evaluating projects and assessing sustainable development in imperfect
economies.” Environmental and Resource Economics, 26(4): 647-685.
Arup International Development (2014). City Resilience Index: Understanding and measuring city
resilience, The Rockefeller Foundation.
Barbier, E. B. (2013). “Wealth accounting, ecological capital and ecosystem services.” Environment
and Development Economics, 18(02): 133-161.
Bond, C., et al. (2017). Resilience Dividend Valuation Model: Framework Development and Initial
Case Studies, Santa Monica: RAND Corporation. RR-2129-RF.
Carpenter, S. and W. Brock (2008). “Adaptive capacity and traps.” Ecology and society, 13(2).
Champ, P. A., K. J. Boyle and T. C. Brown (2017). A Primer on Nonmarket Valuation. Kluwer Academic
Publishers, Dordecht, The Netherlands
Dasgupta, P. (2001). “Valuing objects and evaluating policies in imperfect economies.” The Economic
Journal, 111(471): 1-29.
Dasgupta, P. and K.-G. Mäler (2000). “Net national product, wealth, and social well-being.”
Environment and Development Economics, 5(01): 69-93.
Dinda, S. (2008). “Social capital in the creation of human capital and economic growth: A productive
consumption approach.” The Journal of Socio-Economics, 37(5): 2020-2033.
Farrow, S. and R. O. Zerbe (2013). Principles and Standards for benefit-cost analysis, Edward
Elgar Publishing.
Fenichel, E. P. and J. K. Abbott (2014). “Natural capital: from metaphor to measurement.” Journal of
the Association of Environmental and Resource Economists, 1(1/2): 1-27.
Irwin, E. G., et al. (2016). “Welfare, Wealth, and Sustainability.” Annual Review of Resource
Economics, 8: 77-98.
33References

Pawson, R. (2003). “Nothing as practical as a good theory.” Evaluation, 9(4): 471-490.
Pearl, J. (2009). “Causal inference in statistics: An overview.” Statistics Surveys, 3: 96-146.
Rodin, J. (2014). The Resilience Dividend: Being Strong in a World Where Things Go Wrong,
Public Affairs, New York.
Rosenberger, R. and J. Loomis (2003). Benefit Transfer. In A Primer on Nonmarket Valuation.
Eds P. Champ, K. Boyle and T. Brown, Kluwer: 445-482.
Stuart, E. A. (2010). “Matching methods for causal inference: A review and a look forward.”
Statistical science: a review journal of the Institute of Mathematical Statistics, 25(1): 1.
Tanner, T. M., et al. (2015). The Triple Dividend of Resilience: Realising development goals through
the multiple benefits of disaster risk management. London, Global Facility for Disaster Reduction
and Recovery (GFDRR) at the World Bank and Overseas Development Institute (ODI).
United States Agency for International Development. (2014). Local Systems: A Framework for
Supporting Sustained Development. Washington, D.C., April, 2014.
References34

Supported by
www.rockefellerfoundation.org
www.rand.org
RR-2130-RF 9 7 8 0 8 3 3 0 9 8 9 7 9
ISBN-13 978-0-8330-9897-9ISBN-10 0-8330-9897-7
51650
$16.50