Embed Size (px)
Citation preview
Michael Klompas MD, MPH, FIDSA, FSHEAHospital Epidemiologist, Brigham and Women’s Hospital, Boston, MA
Professor, Harvard Medical School & Harvard Pilgrim Health Care Institute
Update in Hospital Medicine
October 4, 2021
Covid Transmission and Infection Control
Michael Klompas MD, MPH
Hospital Epidemiologist, Brigham and Women’s Hospital
Professor of Population Medicine, Harvard Medical School
Disclosures
o Grant funding
o Centers for Disease Control and Prevention
o Massachusetts Department of Public Health
o Agency for Healthcare Research and Quality
o Royalties
o UpToDate Inc.
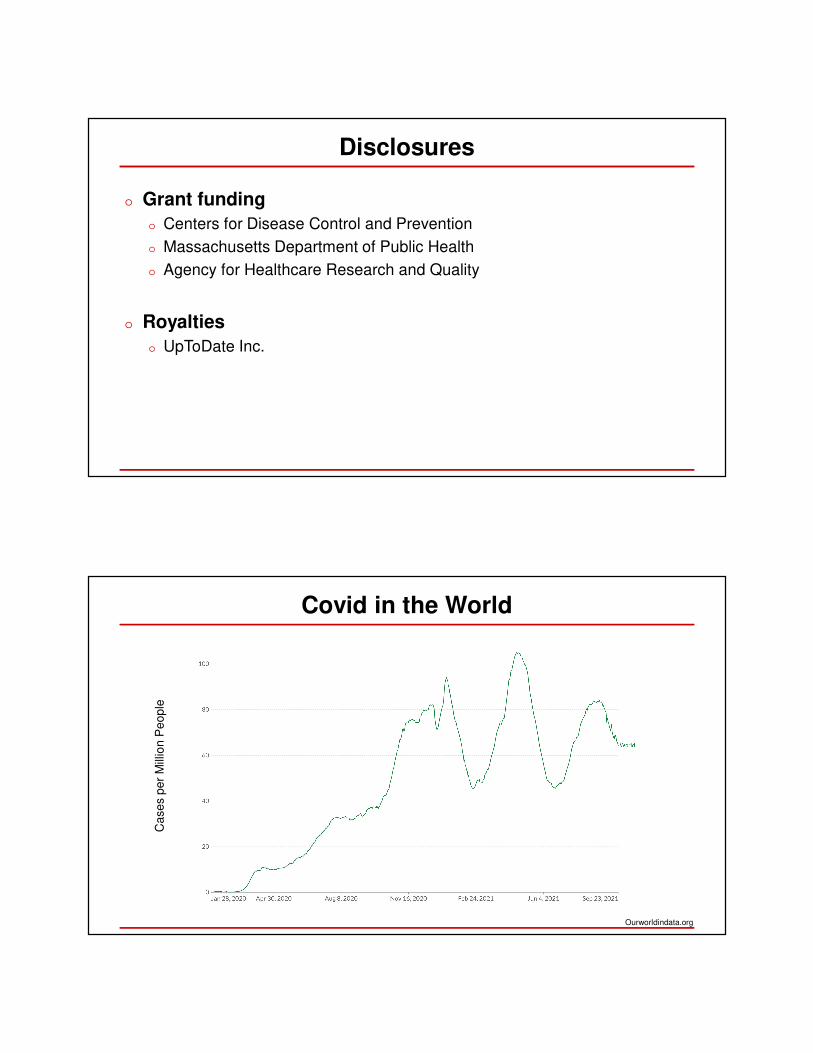
Covid in the World
Ca
se
s p
er
Mill
ion
Pe
op
le
Ourworldindata.org
Rise of Delta in the USA
99% of
sequenced
isolates
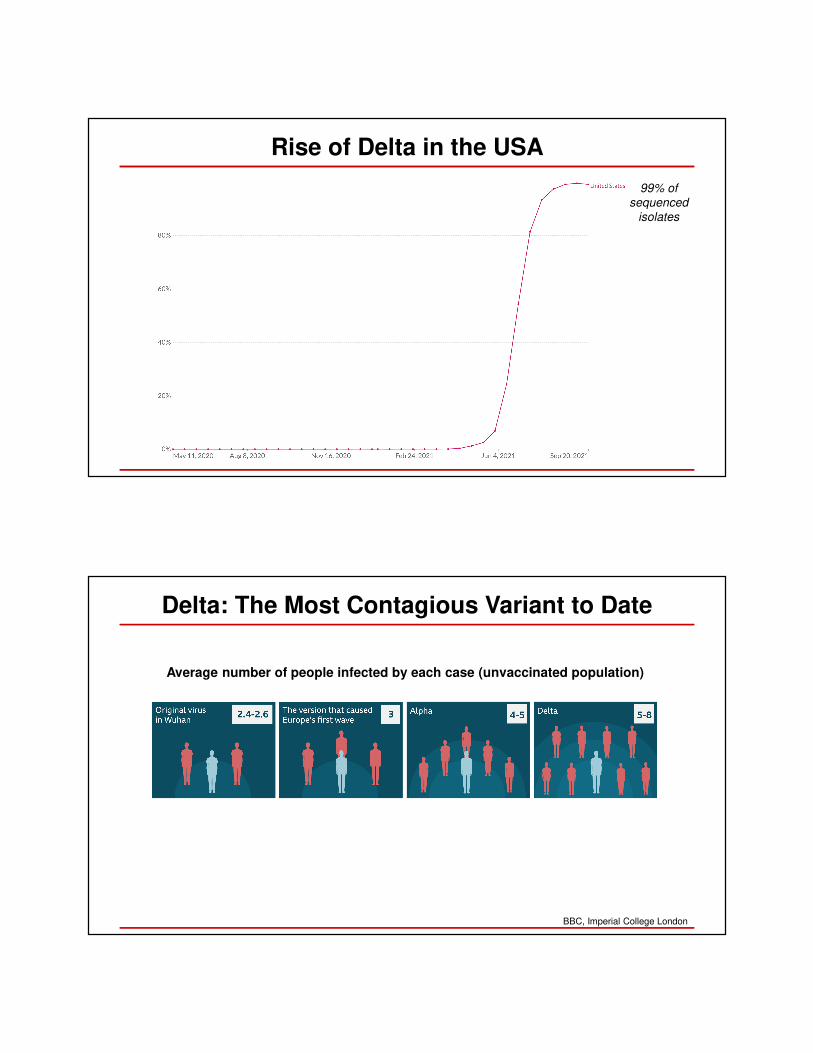
Delta: The Most Contagious Variant to Date
Average number of people infected by each case (unvaccinated population)
BBC, Imperial College London
phil.cdc.gov/phil/details.asp?pid=11162
Transmission
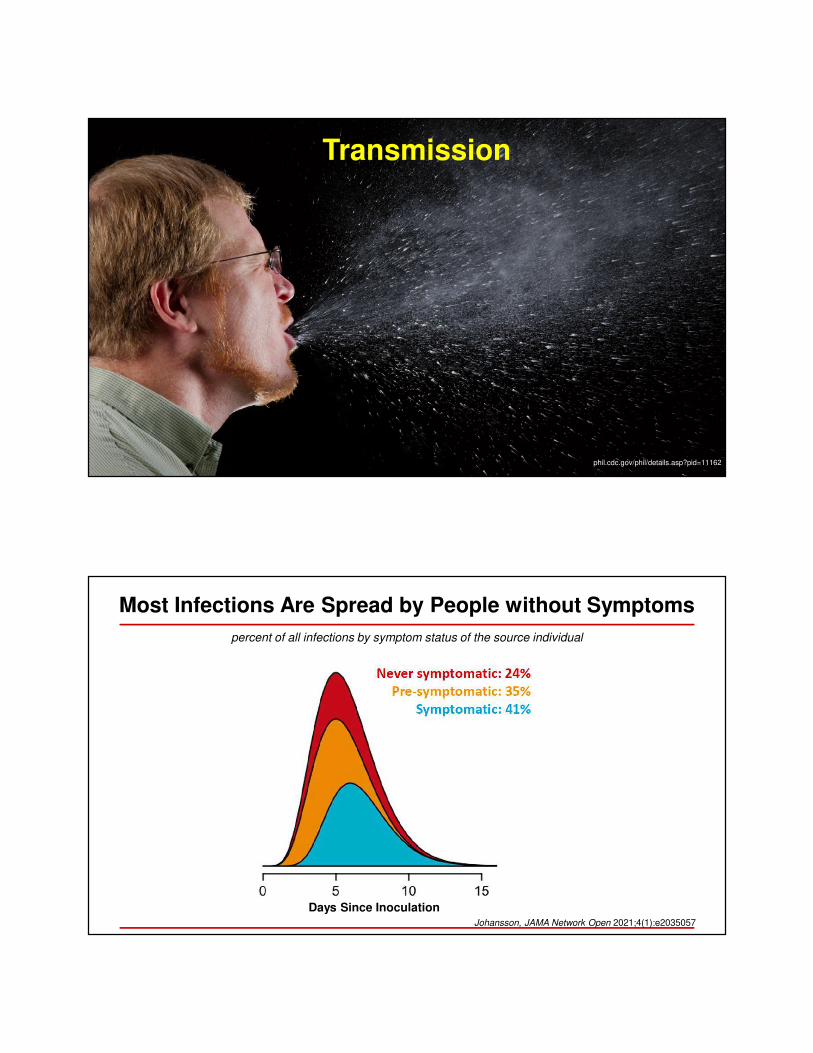
Most Infections Are Spread by People without Symptoms
Days Since Inoculation
percent of all infections by symptom status of the source individual
Johansson, JAMA Network Open 2021;4(1):e2035057
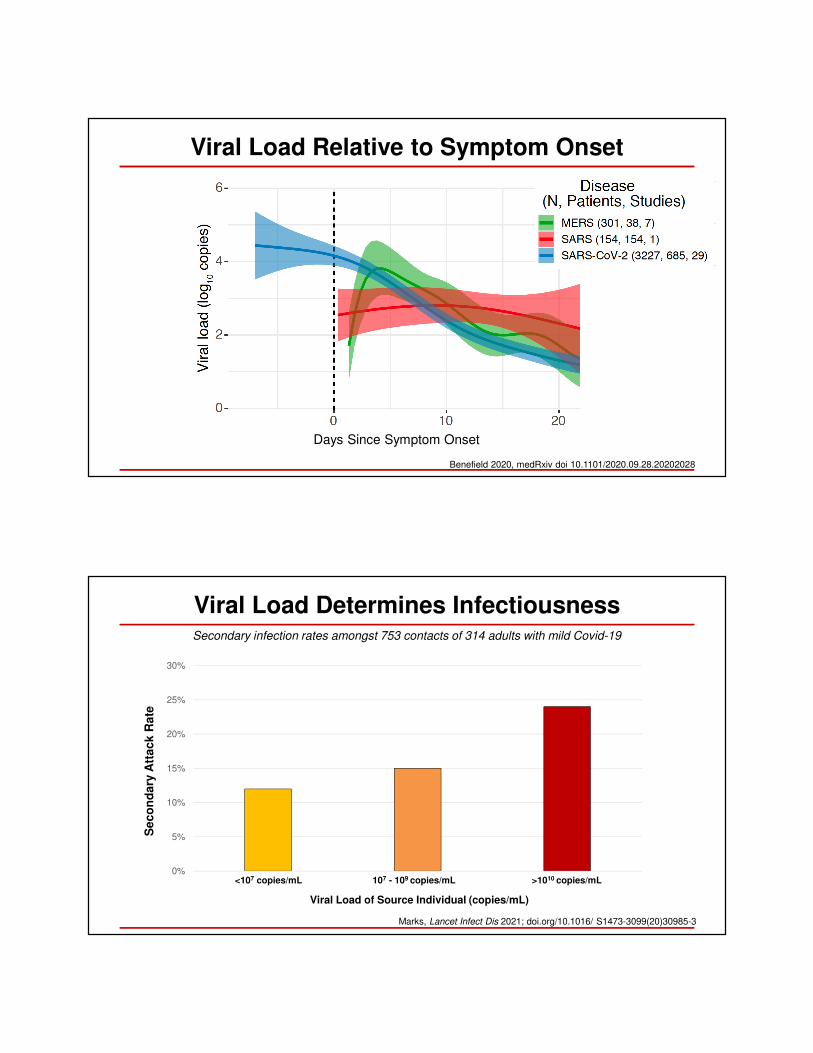
Viral Load Relative to Symptom Onset
Days Since Symptom Onset
Benefield 2020, medRxiv doi 10.1101/2020.09.28.20202028
Viral Load Determines Infectiousness
0%
5%
10%
15%
20%
25%
30%
<10^7 10^7 - 10^9 ≥10^10
Se
co
nd
ary
Att
ac
k R
ate
Viral Load of Source Individual (copies/mL)
Marks, Lancet Infect Dis 2021; doi.org/10.1016/ S1473-3099(20)30985-3
Secondary infection rates amongst 753 contacts of 314 adults with mild Covid-19
<107 copies/mL 107 - 109 copies/mL >1010 copies/mL
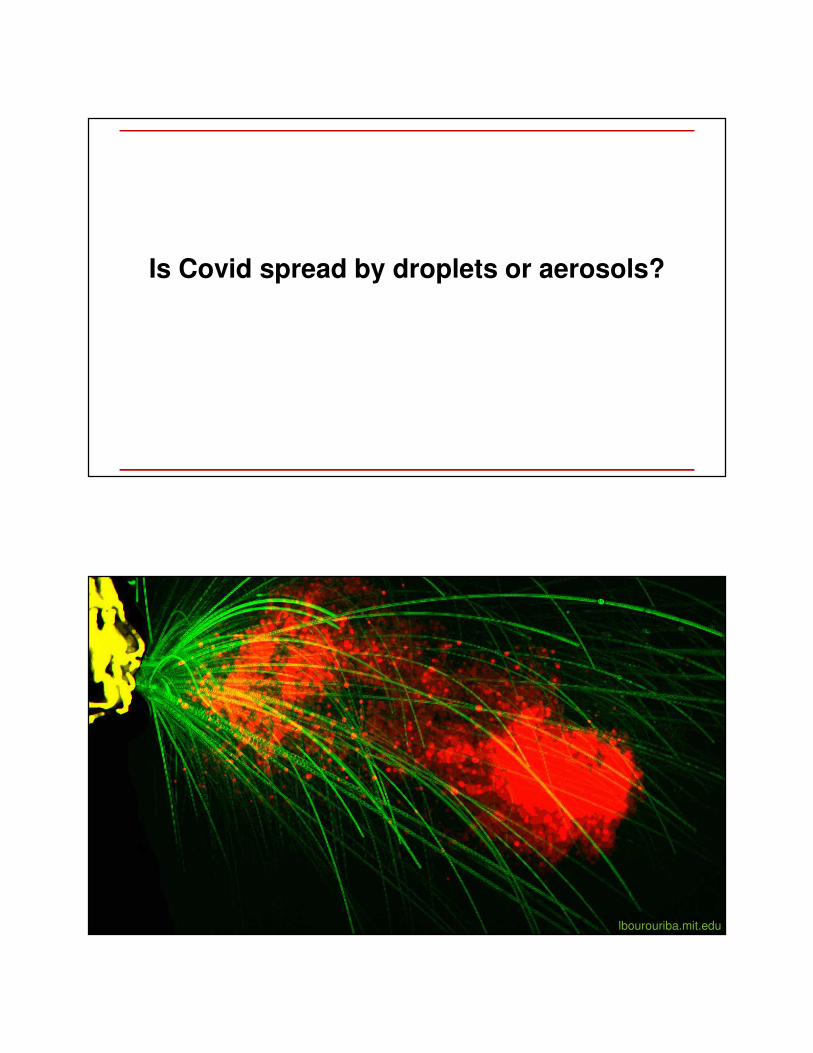
Is Covid spread by droplets or aerosols?
lbourouriba.mit.edu
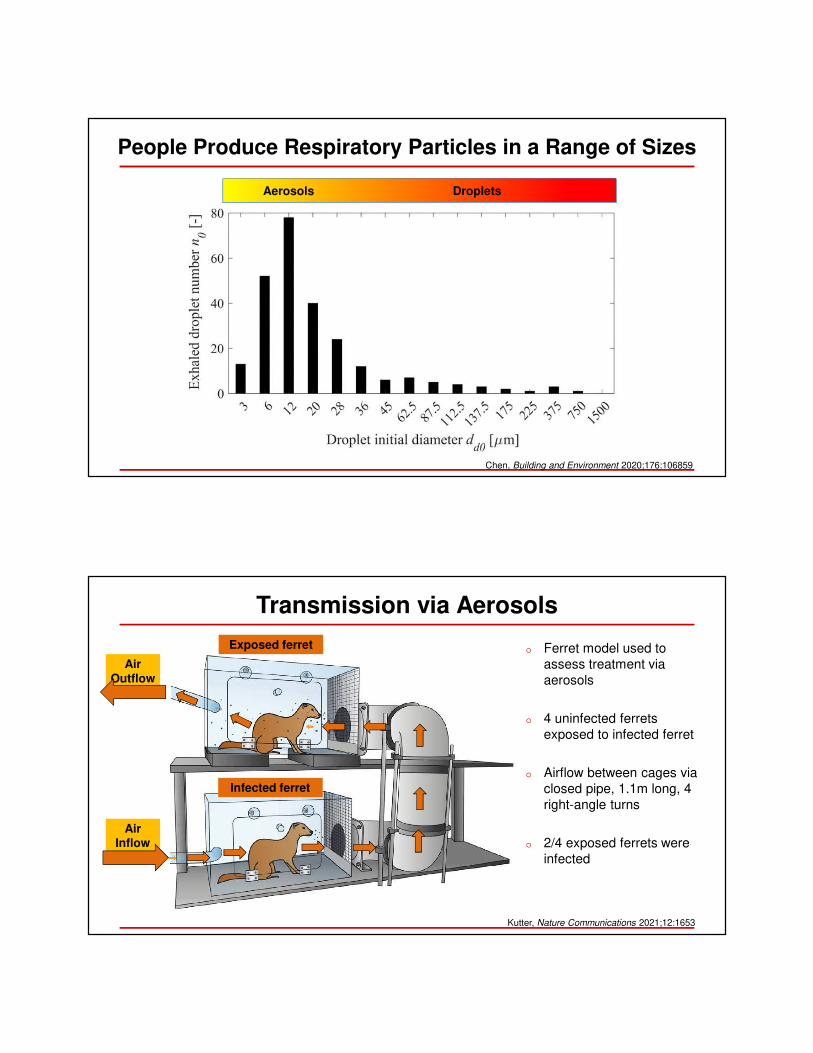
People Produce Respiratory Particles in a Range of Sizes
Aerosols Droplets
Chen, Building and Environment 2020;176:106859
Transmission via Aerosols
o Ferret model used to
assess treatment via
aerosols
o 4 uninfected ferrets
exposed to infected ferret
o Airflow between cages via
closed pipe, 1.1m long, 4
right-angle turns
o 2/4 exposed ferrets were
infected
Air Inflow
Air Outflow
Infected ferret
Exposed ferret
Kutter, Nature Communications 2021;12:1653
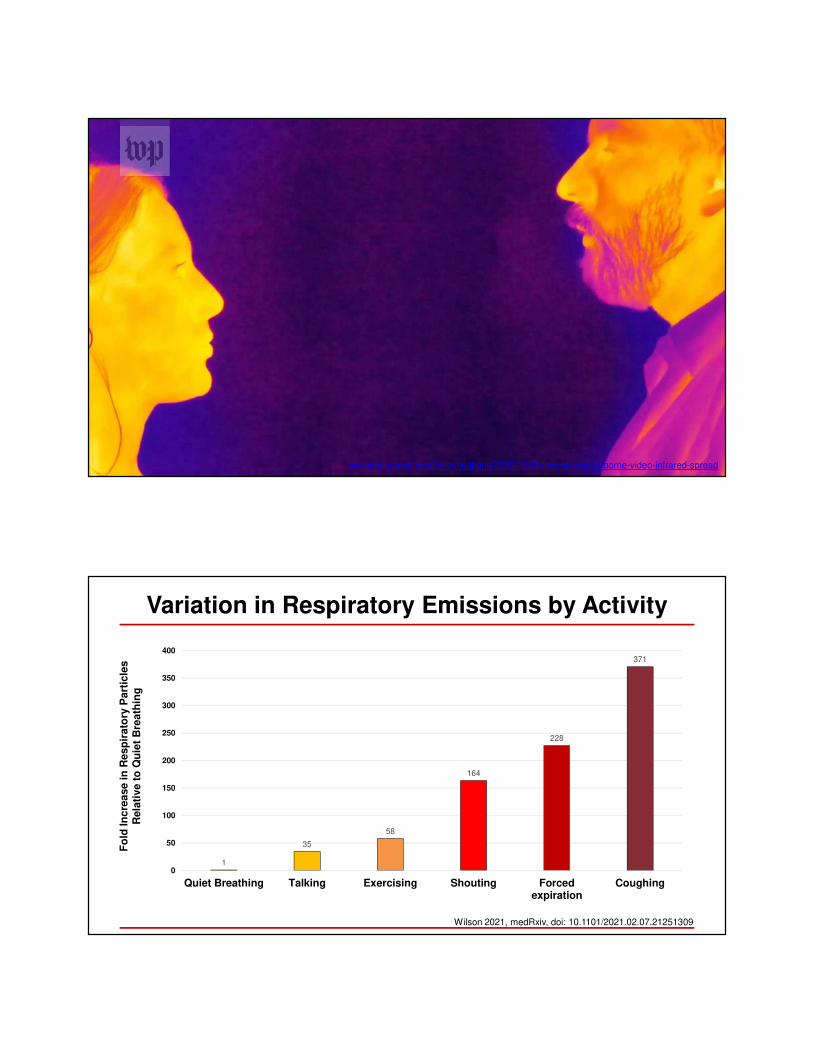
washingtonpost.com/investigations/2020/12/11/coronavirus-airborne-video-infrared-spread
Variation in Respiratory Emissions by Activity
1
35
58
164
228
371
0
50
100
150
200
250
300
350
400
Quiet Breathing Talking Exercising Shouting Forcedexpiration
Coughing
Fo
ld In
cre
ase in
Resp
irato
ry P
art
icle
s
Rela
tive t
o Q
uie
t B
reath
ing
Wilson 2021, medRxiv, doi: 10.1101/2021.02.07.21251309
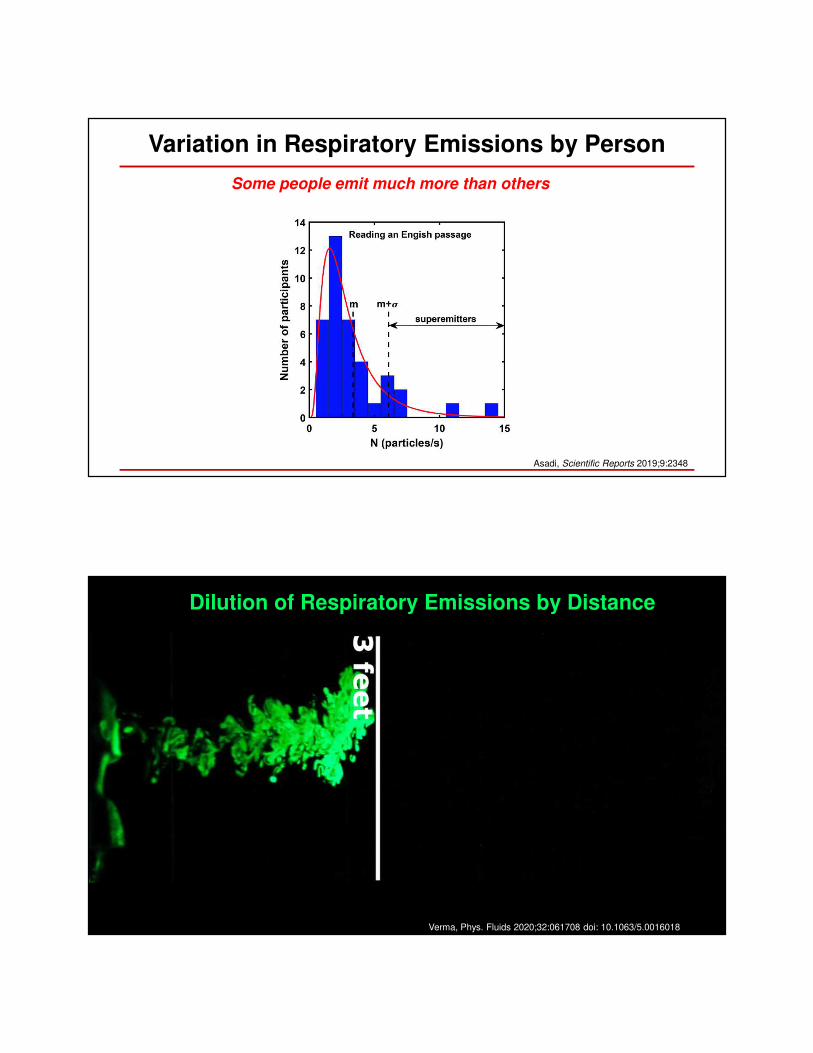
Variation in Respiratory Emissions by Person
Asadi, Scientific Reports 2019;9:2348
Some people emit much more than others
Verma, Phys. Fluids 2020;32:061708 doi: 10.1063/5.0016018
Dilution of Respiratory Emissions by Distance
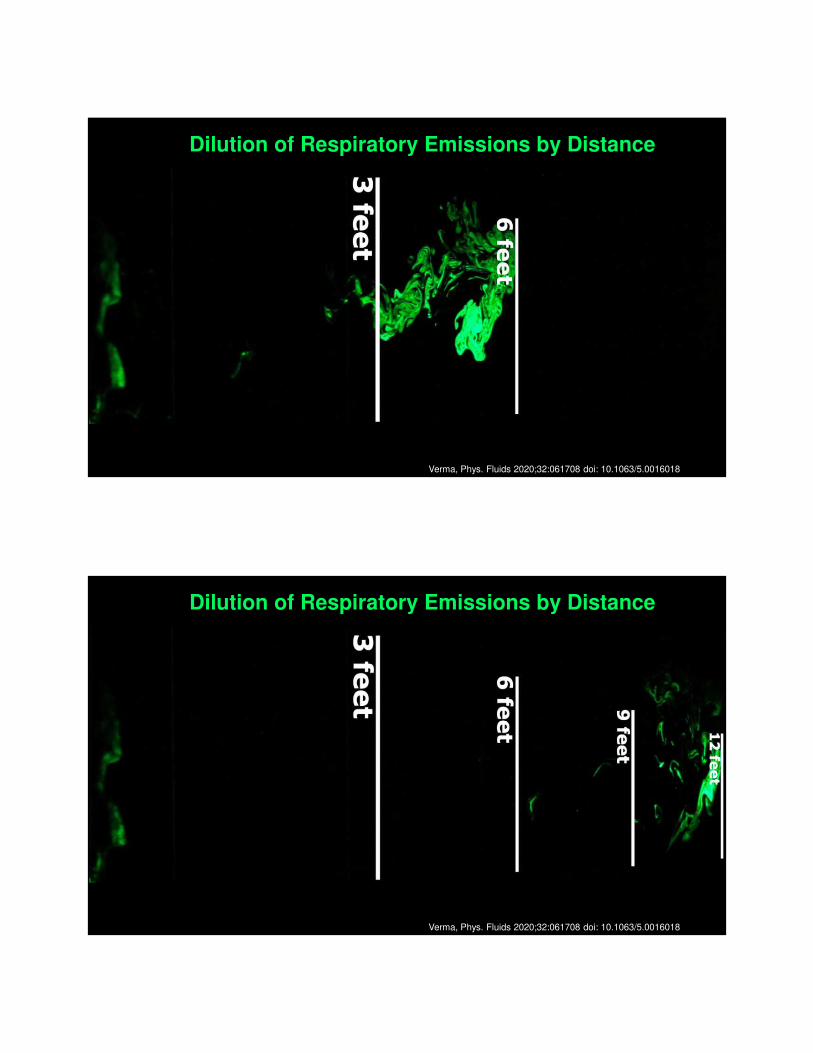
Verma, Phys. Fluids 2020;32:061708 doi: 10.1063/5.0016018
Dilution of Respiratory Emissions by Distance
Verma, Phys. Fluids 2020;32:061708 doi: 10.1063/5.0016018
Dilution of Respiratory Emissions by Distance
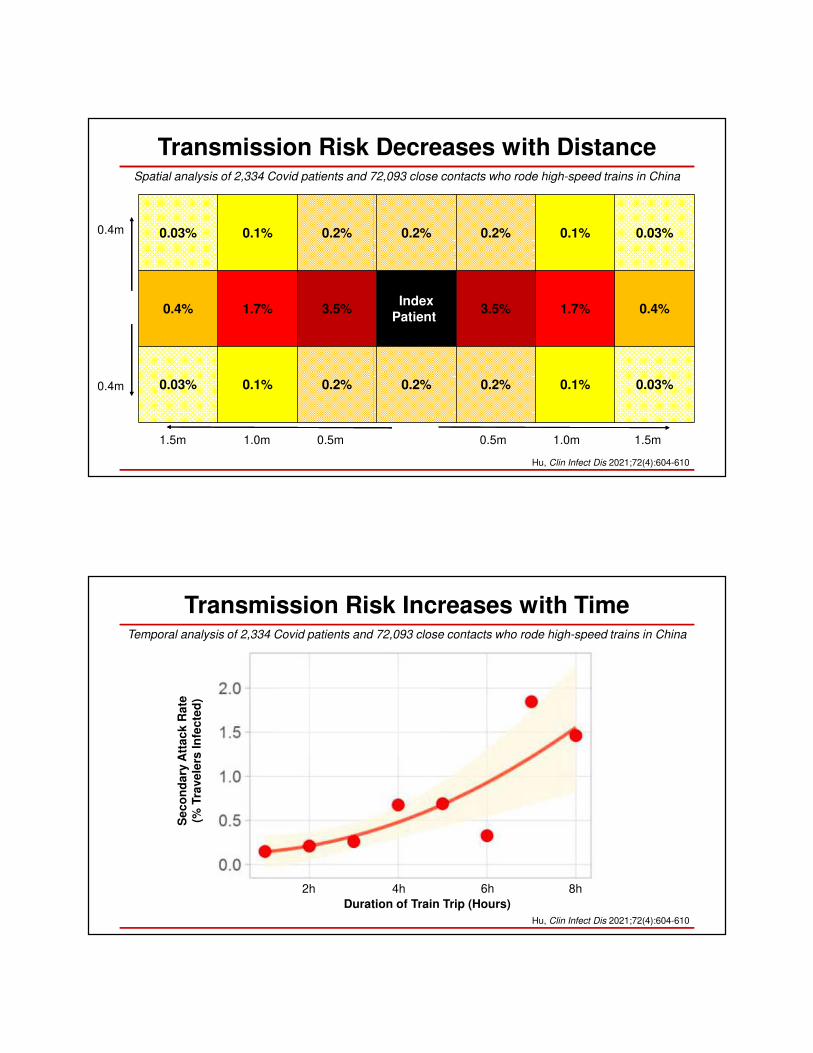
Transmission Risk Decreases with Distance
0.03% 0.1% 0.2% 0.2% 0.2% 0.1% 0.03%
0.4% 1.7% 3.5%Index
Patient-3.5% 1.7% 0.4%
0.03% 0.1% 0.2% 0.2% 0.2% 0.1% 0.03%
Spatial analysis of 2,334 Covid patients and 72,093 close contacts who rode high-speed trains in China
Hu, Clin Infect Dis 2021;72(4):604-610
0.5m 1.0m 1.5m1.5m 1.0m 0.5m
0.4m
0.4m
Transmission Risk Increases with TimeTemporal analysis of 2,334 Covid patients and 72,093 close contacts who rode high-speed trains in China
Se
co
nd
ary
Att
ac
k R
ate
(%
Tra
ve
lers
In
fec
ted
)
Duration of Train Trip (Hours)
2h 4h 6h 8h
Hu, Clin Infect Dis 2021;72(4):604-610
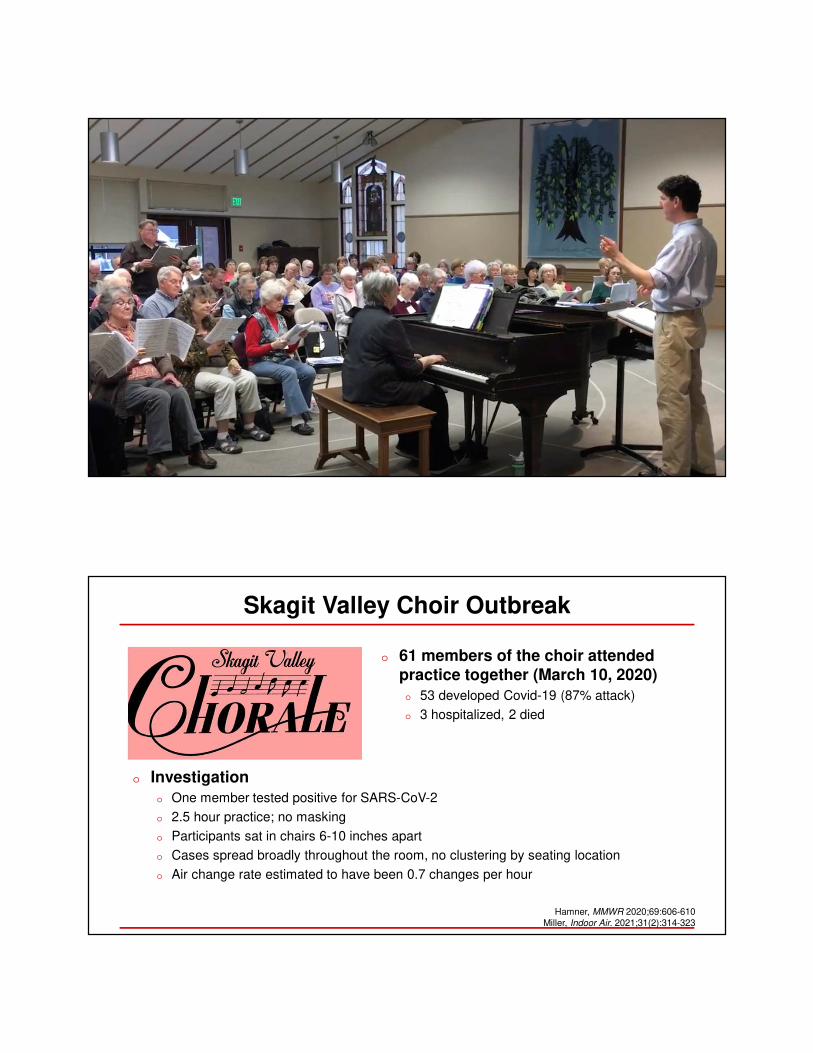
Skagit Valley Choir Outbreak
o 61 members of the choir attended practice together (March 10, 2020)
o 53 developed Covid-19 (87% attack)
o 3 hospitalized, 2 died
o Investigation
o One member tested positive for SARS-CoV-2
o 2.5 hour practice; no masking
o Participants sat in chairs 6-10 inches apart
o Cases spread broadly throughout the room, no clustering by seating location
o Air change rate estimated to have been 0.7 changes per hour
Hamner, MMWR 2020;69:606-610
Miller, Indoor Air. 2021;31(2):314-323
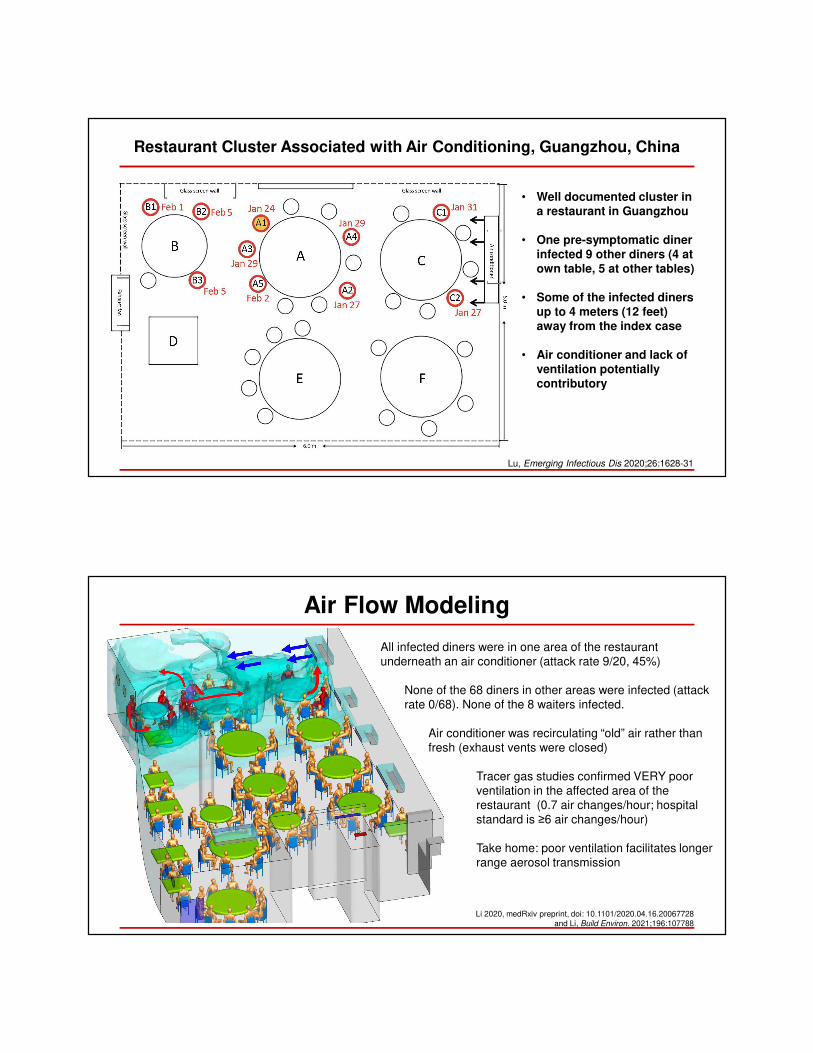
Restaurant Cluster Associated with Air Conditioning, Guangzhou, China
• Well documented cluster in a restaurant in Guangzhou
• One pre-symptomatic diner infected 9 other diners (4 at own table, 5 at other tables)
• Some of the infected diners up to 4 meters (12 feet) away from the index case
• Air conditioner and lack of ventilation potentially contributory
Lu, Emerging Infectious Dis 2020;26:1628-31
Air Flow Modeling
All infected diners were in one area of the restaurant
underneath an air conditioner (attack rate 9/20, 45%)
None of the 68 diners in other areas were infected (attack
rate 0/68). None of the 8 waiters infected.
Air conditioner was recirculating “old” air rather than
fresh (exhaust vents were closed)
Tracer gas studies confirmed VERY poor
ventilation in the affected area of the
restaurant (0.7 air changes/hour; hospital
standard is ≥6 air changes/hour)
Take home: poor ventilation facilitates longer
range aerosol transmission
Li 2020, medRxiv preprint, doi: 10.1101/2020.04.16.20067728
and Li, Build Environ. 2021;196:107788
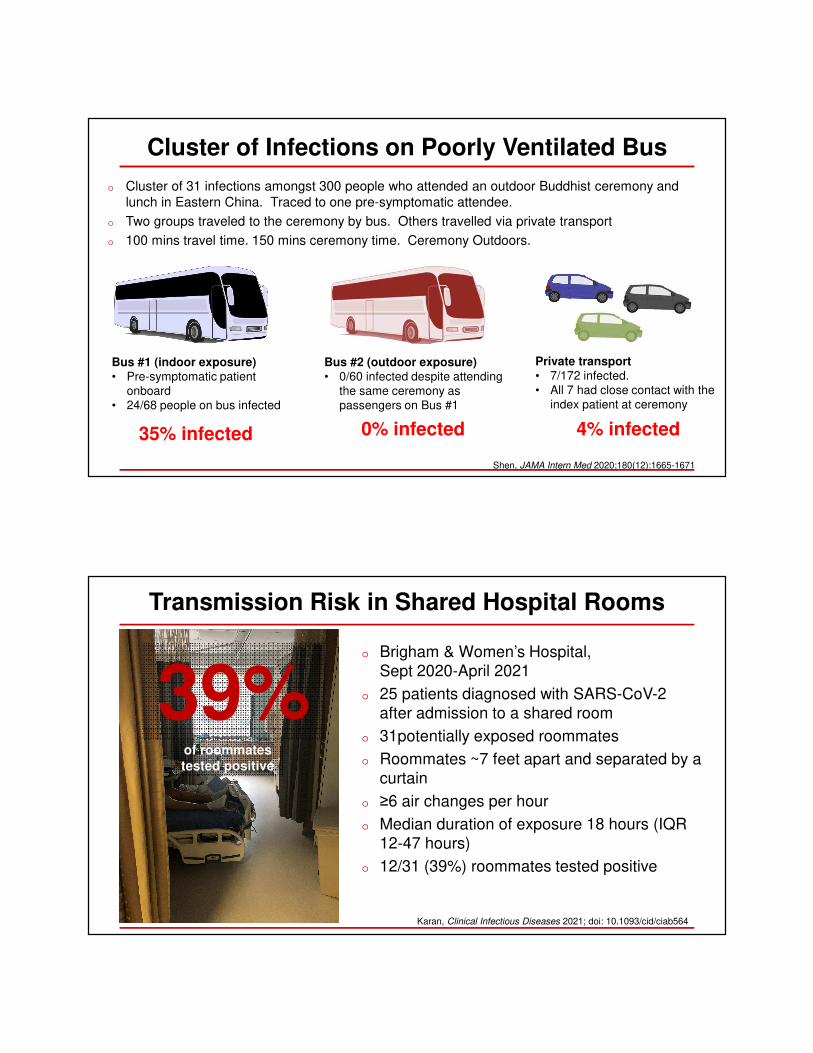
Cluster of Infections on Poorly Ventilated Bus
o Cluster of 31 infections amongst 300 people who attended an outdoor Buddhist ceremony and
lunch in Eastern China. Traced to one pre-symptomatic attendee.
o Two groups traveled to the ceremony by bus. Others travelled via private transport
o 100 mins travel time. 150 mins ceremony time. Ceremony Outdoors.
Shen, JAMA Intern Med 2020;180(12):1665-1671
Bus #1 (indoor exposure)• Pre-symptomatic patient
onboard
• 24/68 people on bus infected
Bus #2 (outdoor exposure)• 0/60 infected despite attending
the same ceremony as
passengers on Bus #1
Private transport• 7/172 infected.
• All 7 had close contact with the
index patient at ceremony
35% infected 0% infected 4% infected
Transmission Risk in Shared Hospital Rooms
o Brigham & Women’s Hospital,
Sept 2020-April 2021
o 25 patients diagnosed with SARS-CoV-2
after admission to a shared room
o 31potentially exposed roommates
o Roommates ~7 feet apart and separated by a
curtain
o ≥6 air changes per hour
o Median duration of exposure 18 hours (IQR
12-47 hours)
o 12/31 (39%) roommates tested positive
of roommates
tested positive
Karan, Clinical Infectious Diseases 2021; doi: 10.1093/cid/ciab564
39%
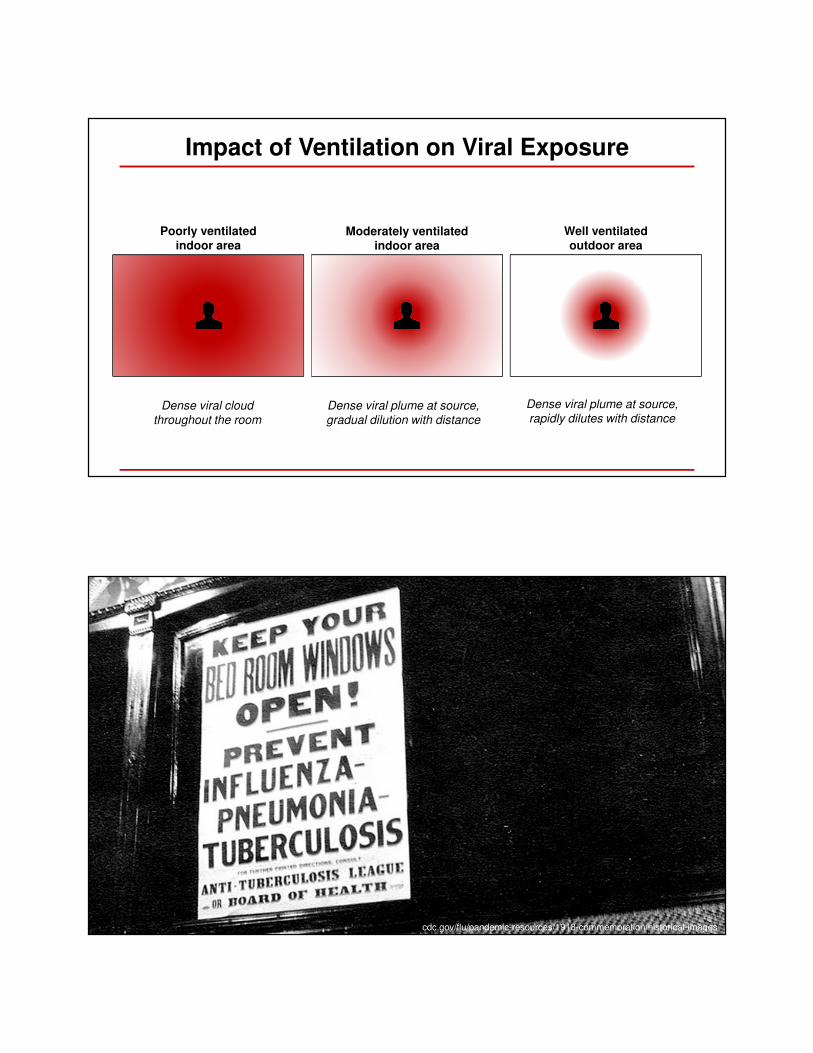
Impact of Ventilation on Viral Exposure
Well ventilatedoutdoor area
Moderately ventilated indoor area
Poorly ventilated indoor area
Dense viral plume at source,
rapidly dilutes with distanceDense viral plume at source,
gradual dilution with distance
Dense viral cloud
throughout the room
cdc.gov/flu/pandemic-resources/1918-commemoration/historical-images
Aerosol Clearance in Operating Room (positive pressure, 27 air changes per hour)
vs Airborne Infection Isolation Room (negative pressure, 12 air changes per hour)
AIIR, Negative Pressure, 12 ACH OR, Positive Pressure, 27 ACH
Aerosols At Patient Head Aerosols Outside Room
Tsui, Br J Anaesthesia 2020; doi: 10.1016/j.bja.2020.09.011
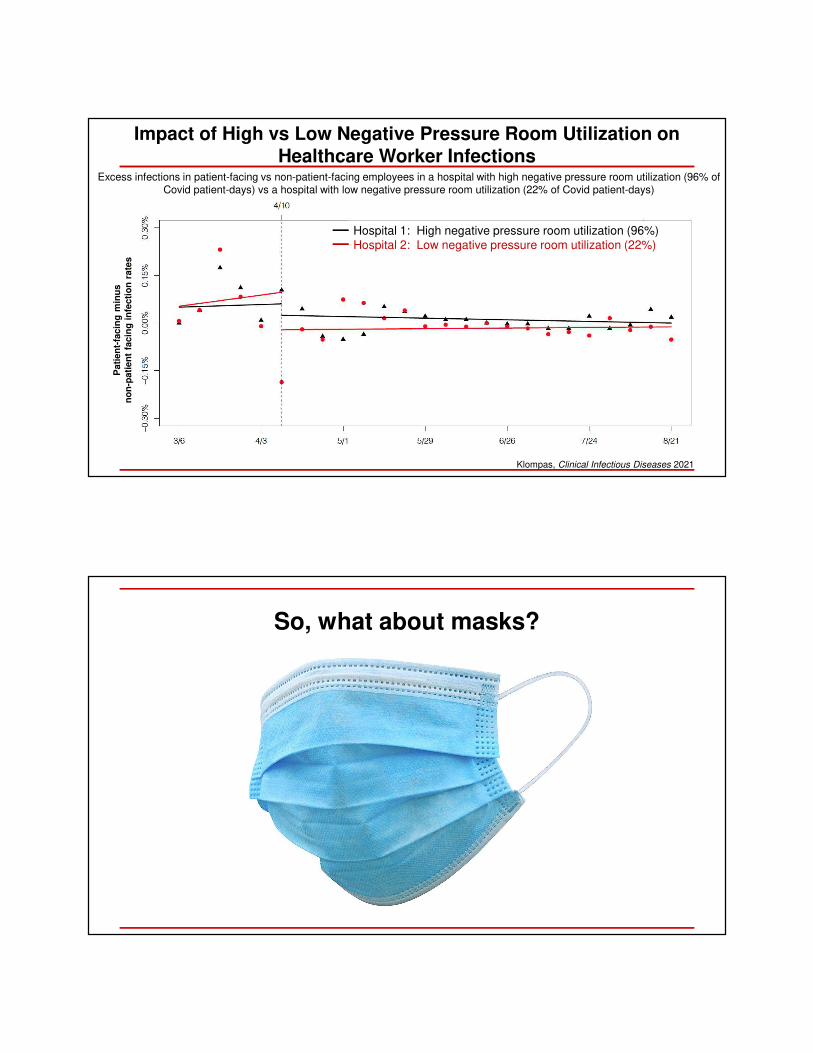
Impact of High vs Low Negative Pressure Room Utilization on Healthcare Worker Infections
Excess infections in patient-facing vs non-patient-facing employees in a hospital with high negative pressure room utilization (96% of Covid patient-days) vs a hospital with low negative pressure room utilization (22% of Covid patient-days)
Hospital 1: High negative pressure room utilization (96%)
Hospital 2: Low negative pressure room utilization (22%)
Pati
en
t-fa
cin
g m
inu
s
no
n-p
ati
en
t fa
cin
g i
nfe
cti
on
rate
s
Klompas, Clinical Infectious Diseases 2021
So, what about masks?
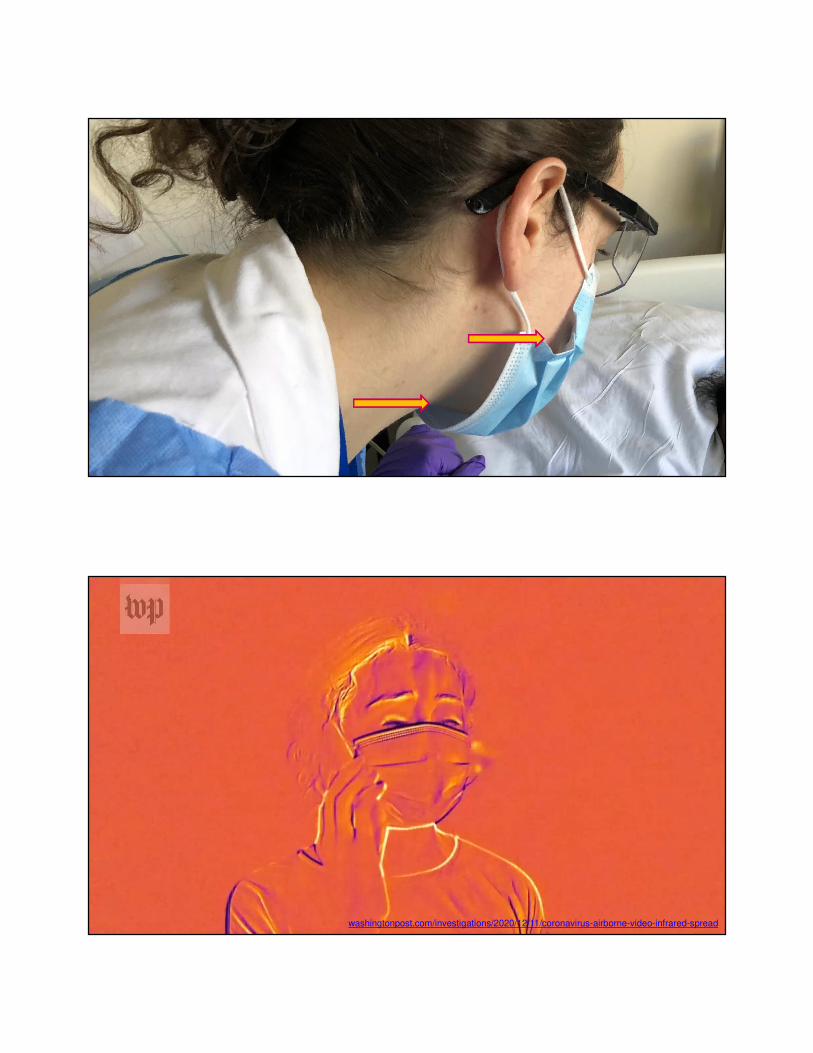
Medical Masks are Good! … But Not Perfect
No Mask
Mask on Source
Mask on Exposed
67%(10/15) Infected
17%(2/12) Infected
33%(4/12) Infected
Transmission study using Golden Syrian Hamsters in adjacent cages with and without tightly fixed surgical masks between cages
Chan, Clin Infect Dis 2020;71:2139-2149
Mask Filtration Efficiency in Practice
Clapp, JAMA Intern Med 2020; doi: 10.1001/jamainternmed.2020.8168
Test
End
Mask
Off
Pa
rtic
le p
en
etr
ati
on
be
hin
d m
as
k (
%)
Medical Masks’ Overall Efficiency: 38%
washingtonpost.com/investigations/2020/12/11/coronavirus-airborne-video-infrared-spread
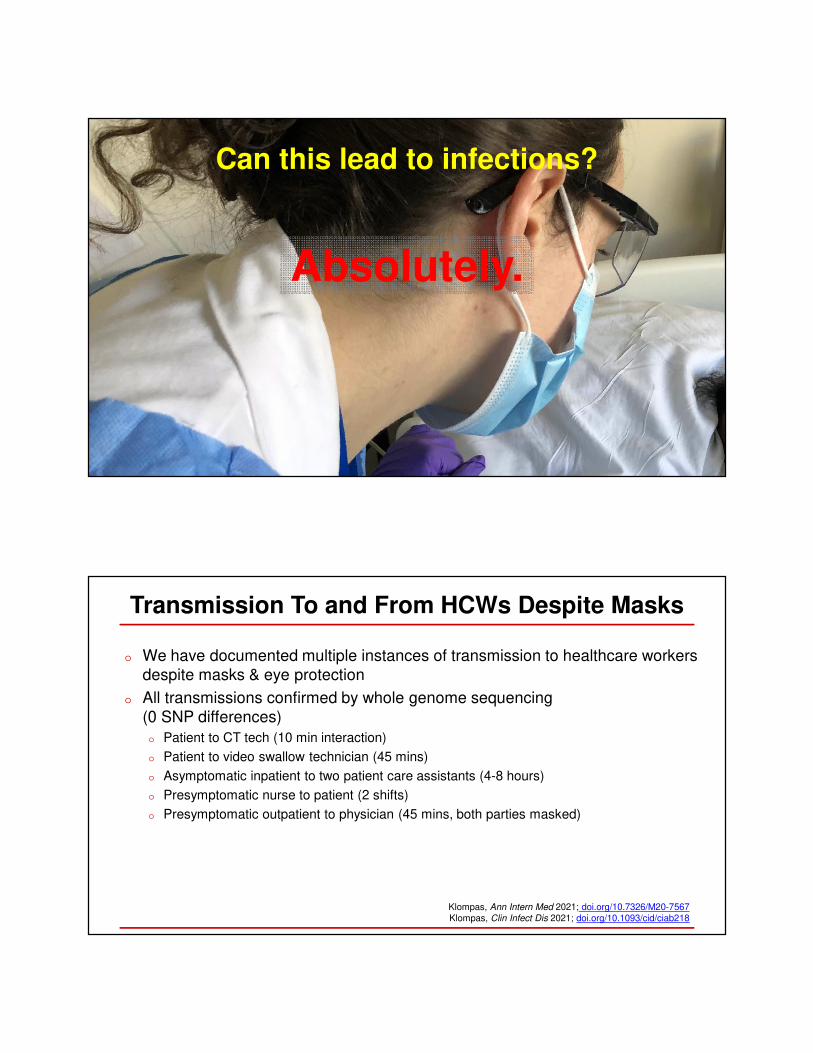
Can this lead to infections?
Absolutely.
Transmission To and From HCWs Despite Masks
o We have documented multiple instances of transmission to healthcare workers
despite masks & eye protection
o All transmissions confirmed by whole genome sequencing
(0 SNP differences)
o Patient to CT tech (10 min interaction)
o Patient to video swallow technician (45 mins)
o Asymptomatic inpatient to two patient care assistants (4-8 hours)
o Presymptomatic nurse to patient (2 shifts)
o Presymptomatic outpatient to physician (45 mins, both parties masked)
Klompas, Ann Intern Med 2021; doi.org/10.7326/M20-7567
Klompas, Clin Infect Dis 2021; doi.org/10.1093/cid/ciab218
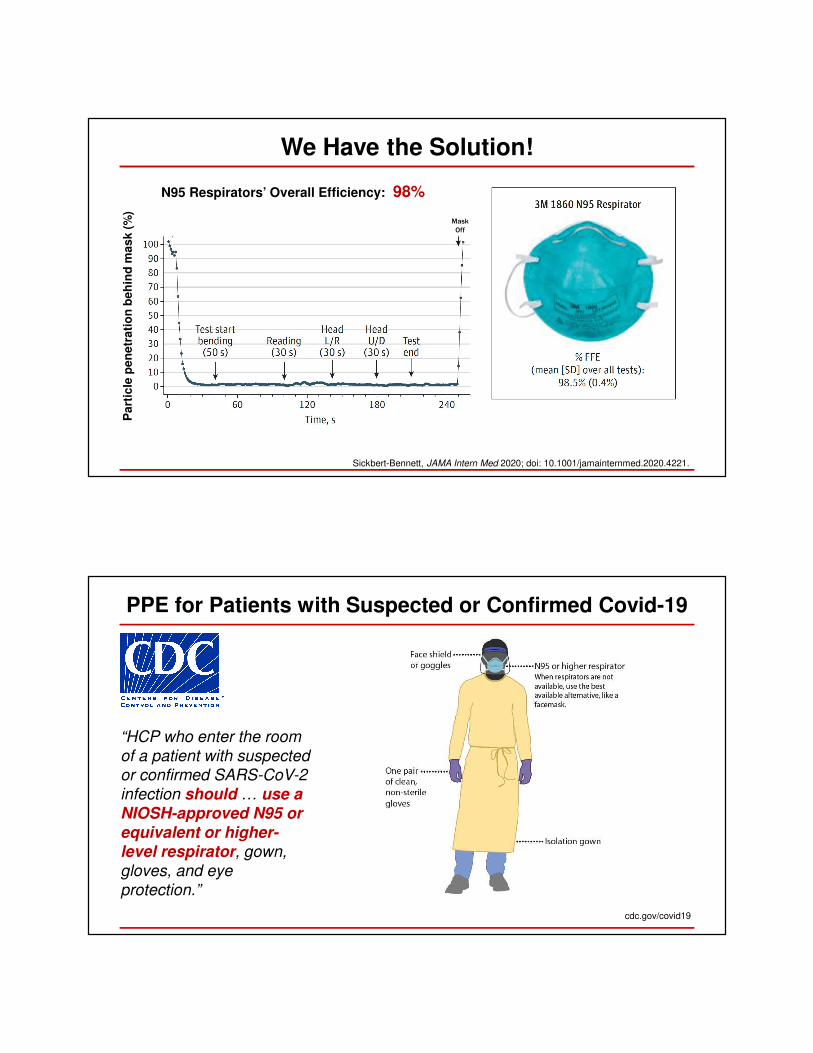
We Have the Solution!
Sickbert-Bennett, JAMA Intern Med 2020; doi: 10.1001/jamainternmed.2020.4221.
Mask
Off
Pa
rtic
le p
en
etr
ati
on
be
hin
d m
as
k (
%)
N95 Respirators’ Overall Efficiency: 98%
PPE for Patients with Suspected or Confirmed Covid-19
cdc.gov/covid19
“HCP who enter the room
of a patient with suspected
or confirmed SARS-CoV-2
infection should … use a
NIOSH-approved N95 or
equivalent or higher-
level respirator, gown,
gloves, and eye
protection.”
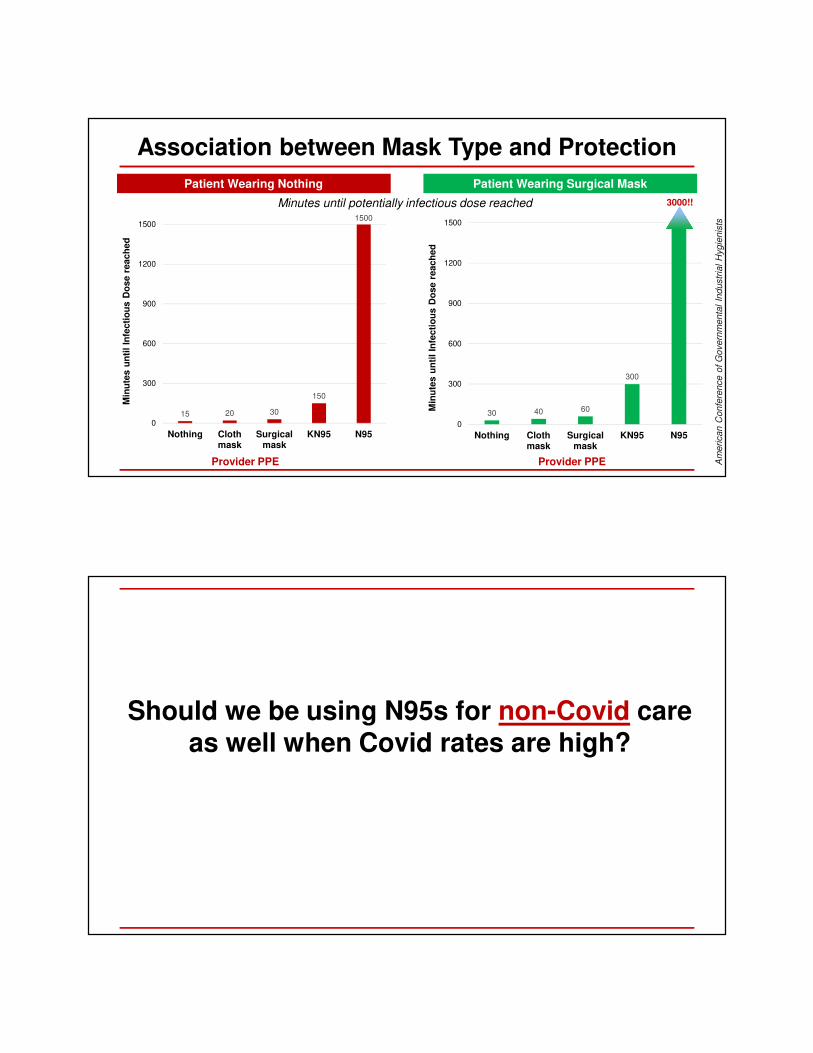
Association between Mask Type and Protection
15 20 30
150
1500
0
300
600
900
1200
1500
Nothing Clothmask
Surgicalmask
KN95 N95
Min
ute
s u
nti
l In
fecti
ou
s D
ose r
each
ed
Provider PPE
Minutes until potentially infectious dose reached
Am
erican C
onfe
rence o
f G
overn
menta
l In
dustr
ial H
ygie
nis
ts
30 40 60
300
0
300
600
900
1200
1500
Nothing Clothmask
Surgicalmask
KN95 N95M
inu
tes u
nti
l In
fecti
ou
s D
ose r
each
ed
Patient Wearing Nothing Patient Wearing Surgical Mask
3000!!
Provider PPE
Should we be using N95s for non-Covid care as well when Covid rates are high?
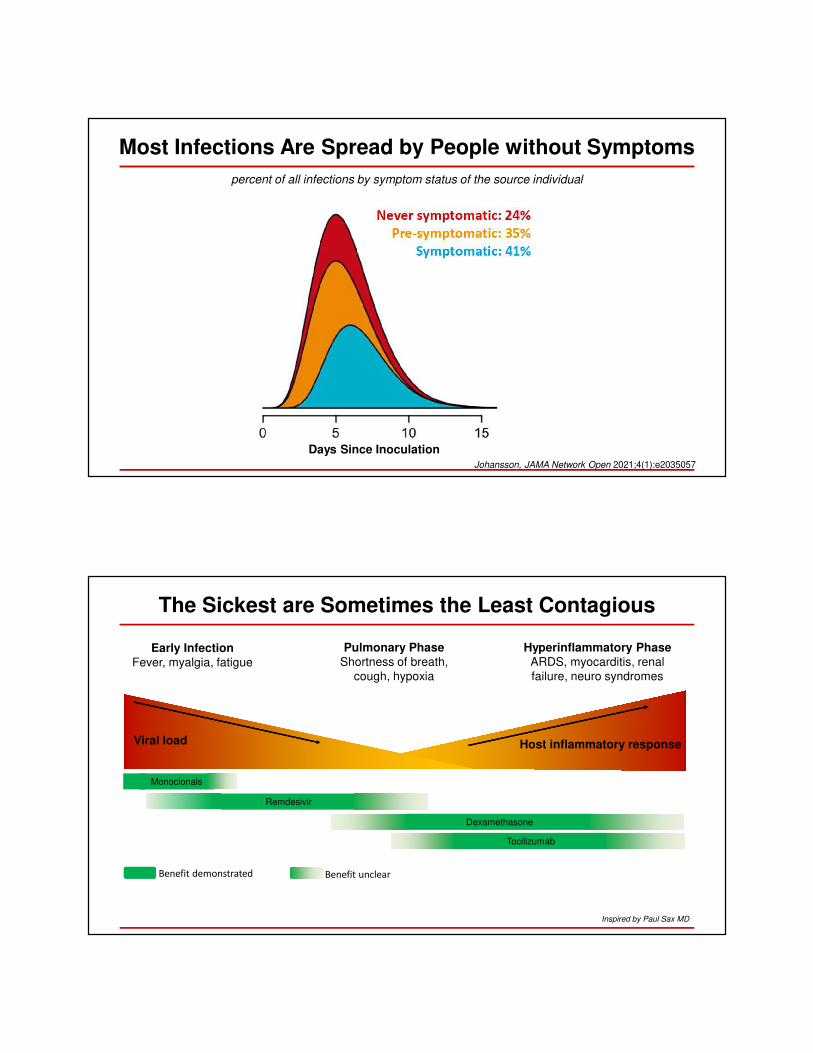
Most Infections Are Spread by People without Symptoms
Days Since Inoculation
percent of all infections by symptom status of the source individual
Johansson, JAMA Network Open 2021;4(1):e2035057
Early InfectionFever, myalgia, fatigue
Hyperinflammatory PhaseARDS, myocarditis, renal
failure, neuro syndromes
Pulmonary PhaseShortness of breath,
cough, hypoxia
Viral load Host inflammatory response
Inspired by Paul Sax MD
The Sickest are Sometimes the Least Contagious
Benefit unclearBenefit demonstrated
Remdesivir
Dexamethasone
Tocilizumab
Monoclonals
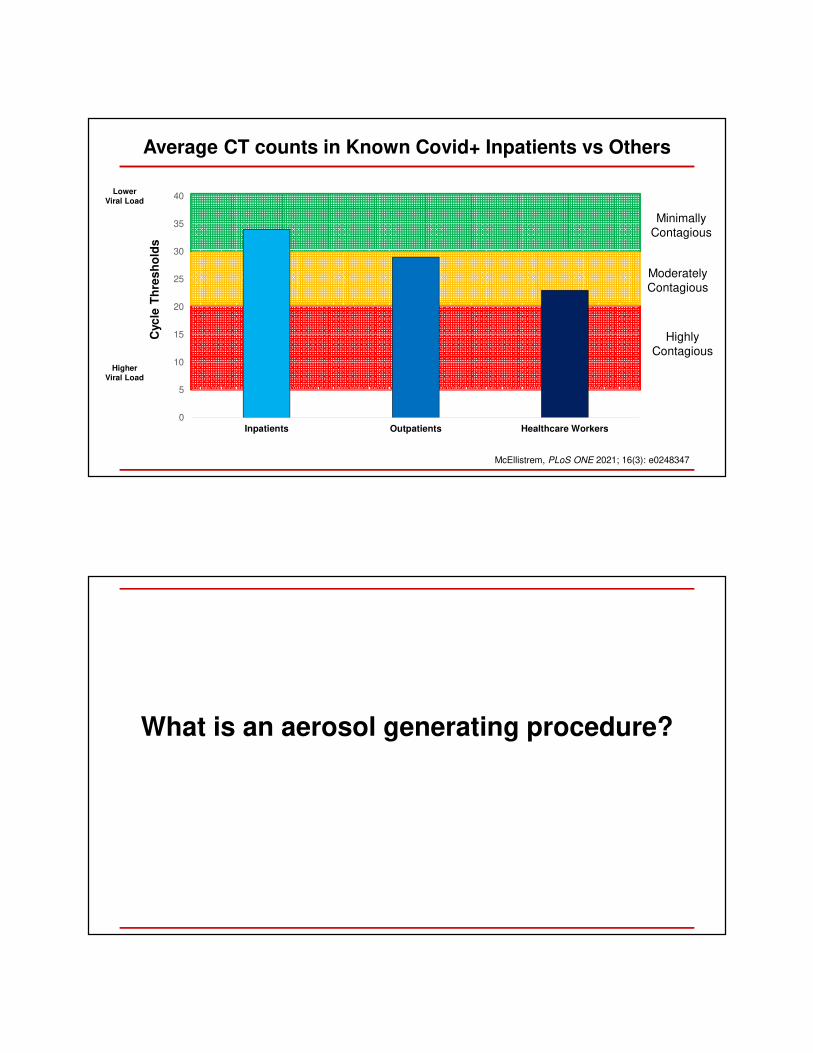
0
5
10
15
20
25
30
35
40
Inpatients Outpatients Healthcare Workers
Cyc
le T
hre
sh
old
s
Highly
Contagious
Moderately
Contagious
Minimally
Contagious
McEllistrem, PLoS ONE 2021; 16(3): e0248347
Average CT counts in Known Covid+ Inpatients vs Others
Lower Viral Load
Higher Viral Load
What is an aerosol generating procedure?
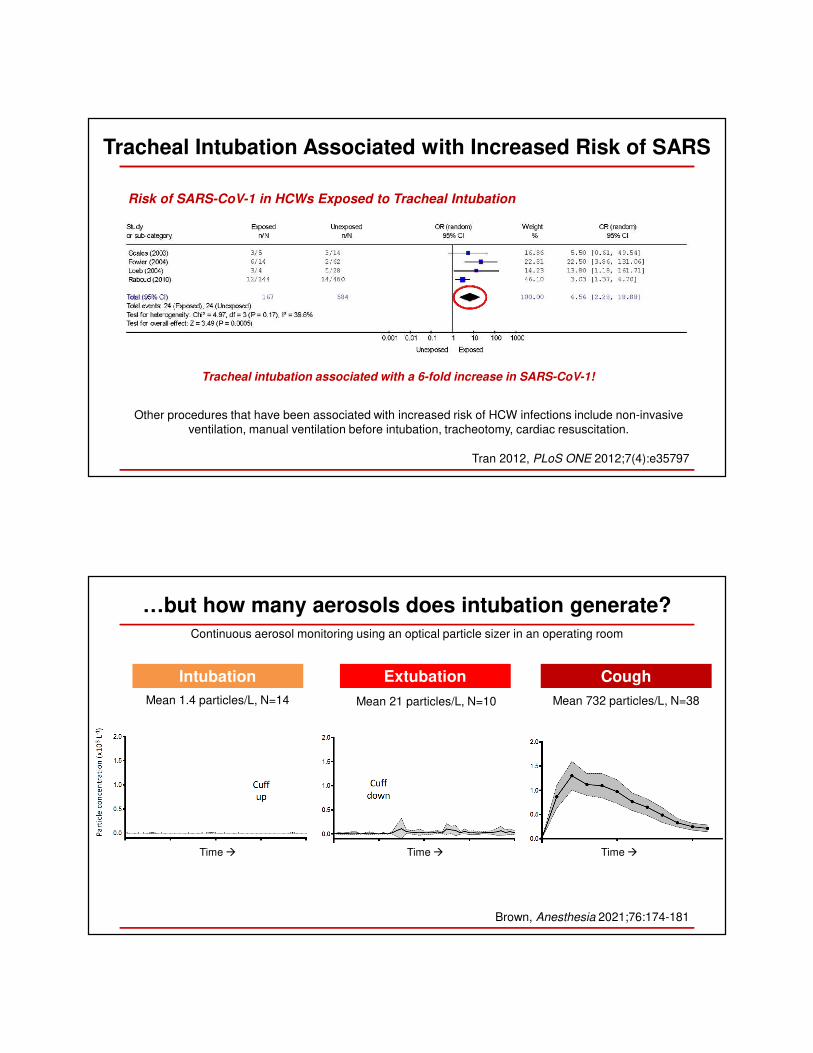
Tracheal Intubation Associated with Increased Risk of SARS
Risk of SARS-CoV-1 in HCWs Exposed to Tracheal Intubation
Tracheal intubation associated with a 6-fold increase in SARS-CoV-1!
Tran 2012, PLoS ONE 2012;7(4):e35797
Other procedures that have been associated with increased risk of HCW infections include non-invasive
ventilation, manual ventilation before intubation, tracheotomy, cardiac resuscitation.
…but how many aerosols does intubation generate?
Intubation Extubation Cough
Time Time Time
Continuous aerosol monitoring using an optical particle sizer in an operating room
Mean 732 particles/L, N=38Mean 21 particles/L, N=10Mean 1.4 particles/L, N=14
Brown, Anesthesia 2021;76:174-181
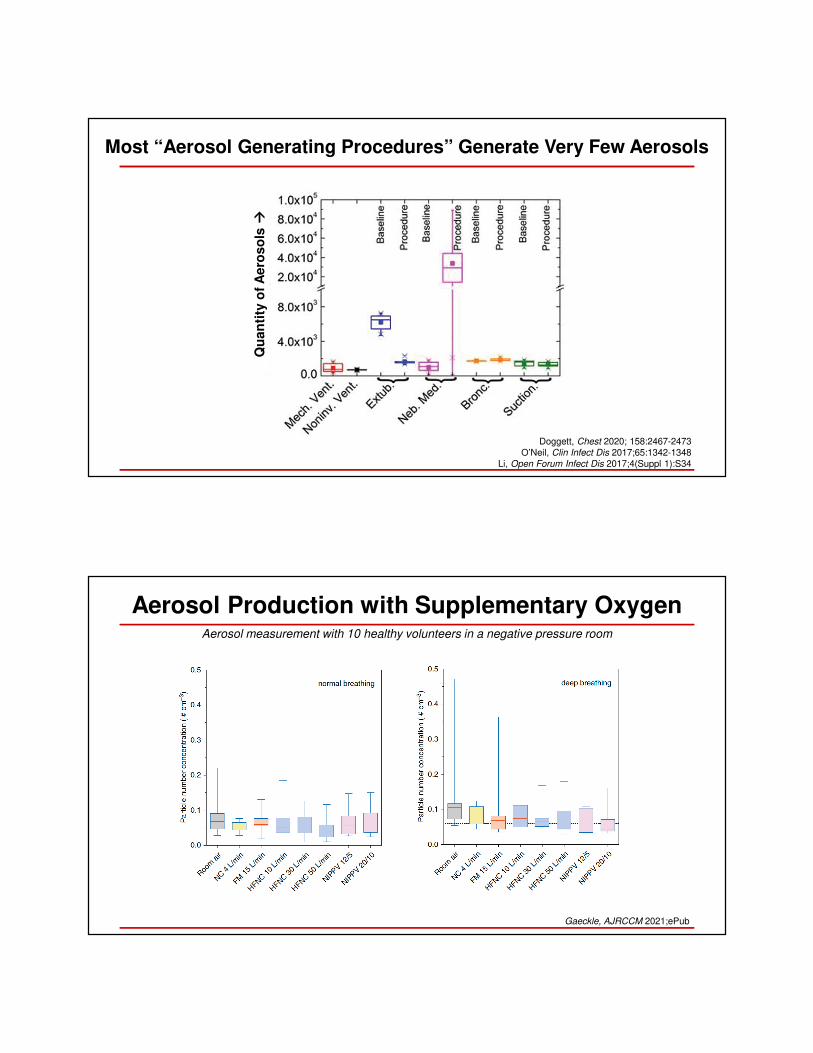
Most “Aerosol Generating Procedures” Generate Very Few Aerosols
Qu
an
tity
of
Aero
so
ls
Doggett, Chest 2020; 158:2467-2473
O’Neil, Clin Infect Dis 2017;65:1342-1348
Li, Open Forum Infect Dis 2017;4(Suppl 1):S34
Aerosol Production with Supplementary OxygenAerosol measurement with 10 healthy volunteers in a negative pressure room
Gaeckle, AJRCCM 2021;ePub
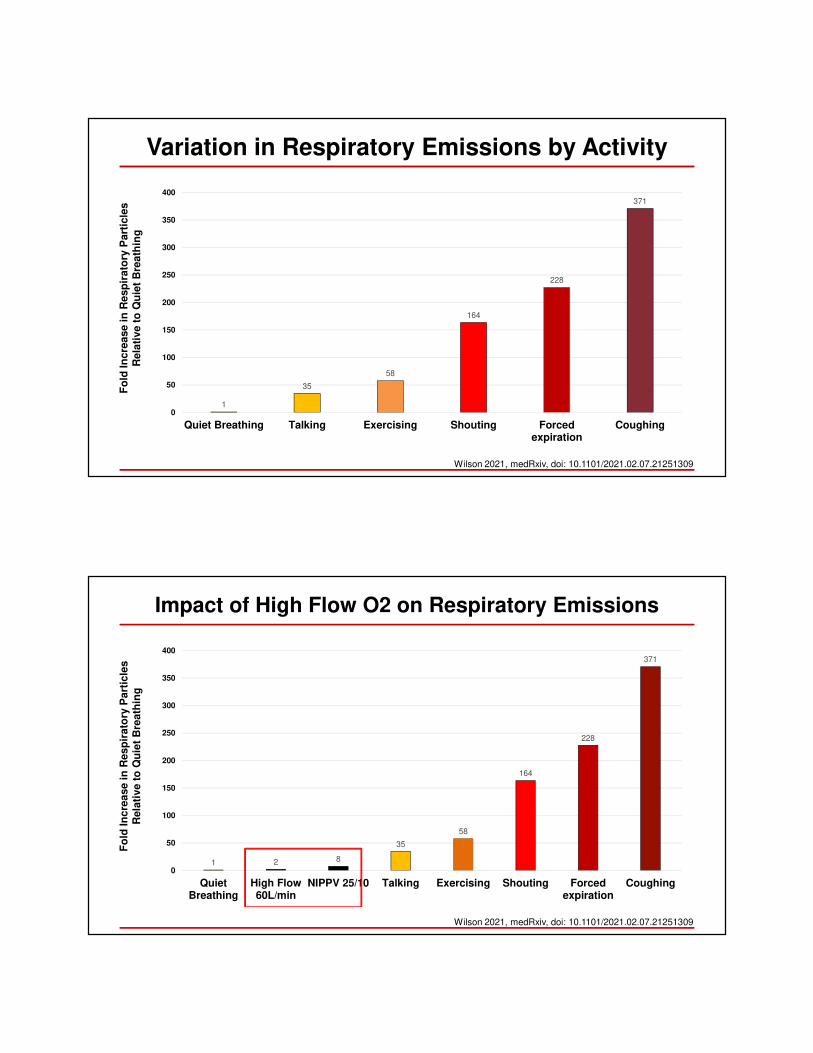
Variation in Respiratory Emissions by Activity
1
35
58
164
228
371
0
50
100
150
200
250
300
350
400
Quiet Breathing Talking Exercising Shouting Forcedexpiration
Coughing
Fo
ld In
cre
ase in
Resp
irato
ry P
art
icle
s
Rela
tive t
o Q
uie
t B
reath
ing
Wilson 2021, medRxiv, doi: 10.1101/2021.02.07.21251309
Impact of High Flow O2 on Respiratory Emissions
1 2 8
35
58
164
228
371
0
50
100
150
200
250
300
350
400
QuietBreathing
High Flow60L/min
NIPPV 25/10 Talking Exercising Shouting Forcedexpiration
Coughing
Fo
ld In
cre
ase in
Resp
irato
ry P
art
icle
s
Rela
tive t
o Q
uie
t B
reath
ing
Wilson 2021, medRxiv, doi: 10.1101/2021.02.07.21251309
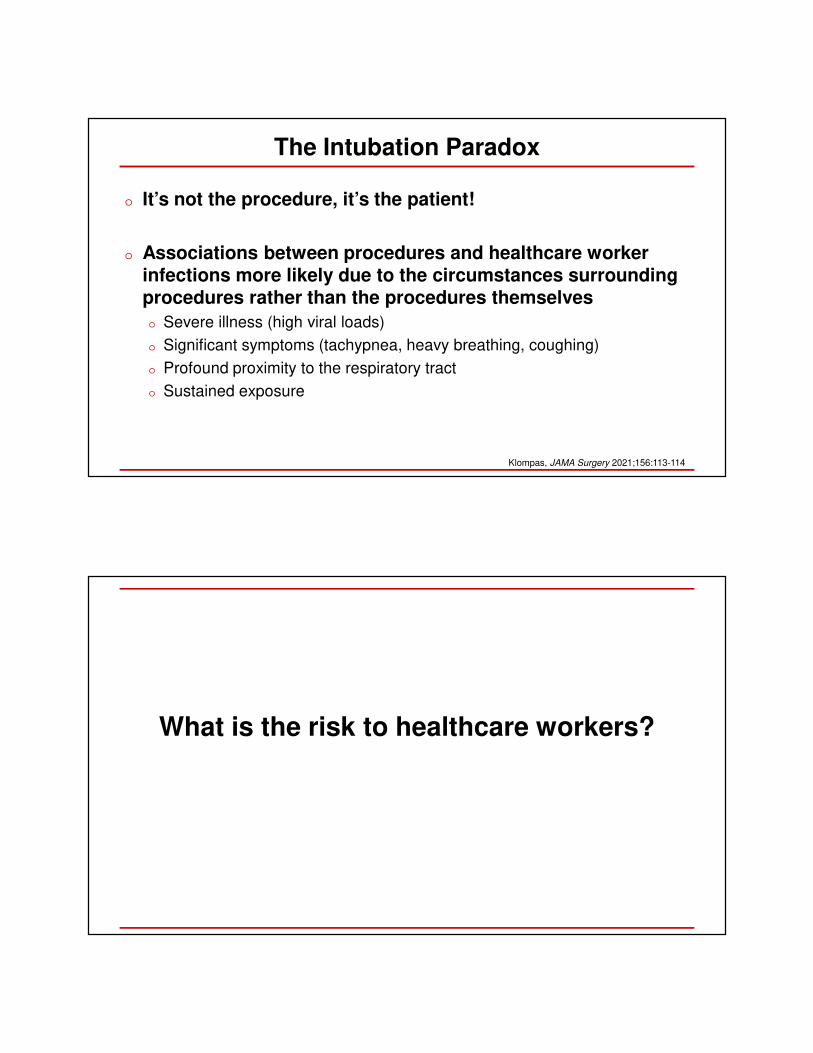
The Intubation Paradox
o It’s not the procedure, it’s the patient!
o Associations between procedures and healthcare worker infections more likely due to the circumstances surrounding procedures rather than the procedures themselves
o Severe illness (high viral loads)
o Significant symptoms (tachypnea, heavy breathing, coughing)
o Profound proximity to the respiratory tract
o Sustained exposure
Klompas, JAMA Surgery 2021;156:113-114
What is the risk to healthcare workers?
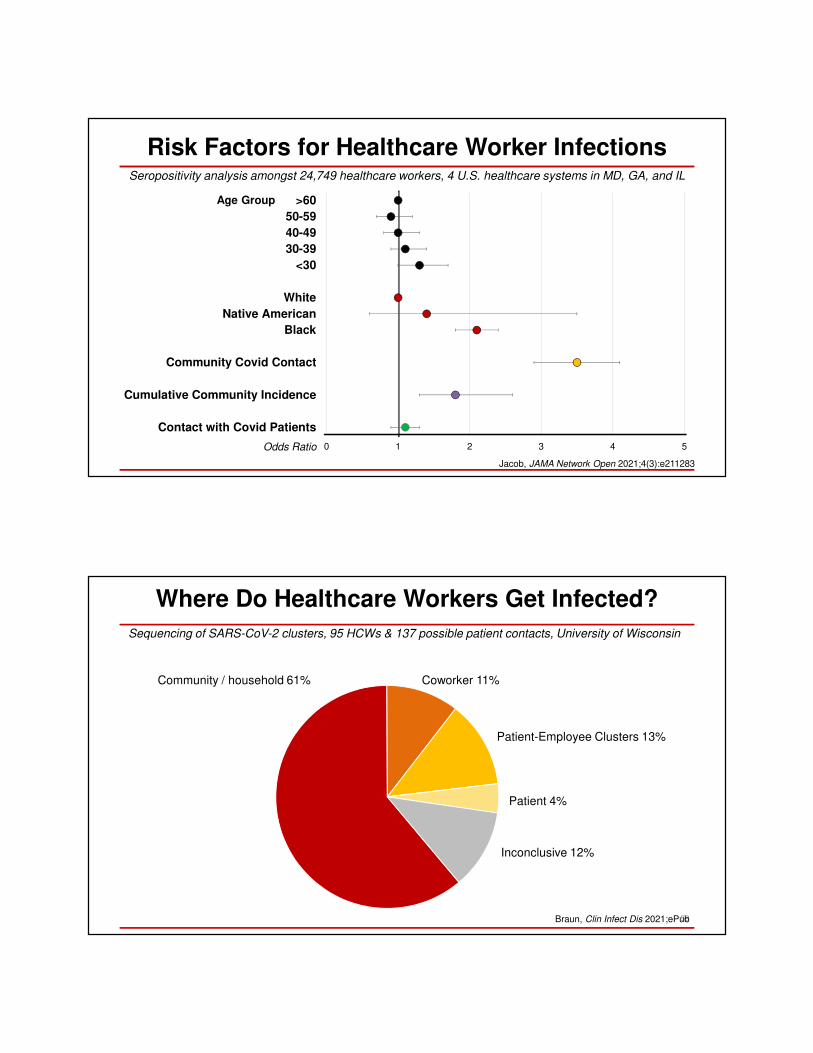
Risk Factors for Healthcare Worker Infections
0 1 2 3 4 5
>60
50-59
40-49
30-39
<30
White
Native American
Black
Community Covid Contact
Cumulative Community Incidence
Contact with Covid Patients
Age Group
Jacob, JAMA Network Open 2021;4(3):e211283
Seropositivity analysis amongst 24,749 healthcare workers, 4 U.S. healthcare systems in MD, GA, and IL
Odds Ratio
59
Where Do Healthcare Workers Get Infected?
Sequencing of SARS-CoV-2 clusters, 95 HCWs & 137 possible patient contacts, University of Wisconsin
Braun, Clin Infect Dis 2021;ePub
Community / household 61% Coworker 11%
Patient-Employee Clusters 13%
Patient 4%
Inconclusive 12%
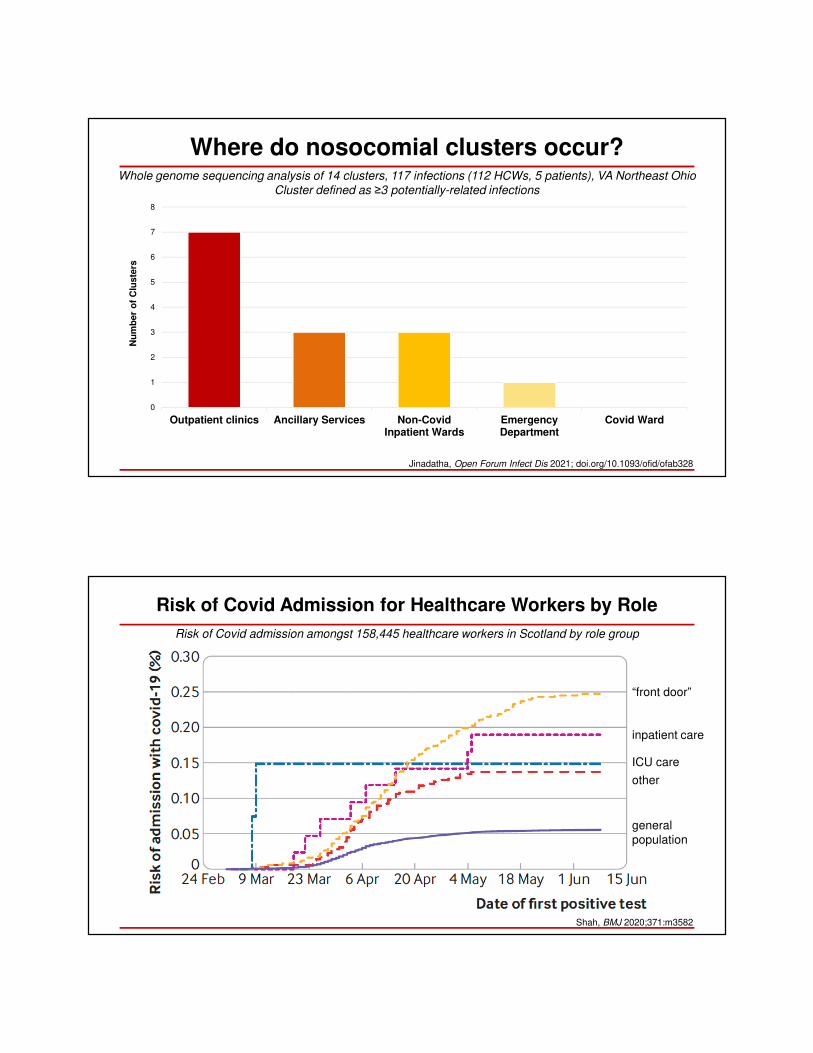
Where do nosocomial clusters occur?
Outpatient clinics Ancillary Services Non-CovidInpatient Wards
EmergencyDepartment
Covid Ward
0
1
2
3
4
5
6
7
8
Nu
mb
er
of
Clu
ste
rs
Whole genome sequencing analysis of 14 clusters, 117 infections (112 HCWs, 5 patients), VA Northeast Ohio
Cluster defined as ≥3 potentially-related infections
Jinadatha, Open Forum Infect Dis 2021; doi.org/10.1093/ofid/ofab328
Risk of Covid Admission for Healthcare Workers by Role
Risk of Covid admission amongst 158,445 healthcare workers in Scotland by role group
“front door”
inpatient care
ICU care
other
general
population
Shah, BMJ 2020;371:m3582
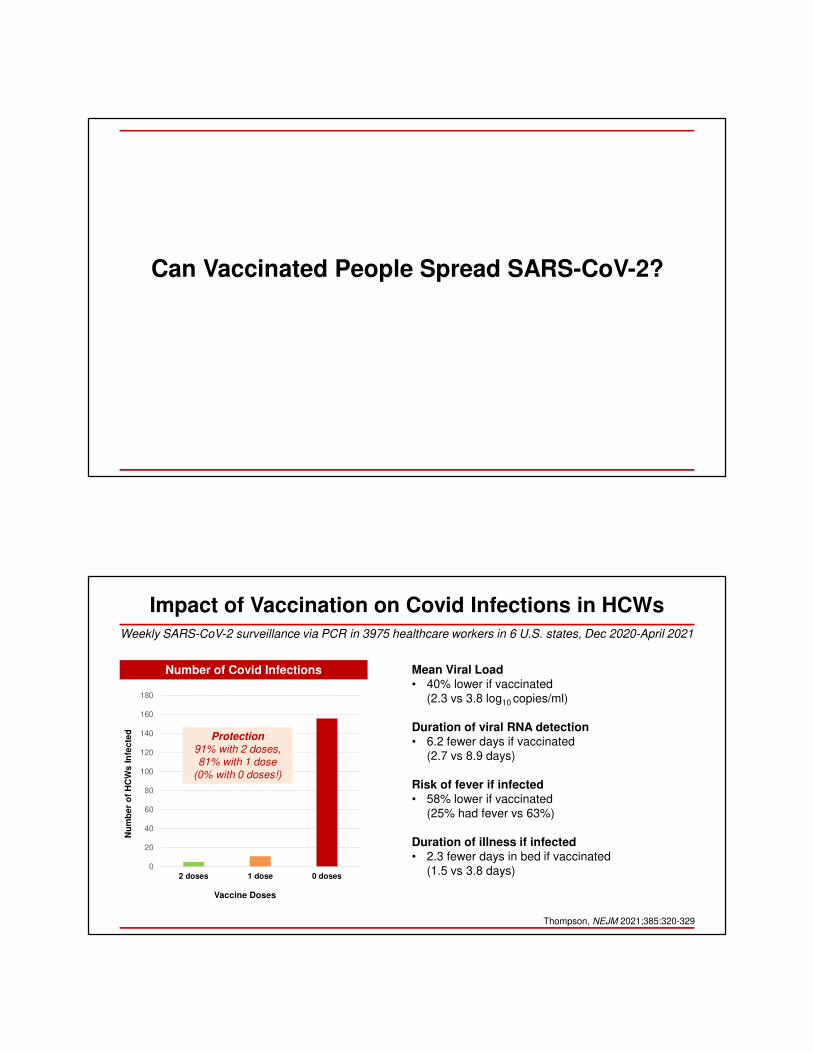
Can Vaccinated People Spread SARS-CoV-2?
Impact of Vaccination on Covid Infections in HCWs
0
20
40
60
80
100
120
140
160
180
2 doses 1 dose 0 doses
Nu
mb
er
of
HC
Ws
In
fec
ted
Vaccine Doses
Mean Viral Load• 40% lower if vaccinated
(2.3 vs 3.8 log10 copies/ml)
Duration of viral RNA detection• 6.2 fewer days if vaccinated
(2.7 vs 8.9 days)
Risk of fever if infected• 58% lower if vaccinated
(25% had fever vs 63%)
Duration of illness if infected• 2.3 fewer days in bed if vaccinated
(1.5 vs 3.8 days)
Number of Covid Infections
Weekly SARS-CoV-2 surveillance via PCR in 3975 healthcare workers in 6 U.S. states, Dec 2020-April 2021
Protection91% with 2 doses, 81% with 1 dose
(0% with 0 doses!)
Thompson, NEJM 2021;385:320-329
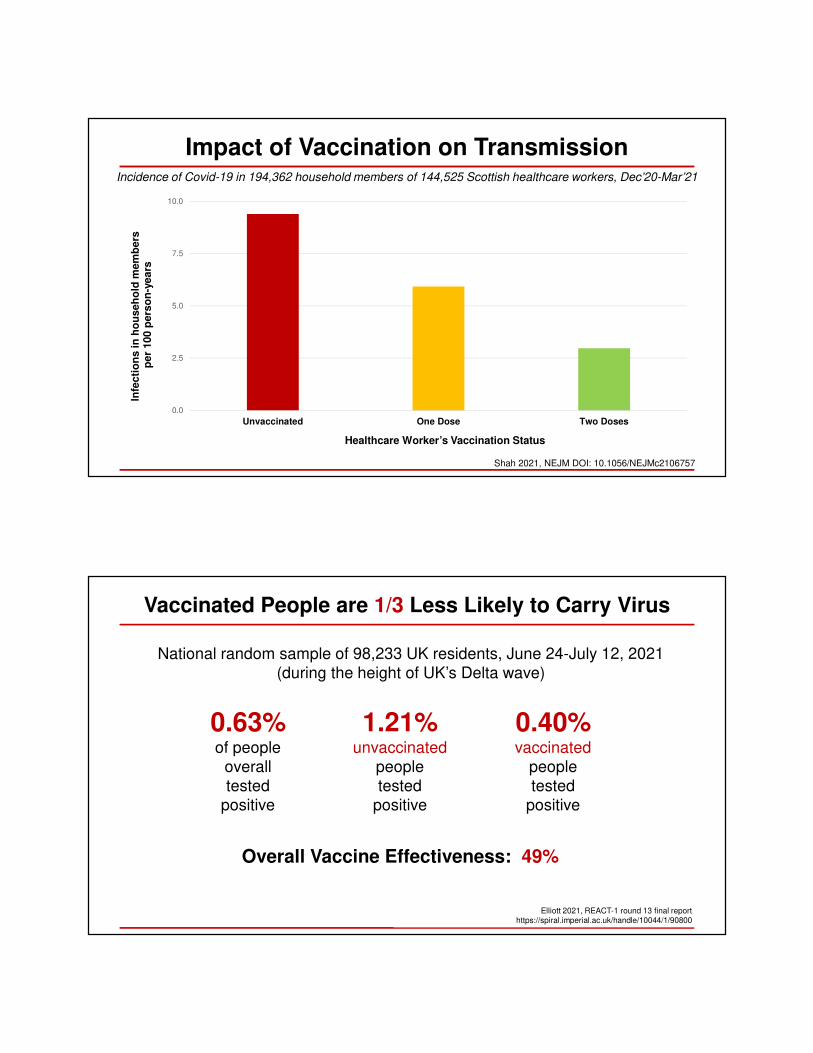
Impact of Vaccination on Transmission
0.0
2.5
5.0
7.5
10.0
Unvaccinated One Dose Two Doses
Infe
cti
on
s in
ho
useh
old
mem
bers
per
100 p
ers
on
-years
Healthcare Worker’s Vaccination Status
Incidence of Covid-19 in 194,362 household members of 144,525 Scottish healthcare workers, Dec’20-Mar’21
Shah 2021, NEJM DOI: 10.1056/NEJMc2106757
Vaccinated People are 1/3 Less Likely to Carry Virus
National random sample of 98,233 UK residents, June 24-July 12, 2021
(during the height of UK’s Delta wave)
0.63% of people
overall
tested
positive
1.21%unvaccinated
people
tested
positive
0.40%vaccinated
people
tested
positive
Elliott 2021, REACT-1 round 13 final report
https://spiral.imperial.ac.uk/handle/10044/1/90800
Overall Vaccine Effectiveness: 49%
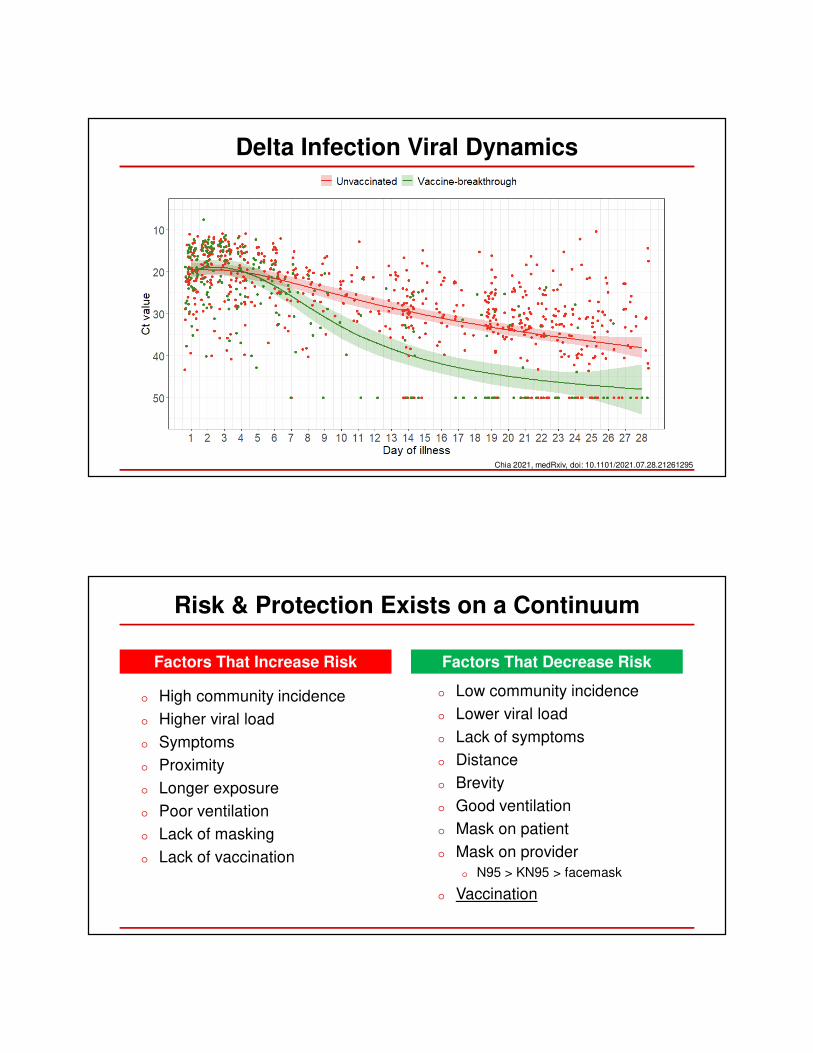
Delta Infection Viral Dynamics
Chia 2021, medRxiv, doi: 10.1101/2021.07.28.21261295
Risk & Protection Exists on a Continuum
o Low community incidence
o Lower viral load
o Lack of symptoms
o Distance
o Brevity
o Good ventilation
o Mask on patient
o Mask on provider
o N95 > KN95 > facemask
o Vaccination
Factors That Increase Risk
o High community incidence
o Higher viral load
o Symptoms
o Proximity
o Longer exposure
o Poor ventilation
o Lack of masking
o Lack of vaccination
Factors That Decrease Risk
Summary
o SARS-CoV-2 transmitted by respiratory particles in a range of sizes including
aerosols
o Risk of infection is associated with the amount of viral exposure
o Determined by source patient’s viral load, symptoms, proximity, duration of exposure,
masking, ventilation, and vaccination status
o Masks decrease exposure but do not eliminate it
o Covid patients sick enough to be hospitalized may be less contagious than
those with acute infection with or without symptoms. Should we be doing more
to protect healthcare workers and patients in non-Covid units?
o Most “aerosol generating procedures” do not generate aerosols
o Vaccines prevent transmission. Vaccinated people less likely to carry virus &
clear it more quickly.
o Stay humble.
Thank You!


![Infection control disease transmission([1]](https://img.dokumen.tips/doc/110x75/54838305b4af9fd8678b46d0/infection-control-disease-transmission1.jpg)