Embed Size (px)
Citation preview
See discussions, stats, and author profiles for this publication at: https://www.researchgate.net/publication/341980921
COVID-19 Prediction and Detection Using Deep Learning
Article · May 2020
CITATIONS
3READS
10,442
6 authors, including:
Some of the authors of this publication are also working on these related projects:
Towards an understanding of the impact of advertising on data leaks View project
Information Security Governance View project
Moutaz Alazab
Al-Balqa Applied University
17 PUBLICATIONS 172 CITATIONS
SEE PROFILE
Abdelwadood Mesleh
Al-Balqa Applied University
38 PUBLICATIONS 570 CITATIONS
SEE PROFILE
Vansh Jatana
SRM Institute of Science and Technology
14 PUBLICATIONS 8 CITATIONS
SEE PROFILE
Salah Alhyari
JEPCO
18 PUBLICATIONS 64 CITATIONS
SEE PROFILE
All content following this page was uploaded by Moutaz Alazab on 12 June 2020.
The user has requested enhancement of the downloaded file.

International Journal of Computer Information Systems and Industrial Management Applications.
ISSN 2150-7988 Volume 12 (2020) pp. 168-181
© MIR Labs, www.mirlabs.net/ijcisim/index.html
MIR Labs, USA
Received: 27 April 2020; Accepted: 28 May, 2020; Published: 29 May, 2020
COVID-19 Prediction and Detection Using Deep
Learning
Moutaz Alazab1, Albara Awajan1, Abdelwadood Mesleh1, Ajith Abraham2, Vansh Jatana3, Salah Alhyari4,
1 Faculty of Artificial Intelligence, Al-Balqa Applied University, Al-Salt, Jordan, Amman, Jordan
(m.alazab, a.awajan, wadood)@bau.edu.jo
2 Machine Intelligence Research (MIR) Labs
Auburn, WA, US
3 School of IT, SRM University
Kattankulathur, India,
4 IT Department, JEPCO
Amman, Jordan
Abstract: Currently, the detection of coronavirus disease 2019
(COVID-19) is one of the main challenges in the world, given the
rapid spread of the disease. Recent statistics indicate that the
number of people diagnosed with COVID-19 is increasing
exponentially, with more than 1.6 million confirmed cases; the
disease is spreading to many countries across the world. In this
study, we analyse the incidence of COVID-19 distribution across
the world. We present an artificial-intelligence technique based
on a deep convolutional neural network (CNN) to detect COVID-
19 patients using real-world datasets. Our system examines chest
X-ray images to identify such patients. Our findings indicate that
such an analysis is valuable in COVID-19 diagnosis as X-rays are
conveniently available quickly and at low costs. Empirical
findings obtained from 1000 X-ray images of real patients
confirmed that our proposed system is useful in detecting
COVID-19 and achieves an F-measure range of 95–99%.
Additionally, three forecasting methods—the prophet algorithm
(PA), autoregressive integrated moving average (ARIMA) model,
and long short-term memory neural network (LSTM)—were
adopted to predict the numbers of COVID-19 confirmations,
recoveries, and deaths over the next 7 days. The prediction
results exhibit promising performance and offer an average
accuracy of 94.80% and 88.43% in Australia and Jordan,
respectively. Our proposed system can significantly help identify
the most infected cities, and it has revealed that coastal areas are
heavily impacted by the COVID-19 spread as the number of
cases is significantly higher in those areas than in non-coastal
areas.
Keywords: Artificial Intelligence, X-ray, Convolutional Neural
Network, Machine Learning, COVID-19.
I. Introduction
The coronavirus disease (COVID-19) is a global pandemic
that was discovered by a Chinese physician in Wuhan, the
capital city of Hubei province in mainland China, in
December 2019 [1]. Currently, there is no approved human
vaccine for combating it. COVID-19 propagation is faster
when people are in close proximity. Thus, travel restrictions
control the spread of the disease, and frequent hand washing
is always recommended to prevent potential viral infections.
Meanwhile, fever and cough are the most common infection
symptoms. Other symptoms may occur, including chest
discomfort, sputum development, and a sore throat. COVID-
19 may progress to viral pneumonia which has a 5.8%
mortality risk. The death rate of COVID-19 is equivalent to 5%
of the death rate of the 1918 Spanish flu pandemic.
The total number of people infected with COVID-19
worldwide is 5,790,103 as of May 27, 2020 whereas the
numbers of reported deaths and recoveries are 357,432 and
2,497,618 respectively. Most of the cases were recorded in the
USA, Spain, Italy, France, Germany, mainland China, UK,
and Iran [2]. Saudi Arabia, with 78,541 cases, has the highest
number of reported cases among all the Arab countries.
Meanwhile, the number of reported cases in Jordan is 720,
whereas the numbers of deaths and recoveries are 9 and 586
respectively. The number of reported cases in Australia is
7150, whereas the numbers of deaths and recoveries are 103
and 6579, respectively. Since February 2020, information
technology services, such as mobile apps, have been used to
curb the potential risk of infection in mainland China. The
mobile apps suggest users to self-quarantine and alert the
concerned health authorities when someone infected by the
virus. They also monitor infected people, and the last persons
that they had contact with [3].
Since it was first reported, the disease has spread
exponentially across the world and has become an
international concern. A research conducted by Jiang et al. [4]
revealed that the death rate of COVID-19 is 4.5% across the
world. The death rate of patients in the age range of 70–79
years is 8.0%, whereas that of patients above 80 years is
COVID-19 Prediction and Detection Using Deep Learning 169
14.8%. The authors also confirmed that patients above the age
of 50 years with chronic illnesses are at the highest risk and
should therefore take special precautions. One of the main
threats of COVID-19 is its rapid propagation, with an
estimated 1.5–3.5 people getting infected by the disease upon
contact with an infected person [5]. This implies that if 10
people are COVID-19 positive, they are more likely to infect
15–35 other people. Therefore, COVID-19 can infect a very
large number of people in a few days unless intervention
measures are implemented.
The standard diagnostic technique is the reverse
transcription-polymerase chain reaction (RT-PCR) method
[1], a laboratory procedure that interacts with other
ribonucleic (RNA) and deoxyribonucleic acids (DNA) to
determine the volume of specific ribonucleic acids using
fluorescence. RT-PCR tests are performed on clinical research
samples of nasal secretions. The samples are collected by
inserting a swab into the nostril and gently moving it into the
nasopharynx to collect secretions. Although RT-PCR can
identify the severe acute respiratory syndrome coronavirus 2
(SARS-CoV-2) strain that causes COVID-19, in some cases,
it produced negative test results even though the patients
showed progression on follow-up chest computed tomography
(CT) scans [6]. In fact, several studies [6-9] have recommend
the use of CT scans and X-rays rather than RT-PCR owing to
its limited availability in some countries.
The detection of COVID-19 symptoms in the lower parts of
the lungs has a higher accuracy when using CT scans or X-
rays than that when using RT-PCR [7]. In certain cases, CT
scans and X-ray tests can be substituted with RT-PCR tests.
However, they cannot exclusively address the problem owing
to the relatively limited number of radiologists, compared to
new residents, and the high volume of re-examinations of
infected people who wish to know the progression of their
illness. To overcome the challenges of CT scans and X-rays
and to assist radiologists, we need to improve the speed of the
procedure. This can be achieved by designing advanced
diagnostic systems that utilise artificial intelligence (AI) tools.
The aim is to reduce the time and effort required to perform
CT scans and X-rays of COVID-19-positive patients and
evaluate the rate of disease development [7-9].
Radiological imaging is considered an important screening
method for COVID-19 diagnosis [10]. Ai et al. [6]
demonstrated the consistency of the radiological history of
COVID-19-related pneumonia with the clinical nature of the
disease. When examined by CT scans, almost all COVID-19
patients have exhibited similar features including ground-
glass opacities in the early stages and pulmonary
consolidation in the latter stages. In fact, the morphology and
peripheral lung distribution can be rounded [6]. AI can be used
to initially evaluate a COVID-19 patient as an alternative
solution to traditional approaches that are time-consuming and
labour-intensive. In this paper, we advocate the use of AI to
forecast COVID-19 cases and diagnose COVID-19 patients
via chest X-ray images.
A. Contributions of This Study
The following are the core contributions of this study:
We propose an automated intelligent system for
distinguishing COVID-19 patients from non-patients on the
basis of chest X-ray images. Our system instantly reads the
structure of a chest X-ray image, leverages hidden patterns to
identify COVID-19 patients, and reduces the need for manual
pre-processing steps.
Empirical findings obtained from 1000 chest X-ray images
of patients confirmed that our proposed system can detect
COVID-19 patients with an accuracy of 95–99%.
We provide an intelligent prediction system for predicting
the number of patients confirmed to have contracted the
disease, recovered from the disease, and died from the disease
over the next 7 days using three forecasting methods. Our
proposed system has been trained and tested on datasets
generated from real-world cases and has predicted the
numbers of COVID-19 confirmations, recoveries, and deaths
in Australia and Jordan with an average accuracy of 94.80%
and 88.43%, respectively.
We highlight the most affected areas and show that coastal
areas are heavily impacted by COVID-19 infection and spread
as the number of cases in those areas is significantly higher
than that in other non-coastal areas.
The rest of this paper is organised as follows. Section 2
presents the related works on recent COVID-19 detection and
prediction methods for chest X-ray images. Section 3 presents
the detailed system design, dataset description, and
performance-evaluation metrics. Sections 4 and 5 present the
results and discussions, respectively. Section 6 concludes the
paper and provides an outlook to future research.
II. Related Works
The analysis and detection of COVID-19 have been
extensively investigated in the last few months. The first part
of this section addresses issues related to COVID-19 detection
based on deep-learning approaches using CT scans and chest
X-ray images. The second part reviews the related literatures
to assess future estimates of the number of COVID-19
confirmations, recoveries, and deaths.
COVID-19 has now become a global pandemic owing to its
rapid spread. It is very challenging to detect exposed persons
because they do not show disease symptoms immediately.
Thus, it is necessary to find a method of estimating the number
of potentially infected persons on a regular basis to adopt the
appropriate measures. AI can be used to examine a person for
COVID-19 as an alternative to traditional time-consuming
and expensive methods. Although there are several studies on
COVID-19, this study focused on the use of AI in forecasting
COVID-19 cases and diagnosing patients for COVID-19
infection through chest X-ray images.
Several research areas have implemented AI (e.g. disease
diagnoses in healthcare) [11-13]. One of the main advantages
of AI is that it can be implemented in a trained model to
classify unseen images. In this study, AI was implemented to
detect whether a patient is positive for COVID-19 using their
chest X-ray image.
AI can also be used for forecasting (e.g., how the population
will increase over the next 5 years) through existing evidence.
Thus, predicting possibilities in the immediate future can help
authorities to adopt the necessary measures [14]. Wynants et
al. [15] focused on two main concepts. The first concept
involved studies related to the diagnosis of COVID-19, and
the second involved studies related to the prediction of the
number of people who will be infected in the coming days.
The study analysis maintained that most of the existing
models are poor and biased. The authors suggested that
research-based COVID-19 data should be publicly available
to encourage the adoption of more specifically designed
detection and prediction models.

Alazab et al. 170
COVID-19 Diagnosis Using Deep Learning
The use of machine learning (ML) has been rapidly increasing
in various fields including malware detection [16-19], mobile
malware detection [20-24], medicine [25-27] and information
retrieval [27-31]. In 2012, a modern ML system called deep
learning was introduced, which is based on a convolutional
neural network (CNN). It won the ImageNet classification
competition, the world’s best-known computer-vision
competition [32]. Deep-learning algorithms enable
computational models composed of multiple processing layers
to learn data representation through several abstraction layers.
They train a computer model to perform classification tasks
directly from pictures, texts, or sounds. According to LeCun
et al. [33], deep-learning models feature high accuracies and
can improve human output in certain instances.
X-Ray Diagnosis Using Deep Learning
X-ray machines use light or radio waves as radiation to
examine the affected parts of the body because of cancers,
lung diseases, bone dislocations, and injuries. Meanwhile, CT
scans are used as sophisticated X-ray machines to examine the
soft structures of active body parts for better views of the
actual soft tissues and organs [34]. The advantages of using
X-rays over CT scans are that X-rays are quicker, safer,
simpler, and less harmful than CT scans [7, 34].
Narin et al. [7] proposed a CNN-based model to detect
COVID-19 patients using 100 chest X-ray images, half of
which belong to COVID-19 patients and the other half belong
to healthy people. They evaluated three CNN models—
ResNet-50, Inception-v3, and Inception-ResNet-v2—using
five-fold cross-validation and reported that ResNet-50 had the
best detection accuracy (98%).
In a similar study conducted by Sethy and Behera [35], the
authors extracted features from chest X-ray images using a
deep-learning algorithm and classified the images as either
infected or healthy using a support vector machine (SVM).
The authors employed 11 deep-learning models: AlexNet,
VGG16, VGG19, GoogLeNet, ResNet-18, ResNet-50,
ResNet-101, Inception-v3, Inception-ResNet-v2, DenseNet-
201, and XceptionNet. They collected two datasets—the first
containing chest X-ray images of 25 infected patients and 25
non-infected patients and the other containing chest X-ray
images of 133 infected patients (e.g. MERS, SARS, and
ARDS patients) and 133 non-infected patients. They
performed separate feature extractions on each dataset using
various models and achieved a 95.38% accuracy with ResNet-
50 and SVM.
Furthermore, Hemdan et al. [36] proposed a framework,
called COVIDX-Net, that can assist radiologists in diagnosing
COVID-19 patients using X-ray. They evaluated their
framework using a dataset of 50 X-ray images divided into
two classes: 25 COVID-19-positive images and 25 COVID-
19-negative images. The images used were resized to
224×224 pixels. The COVIDX-Net framework employs seven
deep learning models: MobileNet, ResNet-v2, Inception-
ResNet-v2, Xception, Inception-v3, DenseNet, and modified
VGG19. Their evaluation results indicate that the VGG19 and
DenseNet models delivered comparable performances with an
F-score of 91% for COVID-19 cases.
In addition, Hassanien et al. [37] proposed a classification
system that uses multi-level thresholding and an SVM to
detect COVID-19 in lung X-ray images. Their system was
tested on 40 contrast-enhanced lung X-ray images (15 healthy
and 25 COVID-19-infected regions) with a resolution of
512×512 pixels. Their classification system achieved a
sensitivity of 95.76%, a specificity of 99.7% and an accuracy
of 97.48%.
1) CT Scan Diagnosis Using Deep Learning
The CT scan was developed by Godfrey Hounsfield and Allan
Cormack in 1972. It utilises an advanced X-ray technology to
carefully diagnose delicate internal organs [34]. CT scanning
is quick, painless, non-invasive, and precise and can produce
three-dimensional (3D) images [34]. CT scans of internal
organs, muscles, soft tissues, and blood vessels offer greater
clarity than standard X-rays, especially for soft tissues and
blood vessels. The main disadvantage of the CT scan is that it
is expensive, compared to X-rays [34].
The sensitivity and specificity of RT-PCR for COVID-19
detection have been criticised in several studies [4, 38, 39].
Although RT-PCR is the standard method for this purpose, it
generates a relatively large number of false negatives owing
to several reasons, including methodological drawbacks,
disease stages, and methods of obtaining the specimens, which
delay disease diagnosis and control. Therefore, RT-PCR tests
are not sufficient for assessing the disease status. Recent
results have revealed that nucleic acid testing is not reliable
and can only achieve an accuracy of 30–50% [38].
Jiang et al. [4] compared RT-PCR to CT scans and
examined 51 patients (29 men and 22 women) with a history
of travel to or residency in endemic areas and with severe
respiratory and fever symptoms due to unknown causes. The
authors obtained a sensitivity of 98% in a non-contrast chest
CT scan for the detection of COVID-19, compared to the
initial RT-PCR sensitivity of 71%. Owing to the shortage of
RT-PCR kits and the growing number of COVID-19 cases, it
is important to introduce an automated detection system as an
alternative diagnostic method to prevent the spread of
COVID-19 [7].
Meanwhile, Gozes et al. [40] employed a deep-learning
approach to automatically identify COVID-19 patients and
examine the disease burden quantification on CT scans using
a dataset of CT scans from 157 foreign patients from China
and the USA. Their proposed system analyses the CT scan at
two distinct levels: subsystems A and B. Subsystem A
performs a 3D analysis, and subsystem B performs a 2D
analysis of each segment of the scan to identify and locate
broader diffuse opacities, including ground-glass infiltrates
(which have been clinically identified as representative of
COVID-19). To evaluate their system, the authors applied
Resnet-50-2 to subsystem B and obtained an area under the
curve of 99.6%. The sensitivity and specificity were 98.2%
and 92.2%, respectively.
Moreover, Wang et al. [38] developed a deep-learning
approach for extracting information from CT scans. Their
study included a collection of 453 CT scans from 99 patients.
They extracted 195 regions of interest (ROIs) of sizes ranging
from 395×223 to 636×533 pixels from the CT scans of 44
COVID-19-positive pneumonia patients and 258 ROIs from
those of 50 COVID-19-negative patients. They applied a
modified network inception model and obtained an accuracy
of 82.9% for the internal validation with a specificity of 80.5%
and a sensitivity of 84%. The external testing dataset exhibited
a total accuracy of 73.1% with a specificity of 67% and a
sensitivity of 74%.
Fu et al. [41] proposed a classification system based on
ResNet-50 to detect COVID-19 and some other infectious
lung diseases (bacterial pneumonia and pulmonary

COVID-19 Prediction and Detection Using Deep Learning 171
tuberculosis). The authors collected a dataset of 60,427 CT
scans from 918 patients; 14,944 of these CT scans were from
150 COVID-19 patients and 15,133 from 154 non-COVID-19
viral pneumonia patients. They performed several tests for
several lung diseases. The achieved accuracy, sensitivity, and
specificity were 98.8%, 98.2%, and 98.9%, respectively.
Xu et al. [42] reported that real-time RT-PCR has a low
positive rate at the early stage of COVID-19. They developed
an early screening model that uses deep-learning techniques
for distinguishing COVID-19 pneumonia from influenza (a
viral pneumonia) and stable cases using pulmonary CT images.
A dataset of 618 CT samples was obtained for the analysis,
and the images were classified as COVID-19, influenza (a
viral pneumonia), and other cases using ResNet-18 and
ResNet-based methods. The authors employed a noisy or
Bayesian function to differentiate the infected images and
obtained a detection accuracy of 86.7%.
2) COVID-19 Infection Prediction Using Machine
Learning Techniques
ML is the science of training machines using mathematical
models to learn and analyse data. Once ML is implemented in
a system, the data are analysed, and interesting patterns are
detected. The validation data are then categorised according
to the patterns learned during the learning process. As
COVID-19 infection has rapidly spread worldwide and
international action is required, it is important to develop a
strategy to estimate the number of potentially infected people
on a regular basis to adopt the appropriate measures. Currently,
decision-makers rely on certain decision-making statistics
such as imposing lockdowns on infected cities or countries.
Therefore, ML can be used to predict the behaviours of new
cases to stop the disease from spreading.
Li et al. [43] developed a prediction model using ML
algorithms to combat COVID-19 in mainland China and in
other infected countries in the world. The authors developed a
model to estimate the number of reported cases and deaths in
mainland China and in the world. The data used to build the
models were collected between 20 January 2020 and 1 March
2020. They estimated that the peak of the COVID-19 outbreak
in mainland China occurred on 22 February 2020 and on 10
April 2020 worldwide. The authors also stated that COVID-
19 would be controlled at the beginning of April 2020 in
mainland China and in mid-June 2020 across the world. They
concluded that the estimated number of COVID-19 cases
would be approximately 89,000 in China and 403,000
worldwide during the outbreak. As of 17 April 2020, the
estimated number of deaths was 4000 in mainland China and
18,300 worldwide. It is clear that their forecast was similar to
the actual situation in China as the total numbers of infected
cases and deaths had exceeded 82,367 and 3342, respectively.
However, the number of confirmed cases worldwide exceeded
their estimations as the numbers of infected cases and deaths
exceeded 2 million and reached 145,416 as of 17 April 2020,
respectively [2].
Kumar et al. [44] predicted the COVID-19 spread in the 15
most-infected countries in the world using the autoregressive
integrated moving average (ARIMA) model. The outcome of
their prediction indicates that circumstances would worsen in
Iran and Europe, especially in Italy, Spain, and France.
Moreover, their prediction indicated that the number of cases
in South Korea and mainland China would become more
stable. The study also indicated that COVID-19 would spread
exponentially in the USA and that strict official measures
would be urgently required to stop the disease from spreading.
Although the prediction of COVID-19 cases for the USA was
1 million between 8 April and 30 April 2020, it reached
677,570 on 17 April 2020. Furthermore, Italy had 168,941
cases, although it was predicted to have 300,000 cases [2].
Huang et al. [45] applied a CNN to a limited dataset, which
was not specifically defined in their study, to evaluate and
estimate the number of reported cases in China. The authors
used the mean absolute and root mean square errors to
compare their model with other deep-learning models,
including multilayer perceptron, long short-term memory
(LSTM), and gated recurrent units. The authors concluded that
the obtained results promise a high predictive efficiency.
Pandey et al. [46] utilised two statistical algorithms—the
susceptible-exposed-infectious-recovered (SEIR) and
regression models—to evaluate and forecast the distribution
of COVID-19 in India. They used a dataset retrieved from the
John Hopkins University repository. The prediction results
from the SEIR and regression models showed that the number
of confirmed COVID-19 cases would reach 5300 and 6153
cases, respectively, by 13 April 2020. However, the confirmed
cases in India on that date were 10,453 and 6153 for the SEIR
and regression models, respectively [2].
III. System Design
Our proposed deep learning-based COVID-19 detection
comprises several phases, as illustrated in Figure 1. The
phases are summarised in the following five steps:
Step 1: Collect the chest X-ray images for the dataset from
COVID-19 patients and healthy persons.
Step 2: Generate 1000 chest X-ray images using data
augmentation.
Step 3: Represent the images in a feature space and apply deep
learning.
Step 4: Split the dataset into two sets: a training set and a
validation set.
Step 5: Evaluate the performance of the detector on the
validation dataset.
A. Dataset
Two types of datasets were used in the evaluation, the original
dataset (without augmentation) and the augmented dataset,
which are summarised in Tables 1 and 2, respectively. The
dataset contained the following: a) a healthy dataset
containing chest X-ray images of healthy persons and b) a
COVID-19 dataset containing chest X-ray images of COVID-
19 patients. The original dataset was obtained from the Kaggle
database, and its total number of images is 128, as presented
in Table 1 [47].
Figure 1. Architecture of the proposed system

Alazab et al. 172
Owing to the limited availability of chest X-ray images, we
generated our dataset using data augmentation [48]. Data
augmentation is an AI method for increasing the size and the
diversity of labelled training sets by generating different
iterations of the samples in a dataset. Data augmentation
methods are commonly used in ML to address class imbalance
problems, reduce overfitting in deep learning, and improve
convergence, which ultimately contributes to better results.
The total number of images in the dataset became 1000 after
applying augmentation, as presented in Table 2 [47].
Table 1 Original dataset (without augmentation)
X-ray images Number
Healthy 28
COVID-19 70
Total 128
Table 2 Augmented dataset
X-ray images Number
Healthy 500
COVID-19 500
Total 1000
B. Environment
A computer with Microsoft Windows 10 was used for the
experiment. It has the following specifications: Intel Core i7-
8565U 1.80-GHz processor, 16 GB of DDR4 RAM, and 1 TB
of hard disk. We installed the virtual machine tool VMware
Workstation Pro version 14.1.8 build-14921873 on it. Then,
we installed Ubuntu 18.04.4 (64 bit) on the virtual machine
and the following libraries and software:
ARIMA:
https://www.statsmodels.org/stable/generated/statsmodels.ts
a.arima_model.ARIMA.html
Fbprophet: https://pypi.org/project/fbprophet/
ImageDataGenerator: https://keras.io/preprocessing/image/
Keras: https://keras.io/
LSTM:
https://www.tensorflow.org/api_docs/python/tf/keras/layers/LS
TM
Matplotlib: https://matplotlib.org/
NumPy: https://numpy.org/
Pandas: https://pandas.pydata.org/
Python: https://www.python.org/
Scikit: https://scikit-learn.org/
SciPy: https://www.scipy.org/
TensorFlow: https://www.tensorflow.org/
All the results and predictions made in this study have been
uploaded to the Kaggle database [49, 50]. We believe that by
making the system and solution publicly available, we draw
attention to the most affected areas, thereby preventing the
spread of the COVID-19 outbreak and fostering the use of
deep-learning techniques in COVID-19 research.
C. Evaluation Metrics
To assess the reliability of the proposed deep learning-based
COVID-19 detector, we adopted the same metrics as those
used by Alazab et al. [51-54] and considered the following
standard metrics: precision, recall, and F-measure. These
metrics are calculated on the basis of the true-positive (TP),
true-negative (TN), false-positive (FP), and false-negative
(FN) scores:
- TP is the proportion of positive COVID-19 chest X-
ray images that were correctly labelled as positive.
- FP is the proportion of negative (healthy) COVID-19
chest X-ray images that were mislabelled as positive.
- TN is the proportion of negative (healthy) chest X-
ray images that were correctly labelled as healthy.
- FN is the proportion of positive COVID-19 chest X-
ray images that were mislabelled as negative
(healthy).
Accuracy: This metric measures the percentage of
correctly identified cases relative to the entire dataset. The
ML algorithm performs better if the accuracy is higher.
Accuracy is a significant measure for a test dataset that
includes a balanced class. It is computed as follows:
Precision: This metric is a measure of exactness, which is
calculated as the percentage of positive predictions of
COVID-19 that were true positives divided by the number
of predicted positives. It is computed as follows:
𝑷𝒓𝒆𝒄𝒊𝒔𝒊𝒐𝒏 = 𝑇𝑃/(𝑇𝑃 + 𝐹𝑃) (2)
Recall: This metric is a measure of completeness, which is
calculated as the percentage of positives that were
correctly identified as true positives divided by the number
of actual positives. It is computed as follows:
𝑹𝒆𝒄𝒂𝒍𝒍 = 𝑇𝑃/(𝑇𝑃 + 𝐹𝑁) (3)
F-measure: This is a combination of precision and recall
that provides a significant measure for a test dataset that
includes an imbalanced class. It is computed as follows:
𝑭 − 𝑴𝒆𝒂𝒔𝒖𝒓𝒆 = 𝟐 (𝑃𝑟𝑒𝑐𝑖𝑠𝑖𝑜𝑛 𝑥 𝑅𝑒𝑐𝑎𝑙𝑙
(𝑃𝑟𝑒𝑐𝑖𝑠𝑖𝑜𝑛 + 𝑅𝑒𝑐𝑎𝑙𝑙))
(4)
Root Mean Square Error (RMSE): This metric
measures the differences between the actual (𝑥𝑖) and the
predicted ( ��𝑖 ) numbers of COVID-19 confirmations,
recoveries, and deaths (𝑁). The main advantage of RMSE
is that it penalises large prediction errors. RMSE was used
to compare the prediction errors of the three prediction
algorithms. It is defined as follows:
𝑹𝑴𝑺𝑬 = √1
𝑁∑(𝑥𝑖 − ��𝑖)
2
𝑁
𝑖=1
(5)
Correlation coefficient: This metric is often used to
evaluate the performance of a prediction algorithm. It is
defined as follows:
𝑪𝑪 = (1 −1
𝑁∑|𝑥𝑖 − ��𝑖|
𝑁
𝑖=1
) ∗ 100% (6)
(6)
IV. Experimental Results
Firstly, we examined the most infected areas across the world.
In Section 4.1, we show that coastal areas are heavily affected
by the COVID-19 outbreak as the number of cases in those
𝑨𝒄𝒄𝒖𝒓𝒂𝒄𝒚 = (𝑇𝑃+ 𝑇𝑁)/ (𝑇𝑃+ 𝑇𝑁 + 𝐹𝑃+ 𝐹𝑁)
(1)

COVID-19 Prediction and Detection Using Deep Learning 173
areas is significantly higher than those in other non-coastal
areas (Figures. 3–6).
Secondly, we predicted the number of COVID-19
confirmations, recoveries, and deaths in Jordan and Australia
over the next 7 days using three well-known time-series
forecasting algorithms: PA (prophet algorithm), ARIMA, and
LSTM. In Section 4.2, we show how the application of these
algorithms allowed us to estimate the forecasting outcomes for
certain countries with a detection rate of 99% (Tables 3 and 4)
and (Figures. 7 -13).
Thirdly, we examined whether chest X-ray images can be
used to develop sophisticated classification models for
COVID-19 prediction. In Section 4.3, we present the
application of a deep-learning algorithm on two datasets.
Empirical findings indicated that our proposed system is
reliable in detecting COVID-19 and has an F-measure range
of 95–99%, as revealed by Figures. 15 -16.
A. Coronavirus Statistics
SARS-CoV-2 is a new family of viruses that has never been
encountered before. The virus was first discovered in
pangolins before its spread to humans [55]. The typical
symptoms of COVID-19 include fever, dry cough, fatigue,
sputum production, shortness of breath, sore throat, headache,
chills, nausea or vomiting, nasal congestion, diarrhoea,
haemoptysis, and conjunctival discomfort, although some
patients also suffer from general tiredness, runny nose, and
loss of taste and/or scent. Figure 2 shows a bar graph of the
common COVID-19 symptoms sorted by their percentage of
occurrences [56].
Figure 2. Common COVID-19 symptoms
In this section, the connection between coastal and non-
coastal areas is further explored as a large proportion of
infected cases were recorded in coastal areas. On the basis of
the collected statistics, COVID-19 has a rapid spread in
coastal areas. The following examples support this conclusion:
In Australia, there were more than 7000 confirmed cases.
The highest number of confirmed cases were in New South
Wales, Victoria, Queensland, Western Australia, South
Australia, Tasmania, and Australian Capital Territory and
Northern Territory [57]. Figure 3 reveals the most affected
areas in Australia.
Figure 3. Areas with the highest number of confirmed cases
in Australia
In South Korea, the disease peaked on 20 January 2020, and
the number of confirmed cases exceeded 11,000. Figure 4
shows that the regions that were most severely affected by
COVID-19 were coastal or near-coastal areas.
Figure 4. Areas with the highest number of confirmed cases
in South Korea
In India, the number of reported confirmed cases was more
than 158,000, and the most-affected places were Maharashtra;
Tamil Nadu, Delhi, Gujrat, Rajasthan, Madhya Pradesh, Uttar
Pradesh etc. as shown in Figure 5 [58].
Figure 5. Areas with the highest number of confirmed cases
in India

Alazab et al. 174
In the USA, there were more than 1,745,843 confirmed
cases on 27 May 2020. The first case was found in Oregon,
which is located in the Pacific Coast. Coastal states, including
Washington, Oregon, California, Arizona, and Texas,
reported high numbers of confirmed cases. Furthermore,
states including Wisconsin and Illinois with long lake
coastlines also reported confirmed cases at the initial stage of
the COVID-19 spread. Other eastern coastal states including
New York, Maine, New Hampshire, Massachusetts, Rhode
Island, Connecticut, New Jersey, Delaware, Maryland,
Virginia, North Carolina, South Carolina, Georgia, Florida,
and Indiana also reported high numbers of confirmed cases, as
well as other coastal areas such as Colorado and Nebraska.
Thus, most of the states that reported the highest numbers of
cases are located in the coastal regions. Figure 6 highlights the
coastal regions with the highest number of cases in maroon.
Figure 6. Areas with the highest number of confirmed cases
in USA
B. Prediction
In our system, we predicted the number of COVID-19
confirmations, recoveries, and deaths in Jordan and Australia
using the following three well-known forecasting algorithms:
i) PA [59], ii) ARIMA [60], and iii) LSTM [61]. These
algorithms were trained to make predictions for the next 7
days from datasets that were collected from a statistics website
[2].
Originally proposed by Taylor and Letham, PA is one of
the well-known algorithms for solving multi-seasonal time-
series forecasting problems on Facebook [59]. It additively
decomposes a time series-based forecasting problem into
trends, seasonal, remainder, and holiday components. It
achieves time-series forecasting using the following relation:
𝑥𝑡 = ��𝑡1 + ��𝑡
2 + ⋯ + ��𝑡𝑛 + ��𝑡 + ��𝑡 + ��𝑡 (7)
where 𝑥𝑡 represents an observation at time 𝑡, 𝑛 denotes the
number of distinct seasonal patterns, ��𝑡𝑛 represents the
seasonal effect, ��𝑡 represents the effect of trend, ��𝑡 represents
the remainder component of the observation and ��𝑡 denotes
the holiday covariance, which represents the effect of holidays.
ARIMA is a simplified type of autoregressive moving
average model that incorporates autoregressive and moving-
average models to develop a composite forecasting model.
The autoregressive model utilises the dependency between the
observations and several lagged observations, whereas the
moving-average model uses the association between the
observations and the residual error values by using the moving
average for the lagged observations. ARIMA uses the order
factors p, d, and q, where p is the order of the autoregressive
model, d is the order of the differencing, and q is the order of
the moving average. The algorithm is computed as follows:
𝑦 = 𝑐 + 𝜖𝑡 + ∑ ∅𝑖
𝑝
𝑖=1
𝑦𝑡−𝑖
+ 𝑦 = 𝑐 + 𝜖𝑡 + ∑ 𝜃𝑖
𝑞
𝑖=1
𝜖𝑡−1
(8)
where 𝜖𝑡 is an independent and homogeneously distributed
error term, 𝑐 is a constant term, 𝑦 is an actual value at time 𝑡,
and ϕ and θ are the tuning parameters of the autoregressive
and moving-average models, respectively.
LSTM is a form of a recurrent neural network (RNN) that
memorises earlier patterns in data sequences. It was originally
proposed by Hochreiter and Schmidhuber [62]. It replaces the
hidden layer neurons of the RNN with a series of memory cells.
The key is the state of the memory cell that filters data using
a gate structure that updates the state of the memory cell. It
includes the input, forgotten, and output gates for its gate
structure. Each cell has three sigmoid layers and one tanh layer,
as shown in Figure 7 [61].
Figure 7. Structure of a memory cell in an LSTM
(i) The forgotten gate determines the cell state data that must
be discarded. Each memory cell of the LSTM combines the
previous output ℎ𝑡−1 at time 𝑡 − 1 and the external current
data 𝑥𝑡 in a vector [ℎ𝑡−1, 𝑥𝑡] through a special sigmoid
function 𝜎, shown as follows:
𝑓𝑡 = 𝜎(𝑊𝑓 . [ℎ𝑡−1, 𝑥𝑡] + 𝑏𝑓) (9)
where 𝑊𝑓 and 𝑏𝑓 are the weight and the bias, respectively, of
the forgotten gate. On the basis of its inputs, if the forgotten
gate outputs ‘1’, it indicates ‘reserve’, and if it outputs ‘0’, it
indicates ‘discard’ data in a cell.
(ii) The input gate determines the period necessary to preserve
the current data 𝑥𝑡 in a cell 𝐶𝑡. It finds the state of the cell 𝐶𝑡,
and the data value is updated by the sigmoid layer, shown as
follows:
𝑖𝑡 = 𝜎(𝑊𝑓 . [ℎ𝑡−1, 𝑥𝑡] + 𝑏𝑓) (10)
The input gate updates the data that need to be upgraded to
cell 𝐶𝑡. A new vector ��𝑡 is thus created by the tanh layer to
determine the amount of data that must be added, and it is
defined as follows:
��𝑡 = 𝑡𝑎𝑛ℎ(𝑊𝑐 . [ℎ𝑡−1, 𝑥𝑡] + 𝑏𝑐) (11)
Finally, the state of the memory cell is updated as follows:
𝐶𝑡 = 𝑓𝑡 ∗ 𝐶𝑡−1 + 𝑖𝑡 ∗ ��𝑡 (12)
COVID-19 Prediction and Detection Using Deep Learning 175
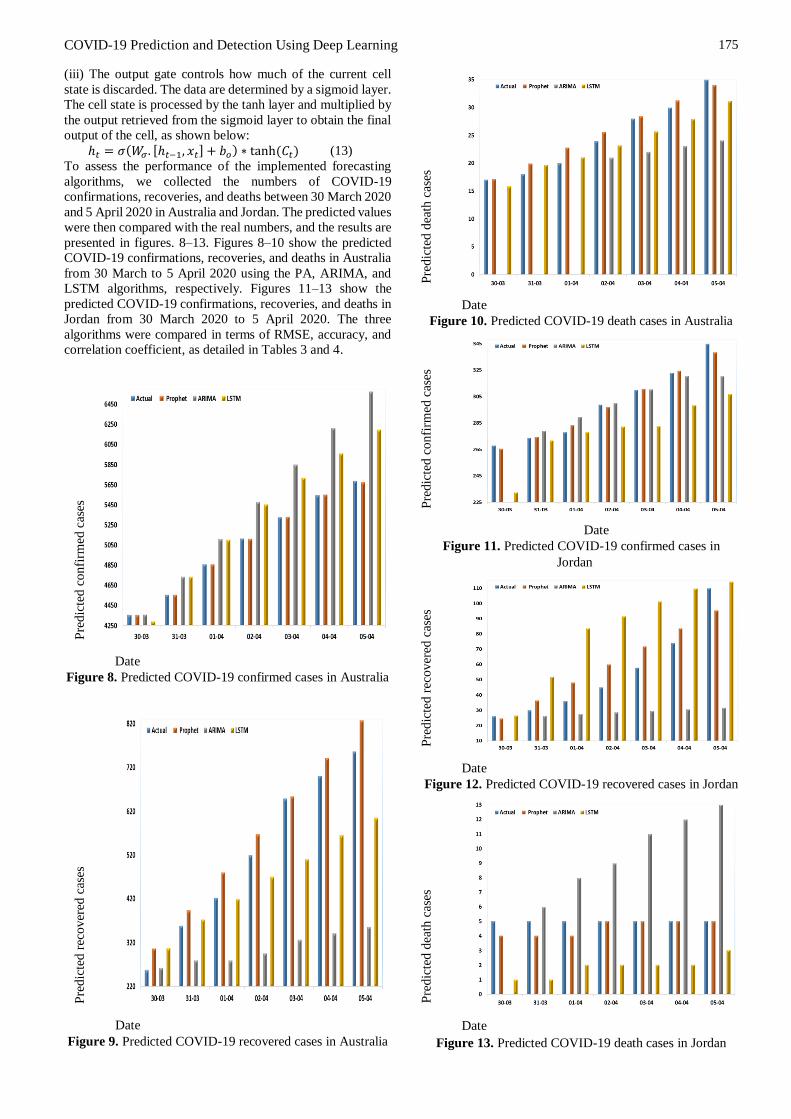
(iii) The output gate controls how much of the current cell
state is discarded. The data are determined by a sigmoid layer.
The cell state is processed by the tanh layer and multiplied by
the output retrieved from the sigmoid layer to obtain the final
output of the cell, as shown below:
ℎ𝑡 = 𝜎(𝑊𝜎 . [ℎ𝑡−1, 𝑥𝑡] + 𝑏𝑜) ∗ tanh (𝐶𝑡) (13)
To assess the performance of the implemented forecasting
algorithms, we collected the numbers of COVID-19
confirmations, recoveries, and deaths between 30 March 2020
and 5 April 2020 in Australia and Jordan. The predicted values
were then compared with the real numbers, and the results are
presented in figures. 8–13. Figures 8–10 show the predicted
COVID-19 confirmations, recoveries, and deaths in Australia
from 30 March to 5 April 2020 using the PA, ARIMA, and
LSTM algorithms, respectively. Figures 11–13 show the
predicted COVID-19 confirmations, recoveries, and deaths in
Jordan from 30 March 2020 to 5 April 2020. The three
algorithms were compared in terms of RMSE, accuracy, and
correlation coefficient, as detailed in Tables 3 and 4.
Pre
dic
ted c
onfi
rmed
cas
es
Date
Figure 8. Predicted COVID-19 confirmed cases in Australia
Pre
dic
ted r
ecover
ed c
ases
Date
Figure 9. Predicted COVID-19 recovered cases in Australia
Pre
dic
ted d
eath
cas
es
Date
Figure 10. Predicted COVID-19 death cases in Australia
Pre
dic
ted c
onfi
rmed
cas
es
Date
Figure 11. Predicted COVID-19 confirmed cases in
Jordan
Pre
dic
ted r
ecover
ed c
ases
Date
Figure 12. Predicted COVID-19 recovered cases in Jordan
Pre
dic
ted d
eath
cas
es
Date
Figure 13. Predicted COVID-19 death cases in Jordan

Alazab et al. 176
Table 3 details the performances of the three prediction
algorithms in Australia. We calculated the correlation
coefficient, accuracy, and RMSE for each algorithm. PA
delivered the best results, whereas ARIMA delivered the
worst results. Moreover, PA predicted the numbers of
COVID-19 confirmations, recoveries, and deaths and
obtained prediction accuracies of 99.94%, 90.29% and
94.18%, respectively.
Table 4 details the performances of the three prediction
algorithms in Jordan. We calculated the correlation coefficient,
accuracy, and RMSE for each algorithm. PA delivered the best
results, whereas LSTM delivered the worst results. Moreover,
PA predicted the numbers of COVID-19 confirmations,
recoveries, and deaths and obtained prediction accuracies of
99.08%, 79.39%, and 86.82%, respectively.
Table 3 Results of three prediction algorithms in Australia
Prediction
Algorithm
Correlation
Coefficient
Accuracy RMSE
PA confirmed cases
PA (recovered cases)
PA (death cases)
0.99 99.94% 03.94
0.99 90.29% 47.83
0.98 94.18% 01.55
ARIMA (confirmed
cases)
0.99 92.33% 497.55
ARIMA (recovered
cases)
0.98 63.52% 260.12
ARIMA (death
cases)
0.98 78.02% 07.26
LSTM (confirmed
cases)
0.99 94.16% 337.18
LSTM (recovered
cases)
0.99 86.44% 97.36
LSTM (death cases) 0.98 92.76% 02.07
Table 4 Results of the three prediction algorithms in Jordan
Prediction
Algorithm
Correlation
Coefficient
Accuracy RMSE
PA (confirmed
cases)
0.99 99.08% 03.51
PA (recovered
cases)
0.94 79.39% 11.42
PA (death cases) - 86.82% 00.78
ARIMA (confirmed
cases)
0.95 97.59% 11.30
ARIMA (recovered
cases)
0.93 57.79% 39.26
ARIMA (death
cases)
-- 12.87 % 05.59
LSTM (confirmed
cases)
0.85 93.23% 25.02
LSTM (recovered
cases)
0.94 37.33% 11.42
LSTM (death cases) -- 39.97% 03.04
C. Deep Learning
This study developed a CNN-based COVID-19 detection
model that was tested with both the original and the
augmented datasets. All the chest X-ray images used were
resized to 224×224 pixels while ignoring the aspect ratio.
Figures 14a and b present the chest X-ray images of healthy
and COVID-19-infected patients, respectively. The collected
dataset was randomly split into a training data subset and a
testing data subset.
(a) Healthy (b) Coronavirus Infected
Figure 14. Chest X-ray images
The COVID-19 detection model is based on VGG16, a type
of CNN, and it is designed to detect COVID-19 using chest
X-ray images. VGG16 is one of the highest-quality vision-
model architectures currently available. It generates evidence
in favour of stacking convolutional layers with tiny filters
(3×3) rather than using a single layer with larger filter sizes
(5×5 and 7×7) as stacked 3×3 filters will approximate bigger
ones [63].
The COVID-19 detector was trained and tested on the
collected dataset, 80% of which was used for training and the
remaining 20% was used for testing. The weights of the CNN
were randomly initialised, and the batch size was varied up to
25 and empirically set to 25 to avoid overfitting and to achieve
the highest training accuracy. Furthermore, the learning rate
was initially set to 0.1. Figure 15 details the accuracy of the
COVID-19 detector and its loss values for the implemented
detector with augmentation. Figure 16 details the accuracy of
the same detector with augmentation and its loss values.
Figure 15. Performance of CNN models in the original dataset
Figure 16. Performance of CNN models in the augmented
dataset

COVID-19 Prediction and Detection Using Deep Learning 177
Special attention must be paid to the avoidance of overfitting
in the un-augmented dataset, especially when increasing the
epochs as the validation slowly improves in the beginning and
then stops improving when the epochs are increased, as shown
in Figure 15. When the augmented dataset is used, the gap
between the training and validation becomes smaller after a
few epochs, as shown in Figure 16. Thus, a greater
improvement is achieved in the training process, and a more
generalised and robust COVID-19 detector is achieved using
the CNN models when implementing data augmentation on
the dataset. Figures 17 and 18 show the augmented chest X-
ray images of COVID-19 patients and healthy persons,
respectively.
Figure 17. Augmented chest X-ray images for COVID-19
patients
Figure 18. Augmented chest X-ray images for healthy people
The CNN-based COVID-19 detector trained on an un-
augmented dataset achieved a weighted average F-measure of
95%. The same COVID-19 detector achieved a weighted
average F-measure of 99% when trained on an augmented
dataset, as shown in Figure 19. Hence, the COVID-19 detector
exhibits superior performance metrics in terms of recall,
precision, and F-measure when trained on augmented data. It
is therefore sufficiently robust and helpful for rapidly
diagnosing a large number of suspected COVID-19 patients.
Figure 19. F-measure scores
V. Discussions
This study provided a forecasting analysis of COVID-19
confirmations, recoveries, and deaths in Australia and Jordan.
It further implemented a CNN-based COVID-19 detector to
identify COVID-19 infections using X-ray images. Based on
the study results, the following conclusions were drawn:
PA delivered the best performance for COVID-19
prediction over 7 days, compared to LSTM and ARIMA.
The predictions will enable people in both countries to
predict their medical needs for tackling the spread of COVID-
19.
ARIMA cannot make predictions over the next 1, 2, and 3
days.
After investigating the number of COVID-19 confirmations,
recoveries, and deaths in various countries, we found that
coastal areas are significantly impacted by the disease because
the numbers of cases in those areas are significantly higher
than those in other non-coastal areas. This observation is
medically consistent with the propagation capability of
viruses in areas with higher humidity rates. Thus, the authors
advise healthcare professionals to devote greater attention to
coastal regions.
The use of chest X-ray images is recommended for
diagnosing COVID-19 because X-rays are easily obtained at
nearby hospitals or clinics fairly quickly and at low costs.
Our CNN-based COVID-19 detector delivered superior
performance in terms of precision, recall, and F-measure.
The application of ML techniques for COVID-19 diagnosis
using our CNN-based COVID-19 detector is recommended.
It is well known that VGG16 (Wu et al., 2017) outperforms
many convolutional networks, such as GoogLeNet and
SqueezeNet, and its feature representation capability is
beneficial for classification accuracy. Hence, VGG16 is a
recommended version of a deep CNN-based algorithm as it
makes training easier and quicker. It was implemented in our
COVID-19 detector to improve its accuracy in diagnosing
COVID-19 in chest X-ray images.
Our COVID-19 detector obtained better results when using
augmentation. A better training process was achieved as the
gap between the training and validation became smaller.
Moreover, a more generalized and robust COVID-19 detector
was achieved as the F-measure improved from 0.95 to 0.99.
Thus, the COVID-19 detector trained on augmented data
provides superior performance metrics and is robust for
diagnosing COVID-19 in chest X-ray images.
95%
99%
90% 92% 94% 96% 98% 100%
Original dataset (withoutaugumntaion)
Dataset with augumntaion

Alazab et al. 178
VI. Conclusions and Future Work
The rapid spread of COVID-19 across the world and the
increasing number of deaths require urgent actions from all
sectors. Future prediction of potential infections will enable
authorities to tackle the consequences effectively.
Furthermore, it is necessary to keep up with the number of
infected people by performing regular check-ups, and it is
often vital to quarantine infected people and adopt medical
measures. Additionally, attention should be given to several
other factors to curb the spread of COVID-19, such as the
environmental effects and the similarities among the most
affected areas, and careful measures should be adopted. In this
paper, AI-based techniques were proposed for the prediction
and diagnosis of COVID-19:
Prediction models such as the PA, ARIMA, and LSTM
algorithms were used to predict the number of COVID-19
confirmations, recoveries, and deaths over the next 7 days. PA
delivered the best performance. It predicted the number of
COVID-19 confirmations, recoveries, and deaths in Australia
and obtained prediction accuracies of 99.94%, 90.29%, and
94.18%, respectively. It also predicted the number of COVID-
19 confirmations, recoveries, and deaths in Jordan and
obtained prediction accuracies of 99.08%, 79.39%, and
86.82%, respectively. Meanwhile, investigation into more
sophisticated forecasting and prediction methods is a subject
of a future work.
A diagnosis model using VGG16 was proposed to detect
COVID-19 using chest X-ray images. The model allows the
rapid and reliable detection of COVID-19, enabling it to
achieve an F-measure of 99% using an augmented dataset. In
a future study, we will consider diagnosing COVID-19 in
chest CT scan images using the VGG-XX versions and
compare their performances using larger datasets.
A further contribution of this study is the analysis of the
COVID-19 spread and its related statistical data based on its
global regional distributions. Thus, two main conclusions
were drawn using our AI-based analysis: (i) the most highly
infected areas have similar characteristics, and (ii) the spread
of the disease in coastal areas is significantly higher than that
in other non-coastal areas. Therefore, extra care and attention
should be given to coastal cities. In our future work, we will
investigate the effects of temperature, humidity, and terrain on
the COVID-19 spread in cities and countries.
Acknowledgment
This work was supported by the faculty of Artificial
intelligence, Al-Balqa Applied University.
References
[1] World Health Organization, "Laboratory testing for
coronavirus disease 2019 (COVID-19) in suspected
human cases: interim guidance, 2 March 2020,"
World Health Organization, World Health
Organization2020.
[2] Worldometers. (2020, April. 6). Coronavirus Cases.
Available:
https://www.worldometers.info/coronavirus/
[3] A. Chen. ( 2020) China’s coronavirus app could have
unintended consequences. MIT Technology Review.
Available:
https://www.technologyreview.com/2020/02/13/844
805/coronavirus-china-app-close-contact-
surveillance-covid-19-technology/
[4] F. Jiang, L. Deng, L. Zhang, Y. Cai, C. W. Cheung,
and Z. Xia, "Review of the clinical characteristics of
coronavirus disease 2019 (COVID-19)," Journal of
General Internal Medicine, pp. 1-5, 2020.
[5] Z. Wu and J. M. McGoogan, "Characteristics of and
important lessons from the coronavirus disease 2019
(COVID-19) outbreak in China: summary of a report
of 72 314 cases from the Chinese Center for Disease
Control and Prevention," Jama, 2020.
[6] T. Ai, Z. Yang, H. Hou, C. Zhan, C. Chen, W. Lv, et
al., "Correlation of chest CT and RT-PCR testing in
coronavirus disease 2019 (COVID-19) in China: a
report of 1014 cases," Radiology, p. 200642, 2020.
[7] A. Narin, C. Kaya, and Z. Pamuk, "Automatic
Detection of Coronavirus Disease (COVID-19)
Using X-ray Images and Deep Convolutional Neural
Networks," arXiv preprint arXiv:2003.10849, 2020.
[8] H. S. Maghdid, A. T. Asaad, K. Z. Ghafoor, A. S.
Sadiq, and M. K. Khan, "Diagnosing COVID-19
Pneumonia from X-Ray and CT Images using Deep
Learning and Transfer Learning Algorithms," arXiv
preprint arXiv:2004.00038, 2020.
[9] S. U. K. Bukhari, S. S. K. Bukhari, A. Syed, and S.
S. H. SHAH, "The diagnostic evaluation of
Convolutional Neural Network (CNN) for the
assessment of chest X-ray of patients infected with
COVID-19," medRxiv, 2020.
[10] H. Shi, X. Han, N. Jiang, Y. Cao, O. Alwalid, J. Gu,
et al., "Radiological findings from 81 patients with
COVID-19 pneumonia in Wuhan, China: a
descriptive study," The Lancet Infectious Diseases,
2020.
[11] A. A. Ogunleye and W. Qing-Guo, "XGBoost model
for chronic kidney disease diagnosis," IEEE/ACM
transactions on computational biology and
bioinformatics, 2019.
[12] C. Feng, A. Elazab, P. Yang, T. Wang, F. Zhou, H.
Hu, et al., "Deep Learning Framework for
Alzheimer’s Disease Diagnosis via 3D-CNN and
FSBi-LSTM," IEEE Access, vol. 7, pp. 63605-63618,
2019.
[13] H. Yin, B. Mukadam, X. Dai, and N. Jha, "DiabDeep:
Pervasive Diabetes Diagnosis based on Wearable
Medical Sensors and Efficient Neural Networks,"
IEEE Transactions on Emerging Topics in
Computing, 2019.
[14] K. Santosh, "AI-Driven Tools for Coronavirus
Outbreak: Need of Active Learning and Cross-
Population Train/Test Models on
Multitudinal/Multimodal Data," Journal of Medical
Systems, vol. 44, pp. 1-5, 2020.
[15] L. Wynants, B. Van Calster, M. M. Bonten, G. S.
Collins, T. P. Debray, M. De Vos, et al., "Systematic
review and critical appraisal of prediction models for
diagnosis and prognosis of COVID-19 infection,"
medRxiv, 2020.
[16] A. Alazab, M. Hobbs, J. Abawajy, and M. Alazab,
"Using feature selection for intrusion detection
system," in 2012 international symposium on
communications and information technologies
(ISCIT), 2012, pp. 296-301.

COVID-19 Prediction and Detection Using Deep Learning 179
[17] [M. Alazab, S. Venkatraman, P. Watters, M. Alazab,
and A. Alazab, "Cybercrime: The Case of
Obfuscated Malware," in Global Security, Safety and
Sustainability & e-Democracy. vol. 99, C.
Georgiadis, H. Jahankhani, E. Pimenidis, R.
Bashroush, and A. Al-Nemrat, Eds., ed: Springer
Berlin Heidelberg, 2012, pp. 204-211.
[18] M. Alazab., S. Venkatraman., P. Watters., and M.
Alazab., "Information Security Governance: The Art
of Detecting Hidden Malware," in IT Security
Governance Innovations: Theory and Research, M.
Daniel, S. Luis Enrique, F.-M. Eduardo, and G. P.
Mario, Eds., ed Hershey, PA, USA: IGI Global, 2013,
pp. 293-315.
[19] A. Alazab, M. Alazab, J. Abawajy, and M. Hobbs,
"Web application protection against SQL injection
attack," in Proceedings of the 7th International
Conference on Information Technology and
Applications, 2011, pp. 1-7.
[20] M. Alazab and L. Batten, "Survey in Smartphone
Malware Analysis Techniques," in New Threats and
Countermeasures in Digital Crime and Cyber
Terrorism, ed: IGI Global, 2015, pp. 105-130.
[21] M. Alazab., A. Alazab., and L. Batten., "Smartphone
malware based on synchronisation vulnerabilities,"
in ICITA 2011: Proceedings of the 7th International
Conference on Information Technology and
Applications, Sydney, Australia, 2012, pp. 1-6.
[22] V. Moonsamy., M. Alazab., and L. Batten.,
"Towards an Understanding of the Impact of
Advertising on Data Leaks," International Journal of
Security and Networks (IJSN), vol. 7 2012.
[23] L. M. Batten, V. Moonsamy, and M. Alazab,
"Smartphone applications, malware and data theft,"
in Computational intelligence, cyber security and
computational models, ed: Springer, 2016, pp. 15-24.
[24] M. Alazab, V. Monsamy, L. Batten, P. Lantz, and R.
Tian, "Analysis of Malicious and Benign Android
Applications," in International Conference on
Distributed Computing Systems Workshops
(ICDCSW), 2012 32nd, 2012, pp. 608-616.
[25] Y. Xu, Y. Wang, J. Yuan, Q. Cheng, X. Wang, and
P. L. Carson, "Medical breast ultrasound image
segmentation by machine learning," Ultrasonics, vol.
91, pp. 1-9, 2019.
[26] A. Mesleh, "Lung Cancer Detection Using Multi-
Layer Neural Networks with Independent
Component Analysis: A Comparative Study of
Training Algorithms," Jordan Journal of Biological
Sciences, vol. 10, 2017.
[27] A. Mesleh, D. Skopin, S. Baglikov, and A. Quteishat,
"Heart rate extraction from vowel speech signals,"
Journal of computer science and technology, vol. 27,
pp. 1243-1251, 2012.
[28] A. Mesleh, "Chi square feature extraction based
svms arabic language text categorization system,"
Journal of Computer Science, vol. 3, pp. 430-435,
2007.
[29] A. Mesleh, "Support vector machines based Arabic
language text classification system: feature selection
comparative study," in Advances in Computer and
Information Sciences and Engineering, ed: Springer,
2008, pp. 11-16.
[30] A. Mesleh, "Feature sub-set selection metrics for
Arabic text classification," Pattern Recognition
Letters, vol. 32, pp. 1922-1929, 2011.
[31] A. Mesleh, "Support Vector Machine Text Classifier
for Arabic Articles," ed: VDM Verlag Dr. Müller,
2010.
[32] K. Suzuki, "Overview of deep learning in medical
imaging," Radiological physics and technology, vol.
10, pp. 257-273, 2017.
[33] Y. LeCun, Y. Bengio, and G. Hinton, "Deep
learning," nature, vol. 521, pp. 436-444, 2015.
[34] C. Rachna. (2020, 15 April 2020). Difference
Between X-ray and CT Scan.
[35] P. K. Sethy and S. K. Behera, "Detection of
coronavirus Disease (COVID-19) based on Deep
Features," 2020.
[36] E. E.-D. Hemdan, M. A. Shouman, and M. E. Karar,
"A Framework of Deep Learning Classifiers to
Diagnose COVID-19 in X-Ray Images.," arXiv
preprint arXiv:2003.11055, 2020.
[37] A. E. Hassanien, L. N. Mahdy, K. A. Ezzat, H. H.
Elmousalami, and H. A. Ella, "Automatic X-ray
COVID-19 Lung Image Classification System based
on Multi-Level Thresholding and Support Vector
Machine," medRxiv, 2020.
[38] S. Wang, B. Kang, J. Ma, X. Zeng, M. Xiao, J. Guo,
et al., "A deep learning algorithm using CT images
to screen for Corona Virus Disease (COVID-19),"
medRxiv, 2020.
[39] D. Wang, B. Hu, C. Hu, F. Zhu, X. Liu, J. Zhang, et
al., "Clinical characteristics of 138 hospitalized
patients with 2019 novel coronavirus–infected
pneumonia in Wuhan, China," Jama, 2020.
[40] O. Gozes, M. Frid-Adar, H. Greenspan, P. D.
Browning, H. Zhang, W. Ji, et al., "Rapid ai
development cycle for the coronavirus (covid-19)
pandemic: Initial results for automated detection &
patient monitoring using deep learning ct image
analysis," arXiv preprint arXiv:2003.05037, 2020.
[41] M. Fu, S.-L. Yi, Y. Zeng, F. Ye, Y. Li, X. Dong, et
al., "Deep Learning-Based Recognizing COVID-19
and other Common Infectious Diseases of the Lung
by Chest CT Scan Images," medRxiv, 2020.
[42] X. Xu, X. Jiang, C. Ma, P. Du, X. Li, S. Lv, et al.,
"Deep learning system to screen coronavirus disease
2019 pneumonia," arXiv preprint arXiv:2002.09334,
2020.
[43] M. Li, Z. Zhang, S. Jiang, Q. Liu, C. Chen, Y. Zhang,
et al., "Predicting the epidemic trend of COVID-19
in China and across the world using the machine
learning approach," medRxiv, 2020.
[44] P. Kumar, H. Kalita, S. Patairiya, Y. D. Sharma, C.
Nanda, M. Rani, et al., "Forecasting the dynamics of
COVID-19 Pandemic in Top 15 countries in April
2020 through ARIMA Model with Machine
Learning Approach," medRxiv, 2020.
[45] C.-J. Huang, Y.-H. Chen, Y. Ma, and P.-H. Kuo,
"Multiple-Input Deep Convolutional Neural
Network Model for COVID-19 Forecasting in
China," medRxiv, 2020.
[46] G. Pandey, P. Chaudhary, R. Gupta, and S. Pal,
"SEIR and Regression Model based COVID-19
outbreak predictions in India," arXiv preprint
arXiv:2004.00958, 2020.

Alazab et al. 180
[47] N. Sajid. (2020, April.1). Corona Virus Dataset
Available:
https://www.kaggle.com/nabeelsajid917/covid-19-
x-ray-10000-images
[48] A. Buslaev, V. I. Iglovikov, E. Khvedchenya, A.
Parinov, M. Druzhinin, and A. A. Kalinin,
"Albumentations: fast and flexible image
augmentations," Information, vol. 11, p. 125, 2020.
[49] V. Jatana. (2020, April. 1). Coronavirus in Jordan.
Available:
https://www.kaggle.com/vanshjatana/coronavirus-
in-jordan/notebook
[50] V. Jatana. (2020, April. 1). Coronavirus in Australia.
Available:
https://www.kaggle.com/vanshjatana/australia-
under-covid-19?scriptVersionId=32280319
[51] M. Alazab., M. Alazab., A. Shalaginov., A. Mesleh.,
and A. Awajan., "Intelligent mobile malware
detection using permission requests and API calls,"
Future Generation Computer Systems, vol. 107, pp.
509-521, 2020.
[52] M. Alazab, "Automated Malware Detection in
Mobile App Stores Based on Robust Feature
Generation," Electronics, vol. 9, p. 435, 2020.
[53] M. Alazab, "Analysis on Smartphone Devices for
Detection and Prevention of Malware," Doctor of
Philosophy, Faculty of Science, Engineering and
Built Environment, Deakin University, 2014.
[54] M. Alazab, S. Venkatraman, P. Watters, and M.
Alazab, "Zero-day malware detection based on
supervised learning algorithms of API call
signatures," in Ninth Australasian Data Mining
Conference: AusDM 2011, Ballarat, Australia, 2011,
pp. 171-181.
[55] T. Zhang, Q. Wu, and Z. Zhang, "Probable pangolin
origin of SARS-CoV-2 associated with the COVID-
19 outbreak," Current Biology, 2020.
[56] CentersforDiseaseControlandPrevention. (2020, 01).
Interim Clinical Guidance for Management of
Patients with Confirmed Coronavirus Disease
(COVID-19). Available:
https://www.cdc.gov/coronavirus/2019-
ncov/hcp/clinical-guidance-management-
patients.html
[57] AustralianGovernment. (2020, April. 01).
Coronavirus (COVID-19) current situation and case
numbers. Available:
https://www.health.gov.au/news/health-alerts/novel-
coronavirus-2019-ncov-health-alert/coronavirus-
covid-19-current-situation-and-case-numbers
[58] S. Kannan. (2020, April. 10). A drill-down analysis
of Covid-19 in India, so far. Available:
https://www.indiatoday.in/news-analysis/story/a-
drill-down-analysis-of-covid-19-in-india-so-far-
1665676-2020-04-10
[59] S. J. Taylor and B. Letham, "Forecasting at scale,"
The American Statistician, vol. 72, pp. 37-45, 2018.
[60] A. Bazila Banu, R. Priyadarshini, and P.
Thirumalaikolundusubramanian, "Prediction of
Children Diabetes by Autoregressive Integrated
Moving Averages Model Using Big Data and Not
Only SQL," Journal of Computational and
Theoretical Nanoscience, vol. 16, pp. 3510-3513,
2019.
[61] J. Qiu, B. Wang, and C. Zhou, "Forecasting stock
prices with long-short term memory neural network
based on attention mechanism," PloS one, vol. 15,
2020.
[62] S. Hochreiter and J. Schmidhuber, "LSTM can solve
hard long time lag problems," in Advances in neural
information processing systems, 1997, pp. 473-479.
[63] F. Quiroga, R. Antonio, F. Ronchetti, L. C. Lanzarini,
and A. Rosete, "A study of convolutional
architectures for handshape recognition applied to
sign language," in XXIII Congreso Argentino de
Ciencias de la Computación (La Plata, 2017). 2017.
Author Biographies
Dr. Moutaz Alazab is a computer
security expert with industry, academic,
teaching and research experience. He
completed his PhD degree in
cybersecurity from Deakin university,
Australia in 2014. He is currently
working as assistant professor in the
faculty of Artificial Intelligence, Al-
Balqa Applied University. During his
PhD, he was an active scholar in the Securing Cyberspace
Laboratory and Network and System Security Laboratory
(NSCLab). Dr. Alazab has proved the ability in delivering a
high-quality content for several courses for both level
(undergraduate students and postgraduate students). He has
lectured, coordinated, tutored and moderated in several well-
known universities including in BAU, CCQ, Deakin, RMIT,
CQU and MIT. Dr. Alazab has worked closely in
collaboration with industry on several research projects,
including BAE Systems, Microsoft and Ericsson. He is
recipient of number of research grants including research
Incentive Fund (RIF), Zayed University. His research interests
include Cybersecurity, Mobile Security, Network Security,
Machine Learning, Digital Forensics, Blockchain, Internet of
Things (IOT) and Big data analytics. He has published more
than 20 peer-reviewed articles in well-known, high-quality
international journals and conferences.
Dr. Albara Awajan is an associate
professor at the Cyber Security
Department, Faculty of Artificial
Intelligence, Al-Balqa Applied
University. He completed his PhD in
Computer Networks and Multimedia
Applications in 2008 and his MCs
Degree in 2003 in Multimedia and
Internet Computing from the
University of Glamorgan in the UK. He completed his BCs
from Mutah University in 2001. During his PhD studies he
worked in the Mobile Communication Research Group in the
Faculty of Advance Engineering. He is currently Head of the
Automated Systems Department and Assistant Dean for
Student Affairs in the Artificial Intelligent Faculty. Dr Awajan
Research Areas are in AD-HOC networks, QoS, IoT and
network Security.

COVID-19 Prediction and Detection Using Deep Learning 181
Prof. Abdelwadood Mesleh is a Professor
at the Autonomous Systems Department,
the Faculty of Artificial Intelligence at Al-
Balqa Applied University (BAU). Prof.
Mesleh received his BSc and MSc degrees
in Computer Engineering from Shanghai
University, China, in 1995 and 1998
respectively, and his PhD in Computer Information Systems
from the Arab Academy for Banking and Financial Sciences,
Jordan, in 2008. Prof. Mesleh worked as a research assistant
at Hong Kong University of Science and Technology, China,
from 2004 to 2005, and worked as a professor in the Faculty
of Engineering Technology at BAU from 2005 to 2019. His
research interests include artificial intelligence and its
applications.
Dr. Abraham is the Director of Machine
Intelligence Research Labs (MIR Labs),
a Not-for-Profit Scientific Network for
Innovation and Research Excellence
connecting Industry and Academia. As
an Investigator / Co-Investigator, he has
won research grants worth over 100+
Million US$ from Australia, USA, EU, Italy, Czech Republic,
France, Malaysia and China. Dr. Abraham works in a multi-
disciplinary environment involving machine intelligence,
cyber-physical systems, Internet of things, network security,
sensor networks, Web intelligence, Web services, data mining
and applied to various real-world problems. In these areas he
has authored / co- authored more than 1,300+ research
publications out of which there are 100+ books covering
various aspects of Computer Science. One of his books was
translated to Japanese and few other articles were translated to
Russian and Chinese. About 1000+ publications are indexed
by Scopus and over 800 are indexed by Thomson ISI Web of
Science. Dr. Abraham has more than 37,000+ academic
citations (h-index of 91 as per google scholar). He has given
more than 100 plenary lectures and conference tutorials (in
20+ countries). Since 2008, Dr. Abraham is the Chair of IEEE
Systems Man and Cybernetics Society Technical Committee
on Soft Computing (which has over 200+ members) and
served as a Distinguished Lecturer of IEEE Computer Society
representing Europe (2011-2013). Currently Dr. Abraham is
the editor-in-chief of Engineering Applications of Artificial
Intelligence (EAAI) and serves/served the editorial board of
over 15 International Journals indexed by Thomson ISI. Dr.
Abraham received Ph.D. degree in Computer Science from
Monash University, Melbourne, Australia (2001) and a
Master of Science Degree from Nanyang Technological
University, Singapore (1998).
Dr. Salah Alhyari is a visiting lecturer at
the University of Jordan since 2017. He is
a senior of computer operation department
at Jordanian Electric Power Company
(JEPCO) since 2008. He received his PhD
in Business Administration - Logistics
Science and Supply Chain Management in
2015. He received his master’s degree in business
administration and bachelor’s degree in management
information systems. His area of interests includes Artificial
Intelligence, supply chain management, logistics science,
operation management, quality management and information
systems management.
Vansh Jatanaand is Data Scientist born
in Haryana, India. He is currently rank 13
in the world as Grandmaster at Kaggle
(Data Science Platform). He has received
several international internships and
recognized by NASA. His area of
interests includes machine learning,
natural languages processing and Data Science.
View publication statsView publication stats