Embed Size (px)
Citation preview

COVID-19 DEATH WEEKLY ANALYSIS, EPIDEMIOLOGY UNIT/ JUNE 26, 2021– JULY 02, 2021
Epidemiology Unit Ministry of Health
231, De Saram Place, Colombo 10, Sri Lanka Tele: (+94 11) 2695112, 2681548, 4740490, 4740491, 4740492 Fax: (+94 11) 2696583 E-mail: [email protected], [email protected] Web: www.epid.gov.lk
COVID-19 CONFIRMED DEATH- WEEKLY ANALYSIS (JUNE 26, 2021 – JULY 02, 2021)
During the COVID-19 epidemic, rapid mortality surveillance provides essential information to formulate an evidence-based
response. Identifying the trends with categorizations of COVID-19 confirmed deaths are a key indicator of overall epidemic
impact and trajectory. This report presents the deaths involving COVID-19 by the period from 26th of June, 2021 to 02nd of July,
2021 with a comparison of previous analysis from 11th of March, 2020 to 25th of June, 2021 in which the date of death was
declared. The deaths are categorized according to the province/district (Table-1), age, sex and ethnicity (Table –2, 3, 4, and 6),
place of death (Table -5) and co-morbidities (Table – 7).
Highlights
• The total number of COVID-19 (SARS-CoV-2) confirmed cases up to July 02, 2021 – 262,795
• Number of COVID-19 confirmed cases reported in the current week from June 26- July 02, 2021 – 12,869
• Number of deaths reported in the previous analysis (March 11, 2020- June 25, 2021) – 2,862 (CFR = 1.15%)
• Number of deaths reported in the current week (June 26, 2021, to July 02, 2021) – 295 (CFR = 2.29%)
• Total number of COVID-19 (SARS-CoV-2) deaths reported up to July 02, 2021- 3,157 (CFR = 1.20%)
(*** Case Fatality Ratio-abbreviated as CFR; Calculated with the total number of deaths reported during the period as the numerator and total number of
cases reported during the same period as the denominator)
FIGURE 1: WEEKLY REPORTING OF COVID-19 DEATHS
FIGURE 2: WEEKLY REPORTING OF COVID-19 DEATHS BY DATE OF DEATH
4 3 2 1 1 1 1 1 5 11 23 21 33 23 17 18 21 22 17 30 21 29 38 41 49 31 29 32 19 14 17 20 9 1 1 11 23 4085
157209232
293
416 408 382295
0100200300400500
3/2
8/2
02
0…
5/2
/20
20
-…
5/3
0/2
02
0…
9/1
2/2
02
0…
10
/24
/20
2…
11
/7/2
02
0…
11
/21
/20
2…
12
/5/2
02
0…
12
/19
/20
2…
1/2
/20
21
-…
1/1
6/2
02
1…
1/3
0/2
02
1…
2/1
3/2
02
1…
2/2
7/2
02
1…
3/1
3/2
02
1…
3/2
7/2
02
1…
4/1
0/2
02
1…
5/1
5/2
02
1…
4/1
7/2
02
1…
5/1
/20
21
-…
5/1
5/2
02
1…
5/2
9/2
02
1…
6/1
2/2
02
1…
6/2
6/2
02
1…
1st Wave 2nd Wave 3rd Wave
Total
5 2 2 1 1 1 1 1 6 15 24 23 34 22 14 22 16 23 22 31 22 34 50 41 39 31 28 27 16 12 17 14 9 14 26 52104
175
303 285339
291358 354
292
0100200300400
3/2
8/2
02
0 -
…
5/2
/20
20
-…
5/3
0/2
02
0 -
…
9/1
2/2
02
0 -
…
10
/24
/20
20
…
11
/7/2
02
0 -
…
11
/21
/20
20
…
12
/5/2
02
0 -
…
12
/19
/20
20
…
1/2
/20
21
-…
1/1
6/2
02
1 -
…
1/3
0/2
02
1 -
…
2/1
3/2
02
1 -
…
2/2
7/2
02
1 -
…
3/1
3/2
02
1 -
…
3/2
7/2
02
1 -
…
4/1
0/2
02
1 -
…
4/1
7/2
02
1 -
…
5/1
/20
21
-…
5/1
5/2
02
1 -
…
5/2
9/2
02
1 -
…
6/1
2/2
02
1 -
…
6/2
6/2
02
1 -
…
1st Wave 2nd Wave 3rd Wave

COVID-19 DEATH WEEKLY ANALYSIS, EPIDEMIOLOGY UNIT/ JUNE 26, 2021– JULY 02, 2021
TABLE 1: PROVINCIAL AND DISTRICT DISTRIBUTION OF COVID-19 CONFIRMED DEATHS
Province/District Death Count
Analysis up to 25.06.2021
Current week Total
Western 1405 49.1% 123 41.7% 1528 48.4%
Colombo 634 22.2% 61 20.7% 695 22.0%
Gampaha 398 13.9% 38 12.9% 436 13.8%
Kalutara 373 13.0% 24 8.1% 397 12.6%
Central 460 16.1% 52 17.6% 512 16.2%
Kandy 285 10.0% 34 11.5% 319 10.1%
Matale 58 2.0% 6 2.0% 64 2.0%
Nuwara Eliya 117 4.1% 12 4.1% 129 4.1%
Southern 258 9.0% 22 7.5% 280 8.9%
Galle 204 7.1% 12 4.1% 216 6.8%
Matara 43 1.5% 6 2.0% 49 1.6%
Hambantota 11 0.4% 4 1.4% 15 0.5%
Northern 59 2.1% 17 5.8% 76 2.4%
Jaffna 42 1.5% 15 5.1% 57 1.8%
Mannar 5 0.2% 1 0.3% 6 0.2%
Mullativu 2 0.1% 0 0.0% 2 0.1%
Vavuniya 9 0.3% 1 0.3% 10 0.3%
Kilinochchi 1 0.0% 0 0.0% 1 0.0%
Eastern 96 3.4% 16 5.4% 112 3.5%
Ampara 15 0.5% 1 0.3% 16 0.5%
Batticaloa 55 1.9% 8 2.7% 63 2.0%
Trincomalee 14 0.5% 3 1.0% 17 0.5%
Kalmunai 12 0.4% 4 1.4% 16 0.5%
North Western 247 8.6% 21 7.1% 268 8.5%
Kurunegala 197 6.9% 12 4.1% 209 6.6%
Puttalam 50 1.7% 9 3.1% 59 1.9%
North Central 75 2.6% 13 4.4% 88 2.8%
Anuradhapura 43 1.5% 7 2.4% 50 1.6%
Polonnaruwa 32 1.1% 6 2.0% 38 1.2%
Uva 91 3.2% 8 2.7% 99 3.1%
Badulla 73 2.6% 6 2.0% 79 2.5%
Monaragala 18 0.6% 2 0.7% 20 0.6%
Sabaragamuwa 171 6.0% 23 7.8% 194 6.1%
Kegalle 87 3.0% 9 3.1% 96 3.0%
Rathnapura 84 2.9% 14 4.7% 98 3.1%
Total Death Count
2862 90.7% 295 9.3% 3157 100%
FIGURE 3: REPORTING OF COVID-19 DEATHS BY DISTRICT (CURRENT WEEK)
61
38
24
34
612 12
6 4
15
1 1 18
3 412 9 7 6 6
29
14
0
10
20
30
40
50
60
70
Co
lom
bo
Gam
pah
a
Kal
uta
ra
Kan
dy
Mat
ale
Nu
war
a El
iya
Gal
le
Mat
ara
Ham
ban
tota
Jaff
na
Man
nar
Vav
un
iya
Am
par
a
Bat
tica
loa
Trin
com
alee
Kal
mu
nai
Ku
run
ega
la
Pu
ttal
am
An
ura
dh
apu
ra
Po
lon
nar
uw
a
Bad
ulla
Mo
nar
agal
a
Keg
alle
Rat
nap
ura
Western Central Southern Northern Eastern North WesternNorth Central Uva Sabaragamuwa

COVID-19 DEATH WEEKLY ANALYSIS, EPIDEMIOLOGY UNIT/ JUNE 26, 2021– JULY 02, 2021
TABLE 2: DISTRIBUTION OF CONFIRMED DEATHS BY SEX AND AGE (BROAD CATEGORIES)
Age Category (Years)
Sex Analysis up to 25.06.2021 Current Week Total
Female Male Total % Female Male Total % Total %
Below 30 15 18 33 1% 3 4 7 2% 40 1.3%
30-59 268 432 700 24% 28 48 76 26% 776 24.6%
60 & above 916 1213 2129 74% 85 127 212 72% 2341 74.2%
Total 1199 1663 2862 91% 116 179 295 9% 3157 100%
TABLE 3: DISTRIBUTION OF CONFIRMED DEATHS BY SEX AND AGE
Age Category (Years)
Sex Analysis up to 25.06.2021 Current Week Total
Female Male Total % Female Male Total % Total %
0 -9 2 4 6 0.2% 1 1 2 0.7% 8 0.3%
10−19 2 2 4 0.1% 0 0 0 0.0% 4 0.1%
20-29 11 12 23 0.8% 2 3 5 1.7% 28 0.9%
30-39 28 35 63 2.2% 2 5 7 2.4% 70 2.2%
40-49 71 113 184 6.4% 2 8 10 3.4% 194 6.1%
50-59 135 239 374 13.1% 20 25 45 15.3% 419 13.3%
60-69 278 425 703 24.6% 31 54 85 28.8% 788 25.0%
70-79 403 581 984 34.4% 34 49 83 28.1% 1067 33.8%
80 & above 269 252 521 18.2% 24 34 58 19.7% 579 18.3%
Total 1199 1663 2862 90.7% 116 179 295 9.3% 3157 100%
TABLE 4: DISTRIBUTION OF CONFIRMED DEATHS BY SEX AND ETHNICITY
Ethnicity
Sex
Analysis up to 25.06.2021 Current Week Total
Female Male Total % Femal
e Male Total % Total %
Sinhalese 835 1107 1942 67.9% 69 92 161 54.6% 2103 66.6%
Moor 203 307 510 17.8% 27 44 71 24.1% 581 18.4%
Tamil 135 211 346 12.1% 14 32 46 15.6% 392 12.4%
Burger 24 26 50 1.7% 6 11 17 5.8% 67 2.1%
Other /Foreign/Unknown 2 12 14 0.5% 0 0 0 0.0% 14 0.4%
Total 1199 1663 2862 90.7% 116 179 295 9.3% 3157 100%
COVID-19 DEATH WEEKLY ANALYSIS, EPIDEMIOLOGY UNIT/ JUNE 26, 2021– JULY 02, 2021
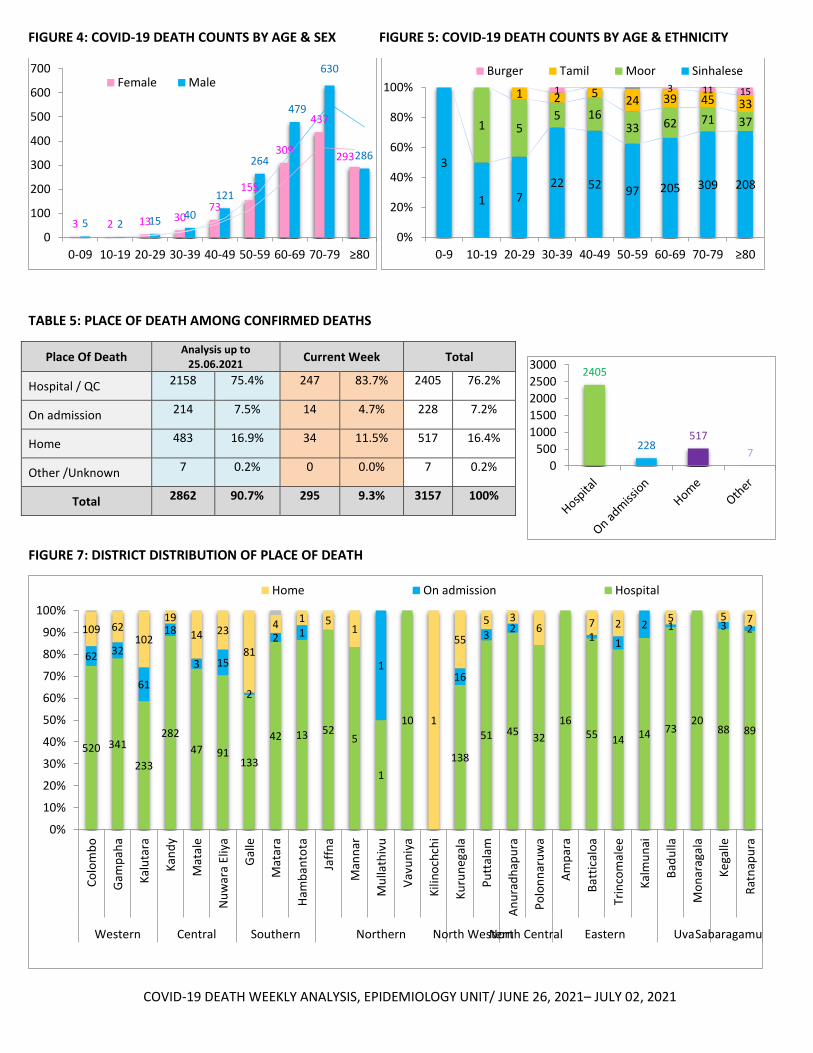
FIGURE 4: COVID-19 DEATH COUNTS BY AGE & SEX FIGURE 5: COVID-19 DEATH COUNTS BY AGE & ETHNICITY
TABLE 5: PLACE OF DEATH AMONG CONFIRMED DEATHS
Place Of Death Analysis up to
25.06.2021 Current Week Total
Hospital / QC 2158 75.4% 247 83.7% 2405 76.2%
On admission 214 7.5% 14 4.7% 228 7.2%
Home 483 16.9% 34 11.5% 517 16.4%
Other /Unknown 7 0.2% 0 0.0% 7 0.2%
Total 2862 90.7% 295 9.3% 3157 100%
FIGURE 7: DISTRICT DISTRIBUTION OF PLACE OF DEATH
3 2 13 3073
155
309
437
293
5 2 1540
121
264
479
630
286
0
100
200
300
400
500
600
700
0-09 10-19 20-29 30-39 40-49 50-59 60-69 70-79 ≥80
Female Male
3
1 722 52 97 205 309 208
1 55 16
33 62 71 37
1 2 524 39 45 33
1 3 11 15
0%
20%
40%
60%
80%
100%
0-9 10-19 20-29 30-39 40-49 50-59 60-69 70-79 ≥80
Burger Tamil Moor Sinhalese
520 341
233
282
47 91133
42 13 525
1
10
138
51 4532
1655 14 14 73
2088 89
62 32
61
18
3 15
2
2 1
116
32
11
2 1 3 2109 62102
19
14 23
81
41 5
1
1
55
5 36 7 2 5 5 7
0%
10%
20%
30%
40%
50%
60%
70%
80%
90%
100%
Co
lom
bo
Gam
pah
a
Kal
uta
ra
Kan
dy
Mat
ale
Nu
war
a El
iya
Gal
le
Mat
ara
Ham
ban
tota
Jaff
na
Man
nar
Mu
llath
ivu
Vav
un
iya
Kili
no
chch
i
Ku
run
egal
a
Pu
ttal
am
An
ura
dh
apu
ra
Po
lon
nar
uw
a
Am
par
a
Bat
tica
loa
Trin
com
ale
e
Kal
mu
nai
Bad
ulla
Mo
nar
agal
a
Ke
galle
Rat
nap
ura
Western Central Southern Northern North WesternNorth Central Eastern UvaSabaragamuwa
Home On admission Hospital
2405
228517
70
500
1000
1500
2000
2500
3000

COVID-19 DEATH WEEKLY ANALYSIS, EPIDEMIOLOGY UNIT/ JUNE 26, 2021– JULY 02, 2021
TABLE 6: DISTRIBUTION OF CONFIRMED DEATHS BY AGE, SEX AND ETHNICITY (CURRENT WEEK)
Age Category (Years)
Sex & Ethnicity Total
Female Male
Sinhalese Moor Tamil Burger Foreign/
Other Total Sinhalese Moor Tamil Burger
Foreign/ Other
Total
0 -9 1 0 0 0 0 1 0% 1 0 0 0 0 1 0% 2 0.7%
10−19 0 0 0 0 0 0 0% 0 0 0 0 0 0 0% 0 0.0%
20-29 1 1 0 0 0 2 1% 1 1 1 0 3 1% 5 1.7%
30-39 2 0 0 0 0 2 1% 3 1 1 0 5 2% 7 2.4%
40-49 1 1 0 0 0 2 1% 7 1 0 8 3% 10 3.4%
50-59 10 6 4 0 0 20 7% 13 6 5 1 0 25 8% 45 15.3%
60-69 20 5 6 0 0 31 11% 26 15 9 4 0 54 18% 85 28.8%
70-79 19 10 2 3 0 34 12% 23 14 10 2 0 49 17% 83 28.1%
80 & above
15 4 2 3 0 24 8% 18 6 6 4 0 34 12% 58 19.7%
Total
69 27 14 6 0 116 39% 92 44 32 11 0 179 61% 295 100%
23.4% 9.2% 4.7% 2.0% 0.0% 39.3% 31.2% 14.9% 10.8% 3.7% 0.0% 60.7%
TABLE 7: DISTRIBUTION OF CO-MORBIDITIES AMONG CONFIRMED DEATHS BY AGE CATEGORIES
Co-
morbidities
Analysis up to 25.06.2021 Current Week Total
29 &
below
30-
59
60 &
above Total
29 &
below
30-
59
60&
above
Total 29 & below 30-59 60 & above Total
With 18 523 1619 2160 75% 4 40 104 148 50% 22 55.0% 563 72.6% 1723 73.6% 2308 73%
DM 2 292 865 1159 54% 0 18 48 66 45% 2 9% 310 55% 913 53% 1225 53.1%
HT 0 213 920 1133 52% 1 16 53 70 47% 1 5% 229 41% 973 56% 1203 52.1%
IHD 0 78 380 458 21% 0 6 25 31 21% 0 0% 84 15% 405 24% 489 21.2%
CKD 0 118 271 389 18% 1 13 15 29 20% 1 5% 131 23% 286 17% 418 18.1%
BA 0 50 173 223 10% 0 4 8 12 8% 0 0% 54 10% 181 11% 235 10.2%
CVA 0 10 102 112 5% 0 1 9 10 7% 0 0% 11 2% 111 6% 122 5.3%
COPD 0 17 93 110 5% 0 2 9 11 7% 0 0% 19 3% 102 6% 121 5.2%
CLCD 1 17 43 61 3% 0 1 1 2 1% 1 5% 18 3% 44 3% 63 2.7%
DYS 0 37 126 163 8% 0 2 9 11 7% 0 0% 39 7% 135 8% 174 7.5%
CA 5 47 98 150 7% 2 1 4 7 5% 7 32% 48 9% 102 6% 157 6.8%
TB 1 18 14 33 2% 0 1 1 1% 1 5% 18 3% 15 1% 34 1.5%
Other 10 105 269 384 18% 1 12 13 26 18% 11 50% 117 21% 282 16% 410 17.8%
Without 10 99 278 387 14% 0 0 8 8 3% 10 25.0% 99 12.8% 286 12.2% 395 12.5%
Not Known 5 78 232 315 11% 3 36 100 139 47% 8 20.0% 114 14.7% 332 14.2% 454 14.4%
Total 33 700 2129 2862 91% 7 76 212 295 9% 40 1.3% 776 24.6% 2341 74.2% 3157 100%

COVID-19 DEATH WEEKLY ANALYSIS, EPIDEMIOLOGY UNIT/ JUNE 26, 2021– JULY 02, 2021
FIGURE 8: DISTRIBUTION OF CO-MORBIDITIES AMONG AGE CATEGORIES
FIGURE 9: COVID-19 DEATH COUNTS BY DISTRICT – WEEKLY ANALYSIS
2
19 72 166 343 408149
1048 126
308449
192
1
1255
119 18586
8
3359
116 13043
5
12 2953 77
473 11
22 42 32
5
718
3376 24
12
2
6
15 2448
42 10
1
1
7 96 6 3
2
2
6
1021 60 104 120 59
0%
10%
20%
30%
40%
50%
60%
70%
80%
90%
100%
0-09 10-19 20-29 30-39 40-49 50-59 60-69 70-79 ≥80
Per
cen
tage
of
Dea
th C
ou
nt
Age category
Other
Tuberculosis
Cancer
Dyslipidemia
Chronic Liver Cell Disease
Chronic Obstructive Pulmonary Disease
Cerebro-Vascular Accident
Bronchial Asthma
Chronic Kidney Disease
Ischemic Heart Disease
Hypertension
Diabetes Mellitus
3 3
1 1 1
4
11 22 2131
19
16 17 19
16 12 2116 23
2626 30
2218 21
9
5
12
7
2
4
14 24
36 71 90 94100
183181
172123
2
1
1
21 2
11
6
5 10
5
45
2
2
2
1
1
1
2 6
14
36
31 46
60
84 68 59 52
1
1
1
12
1
21
1
1
13 1
11
8
19
24
46
17
5142 32 22
1
1
11
2
1
3
1 21
2
4
39
37 17 17
1 1
1 1 1
1
1 2 1
1
2 2
43 1
2 4
12
1 3 3
6
9
30
20
42
2836 37 211
12 1
11
1
1
12
6
66
6
16
611 6 13
1
32
3 31 1 1
31 1
2 3 2
1 110
416 8
26 19 26 33 23
0%
10%
20%
30%
40%
50%
60%
70%
80%
90%
100%
28
/03
/20
20
-0
3/0
4/2
02
0
02
/05
/20
20
-0
8/0
5/2
02
0
30
/05
/20
20
-0
5/0
6/2
02
0
12
/09
/20
20
-1
8/0
9/2
02
0
24
/10
/20
20
-3
0/1
0/2
02
0
07
/11
/20
20
-1
3/1
1/2
02
0
21
/11
/20
20
-2
7/1
1/2
02
0
05
/12
/20
20
-1
1/1
2/2
02
0
19
/12
/20
20
-2
5/1
2/2
02
0
02
/01
/20
21
-0
8/0
1/2
02
1
16
/01
/20
21
-2
2/0
1/2
02
1
30
/01
/20
21
-0
5/0
2/2
02
1
13
/02
/20
21
-1
9/0
2/2
02
1
27
/02
/20
21
-0
5/0
3/2
02
1
13
/03
/20
21
-1
9/0
3/2
02
1
27
/03
/20
21
-0
2/0
4/2
02
1
10
/04
/20
21
-1
6/0
4/2
02
1
17
/04
/20
21
-2
3/0
4/2
02
1
01
/05
/20
21
-0
7/0
5/2
02
1
15
/05
/20
21
-2
1/0
5/2
02
1
29
/05
/20
21
-0
4/0
6/2
02
1
12
/06
/20
21
-18
/06
/20
21
26
/06
/20
21
-02
/07
/20
21
1st Wave 2nd Wave 3rd Wave
Western Central Southern Eastern Northern North Western North Central Uva Sabaragamuwa

COVID-19 DEATH WEEKLY ANALYSIS, EPIDEMIOLOGY UNIT/ JUNE 26, 2021– JULY 02, 2021
FIGURE 10: COVID-19 DEATH COUNTS BY SEX – WEEKLY ANALYSIS
FIGURE 11: COVID-19 DEATH COUNTS BY ETHNICITY – WEEKLY ANALYSIS
1
1 1 1 1
1
7
7 715
9 7 76 6
79 7
1515 17
1411
13 1410
3 3
72 3
8 1538 69 83
109125180178167116
4
3
1 1
4
4
16 1418
14 10 1115 16
1021 14
1423 24
3520
16 189
11 14
137 8
15 2548 88 127
123168234
232215179
28
/03
/20
20
-0
3/0
4/2
02
0
02
/05
/20
20
-0
8/0
5/2
02
0
30
/05
/20
20
-0
5/0
6/2
02
0
12
/09
/20
20
-1
8/0
9/2
02
0
24
/10
/20
20
-3
0/1
0/2
02
0
07
/11
/20
20
-1
3/1
1/2
02
0
21
/11
/20
20
-2
7/1
1/2
02
0
05
/12
/20
20
-1
1/1
2/2
02
0
19
/12
/20
20
-2
5/1
2/2
02
0
02
/01
/20
21
-0
8/0
1/2
02
1
16
/01
/20
21
-2
2/0
1/2
02
1
30
/01
/20
21
-0
5/0
2/2
02
1
13
/02
/20
21
-1
9/0
2/2
02
1
27
/02
/20
21
-0
5/0
3/2
02
1
13
/03
/20
21
-1
9/0
3/2
02
1
27
/03
/20
21
-0
2/0
4/2
02
1
10
/04
/20
21
-1
6/0
4/2
02
1
17
/04
/20
21
-2
3/0
4/2
02
1
01
/05
/20
21
-0
7/0
5/2
02
1
15
/05
/20
21
-2
1/0
5/2
02
1
29
/05
/20
21
-0
4/0
6/2
02
1
12
/06
/20
21
-18
/06
/20
21
26
/06
/20
21
-02
/07
/20
21
1st Wave 2nd Wave 3rd Wave
Female Male
3
2
1 1 1 1
3
2
108
159
5
88
7
9 16 11 15 21 23
3922 20 21
14
710 12
7
7
20 3477
130177176
197279277237
161
1
2
1 1
2
6
9
810 9
8
9
10
9
4 6 5
11 1210
7
4 5 8 2
43
4
1
2
1 25
817
37
53 76 73
6571
33 5 7 4 4
13
5 3 75
34 8
35 4 3
33 4 4
12
1 1
419 16 19
42 52 49
46 46
1 1 11
1 4 932 171 1 1 2 3 2
28
/03
/20
20
-0
3/0
4/2
02
0
02
/05
/20
20
-0
8/0
5/2
02
0
30
/05
/20
20
-0
5/0
6/2
02
0
12
/09
/20
20
-1
8/0
9/2
02
0
24
/10
/20
20
-3
0/1
0/2
02
0
07
/11
/20
20
-1
3/1
1/2
02
0
21
/11
/20
20
-2
7/1
1/2
02
0
05
/12
/20
20
-1
1/1
2/2
02
0
19
/12
/20
20
-2
5/1
2/2
02
0
02
/01
/20
21
-0
8/0
1/2
02
1
16
/01
/20
21
-2
2/0
1/2
02
1
30
/01
/20
21
-0
5/0
2/2
02
1
13
/02
/20
21
-1
9/0
2/2
02
1
27
/02
/20
21
-0
5/0
3/2
02
1
13
/03
/20
21
-1
9/0
3/2
02
1
27
/03
/20
21
-0
2/0
4/2
02
1
10
/04
/20
21
-1
6/0
4/2
02
1
17
/04
/20
21
-2
3/0
4/2
02
1
01
/05
/20
21
-0
7/0
5/2
02
1
15
/05
/20
21
-2
1/0
5/2
02
1
29
/05
/20
21
-0
4/0
6/2
02
1
12
/06
/20
21
-18
/06
/20
21
26
/06
/20
21
-02
/07
/20
21
1st Wave 2nd Wave 3rd Wave
Sinhalese Moor Tamil Burger Other

COVID-19 DEATH WEEKLY ANALYSIS, EPIDEMIOLOGY UNIT/ JUNE 26, 2021– JULY 02, 2021
FIGURE 12: COVID-19 DEATH COUNTS BY PLACE OF DEATH – WEEKLY ANALYSIS
FIGURE 13: COVID-19 DEATH COUNTS BY AGE CATEGORIES – WEEKLY ANALYSIS
4
3
1 1 1 1 1 1
3
410 9
22
9
14
11
9
1610
25 1726
3037
3524
26 29
14
13
1318
9 11 2234 78
129151171215297313291
247
1
2
4 53
2
6
3
5
5
2
4 32
2
1
32
2
31 4
416
16 16 22 3327 15
1437 9
98
3 47
1
4
1 1 16
3
115 3
1
5
1 1 1 1 2 3 1242 45 55 83 70 75
34
28
/03
/20
20
-0
3/0
4/2
02
0
02
/05
/20
20
-0
8/0
5/2
02
0
30
/05
/20
20
-0
5/0
6/2
02
0
12
/09
/20
20
-1
8/0
9/2
02
0
24
/10
/20
20
-3
0/1
0/2
02
0
07
/11
/20
20
-1
3/1
1/2
02
0
21
/11
/20
20
-2
7/1
1/2
02
0
05
/12
/20
20
-1
1/1
2/2
02
0
19
/12
/20
20
-2
5/1
2/2
02
0
02
/01
/20
21
-0
8/0
1/2
02
1
16
/01
/20
21
-2
2/0
1/2
02
1
30
/01
/20
21
-0
5/0
2/2
02
1
13
/02
/20
21
-1
9/0
2/2
02
1
27
/02
/20
21
-0
5/0
3/2
02
1
13
/03
/20
21
-1
9/0
3/2
02
1
27
/03
/20
21
-0
2/0
4/2
02
1
10
/04
/20
21
-1
6/0
4/2
02
1
17
/04
/20
21
-2
3/0
4/2
02
1
01
/05
/20
21
-0
7/0
5/2
02
1
15
/05
/20
21
-2
1/0
5/2
02
1
29
/05
/20
21
-0
4/0
6/2
02
1
12
/06
/20
21
-18
/06
/20
21
26
/06
/20
21
-02
/07
/20
21
1st Wave 2nd Wave 3rd Wave
Hospital On admission Home Other
1
1 1 11 1 1 11
3 3 1 4 1 6 51
1
11
4
1 1 1 2 12
1 3 2 5 4 9 10 7 6 7
2
1 1 1
1
26 1
31 1
2
23 2
4 6 6
1
1
3
1
17
6 13 7 21 15 18 24 21 10
1
1 1 1
23
2 5
33 3
3
4
2
6
1 2 45 5
2
56
11
1 11
4 5
13 2225
27 44 55 62 42 45
1
1
1
38
2
5
2
54
4 7
3
8
710
13 10 14
10
77
2
6 4
4 24
310
22 43
5255
8496 93
91
85
3
1
3
3
8
13
10
3 6
76
8
77 8
1113 13
11 9
14
11
6
4
104
49
1229 50
84 7791
14214714083
13
66
7 54
3 34
5 3 5 5 7 10 7 7
3
4
1
6
11 1 3 5 13 26 34 45 49
88 76 74 58
28
/03
/20
20
-0
3/0
4/2
02
0
02
/05
/20
20
-0
8/0
5/2
02
0
30
/05
/20
20
-0
5/0
6/2
02
0
12
/09
/20
20
-1
8/0
9/2
02
0
24
/10
/20
20
-3
0/1
0/2
02
0
07
/11
/20
20
-1
3/1
1/2
02
0
21
/11
/20
20
-2
7/1
1/2
02
0
05
/12
/20
20
-1
1/1
2/2
02
0
19
/12
/20
20
-2
5/1
2/2
02
0
02
/01
/20
21
-0
8/0
1/2
02
1
16
/01
/20
21
-2
2/0
1/2
02
1
30
/01
/20
21
-0
5/0
2/2
02
1
13
/02
/20
21
-1
9/0
2/2
02
1
27
/02
/20
21
-0
5/0
3/2
02
1
13
/03
/20
21
-1
9/0
3/2
02
1
27
/03
/20
21
-0
2/0
4/2
02
1
10
/04
/20
21
-1
6/0
4/2
02
1
17
/04
/20
21
-2
3/0
4/2
02
1
01
/05
/20
21
-0
7/0
5/2
02
1
15
/05
/20
21
-2
1/0
5/2
02
1
29
/05
/20
21
-0
4/0
6/2
02
1
12
/06
/20
21
-18
/06
/20
21
26
/06
/20
21
-02
/07
/20
21
1st Wave 2nd Wave 3rd Wave
0-9 10-19 20-29 30-39 40-49 50-59 60-69 70-79 ≥80

COVID-19 DEATH WEEKLY ANALYSIS, EPIDEMIOLOGY UNIT/ JUNE 26, 2021– JULY 02, 2021
FIGURE 14: DISTRIBUTION OF CO-MORBIDITIES AMONG DEATHS– WEEKLY ANALYSIS
FIGURE 15: DISTRIBUTION OF CO-MORBIDITIES AMONG DEATHS– WEEKLY ANALYSIS
3
4 1 1 1 1 1 8 1 59
2219 28 21
1216 17 20
1327 16
27 33 36 4229 15 29
1412 26 17
1120 36 73 132
157190248329263175148
1 22 5 2
42 3 2
33 3
1 3 5 6 1 34
2 3 3 3 4 12 2451 42 43 82 48 15 8
0%10%20%30%40%50%60%70%80%90%
100%2
8/0
3/2
02
0 -
03
/04
/20
20
02
/05
/20
20
-0
8/0
5/2
02
0
30
/05
/20
20
-0
5/0
6/2
02
0
12
/09
/20
20
-1
8/0
9/2
02
0
17
/10
/20
20
-2
3/1
0/2
02
0
31
/10
/20
20
-0
6/1
1/2
02
0
14
/11
/20
20
-2
0/1
1/2
02
0
28
/11
/20
20
-0
4/1
2/2
02
0
12
/12
/20
20
-1
8/1
2/2
02
0
26
/12
/20
20
-0
1/0
1/2
02
1
09
/01
/20
21
-1
5/0
1/2
02
1
23
/01
/20
21
-2
9/0
1/2
02
1
06
/02
/20
21
-1
2/0
2/2
02
1
20
/02
/20
21
-2
6/0
2/2
02
1
06
/03
/20
21
-1
2/0
3/2
02
1
20
/03
/20
21
-2
6/0
3/2
02
1
03
/04
/20
21
-0
9/0
4/2
02
1
17
/04
/20
21
-2
3/0
4/2
02
1
01
/05
/20
21
-0
7/0
5/2
02
1
15
/05
/20
21
-2
1/0
5/2
02
1
29
/05
/20
21
-0
4/0
6/2
02
1
12
/06
/20
21
-18
/06
/20
21
26
/06
/20
21
-02
/07
/20
21
1st Wave 2nd Wave 3rd Wave
Without With
0%
10%
20%
30%
40%
50%
60%
70%
80%
90%
100%
28
/03
/20
20
-0
3/0
4/2
02
0
02
/05
/20
20
-0
8/0
5/2
02
0
30
/05
/20
20
-0
5/0
6/2
02
0
12
/09
/20
20
-1
8/0
9/2
02
0
17
/10
/20
20
-2
3/1
0/2
02
0
31
/10
/20
20
-0
6/1
1/2
02
0
14
/11
/20
20
-2
0/1
1/2
02
0
28
/11
/20
20
-0
4/1
2/2
02
0
12
/12
/20
20
-1
8/1
2/2
02
0
26
/12
/20
20
-0
1/0
1/2
02
1
09
/01
/20
21
-1
5/0
1/2
02
1
23
/01
/20
21
-2
9/0
1/2
02
1
06
/02
/20
21
-1
2/0
2/2
02
1
20
/02
/20
21
-2
6/0
2/2
02
1
06
/03
/20
21
-1
2/0
3/2
02
1
20
/03
/20
21
-2
6/0
3/2
02
1
03
/04
/20
21
-0
9/0
4/2
02
1
17
/04
/20
21
-2
3/0
4/2
02
1
01
/05
/20
21
-0
7/0
5/2
02
1
15
/05
/20
21
-2
1/0
5/2
02
1
29
/05
/20
21
-0
4/0
6/2
02
1
12
/06
/20
21
-18
/06
/20
21
26
/06
/20
21
-02
/07
/20
21
1st Wave 2nd Wave 3rd Wave
Other
Tuberculosis
Cancer
Dyslipidemia
Chronic Liver Cell Disease
Chronic Obstructive PulmonaryDisease
Cerebro-Vascular Accident
Bronchial Asthma
Chronic Kidney Disease
Ischemic Heart Disease
Hypertension
Diabetes Mellitus