Embed Size (px)
Citation preview

Incidence, clinical characteristics and prognostic factor of patients with
COVID-19: a systematic review and meta-analysis
Running title: Predictors of clinical prognosis of COVID-19
Chaoqun Ma, MD1†; Jiawei Gu, MD2†; Pan Hou, MD1†; Liang Zhang,
MD1; Yuan Bai, MD1; Zhifu Guo, MD1; Hong Wu, MD1; Bili Zhang,
MD1*; Pan Li, MD, MD1*; Xianxian Zhao, MD, FACC, FESC1*
1Department of Cardiology, Changhai Hospital, Second Military Medical
University, 168 Changhai Rd, Shanghai, 200433, China.
2Department of General Surgery, The Fifth People's Hospital of Shanghai,
Fudan University, Shanghai, 801 Heqing Rd, 200240, China.
†These authors contributed equally to this work.
*Corresponding Authors:
Xianxian Zhao, MD, FACC, FESC, Department of Cardiology, Changhai
Hospital, Second Military Medical University, 168 Changhai Rd,
Shanghai, 200433, China. (E-mail: [email protected]; Tel/Fax:
0086-021-31161255)
And
Pan Li, MD, Department of Cardiology, Changhai Hospital, Second
Military Medical University, 168 Changhai Rd, Shanghai, 200433, China.
(E-mail: [email protected]; Tel/Fax: 0086-021-31161265)
All rights reserved. No reuse allowed without permission. (which was not certified by peer review) is the author/funder, who has granted medRxiv a license to display the preprint in perpetuity.
The copyright holder for this preprintthis version posted March 20, 2020. .https://doi.org/10.1101/2020.03.17.20037572doi: medRxiv preprint

And
Bili Zhang, MD, Department of Cardiology, Changhai Hospital, Second
Military Medical University, 168 Changhai Rd, Shanghai, 200433, China.
(E-mail: [email protected]; Tel/Fax: 0086-021-31161264)
All rights reserved. No reuse allowed without permission. (which was not certified by peer review) is the author/funder, who has granted medRxiv a license to display the preprint in perpetuity.
The copyright holder for this preprintthis version posted March 20, 2020. .https://doi.org/10.1101/2020.03.17.20037572doi: medRxiv preprint
Abstract
Background: Recently, Coronavirus Disease 2019 (COVID-19) outbreak
started in Wuhan, China. Although the clinical features of COVID-19
have been reported previously, data regarding the risk factors associated
with the clinical outcomes are lacking.
Objectives: To summary and analyze the clinical characteristics and
identify the predictors of disease severity and mortality.
Methods: The PubMed, Web of Science Core Collection, Embase,
Cochrane and MedRxiv databases were searched through February 25,
2020. Meta-analysis of Observational Studies in Epidemiology (MOOSE)
recommendations were followed. We extracted and pooled data using
random-e�ects meta-analysis to summary the clinical feature of the
confirmed COVID-19 patients, and further identify risk factors for
disease severity and death. Heterogeneity was evaluated using the I²
method and explained with subgroup analysis and meta-regression.
Results: A total of 30 studies including 53000 patients with COVID-19
were included in this study, the mean age was 49.8 years (95% CI,
47.5-52.2 yrs) and 55.5% were male. The pooled incidence of severity
and mortality were 20.2% (95% CI, 15.1-25.2%) and 3.1% (95% CI,
1.9-4.2%), respectively. The predictor for disease severity included old
age (≥ 50 yrs, odds ratio [OR] = 2.61; 95% CI, 2.29-2.98), male (OR
=1.348, 95% CI, 1.195-1.521), smoking (OR =1.734, 95% CI,
All rights reserved. No reuse allowed without permission. (which was not certified by peer review) is the author/funder, who has granted medRxiv a license to display the preprint in perpetuity.
The copyright holder for this preprintthis version posted March 20, 2020. .https://doi.org/10.1101/2020.03.17.20037572doi: medRxiv preprint
1.146-2.626) and any comorbidity (OR = 2.635, 95% CI, 2.098-3.309),
especially chronic kidney disease (CKD, OR = 6.017; 95% CI,
2.192-16.514), chronic obstructive pulmonary disease (COPD, OR =
5.323; 95% CI, 2.613-10.847) and cerebrovascular disease (OR = 3.219;
95% CI, 1.486-6.972). In terms of laboratory results, increased lactate
dehydrogenase (LDH), C-reactive protein (CRP) and D-dimer and
decreased blood platelet and lymphocytes count were highly associated
with severe COVID-19 (all for P < 0.001). Meanwhile, old age (≥ 60 yrs,
RR = 9.45; 95% CI, 8.09-11.04), followed by cardiovascular disease (RR
= 6.75; 95% CI, 5.40-8.43) hypertension (RR = 4.48; 95% CI, 3.69-5.45)
and diabetes (RR = 4.43; 95% CI, 3.49-5.61) were found to be
independent prognostic factors for the COVID-19 related death.
Conclusions: To our knowledge, this is the first evidence-based medicine
research to explore the risk factors of prognosis in patients with
COVID-19, which is helpful to identify early-stage patients with poor
prognosis and adapt effective treatment.
All rights reserved. No reuse allowed without permission. (which was not certified by peer review) is the author/funder, who has granted medRxiv a license to display the preprint in perpetuity.
The copyright holder for this preprintthis version posted March 20, 2020. .https://doi.org/10.1101/2020.03.17.20037572doi: medRxiv preprint
Introduction
Coronaviruses are a family of viruses that widely exist in nature and can
infect both humans and animals1. At present, there are six recognized
types of coronavirus that can cause infection in humans, leading to
pneumonia, injury in the digestive tracts, kidney failure and even death.
Two of the coronavirus family have been reported to cause deadly
infections including Middle East Respiratory Syndrome (MERS) and
Severe Acute Respiratory Syndrome (SARS)2,3. Recently, pneumonia
caused by a novel coronavirus (SARS-CoV-2), also termed as
Coronavirus Disease 2019 (COVID-19) was first reported in China’s
Wuhan City, Hubei Province in December 2019 and the disease spread
rapidly in China and even around the world4.
Compared with two other types of coronaviruses, the present new
coronavirus is spreading far more quickly and has higher contagiousness5.
As of March 17, 2020, a total of 187, 361 COVID-19 cases in 151
countries have been confirmed, which almost 22.2 times the number of
people infected by the SARS in 2003. Although COVID-19 has a
relatively low mortality rate, it can be highly deadly and lethal,
especially in high-risk patients6. The reported incidence of COVID-19
accompanied with underlying comorbidities in the literature were up to
26.0%, and most of them (65.3%) had cardiovascular and cerebrovascular
diseases. Patients infected with SARS-CoV-2 who already have
All rights reserved. No reuse allowed without permission. (which was not certified by peer review) is the author/funder, who has granted medRxiv a license to display the preprint in perpetuity.
The copyright holder for this preprintthis version posted March 20, 2020. .https://doi.org/10.1101/2020.03.17.20037572doi: medRxiv preprint
underlying diseases were at increased the risk of severe illnesses and
death7.
And more worrying, there is no vaccine and specific treatment
available for this novel coronavirus as of now8. Therefore, it is necessary
to identify potential risk factors for predicting the disease progression
and severity for COVID-19. Meanwhile, early monitoring the predictive
indicators may also increase the efficiency of treatment and improve the
prognosis of COVID-19. Thus, the aim of our study is to perform a
systematic review and meta-analysis of clinical characteristics to explore
the risk factors of COVID-19-associated severe illness and death, and
first time to compare the differences of those predictors between
COVID-19, SARS and MERS.
Methods
Our study was performed according to the Preferred Reporting Items for
Systematic Reviews and Meta-Analyses (PRISMA) statement and
Meta-analysis of Observational Studies in Epidemiology (MOOSE)
reporting guidelines9,10. In eMethods in the Supplement, we describe the
detailed definitions of COVID-19 laboratory confirmed cases and severe
illness.
Search strategy and study selection
PubMed, Embase, Cochrane, the Web of Science Core Collection
All rights reserved. No reuse allowed without permission. (which was not certified by peer review) is the author/funder, who has granted medRxiv a license to display the preprint in perpetuity.
The copyright holder for this preprintthis version posted March 20, 2020. .https://doi.org/10.1101/2020.03.17.20037572doi: medRxiv preprint

(Clarivate Analytics), and MedRxiv databases were used for searching
articles published until February 25, 2020 using the following keywords:
“coronavirus”, “nCoV”, “HCoV”, “Wuhan”, “2019” “SARS-CoV-2”,
“COVID*”, “NCP*”, “China”, “clinical”, “outcome”, “sever*”, “death”,
“fatali*” and “mortalit*” alone and in combination. Detailed search
strategies were presented in eMethods in the Supplement. After removing
duplicates, three reviewers (C.M. & J.G. & P. H) were assigned to
independently screen the titles and abstracts and then examine the full
text, and any questions with conflict were resolved by the senior authors
(P. L. and X. Z.). Inclusion criteria were as follows: (1) any study that
gives information about the clinical characteristics or demographic or
outcome of the infectious disease, (2) restriction language to English only,
and (3) studies that allowed us to stratify the risk of severe or fatal
COVID-19 by demographic or medical condition were preferred.
Exclusion criteria were (1) data that could not be reliably extracted, (2)
editorials, comments, expert opinions, case reports or articles with
number of patients ≤ 10, (3) studies with special populations (eg, only
focused on family clusters or severe or death cases).
Data extraction and quality assessment
Two authors (C.M. and J.G.) independently extracted the data using a
predesigned spreadsheet, including author’s name, publication year, study
period, geographical region, study design, epidemiological information,
All rights reserved. No reuse allowed without permission. (which was not certified by peer review) is the author/funder, who has granted medRxiv a license to display the preprint in perpetuity.
The copyright holder for this preprintthis version posted March 20, 2020. .https://doi.org/10.1101/2020.03.17.20037572doi: medRxiv preprint
sample size, baseline and clinical characteristics, laboratory results,
severity and outcomes. For the study cohort divided according to disease
severity, data of all patients, severe and non-severe patients were
collected, respectively. For further meta-analysis, categorical variables
like sex, comorbidities, symptoms or endpoint events, number were dealt
with as dichotomous variables, while for continuous variables such as age,
laboratory results or timelines of illness, different types of measurement
including median (range) or median (IQR, interquartile range) were
transferred to the form of mean (SD, standard deviation)10.
Along with data extraction, study quality was assessed using the Quality
Assessment Forms recommended by Agency for Healthcare Research and
Quality (AHRQ) for cross-sectional study (eMethods in supplement)11.
Conflicts on the assessments were resolved either by consensus or by the
adjudicator (P.L. and X. Z.).
Data analysis
Firstly, to obtain summary e�ect estimate for each clinical variable,
including case severity rate (CSR), case fatality rate (CFR), male
proportion, mean age, pooled value of lymphocyte count and timeline of
COVID-19 confirmed patients, random e�ects meta-analysis was used
because high variability between studies was expected. Heterogeneity
was evaluated using the I² statistic. Cut-off values of 25%, 50%, and 75%
indicated low, moderate, and high heterogeneity, respectively12. We
All rights reserved. No reuse allowed without permission. (which was not certified by peer review) is the author/funder, who has granted medRxiv a license to display the preprint in perpetuity.
The copyright holder for this preprintthis version posted March 20, 2020. .https://doi.org/10.1101/2020.03.17.20037572doi: medRxiv preprint

visualized the results with forest plots. Secondly, to identify the risk
factors for severity, pooled odds ratios (ORs) with 95% CIs were
estimated with the dichotomous method, and mean difference (MD) with
95% CIs between severe and non-severe cases were calculated with
continuous method, Fixed effects model was used when I² < 50%, and
random effects models otherwise. Regarding the COVID-19 related death,
we conducted logistic regression model to calculate relative risks (RR)
with 95% CIs using the data of Chinese Center for Disease Control,
which included 44672 laboratory confirmed patients. Thirdly, to explore
potential sources of heterogeneity, we conducted subgroup analysis and
random-e�ects meta-regression. Variables significant in univariable
meta-regression (P < 0.05) were included in multivariable
meta-regression. Next, sensitivity analyses were performed by
systematically removing each study in turn to explore its effect on
outcome13.
Finally, to investigate the risk of publication bias, we applied the
Begger test, Egger test and the test used by Peters et al and visually
inspected the funnel plots14. All analyses were performed using Review
Manager (version5.3), Stata (version 15) and R (version 3.5.3), RStudio
(version 1.2.1335) and Comprehensive Meta-analysis (version 3.3).
Results
Literature Search and Study Characteristics
All rights reserved. No reuse allowed without permission. (which was not certified by peer review) is the author/funder, who has granted medRxiv a license to display the preprint in perpetuity.
The copyright holder for this preprintthis version posted March 20, 2020. .https://doi.org/10.1101/2020.03.17.20037572doi: medRxiv preprint
We identified 854 studies, of which 30 were eligible for our analysis
including 53,000 COVID-19 confirmed patients (Figure 1)1,7,15-38. All of
them were retrospective, observational studies (19 single-center and 11
multi-center studies), which were performed between December 2019
and February 19, 2020. The majority of studies were conducted in Wuhan
(13, 43.3%) and other cities in China (11, 36.7%), 2 from nationwide and
3 from other countries including United States, Australia and Korea. To
avoid any overlap of cases, the nationwide study of Chinese Centers for
Disease Control (CDC) including 44672 confirmed cases was only used
for identifying COVID-19 related death risk factors. The male to female
sex ratio was 1.25, with an overall average age of 49.8 years (95% CI,
47.5-52.2). Five studies included the information of COVID-19 infected
medical staff (Table 1).
Case Severity Rate and Case Fatality Rate
18 studies listed the number of severe cases, with pooled CSR 20.2% (95%
CI, 15.1-25.2%, n = 18, I2 = 92%). The proportion of severe illness in
Wuhan subgroup was higher than outside of Wuhan in China (36.9%; [95%
CI, 26.7-47.0%]; n = 7 vs. 10.9%; [95% CI, 6.7-15.1%]; n = 7, P <
0.001]). Of note, the overall case fatality rate (CFR) was 3.1% (95% CI,
1.9-4.2%, n = 23, I2 = 75%). Subgroup analysis showed a significantly
higher CFR in Wuhan than outside Wuhan (9.5%; [95% CI, 5.2-13.8%]; n
= 10 vs. 0.2%; [95% CI, 0-0.5%]; n = 8, P < 0.001) (Figure 1).
All rights reserved. No reuse allowed without permission. (which was not certified by peer review) is the author/funder, who has granted medRxiv a license to display the preprint in perpetuity.
The copyright holder for this preprintthis version posted March 20, 2020. .https://doi.org/10.1101/2020.03.17.20037572doi: medRxiv preprint
Univariate meta-regression showed that compared with Wuhan, CSR
and CFR in other areas were significantly lower (all for P < 0.0001),
which was consistent with the subgroup analysis. Although not
statistically significant, CSR and CFR showed a decreasing trend over
time. In addition, onset-to-admission time were identified closely
correlation with CSR (4.99% per increase in days, P = 0.0047) and CFR
(1.97% per increase in days, P < 0.0001), suggesting shortening the
onset-to-admission time favored COVID-19 related outcomes.
Multivariate meta-regression confirmed the close correlation between
onset-to-admission time and CFR (1.27% per increase in days, P =
0.0263). (Table 2 and Figure 3).
Clinical characteristics and laboratory results
Clinical and laboratory data from 26 studies, including 1374 severe and
4326 non-severe patients, were extracted for meta-analysis. Of this, 7.7%
patients (95% CI, 3.6-11.8%) were medical staff. The pooled CFR of
severe patients was significantly higher than non-severe patients (6.0%;
[95% CI, 4.6-7.3%] vs. 0.1%; [95% CI, 0-0.2%], P < 0.001). The mean
incubation period was 7.10 days (95% CI, 6.06-8.14 d), with no
statistically difference between severe and non-severe cases. The mean
time from symptom onset to hospital admission was 6.18 days (95% CI,
5.23-7.12 d), which is longer in severe cases than that in non-severe cases
(6.56 d vs. 4.81d, P = 0.023) and in Wuhan than outside (7.23 d vs.4.86 d,
All rights reserved. No reuse allowed without permission. (which was not certified by peer review) is the author/funder, who has granted medRxiv a license to display the preprint in perpetuity.
The copyright holder for this preprintthis version posted March 20, 2020. .https://doi.org/10.1101/2020.03.17.20037572doi: medRxiv preprint

P = 0.027).
Severe cases presented with older age (54.5 yrs; [95% CI, 55.5-61.4 yrs]
vs. 44.5 yrs; [95% CI, 42.0-47.1 yrs], P < 0.001) and higher ratio of male
(59.7%; [95% CI, 55.0-64.3%] vs. 51.9; [95% CI, 46.6-57.2%], P <
0.001), as compared with non-severe cases. Similarly, patients in Wuhan
were older than those outside Wuhan (55.7 yrs vs. 41.6 yrs, P < 0.001).
Fever (79.1%; 95% CI, 68.0-90.3%), cough (58.0%; 95% CI, 42.0-74.0%)
and fatigue (29.3%; 95% CI, 23.4-35.3%) were the dominant symptoms,
whereas digestive symptoms such as diarrhea (5.7%; 95%CI 3.9-7.5%),
nausea or vomiting (2.0%; 95% CI, 1.0-2.9%) were relatively rare. The
overall prevalence of any comorbidity was 37.1% (95% CI, 28.1-46.1%),
with higher incidence rate in severe cases than non-severe cases (54.9%
vs. 27.6%, P = 0.006), and higher in Wuhan than other areas (45.1% vs.
28.8%, P = 0.01). The most common comorbidities were hypertension
(19.0%, 95% CI, 13.2-24.9%), followed by diabetes (8.2%, 95% CI,
6.3-10.0%) and cardiovascular diseases (CVD, 2.7%, 95% CI, 1.4-4.1%).
Moreover, hypertension, diabetes, CVD, cerebrovascular diseases,
chronic obstructive pulmonary disease (COPD) and chronic kidney
disease (CKD) were significantly more common in severe cases as
compared with non-severe cases (all for P < 0.05). The overall proportion
of bilateral radiologic abnormalities was 87.2% (95% CI, 82.1-92.3%),
with significant difference between inside and outside Wuhan (91.6% vs.
All rights reserved. No reuse allowed without permission. (which was not certified by peer review) is the author/funder, who has granted medRxiv a license to display the preprint in perpetuity.
The copyright holder for this preprintthis version posted March 20, 2020. .https://doi.org/10.1101/2020.03.17.20037572doi: medRxiv preprint

82.6%, P = 0.018).
In terms of the laboratory index, several elevated indicators were
observed as follows: C-reaction protein (CRP, 26.07 mg/L; 95% CI,
20.69-31.44 mg/L), erythrocyte sedimentation rate (ESR, 46.54 mm/h; 95%
CI, 33.31-59.78 mm/h), lactate dehydrogenase (LDH, 287.48 U/L; 95%
CI, 260.76-314.20 U/L), cardiac troponin I (cTnI, 4.54 pg/mL,; 95% CI,
-1.17-10.24 pg/mL) and ferritin (724.44 ng/mL; 95%CI, 356.28-1092.60
ng/mL). In contrast, the level albumin (37.31 g/L; 95% CI, 34.33-40.28
g/L) and lymphocytes count (1.18 × 10�/L; 95% CI, 1.00-1.36 × 10�/L)
were below normal level. Of note, obvious differences in laboratory index
were identified between severe and non-severe cases, as well as between
Wuhan and outside Wuhan. Elevated level of CRP, LDH and D-dimer,
together with reduced level of lymphocytes count and PLT count were the
prominent features of severe cases (all for P < 0.001). Likewise, more
elevated CRP, myoglobin, aspartate aminotransferase (AST) and ferritin,
followed by decreased lymphocyte count and hemoglobin were observed
in Wuhan patients than outside (all for P < 0.001) (Table 2).
Risk factors for severity of COVID-19
Among the baseline characteristics, disease severity was highly
associated with old age (≥ 50 yrs, OR = 2.609; 95% CI, 2.288-2.976; n =
5; I2 = 37%), male (OR =1.348; 95% CI, 1.195-1.521; n = 13; I2 = 0%),
smoking (OR =1.734; 95% CI, 1.146-2.626; n = 4; I2 = 0%) and any
All rights reserved. No reuse allowed without permission. (which was not certified by peer review) is the author/funder, who has granted medRxiv a license to display the preprint in perpetuity.
The copyright holder for this preprintthis version posted March 20, 2020. .https://doi.org/10.1101/2020.03.17.20037572doi: medRxiv preprint
comorbidity (OR = 2.635; 95% CI, 2.098-3.309; n = 7; I2 = 12%).
Comorbidities with pooled OR larger than 2 included CKD (6.02; 95% CI,
2.19-16.51; n = 4; I2 = 0), COPD (5.32; 95% CI, 2.61-10.85; n = 6; I2 =
0%), cerebrovascular diseases (3.19; 95% CI, 1.51-6.77; n = 6; I2 = 0%),
tumor (3.21; 95% CI, 1.42-7.24; n = 4; I2 = 30%), diabetes (2.49; 95% CI,
1.82-3.4; n = 10; I2 = 44%) and hypertension (2.06; 95% CI, 1.61-2.62; n
= 10; I2 = 36%) (Figure 4, eFigure 5).
In terms of laboratory results, there were obvious difference between
severe and non-severe cases in PLT (MD = -30.654 × 10⁹/L, 95% CI,
-38.7 to -22.61, n = 8), lymphocyte count (MD = -0.376 × 10⁹/L , 95%
CI, -0.467 to -0.285, n = 11), LDH (MD = 150.702 U/L, 95% CI, 82.569
to 218.836, n = 5), D-dimer (MD = 0.715 mg/L, 95% CI, 0.562 to 0.868,
n = 7) and CRP (MD = 30.395 mg/L, 95% CI, 20.006 to 40.784, n = 10).
Meanwhile, the ORs were calculated for several index including
lymphocytopenia (OR = 4.23; 95% CI, 3.03-6.03; I2 = 33%),
thrombocytopenia (OR = 2.84; 95% CI, 2.00-4.04; I2 = 49%), elevated
D-dimer (OR = 3.17; 95% CI, 1.86-5.41; I2 = 69%) and elevated CRP
(OR = 4.23; 95% CI, 2.94-6.08; I2 = 25%). (Figure 5, eFigure 6-7).
Comparison of Clinical Characteristics and risk factors among
COVID-19, SARS and MERS
The most common comorbidity was diabetes for both SARS (24.0%) and
All rights reserved. No reuse allowed without permission. (which was not certified by peer review) is the author/funder, who has granted medRxiv a license to display the preprint in perpetuity.
The copyright holder for this preprintthis version posted March 20, 2020. .https://doi.org/10.1101/2020.03.17.20037572doi: medRxiv preprint
MERS (68.0%), while hypertension for COVID-19 (19.0%). Fever and
cough were the dominant symptoms for all three viruses, whereas
digestive symptoms and chill were relatively rare for COVID-19.
Regarding laboratory index, elevated LDH was common for three
coronaviruses; higher incidence of lymphopenia, elevated AST or ALT
was observed in COVID-19 and SARS than MERS39,40. (Table 4).
Both old age and comorbidity proved the common risk factors for
predicting death among three coronaviruses. In support, COVID-19
related death was associated with old age ( ≥ 60 yrs, RR = 9.45; 95% CI,
8.09-11.04), male (RR = 1.67, 95% CI, 1.47-1.89) and any comorbidity
(5.86; 95% CI, 4.77-7.19), most notably CVD (6.75; 95% CI, 5.40-8.43)
followed by hypertension (4.48; 95% CI, 3.69-5.45) and diabetes (4.43;
95% CI, 3.49-5.61). Similar with COVID-19, male (RR = 1.6; 95% CI,
1.2-2.1) and CVD (OR = 3.5; 95% CI, 3.1-4.8) were also risk factors for
MERS related death41,42. In contrast, the most predominant risk factor for
SARS related death was CKD (9.02; 95% CI, 3.81-21.36), and the risk of
male gender was not statistically significant3,43,44. In addition, medical
staff had a lower fatality rate than non-clinical staff for COVID-19 (RR =
0.12; 95% CI, 0.05-0.30) and MERS (RR = 0.1; 95% CI, 0.02-0.20),
whereas the difference was not significant for SARS (RR = 0.76; 95% CI,
0.52-1.15). (Table 5).
Sensitivity Analysis and Publication Bias
All rights reserved. No reuse allowed without permission. (which was not certified by peer review) is the author/funder, who has granted medRxiv a license to display the preprint in perpetuity.
The copyright holder for this preprintthis version posted March 20, 2020. .https://doi.org/10.1101/2020.03.17.20037572doi: medRxiv preprint

Leaving each trial out of the analysis one at a time revealed no
meaningful differences in CSR and CFR (eFigure 8 in supplement). We
observed no evidence of publication bias with inspection of the funnel
plot or with the Begger test or the test used by Peters et al (eFigure 9 in
supplement).
Discussion
The main findings of this present analysis are that: (1) Despite the high
incidence rate, the distinctive feature of COVID-19 was low severity and
mortality, showing a significant difference on the incidence of severity
and mortality between Wuhan and outside of Wuhan; (2) The
onset-to-admission time was closely related to mortality, which will be
increased about 1.27% with every day of delay in admission; (3) Older
age is a common risk factor for poor prognosis of the three coronavirus
diseases; Hypertension and cardiovascular diseases are the most relevant
clinical predictors for the death caused by both COVID-19 and
MERS-CoV, while chronic kidney disease is for SARS; (4) The five main
laboratory indicators of severe illness included lymphocytopenia,
thrombocytopenia and the rise of LDH, CRP and D-dimer.
SARS-CoV-2 has been reported to be higher contagious than
previously discovered human coronaviruses45. Until now, more than 187,
361 confirmed cases and caused 7, 485 deaths in 151 countries on six
continents were identified. Despite its high prevalence of COVID-19, the
All rights reserved. No reuse allowed without permission. (which was not certified by peer review) is the author/funder, who has granted medRxiv a license to display the preprint in perpetuity.
The copyright holder for this preprintthis version posted March 20, 2020. .https://doi.org/10.1101/2020.03.17.20037572doi: medRxiv preprint

pooled severe incidence and fatality rate is significantly lower compared
with SARS and MERS, which may explain why the novel coronavirus
has spread so widely46. Of note, there are regional and spatial differences
in the incidence rate of COVID-19. In our research, the pooled severity
rate and mortality caused by COVID-19 was found significantly higher in
Wuhan than that of the infected outside of Wuhan (all for P < 0.01). On
the other hand, disease incidence at the early stage of outbreak was higher
than that at the late stage, which may be caused by the lack of
recognitions and treatment experience for COVID-19. Moreover, the
longer time from symptoms to hospitalization, the higher incidence rate
of the mortality related to COVID-19, highlighting the importance of
timely medical treatment30. In addition, among the patients with
2019-nCoV, the pooled infection rate of medical staff was 7.7%, which
was lower than that of SARS (23%) and MERS (9.8%)39.
SARS-CoV-2, SARS-CoV and MERS-CoV belong to
high pathogenic coronaviruses, whereas each of which has its own
clinical manifestation. In comparison to SARS-CoV (4.6 days)
and MERS-CoV (5.2 days)47, COVID-19 has a longer latent period (7.1
days) and the initial manifestations are non-specific, making it more
difficult to prevent and control at early stage. Similar to
SARS and MERS, persons with COVID-19 often present initially with
lower respiratory signs, including fever, coughing and fatigue. In the late
All rights reserved. No reuse allowed without permission. (which was not certified by peer review) is the author/funder, who has granted medRxiv a license to display the preprint in perpetuity.
The copyright holder for this preprintthis version posted March 20, 2020. .https://doi.org/10.1101/2020.03.17.20037572doi: medRxiv preprint

course of illnesses, infected persons are characterized by progressive
breathing difficulty, tachypnea, acute respiratory distress syndrome, or
life-threatening complications. In fact, SARS-CoV-2 has been isolated
from respiratory secretions, feces, urine, blood, tears, and conjunctival
secretions48, indicating that SARS-CoV-2 infection is not confined to the
respiratory tract. Indeed, in our analysis, the pooled incidences rate of
respiratory symptom was present in 79.1% of patients, followed by 7.7%
with gastrointestinal disorders and 6.1% with neurological symptoms.
Therefore, the patients with COVID-19 whose initial symptom were out
of the lung should also be paid more attention, especially for those with
the contact history of COVID-19. It should be noted that the pooled
incidence of diarrhea symptoms (5.7%) is lower than previous data of
patients with MERS-CoV (25%) or SARS-CoV (26%) infection. In terms
of laboratory tests, the most common hematological abnormalities in
patients with COVID-19 were lymphopenia (54.7%), suggesting
aggressive effect on lymphocytes by COVID-19, which is similar to those
previously observed in patients with SARS (68-85%). In addition,
elevated levels of liver enzymes, LDH, myocardial enzymes, and
depressed platelet count concomitant with the rise of D-dimer was
observed in our study. Compare with MERS (36%) and SARS (45%),
thrombocytopenia was relatively less frequent in patients infected with
SARS-CoV-2 (12.8%)39,47.
All rights reserved. No reuse allowed without permission. (which was not certified by peer review) is the author/funder, who has granted medRxiv a license to display the preprint in perpetuity.
The copyright holder for this preprintthis version posted March 20, 2020. .https://doi.org/10.1101/2020.03.17.20037572doi: medRxiv preprint

Given the fact that the rapid progression to end-organ failure and even
death was occurred in some patients, it is therefore essential to paid more
attention to susceptible population of COVID-1949. Our results showed
the majority of the SARS-CoV-2 infection were male patients (55.5%)
similarly to the gender distribution of MERS (64.5%), while the
predominance of female patients (43.0%) was observed in SARS. It is
believed that the sex difference is probably related to the higher
expression of ACE2 receptor in male than that in female and the lack of
the protection of estrogen and X chromosome50. COVID-19 has affected
persons in all age groups; in particular, 53.5% patients were found after
more than 50 years, suggesting that the elderly patients are more likely to
have weak immune function. Moreover, 10-30% of patients in SARS and
37.1% of patients in COVID-19 had at least one underlying disorder;
patients with comorbidities such as diabetes mellitus, cardiovascular
diseases, renal failure and chronic respiratory diseases are especially
vulnerable to SARS-CoV-2 infection7. Owning to the pro-inflammatory
state and the reduced immune response, the chronic conditions were also
noted to have similar effects in the other two coronaviruses. Although the
comorbidities identified in our study has been described previously, their
value to predict the severity of COVID-19 has not yet been evaluated.
A focus on risk factor affecting clinical outcome is critically
important to identify high-risk patients and mitigate COVID-19
All rights reserved. No reuse allowed without permission. (which was not certified by peer review) is the author/funder, who has granted medRxiv a license to display the preprint in perpetuity.
The copyright holder for this preprintthis version posted March 20, 2020. .https://doi.org/10.1101/2020.03.17.20037572doi: medRxiv preprint

complications. In the present study, people with old age, male, smoking,
presence of comorbidity, CKD, COPD, cancer, hypertension, and
diabetes were identified as predictors of severe disease from COVID-19
infection. Importantly, old age, male gender and presence of comorbidity,
including hypertension, diabetes, cancer and respiratory disease, were
identified predictor of disease severity as well as mortality related to
COVID-19, suggesting that elderly patients with these underlying
comorbidities should be given more attention and care. In line with
previously published studies, the laboratory indicators including
lymphocytes, CRP, LDL, PLT, D-dimer, ALT and CK levels were
closely related to a poor prognosis, which provided key reference index
of the prognosis of COVID-19. In particular, lymphopenia,
thrombocytopenia and elevated D-dimer could act as effective predictors
of the COVID-19 severity. However, it was worth noting that increased
level of myoglobin and ferritin were observed in severe cases, but the
predictive value could not be estimated limited by the number of related
studies and further in-depth research is needed.
Limitation
Our meta-analysis has several potential limitations. Firstly, there was
obvious heterogeneity among studies regarding CSR and its subgroups,
because of differences in medical condition, study period, public
All rights reserved. No reuse allowed without permission. (which was not certified by peer review) is the author/funder, who has granted medRxiv a license to display the preprint in perpetuity.
The copyright holder for this preprintthis version posted March 20, 2020. .https://doi.org/10.1101/2020.03.17.20037572doi: medRxiv preprint

awareness and others. Nevertheless, we conducted meta-regression based
on the observation duration and symptom onset to hospital admission
time, which explained a large percent of heterogeneity. Secondly, studies
published before February 25, 2020 and articles published in English only
were included in our study, therefore there was lack of data from other
countries. However, our meta-analysis involved 53000 confirmed patients
based on the data during the early-to-mid period of disease outbreak in
China, which will provide great referential value for global epidemic
control. Thirdly, meta-analysis was conducted on the level of the studies
and the characteristics of individual patients could not be retrieved, thus it
was hard to provide reference for individualized diagnosis and treatment
of COVID-19. Finally, all included studies were retrospective, as no
randomized control trials and prospective studies related to 2019-nCoV
finish till now, thus our results require to be confirmed by more
high-quality clinical researches.
Conclusions:
COVID-19 is emerging all over the world and spreading at an
unprecedented rate, resulting in significant impacts on global economies
and public health. The present study successfully and systematically
evaluated the prognostic predictors of COVID-19 by collecting published
information on risk factors of the outcomes related to SARS-CoV-2
infections. Nevertheless, more investigations are needed to further
All rights reserved. No reuse allowed without permission. (which was not certified by peer review) is the author/funder, who has granted medRxiv a license to display the preprint in perpetuity.
The copyright holder for this preprintthis version posted March 20, 2020. .https://doi.org/10.1101/2020.03.17.20037572doi: medRxiv preprint

objectively confirm the clinical value of prognostic factors related to
COVID-19.
Reference
1. Q L, X G, P W, et al. Early Transmission Dynamics in Wuhan, China,
of Novel Coronavirus-Infected Pneumonia. The New England journal of
medicine 2020.
2. YM A, HH B, FG H, et al. 5.Middle East Respiratory Syndrome. The
New England journal of medicine 2017; 376: 584-94.
3. JS P, KY Y, AD O, K S. 10.The severe acute respiratory syndrome.
The New England journal of medicine 2003; 349: 2431-41.
4. E M. Covid-19: WHO declares pandemic because of "alarming
levels" of spread, severity, and inaction. BMJ (Clinical research ed) 2020;
368: m1036.
5. AC W, YJ P, MA T, A W, AT M, D V. Structure, Function, and
Antigenicity of the SARS-CoV-2 Spike Glycoprotein. Cell 2020.
6. T W, Z D, F Z, et al. Comorbidities and multi-organ injuries in the
All rights reserved. No reuse allowed without permission. (which was not certified by peer review) is the author/funder, who has granted medRxiv a license to display the preprint in perpetuity.
The copyright holder for this preprintthis version posted March 20, 2020. .https://doi.org/10.1101/2020.03.17.20037572doi: medRxiv preprint
treatment of COVID-19. Lancet (London, England) 2020.
7. The epidemiological characteristics of an outbreak of 2019 novel
coronavirus diseases (COVID-19) in China. Zhonghua liu xing bing xue
za zhi = Zhonghua liuxingbingxue zazhi 2020; 41: 145-51.
8. S P. Another Decade, Another Coronavirus. The New England
journal of medicine 2020; 382: 760-2.
9. L S, D M, M C, et al. Preferred reporting items for systematic review
and meta-analysis protocols (PRISMA-P) 2015: elaboration and
explanation. BMJ (Clinical research ed) 2015; 350: g7647.
10. DF S, JA B, SC M, et al. Meta-analysis of observational studies in
epidemiology: a proposal for reporting. Meta-analysis Of Observational
Studies in Epidemiology (MOOSE) group. JAMA 2000; 283: 2008-12.
11. J H, Y D, X C, et al. Prevalence of suicide attempts among Chinese
adolescents: A meta-analysis of cross-sectional studies. Comprehensive
psychiatry 2015; 61: 78-89.
12. JP H, SG T, JJ D, DG A. Measuring inconsistency in meta-analyses.
BMJ (Clinical research ed) 2003; 327: 557-60.
13. G K, J H. Improved tests for a random effects meta-regression with a
single covariate. Statistics in medicine 2003; 22: 2693-710.
14. JL P, AJ S, DR J, KR A, L R. Comparison of two methods to detect
publication bias in meta-analysis. JAMA 2006; 295: 676-80.
15. D W, B H, C H, et al. Clinical Characteristics of 138 Hospitalized
All rights reserved. No reuse allowed without permission. (which was not certified by peer review) is the author/funder, who has granted medRxiv a license to display the preprint in perpetuity.
The copyright holder for this preprintthis version posted March 20, 2020. .https://doi.org/10.1101/2020.03.17.20037572doi: medRxiv preprint

Patients With 2019 Novel Coronavirus-Infected Pneumonia in Wuhan,
China. JAMA 2020.
16. Zhong N-s. Clinical characteristics of 2019 novel coronavirus
infection in China: medRxiv; Feb. 9, 2020.
17. Liu J, Liu Y, Xiang P, et al. Neutrophil-to-Lymphocyte Ratio Predicts
Severe Illness Patients with 2019 Novel Coronavirus in the Early Stage.
medRxiv 2020.
18. KL B, AM O, OL M, et al. Persons Evaluated for 2019 Novel
Coronavirus-United States, January 2020. MMWR Morbidity and
mortality weekly report 2020; 69: 166-70.
19. Chang, M L, L W, et al. Epidemiologic and Clinical Characteristics of
Novel Coronavirus Infections Involving 13 Patients Outside Wuhan,
China. JAMA 2020.
20. C H, Y W, X L, et al. Clinical features of patients infected with 2019
novel coronavirus in Wuhan, China. Lancet (London, England) 2020.
21. , Li Z, Wu M, et al. Caution on Kidney Dysfunctions of 2019-nCoV
Patients. medRxiv 2020.
22. Liu J, Li S, Liu J, et al. Longitudinal characteristics of lymphocyte
responses and cytokine profiles in the peripheral blood of SARS-CoV-2
infected patients. medRxiv 2020.
23. Lu J, Hu S, Fan R, et al. ACP risk grade: a simple mortality index for
patients with confirmed or suspected severe acute respiratory syndrome
All rights reserved. No reuse allowed without permission. (which was not certified by peer review) is the author/funder, who has granted medRxiv a license to display the preprint in perpetuity.
The copyright holder for this preprintthis version posted March 20, 2020. .https://doi.org/10.1101/2020.03.17.20037572doi: medRxiv preprint

coronavirus 2 disease (COVID-19) during the early stage of outbreak in
Wuhan, China. medRxiv 2020.
24. Lu H, Ai J, Shen Y, et al. A descriptive study of the impact of
diseases control and prevention on the epidemics dynamics and clinical
features of SARS-CoV-2 outbreak in Shanghai, lessons learned for
metropolis epidemics prevention. medRxiv 2020.
25. lei l, Jian-ya G. Clinical characteristics of 51 patients discharged from
hospital with COVID-19 in Chongqing,China. medRxiv 2020.
26. Feng Z, Yu Q, Yao S, et al. Early Prediction of Disease Progression
in 2019 Novel Coronavirus Pneumonia Patients Outside Wuhan with CT
and Clinical Characteristics. medRxiv 2020.
27. Chen G, Wu D, Guo W, et al. Clinical and immunologic features in
severe and moderate forms of Coronavirus Disease 2019. medRxiv 2020.
28. Cai Q, Huang D, Ou P, et al. COVID-19 in a Designated Infectious
Diseases HospitalOutside Hubei Province,China. medRxiv 2020.
29. Zheng Y, Huang Z, Ying G, et al. Comparative study of the
lymphocyte change between COVID-19 and non-COVID-19 pneumonia
cases suggesting uncontrolled inflammation might not be the main reason
of tissue injury. medRxiv 2020.
30. XW X, XX W, XG J, et al. Clinical findings in a group of patients
infected with the 2019 novel coronavirus (SARS-Cov-2) outside of
All rights reserved. No reuse allowed without permission. (which was not certified by peer review) is the author/funder, who has granted medRxiv a license to display the preprint in perpetuity.
The copyright holder for this preprintthis version posted March 20, 2020. .https://doi.org/10.1101/2020.03.17.20037572doi: medRxiv preprint

Wuhan, China: retrospective case series. BMJ (Clinical research ed) 2020;
368: m606.
31. Wang L, Li X, Chen H, et al. SARS-CoV-2 infection does not
significantly cause acute renal injury: an analysis of 116 hospitalized
patients with COVID-19 in a single hospital, Wuhan, China. medRxiv
2020.
32. Liu Y, Sun W, Li J, et al. Clinical features and progression of acute
respiratory distress syndrome in coronavirus disease 2019. medRxiv
2020.
33. Li Q, Ding X, Xia G, et al. A simple laboratory parameter facilitates
early identification of COVID-19 patients. medRxiv 2020.
34. JJ Z, X D, YY C, et al. Clinical characteristics of 140 patients
infected by SARS-CoV-2 in Wuhan, China. Allergy 2020.
35. Cheng Y, Luo R, Wang K, et al. Kidney impairment is associated
with in-hospital death of COVID-19 patients. medRxiv 2020.
36. Ai J-W, Zhang H-C, Xu T, et al. Optimizing diagnostic strategy for
novel coronavirus pneumonia, a multi-center study in Eastern China.
medRxiv 2020.
37. Ai J, Chen J, Wang Y, et al. The cross-sectional study of hospitalized
coronavirus disease 2019 patients in Xiangyang, Hubei province.
medRxiv 2020.
38. COVID-19, Australia: Epidemiology Report 2 (Reporting week
All rights reserved. No reuse allowed without permission. (which was not certified by peer review) is the author/funder, who has granted medRxiv a license to display the preprint in perpetuity.
The copyright holder for this preprintthis version posted March 20, 2020. .https://doi.org/10.1101/2020.03.17.20037572doi: medRxiv preprint

ending 19:00 AEDT 8 February 2020). Communicable diseases
intelligence (2018) 2020; 44.
39. A Z, DS H, S P. 4.Middle East respiratory syndrome. Lancet (London,
England) 2015; 386(9997): 995-1007.
40. A A, JA A-T, AA A-R, et al. 9.Epidemiological, demographic, and
clinical characteristics of 47 cases of Middle East respiratory syndrome
coronavirus disease from Saudi Arabia: a descriptive study. The Lancet
Infectious diseases 2013; 13: 752-61.
41. A R, A S. 2.Risk Factors for Fatal Middle East Respiratory Syndrome
Coronavirus Infections in Saudi Arabia: Analysis of the WHO Line List,
2013-2018. American journal of public health 2019; 109(9): 1288-93.
42. R M, H N, S K, K H, N O. 3.Clinical determinants of the severity of
Middle East respiratory syndrome (MERS): a systematic review and
meta-analysis. BMC public health 2016; 16: 1203.
43. N J, D F, LQ F, et al. 1.Case fatality of SARS in mainland China and
associated risk factors. Tropical medicine & international health : TM &
IH 2009: 21-7.
44. JC C, EL T, VC W. 6.Prognostication in severe acute respiratory
syndrome: a retrospective time-course analysis of 1312
laboratory-confirmed patients in Hong Kong. Respirology (Carlton, Vic)
2007; 12(4): 531-42.
45. N Z, D Z, W W, et al. A Novel Coronavirus from Patients with
All rights reserved. No reuse allowed without permission. (which was not certified by peer review) is the author/funder, who has granted medRxiv a license to display the preprint in perpetuity.
The copyright holder for this preprintthis version posted March 20, 2020. .https://doi.org/10.1101/2020.03.17.20037572doi: medRxiv preprint

Pneumonia in China, 2019. The New England journal of medicine 2020;
382: 727-33.
46. E M. Coronavirus covid-19 has killed more people than SARS and
MERS combined, despite lower case fatality rate. BMJ (Clinical research
ed) 2020; 368: m641.
47. WJ G, ZY N, Y H, et al. Clinical Characteristics of Coronavirus
Disease 2019 in China. The New England journal of medicine 2020.
48. W W, Y X, R G, et al. Detection of SARS-CoV-2 in Different Types
of Clinical Specimens. JAMA 2020.
49. F Z, T Y, R D, et al. Clinical course and risk factors for mortality of
adult inpatients with COVID-19 in Wuhan, China: a retrospective cohort
study. Lancet (London, England) 2020.
50. M H, H K-W, S S, et al. SARS-CoV-2 Cell Entry Depends on ACE2
and TMPRSS2 and Is Blocked by a Clinically Proven Protease Inhibitor.
Cell 2020.
All rights reserved. No reuse allowed without permission. (which was not certified by peer review) is the author/funder, who has granted medRxiv a license to display the preprint in perpetuity.
The copyright holder for this preprintthis version posted March 20, 2020. .https://doi.org/10.1101/2020.03.17.20037572doi: medRxiv preprint

Figure legend
Figure 1. PRISMA Diagram of Study Selection.
N, the number of COVID-19 confirmed patients; ICU, intensive care unit.
a EndNote software (Clarivate Analytics) was used to remove duplicates.
Figure 2. Subgroup analysis of CSR (A) and CFR (B) by geographical
region.
CSR, case severity rate; CFR, case fatality rate.
Figure 3. Meta-regression analysis for CSR and CFR. (A)
meta-regression of Logit CSR on geographical region (Wuhan, outside
Wuhan in China, nationwide). (B) meta-regression of Logit CSR on
duration from Dec 1, 2019 to the middle time of study period. (C)
meta-regression of Logit CSR on mean time from symptom onset to
All rights reserved. No reuse allowed without permission. (which was not certified by peer review) is the author/funder, who has granted medRxiv a license to display the preprint in perpetuity.
The copyright holder for this preprintthis version posted March 20, 2020. .https://doi.org/10.1101/2020.03.17.20037572doi: medRxiv preprint
hospital admission (D) meta-regression of Logit CFR on geographical
region (Wuhan, outside Wuhan in China, nationwide). (E)
meta-regression of Logit CFR on duration from Dec 1, 2019 to the
middle time of study period. (F) meta-regression of Logit CFR on mean
time from symptom onset to hospital admission. The size of the circle
represent the population size of each study. The red line in A&D
represent the pooled incidence of CSR or CFR in each region, and the red
line in B-C, E-F represent the regression equation from meta-analysis.
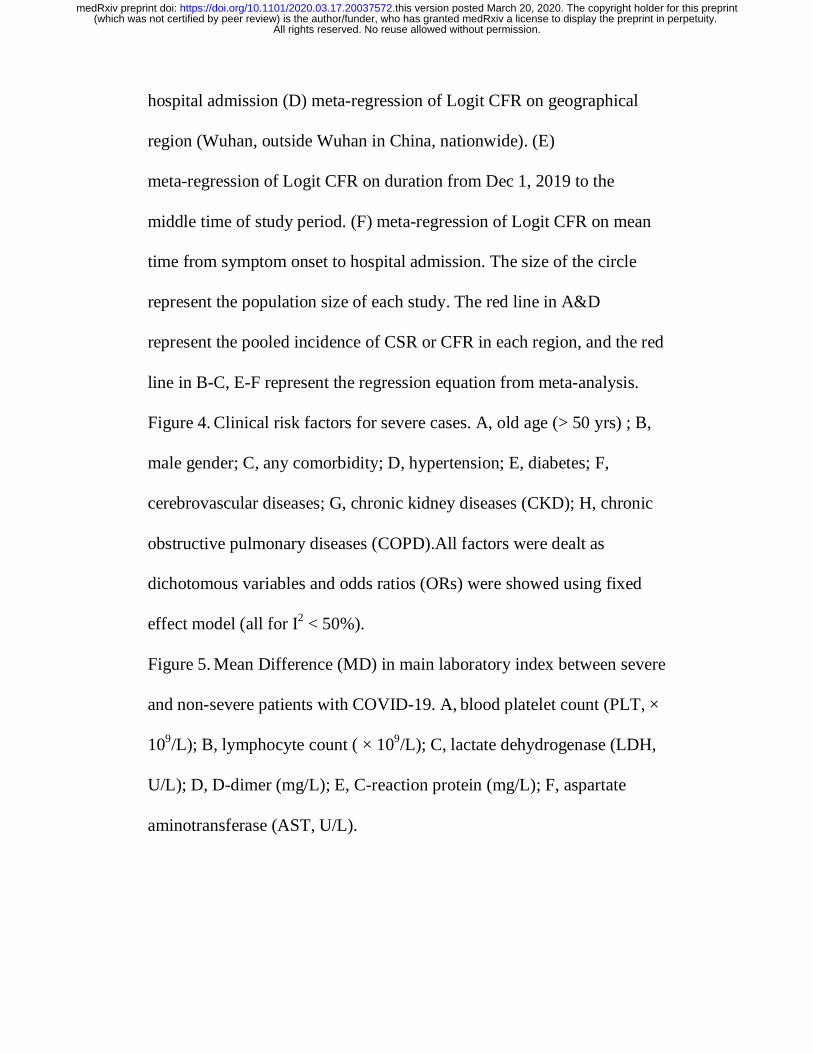
Figure 4. Clinical risk factors for severe cases. A, old age (> 50 yrs) ; B,
male gender; C, any comorbidity; D, hypertension; E, diabetes; F,
cerebrovascular diseases; G, chronic kidney diseases (CKD); H, chronic
obstructive pulmonary diseases (COPD).All factors were dealt as
dichotomous variables and odds ratios (ORs) were showed using fixed
effect model (all for I2 < 50%).
Figure 5. Mean Difference (MD) in main laboratory index between severe
and non-severe patients with COVID-19. A, blood platelet count (PLT, ×
109/L); B, lymphocyte count ( × 109/L); C, lactate dehydrogenase (LDH,
U/L); D, D-dimer (mg/L); E, C-reaction protein (mg/L); F, aspartate
aminotransferase (AST, U/L).
All rights reserved. No reuse allowed without permission. (which was not certified by peer review) is the author/funder, who has granted medRxiv a license to display the preprint in perpetuity.
The copyright holder for this preprintthis version posted March 20, 2020. .https://doi.org/10.1101/2020.03.17.20037572doi: medRxiv preprint

Table 1. Study Characteristics
Study Study period Location N CSR,
n (%)
CFR,
n (%)
Mean age
(SD)
Male,
n (%)
Healthcare
worker, n (%)
Quality
scorea
Chaolin Huang et al. Dec 6, 2019 - Jan 2, 2020 Wuhan 41 NA 6 (15.0) 49.0 (5.2) 30 (73.0) NA 9
Qun Li et al. Dec 10, 2019 - Jan 04, 2020 Wuhan 425 NA NA 59.0 (12.3) 238 (56.0) 15 (3.5) 6
Nanshan Chen et al. Jan 1-20, 2020 Wuhan 99 NA 11 (11.0) 55.5 (13.1) 67 (68.0) NA 8
Jing Liu et al. Jan 5-24, 2020 Wuhan 40 13 (32.5) 2 (5.0) 48.7 (13.9) 15 (37.5) NA 9
Guang Chen et al. Dec 19, 2019 - Jan 27, 2020 Wuhan 21 11 (52.4) 4 (19.0) 56.3 (14.3) 17 (81.0) NA 10
Dawei Wang et al. Jan 1-28, 2020 Wuhan 138 NA 6 (4.3) 56.0 (11.7) 75 (54.3) 40 (29.0) 9
Yanli Liu et al. Jan 2 - Feb 1, 2020 Wuhan 109 NA 31 (28.4) 54.7 (17.0) 59 (54.1) NA 10
Jinjin Zhang et al. Jan 16 - Feb 3, 2020 Wuhan 140 58 (41.4) NA 56.5 (10.3) 71 (50.7) 3 (2.1) 9
Jiatao Lu et al. Jan 21 - Feb 5, 2020 Wuhan 75 15/72 (20.8) 1 (1.3) 60.3 (17.0) 37 (49.3) NA 9
Zhen Li et al. Dec, 2019 - Feb 7, 2020b
Wuhan,
Huangshi,
Chongqingc
59 28 (47.5) 3 (5.1) 53.8 (13.8) 34 (57.6) NA 6
Qilin Li et al. Feb 3-7, 2020 Wuhan 52 NA NA 58.3 (14.8) 26 (50.0) NA 9
All rights reserved. N
o reuse allowed w
ithout permission.
(which w
as not certified by peer review) is the author/funder, w
ho has granted medR
xiv a license to display the preprint in perpetuity. T
he copyright holder for this preprintthis version posted M
arch 20, 2020. .
https://doi.org/10.1101/2020.03.17.20037572doi:
medR
xiv preprint

Yichun Cheng et al. Jan 28 - Feb 11, 2020 Wuhan 710 252 (35.5) 89 (12.5) 61.7 (14.8) 374 (52.7) NA 8
Luwen Wang et al. Jan 14 - Feb 13, 2020 Wuhan 116 46 (39.7) 7 (6.0) 53.7 (23.0) 67 (57.8) NA 9
Xiaowei Xu et al. Jan 10 - Jan 26, 2020 Zhejiang 62 NA 0 43.3 (14.8) 36 (58.1) NA 9
De Chang et al. Jan 16-29, 2020 Beijing 13 NA 0 35.3 (3.0) 10 (77.0) NA 8
Jingyuan Liu et al. Jan 13-31, 2020 Beijing 61 3 (4.9) 0 40.0 (14.2) 31 (50.8) NA 10
Zhichao Feng et al. Jan 17 - Feb 1, 2020 Hunan 141 15 (10.6) NA 44.3 (15.6) 72 (51.1) NA 10
Lei Liu at al. Jan 20 - Feb 3, 2020 Chongqing 51 7 (13.7) 1 (2.0) 42.7 (12.6) 32 (62.7) NA 9
Qingxian Cai et al. Jan 11- Feb 6, 2020 Shenzhen 298 58 (19.4) 0 47.0 (20.7) 149 (50.0) NA 8
Jinwei Ai et al. Dec, 2019 - Feb 9, 2020b Xiangyang,
Hubei 102 NA 3 (2.9) 50.4 (16.9) 52 (51.0) NA 6
Jingwen Ai et al. Jan 22 - Feb 9, 2020 Shanghai 20 3 (15.0) NA 40.4 (12.4) 10 (50.0) NA 9
Jie Li et al. Jan 22 - Feb 10, 2020 Dazhou,
Sichuan 17 NA 0 45.1 (12.8) 9 (52.9) NA 9
Hongzhou Lu et al. Jan 20 - Feb 19, 2020 Shanghai 265 22 (8.3) 1 (0.4) NA NA NA 10
Yishan Zheng et al. NA Nanjing 103 8 (7.8) NA 44.4 (18.9) 55 (53.4) NA 8
Yang Yang et al. Dec, 2019 - Jan 26, 2020b Nationwide 4021 935 (25.5) 58 (1.4) 48.0 (16.0) 2213 (55.04) 247 (6.14) 7
All rights reserved. N
o reuse allowed w
ithout permission.
(which w
as not certified by peer review) is the author/funder, w
ho has granted medR
xiv a license to display the preprint in perpetuity. T
he copyright holder for this preprintthis version posted M
arch 20, 2020. .
https://doi.org/10.1101/2020.03.17.20037572doi:
medR
xiv preprint

Weijie Guan, et al. Dec, 2019 - Jan 29, 2020b Nationwide 1099 173 (15.7) 15 (1.4) 47.0 (3.8) 649 (59.1) NA 10
Chinese CDC Dec, 2019 - Feb 11, 2020 b Nationwide 44672 8255 (18.6) 1023 (2.3) NA 22981 (51.4) 1716 (3.8) 9
Moran Ki1, et al. Jan 20 - Feb 8, 2020 South Korea 24 0 0 41.8 (10.3) 14 (58.3) NA 7
Kristina L. Bajema,
et al Jan 17-31, 2020 America
11 0 0 NA NA NA 7
Liz J Walker, et al. Jan 10 - Feb 8, 2020 Australia 15 NA 0 NA NA NA 5
N, number of COVID-19 confirmed patients; CSR, case severity rate; CFR, case fatality rate; CDC, centers for disease
control; NA, data not available.
a Study quality was assessed using the Quality Assessment Forms recommended by Agency for Healthcare Research and
Quality (AHRQ).
b Studies without specific beginning time mentioned, were taken as beginning since Dec, 2019.
b The study recruited patients at Tongji Hospital and Wuhan Pulmonary Hospital in Wuhan, Huangshi Central Hospital in
Huangshi, and Southwest Hospital in Chongqing, China. The multi-center study was categorized into Wuhan subgroup after
a discussion.
All rights reserved. N
o reuse allowed w
ithout permission.
(which w
as not certified by peer review) is the author/funder, w
ho has granted medR
xiv a license to display the preprint in perpetuity. T
he copyright holder for this preprintthis version posted M
arch 20, 2020. .
https://doi.org/10.1101/2020.03.17.20037572doi:
medR
xiv preprint

Table 2. Meta-regression Analysis for CSR and CFR
Univariate meta-regression
Multivariate meta-regressiona
Coefficient (95% CI) z value p value
Coefficient (95% CI) z value p value
CSR
Geographic region
Wuhan Reference 10.1055 Reference
Reference 3.3328 Reference
Outside Wuhan in China -0.2472 (-0.3417 to -0.1528) -5.1316 <0.0001
-0.1317 (-0.3150 to 0.0517) -1.4074 0.1593
Nationwide -0.1516 (-0.2813 to -0.0219) -2.2909 0.0220
-0.0122 (-0.2162 to 0.2405) 0.1044 0.9169
Outside China -0.3581 (-0.5004 to -0.2159) -4.9355 <0.0001
Observation durationb -0.0048 (-0.0102 to 0.0006) -1.7499 0.0801
- - -
Onset-to-admission timec 0.0499 (0.0153 to 0.0845) 2.8289 0.0047
0.0275 (-0.0189 to 0.0739) 1.1606 0.2458
CFR
Geographic region
Wuhan Reference 8.5225 Reference
Reference 1.0729 Reference
Outside Wuhan in China -0.0712 (-0.0935 to -0.0488) -6.2345 <0.0001
-0.0450 (-0.0922 to 0.0022) -1.8686 0.0617
Nationwide -0.0627 (-0.0894 to -0.0359) -4.5955 <0.0001
-0.0381 (-0.0949 to 0.0187) -1.3156 0.1883
All rights reserved. N
o reuse allowed w
ithout permission.
(which w
as not certified by peer review) is the author/funder, w
ho has granted medR
xiv a license to display the preprint in perpetuity. T
he copyright holder for this preprintthis version posted M
arch 20, 2020. .
https://doi.org/10.1101/2020.03.17.20037572doi:
medR
xiv preprint

Outside China -0.0767 (-0.1264 to -0.0269) -3.0214 0.0025
Observation durationb -0.0002 (-0.0013 to 0.0009) -0.3710 0.7106
- - -
Onset-to-admission timec 0.0197 (0.0133 to 0.0260) 6.0555 <0.0001
0.0127 (0.0015 to 0.0239) 2.2217 0.0263
aMultivariate meta-regression was performed when the univariate meta-regression P value was < 0.05.
bDuration from December 1, 2019 to the middle time of study period.
cMean time from symptom onset to hospital admission.
All rights reserved. N
o reuse allowed w
ithout permission.
(which w
as not certified by peer review) is the author/funder, w
ho has granted medR
xiv a license to display the preprint in perpetuity. T
he copyright holder for this preprintthis version posted M
arch 20, 2020. .
https://doi.org/10.1101/2020.03.17.20037572doi:
medR
xiv preprint
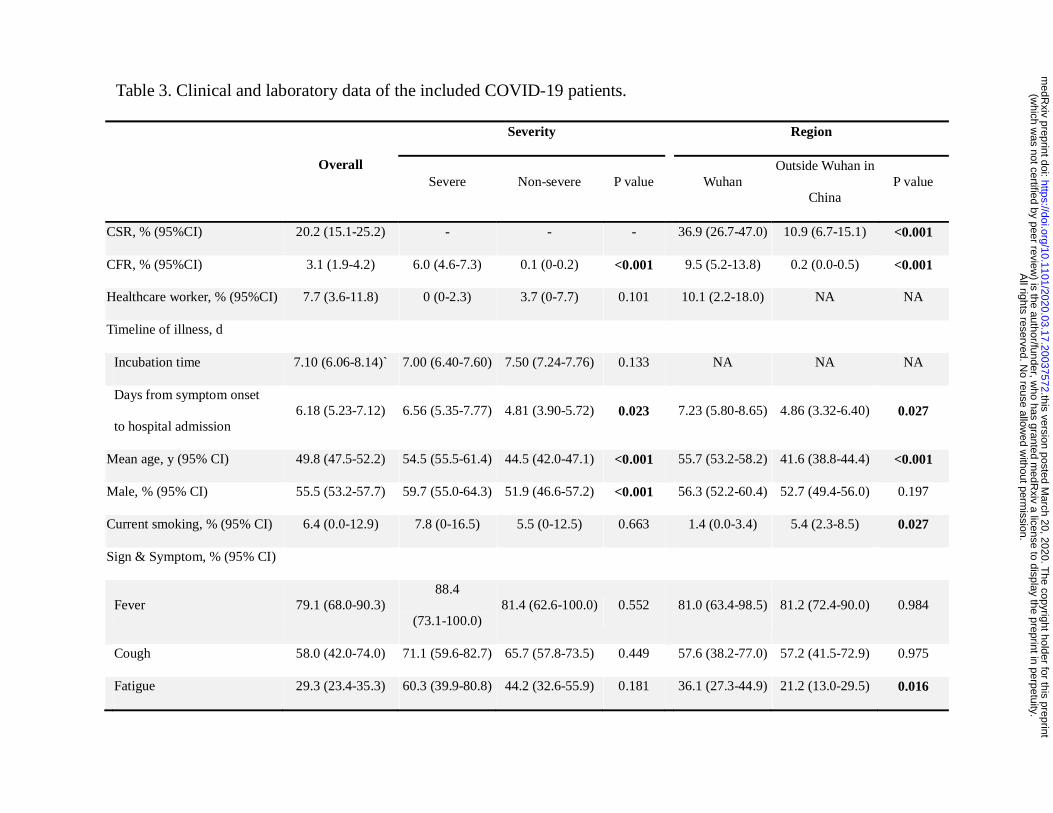
Table 3. Clinical and laboratory data of the included COVID-19 patients.
Overall
Severity
Region
Severe Non-severe P value
Wuhan
Outside Wuhan in
China P value
CSR, % (95%CI) 20.2 (15.1-25.2) - - -
36.9 (26.7-47.0) 10.9 (6.7-15.1) <0.001
CFR, % (95%CI) 3.1 (1.9-4.2) 6.0 (4.6-7.3) 0.1 (0-0.2) <0.001
9.5 (5.2-13.8) 0.2 (0.0-0.5) <0.001
Healthcare worker, % (95%CI) 7.7 (3.6-11.8) 0 (0-2.3) 3.7 (0-7.7) 0.101
10.1 (2.2-18.0) NA NA
Timeline of illness, d
Incubation time 7.10 (6.06-8.14)` 7.00 (6.40-7.60) 7.50 (7.24-7.76) 0.133
NA NA NA
Days from symptom onset
to hospital admission 6.18 (5.23-7.12) 6.56 (5.35-7.77) 4.81 (3.90-5.72) 0.023
7.23 (5.80-8.65) 4.86 (3.32-6.40) 0.027
Mean age, y (95% CI) 49.8 (47.5-52.2) 54.5 (55.5-61.4) 44.5 (42.0-47.1) <0.001
55.7 (53.2-58.2) 41.6 (38.8-44.4) <0.001
Male, % (95% CI) 55.5 (53.2-57.7) 59.7 (55.0-64.3) 51.9 (46.6-57.2) <0.001
56.3 (52.2-60.4) 52.7 (49.4-56.0) 0.197
Current smoking, % (95% CI) 6.4 (0.0-12.9) 7.8 (0-16.5) 5.5 (0-12.5) 0.663
1.4 (0.0-3.4) 5.4 (2.3-8.5) 0.027
Sign & Symptom, % (95% CI)
Fever 79.1 (68.0-90.3)
88.4
(73.1-100.0) 81.4 (62.6-100.0) 0.552
81.0 (63.4-98.5) 81.2 (72.4-90.0) 0.984
Cough 58.0 (42.0-74.0) 71.1 (59.6-82.7) 65.7 (57.8-73.5) 0.449
57.6 (38.2-77.0) 57.2 (41.5-72.9) 0.975
Fatigue 29.3 (23.4-35.3) 60.3 (39.9-80.8) 44.2 (32.6-55.9) 0.181
36.1 (27.3-44.9) 21.2 (13.0-29.5) 0.016
All rights reserved. N
o reuse allowed w
ithout permission.
(which w
as not certified by peer review) is the author/funder, w
ho has granted medR
xiv a license to display the preprint in perpetuity. T
he copyright holder for this preprintthis version posted M
arch 20, 2020. .
https://doi.org/10.1101/2020.03.17.20037572doi:
medR
xiv preprint

Expectoration 11.5 (9.2-13.9) 37.6 (22.7-52.6) 28.0 (19.0-37.0) 0.281
2.7 (0.8-4.6) 20.6 (10.6-30.6) 0.001
Headache 6.0 (4.0-7.9) 11.3 (7.4-15.2) 13.5 (7.6-19.4) 0.542
2.0 (0.5-3.5) 8.8 (4.8-12.7) 0.002
Diarrhea 5.7 (3.9-7.5) 5.7 (3.1-8.4) 5.8 (3.3-8.3) 0.957
5.6 (2.6-8.6) 6.6 (3.8-9.3) 0.63
Myalgia 3.8 (2.4-5.2) 26.0 (11.1-40.9) 13.1 (8.4-17.8) 0.107
4.7 (2.1-7.3) 1.9 (0.2-3.5) 0.075
Shortness of breath 3.5 (2.2-4.9) 35.7 (17.8-53.7) 12.8 (4.7-20.9) 0.023
2.2 (0.4-3.9) 1.9 (0.2-3.7) 0.812
Sore throat/Pharyngalgia 3.2 (1.7-4.6) 7.8 (0-16.1) 9.7 (4.0-15.4) 0.706
1.5 (0.1-2.9) 2.1 (0.4-3.7) 0.587
Nausea or vomiting 2.0 (1.0-2.9) 5.9 (3.1-8.7) 5.7 (2.3-9.0) 0.928
2.5 (0.7-4.2) 1.3 (0.1-2.6) 0.274
Chill 1.1 (0.3-1.9) 26.0 (8.9-43.1) 10.9 (9.0-12.9) 0.087
0.1 (0.0-0.8) 0.4 (0.0-1.4) 0.466
Nasal congestion/Rhinorrhoea 1.1 (0.3-1.9) 2.8 (0.4-5.2) 5.1 (3.8-6.3) 0.097
0.0 (0.0-0.2) 1.6 (0.0-3.3) 0.058
Dyspnea 1.0 (0.3-1.7) 44.2 (7.8-80.6) 5.7 (0-10.7) 0.042
7.5 (4.6-10.5) 0.6 (0.0-1.6) <0.001
Anorexia 1.0 (0.4-1.7) 14.9 (8.3-21.5) 8.2 (2.4-13.9) 0.135
2.5 (0.5-4.5) 3.5 (0.9-6.1) 0.55
Dizziness 0.1 (0.0-0.5) 16.1 (3.5-28.8) 12.1 (5.0-19.2) 0.591
0.9 (0.0-2.1) 0.0 (0.0-2.4) 0.269
Any comorbidity, % (95% CI) 37.1 (28.1-46.1) 54.9 (37.2-72.6) 27.6 (19.4-35.8) 0.006
45.1 (36.2-53.9) 28.8 (20.2-37.5) 0.01
Specific comorbidity, % (95% CI)
Hypertension 19.0 (13.2-24.9) 29.4 (24.8-34.1) 16.1 (11.5-20.7) <0.001
25.3 (11.3-39.3) 13.1 (9.4-16.9) 0.099
Diabetes 8.2 (6.3-10.0) 17.2 (13.4-20.9) 5.8 (3.4-8.1) <0.001
11.8 (9.5-14.1) 5.4 (3.9-6.9) <0.001
CVD 2.7 (1.4-4.1) 6.9 (3.9-9.8) 2.1 (1.4-2.9) 0.002
4.4 (1.7-7.1) 2.0 (0.4-3.6) 0.134
Cerebrovascular disease 1.0 (0.3-1.6) 3.0 (1.2-4.9) 0.9 (0.4-1.3) 0.031
2.2 (0.5-3.9) 0.2 (0.0-0.6) 0.023
COPD 0.6 (0.3-0.9) 4.1 (1.8-6.3) 0.7 (0.2-1.1) 0.004
0.8 (0.1-1.6) 1.2 (0.0-2.4) 0.58
All rights reserved. N
o reuse allowed w
ithout permission.
(which w
as not certified by peer review) is the author/funder, w
ho has granted medR
xiv a license to display the preprint in perpetuity. T
he copyright holder for this preprintthis version posted M
arch 20, 2020. .
https://doi.org/10.1101/2020.03.17.20037572doi:
medR
xiv preprint

CKD 0.4 (0.1-0.7) 2.5 (0.8-4.2) 0.6 (0.1-1.0) 0.035
1.5 (0.1-2.9) 0.1 (0.0-0.5) 0.054
CLD 1.1 (0.3-1.8) 0.8 (0-1.9) 1.6 (0-3.7) 0.451
0.2 (0.0-0.7) 1.8 (0.3-3.4) 0.049
Cancer 0.8 (0.1-1.5) 5.6 (0-12.6) 2.3 (1.5-3.1) 0.309
1.7 (0.1-3.2) 0.6 (0.0-1.2) 0.195
Radiologic findings, % (95% CI)
Bilateral lung involvement 87.2 (82.1-92.3) 87.5 (81.3-93.8) 72.6 (50.9-94.2) 0.195
91.6 (88.5-94.6) 82.6 (75.9-89.4) 0.018
Laboratory findings, mean (95% CI)
WBC, × 10�/L 5.33 (5.03-5.62) 5.52 (4.79-6.24) 4.74 (4.55-4.92) 0.041
5.81 (5.13-6.50) 4.87 (4.61-5.13) 0.012
N, × 10�/L 3.43 (2.96-3.90) 4.23 (3.33-5.13) 3.03 (2.73-3.32) 0.013
3.87 (2.15-5.25) 3.16 (2.25-4.07) 0.439
L, × 10�/L 1.18 (1.00-1.36) 0.74 (0.67-0.82) 1.14 (1.05-1.23) <0.001
0.87 (0.83-0.91) 1.39 (0.98-1.83) 0.017
M, �10�/L 0.39 (0.34-0.43) 0.31 (0.26-0.36) 0.55 (0.38-0.72) 0.007
0.39 (0.37-0.42) 0.40 (0.32-0.48) 0.815
NLR NA 4.25 (3.42-5.08) 2.61 (1.85-3.48) 0.007
NA NA NA
Hb, g/L
133.16
(129.72-136.60)
132.81
(126.82-138.80)
134.81
(132.01-137.60) 0.554
125.30
(119.67-130.92)
139.51
(136.74-142.29) <0.001
PLT, × 10�/L
185.56
(175.13-195.98)
147.14
(39.88-154.40)
176.58
(173.66-179.49) <0.001
188.50
(165.34-211.66)
180.76
(175.74-185.78) 0.522
CRP, mg/L 26.07 (20.69-31.44)
54.37
(41.12-67.62)
16.74
(12.00-21.48) <0.001
35.87
(28.75-43.00)
18.63
(14.26-23.01) <0.001
ESR, mm/h 46.54 (33.31-59.78)
48.51
(36.50-60.51)
32.07
(11.72-52.43) 0.173
49.90
(45.29-54.51)
44.87
(22.14-67.61) 0.671
PCT, ng/mL 0.07 (0.05-0.08) 0.11 (0.07-0.16) 0.05 (0.03-0.06) 0.007
0.13 (0.07-0.19) 0.04 (0.04-0.05) 0.004
All rights reserved. N
o reuse allowed w
ithout permission.
(which w
as not certified by peer review) is the author/funder, w
ho has granted medR
xiv a license to display the preprint in perpetuity. T
he copyright holder for this preprintthis version posted M
arch 20, 2020. .
https://doi.org/10.1101/2020.03.17.20037572doi:
medR
xiv preprint

LDH, U/L
287.48
(260.76-314.20)
378.47
(307.86-449.07)
228.68
(222.62-234.75) <0.001
322.26
(276.49-368.04)
238.30
(225.61-250.99) 0.001
cTnI, pg/mL 4.54 (-1.17-10.24) 0.05 (0.03-0.07) 0.02 (0.02-0.03) 0.026
6.87 (2.26-11.48) 0.02 (0.02-0.03) 0.004
CK, U/L
101.13
(87.22-115.03)
109.80
(72.67-146.92)
110.50
(80.69-140.31) 0.977
109.56
(88.27-130.85)
91.08
(71.51-110.65) 0.211
CKMB, U/L 13.23 (10.83-15.63) NA NA NA
12.00
(8.05-15.51) 14.65 (13.3-15.97) 0.191
Mb, ng/mL 35.99 (5.36-66.61)
76.0
(27.99-124.01) 6.98 (6.08-7.87) 0.01
60.83
(51.12-70.55)
23.84
(-6.77-54.46) <0.001
NT-proBNP, pg/mL NA
269.27
(66.12-472.41)
38.77
(35.17-42.36) 0.037
NA NA NA
ALT, U/L 26.78 (24.17-29.38)
29.12
(225.57-32.67)
22.02
(20.17-23.87) 0.001
29.54
(25.53-33.54)
23.37
(22.20-24.54) 0.004
AST, U/L 31.61 (28.10-35.11)
39.91
(31.02-48.43)
24.23
(23.38-25.08) 0.001
36.48
(33.93-39.04)
25.41
(23.13-27.68) <0.001
Albumin, g/L 37.31 (34.33-40.28)
35.53
(33.08-37.98)
40.11
(37.16-43.06) 0.019
32.70
(31.45-33.95)
40.76
(38.35-43.16) <0.001
TBil, μmol/L 10.51 (9.25-11.76)
10.95
(9.06-12.84) 9.25 (8.03-10.46) 0.138
11.04
(9.86-12.23) 8.16 (6.55-9.77) 0.005
Scr, μmol/L 69.99 (67.22-72.75) 68.48 66.05 0.297
72.71 66.95 0.048
All rights reserved. N
o reuse allowed w
ithout permission.
(which w
as not certified by peer review) is the author/funder, w
ho has granted medR
xiv a license to display the preprint in perpetuity. T
he copyright holder for this preprintthis version posted M
arch 20, 2020. .
https://doi.org/10.1101/2020.03.17.20037572doi:
medR
xiv preprint
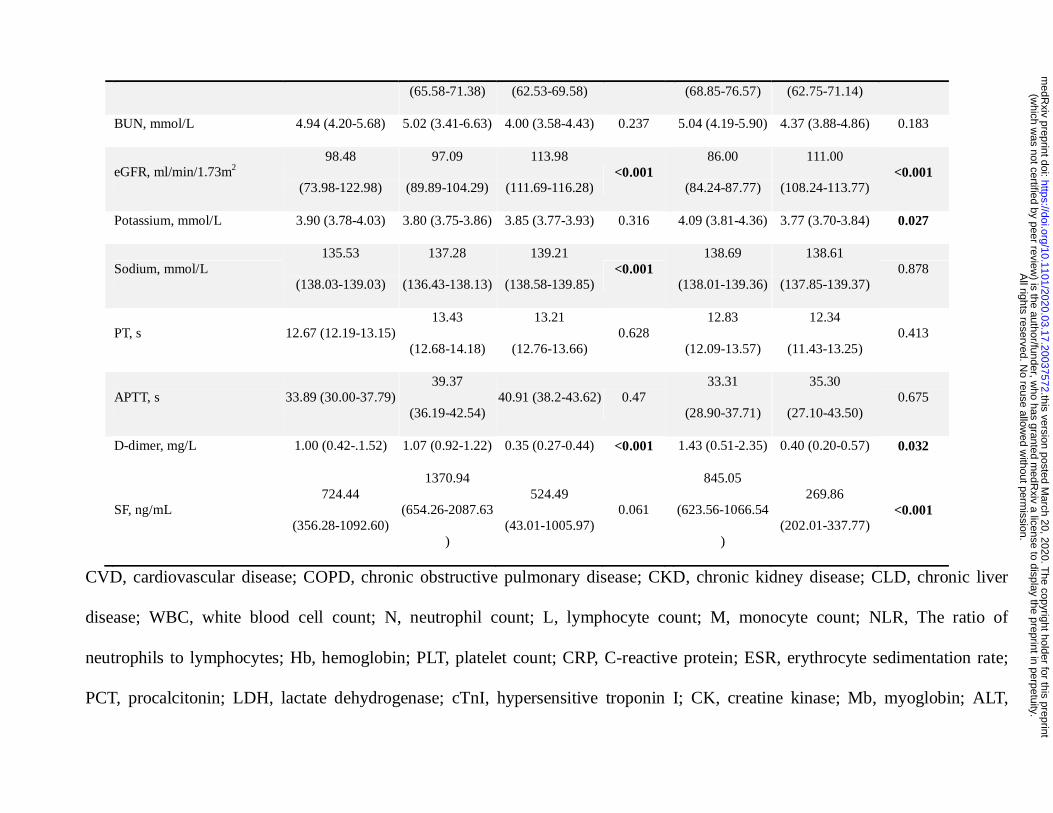
(65.58-71.38) (62.53-69.58) (68.85-76.57) (62.75-71.14)
BUN, mmol/L 4.94 (4.20-5.68) 5.02 (3.41-6.63) 4.00 (3.58-4.43) 0.237
5.04 (4.19-5.90) 4.37 (3.88-4.86) 0.183
eGFR, ml/min/1.73m2
98.48
(73.98-122.98)
97.09
(89.89-104.29)
113.98
(111.69-116.28) <0.001
86.00
(84.24-87.77)
111.00
(108.24-113.77) <0.001
Potassium, mmol/L 3.90 (3.78-4.03) 3.80 (3.75-3.86) 3.85 (3.77-3.93) 0.316
4.09 (3.81-4.36) 3.77 (3.70-3.84) 0.027
Sodium, mmol/L
135.53
(138.03-139.03)
137.28
(136.43-138.13)
139.21
(138.58-139.85) <0.001
138.69
(138.01-139.36)
138.61
(137.85-139.37) 0.878
PT, s 12.67 (12.19-13.15)
13.43
(12.68-14.18)
13.21
(12.76-13.66) 0.628
12.83
(12.09-13.57)
12.34
(11.43-13.25) 0.413
APTT, s 33.89 (30.00-37.79)
39.37
(36.19-42.54) 40.91 (38.2-43.62) 0.47
33.31
(28.90-37.71)
35.30
(27.10-43.50) 0.675
D-dimer, mg/L 1.00 (0.42-.1.52) 1.07 (0.92-1.22) 0.35 (0.27-0.44) <0.001
1.43 (0.51-2.35) 0.40 (0.20-0.57) 0.032
SF, ng/mL
724.44
(356.28-1092.60)
1370.94
(654.26-2087.63
)
524.49
(43.01-1005.97) 0.061
845.05
(623.56-1066.54
)
269.86
(202.01-337.77) <0.001
CVD, cardiovascular disease; COPD, chronic obstructive pulmonary disease; CKD, chronic kidney disease; CLD, chronic liver
disease; WBC, white blood cell count; N, neutrophil count; L, lymphocyte count; M, monocyte count; NLR, The ratio of
neutrophils to lymphocytes; Hb, hemoglobin; PLT, platelet count; CRP, C-reactive protein; ESR, erythrocyte sedimentation rate;
PCT, procalcitonin; LDH, lactate dehydrogenase; cTnI, hypersensitive troponin I; CK, creatine kinase; Mb, myoglobin; ALT,
All rights reserved. N
o reuse allowed w
ithout permission.
(which w
as not certified by peer review) is the author/funder, w
ho has granted medR
xiv a license to display the preprint in perpetuity. T
he copyright holder for this preprintthis version posted M
arch 20, 2020. .
https://doi.org/10.1101/2020.03.17.20037572doi:
medR
xiv preprint
alanine aminotransferase; AST, aspartate aminotransferase; Tbil, total bilirubin; Scr, serum creatinine; BUN, blood urea nitrogen;
PT, prothrombin time; APTT, activated partial thromboplastin time; SF, serum ferritin.
P <0.05 was considered as statistically significant.
All rights reserved. N
o reuse allowed w
ithout permission.
(which w
as not certified by peer review) is the author/funder, w
ho has granted medR
xiv a license to display the preprint in perpetuity. T
he copyright holder for this preprintthis version posted M
arch 20, 2020. .
https://doi.org/10.1101/2020.03.17.20037572doi:
medR
xiv preprint
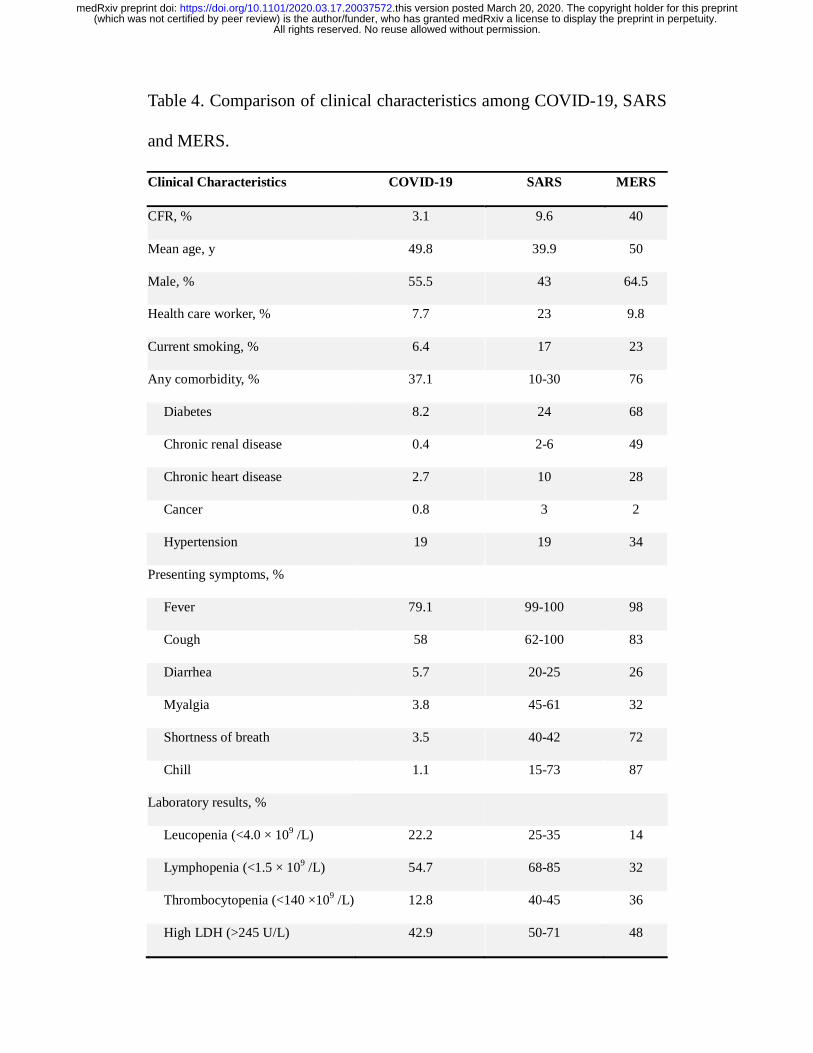
Table 4. Comparison of clinical characteristics among COVID-19, SARS
and MERS.
Clinical Characteristics COVID-19 SARS MERS
CFR, % 3.1 9.6 40
Mean age, y 49.8 39.9 50
Male, % 55.5 43 64.5
Health care worker, % 7.7 23 9.8
Current smoking, % 6.4 17 23
Any comorbidity, % 37.1 10-30 76
Diabetes 8.2 24 68
Chronic renal disease 0.4 2-6 49
Chronic heart disease 2.7 10 28
Cancer 0.8 3 2
Hypertension 19 19 34
Presenting symptoms, %
Fever 79.1 99-100 98
Cough 58 62-100 83
Diarrhea 5.7 20-25 26
Myalgia 3.8 45-61 32
Shortness of breath 3.5 40-42 72
Chill 1.1 15-73 87
Laboratory results, %
Leucopenia (<4.0 × 10⁹ /L) 22.2 25-35 14
Lymphopenia (<1.5 × 10⁹ /L) 54.7 68-85 32
Thrombocytopenia (<140 ×109 /L) 12.8 40-45 36
High LDH (>245 U/L) 42.9 50-71 48
All rights reserved. No reuse allowed without permission. (which was not certified by peer review) is the author/funder, who has granted medRxiv a license to display the preprint in perpetuity.
The copyright holder for this preprintthis version posted March 20, 2020. .https://doi.org/10.1101/2020.03.17.20037572doi: medRxiv preprint
High ALT (>40 U/L) 20 20-30 11
High AST (>40 U/L) 23.8 20-30 14
All rights reserved. No reuse allowed without permission. (which was not certified by peer review) is the author/funder, who has granted medRxiv a license to display the preprint in perpetuity.
The copyright holder for this preprintthis version posted March 20, 2020. .https://doi.org/10.1101/2020.03.17.20037572doi: medRxiv preprint

Table 5. Comparison of risk factors for death among COVID-19, SARS and MERS.
COVID-19
SARS
MERS
Predictive factors
N CFR, n (%) RR (95%CI)
N CFR, n (%) RR (95%CI)
N CFR, n (%) RR (95%CI)
Age ≥ 60 y 13909 829 (6.0) 9.45 (8.09-11.04)
548 135 (24.6) 7.18 (5.66-9.12)
< 60 y 30763 194 (0.6)
4777 208 (4.4)
Sex Male 22981 653 (2.8) 1.67 (1.47-1.89)
2720 196 (7.2) 0.81 (0.64-1.02)
888 203 (22.9) 1.6 (1.2-2.1)
Female 21691 370 (1.7)
2607 147 (5.6)
359 52 (14.5)
Any comorbidity Present 5446 273 (5.0) 5.86 (4.77-7.19)
359 164 (45.5) 7.61 (5.80-9.98)
796 201 (25.3) 3.0 (2.2-3.9)
Absent 15536 133 (0.9) 1396 139 (10.0) 271 23 (8.5)
Health care worker Yes 1716 5 (0.3) 0.12 (0.05-0.30)
1021 34 (3.3) 0.76 (0.52-1.15)
150 2 (1.3) 0.1 (0.02-0.2)
No 42956 1018 (2.4)
4306 309 (7.2)
1064 236 (22.2)
Hypertension Yes 2683 161 (6.0) 4.48 (3.69-5.45) 2.6 (2.2-3.5)a
No 18299 245 (1.3)
Diabetes Yes 1102 80 (7.3)
4.43 (3.49-5.61) 72 25
6.48 (3.82-10.99) 1.8 (1.5-2.1)a
No 19880 326 (1.6)
1239 94
All rights reserved. N
o reuse allowed w
ithout permission.
(which w
as not certified by peer review) is the author/funder, w
ho has granted medR
xiv a license to display the preprint in perpetuity. T
he copyright holder for this preprintthis version posted M
arch 20, 2020. .
https://doi.org/10.1101/2020.03.17.20037572doi:
medR
xiv preprint

CVD Yes 873 92 (10.5) 6.75 (5.40-8.43)
47 18 7.15 (3.84-13.32) 3.5 (3.1-4.8)a
No 20109 314 (1.6)
1264 101
Cancer Yes 107 6 (5.6)
2.93 (1.34-6.41) 14 3
2.78 (0.76-10.1)
No 20875 400 (1.9)
1297 116
Other factors
Respiratory disease
3.43 (2.42-4.86)
Cerebrovascular disease
5.34 (2.34-12.16)
CKD 9.02 (3.81-21.36)
Respiratory disease 3.1 (2.6-4.2)a
CKD 2.2 (1.7-2.9) a
RR, relative risk
a Odds ratio (OR) retrieved from published meta-analysis of MERS.
All rights reserved. N
o reuse allowed w
ithout permission.
(which w
as not certified by peer review) is the author/funder, w
ho has granted medR
xiv a license to display the preprint in perpetuity. T
he copyright holder for this preprintthis version posted M
arch 20, 2020. .
https://doi.org/10.1101/2020.03.17.20037572doi:
medR
xiv preprint

All rights reserved. No reuse allowed without permission. (which was not certified by peer review) is the author/funder, who has granted medRxiv a license to display the preprint in perpetuity.
The copyright holder for this preprintthis version posted March 20, 2020. .https://doi.org/10.1101/2020.03.17.20037572doi: medRxiv preprint


![COVID-19 - ImMClinical Presentation In a study describing 1099 patients with COVID-19 pneumonia in Wuhan, the most common clinical features at the onset of illness were: [41] •Fever](https://img.dokumen.tips/doc/110x75/5f79df1803af9f6a8752499e/covid-19-imm-clinical-presentation-in-a-study-describing-1099-patients-with-covid-19.jpg)