Embed Size (px)
Citation preview

Comprehensive Actuarial Risk Evaluation (CARE)
Draft08 September 2009

DRAFT
Table of contentsPROJECT OVERVIEW................................................................................................................................3PROJECT WORKING GROUP........................................................................................................................41. INTRODUCTION - WHY CARE?...........................................................................................................52. DEFINING RISK.....................................................................................................................................72.1 PERSPECTIVE........................................................................................................................................72.2 TAXONOMY OF RISK............................................................................................................................83. MULTI-DIMENSIONALITY OF RISK.....................................................................................................113.1 MARKET CONSISTENT VALUE VS. FUNDAMENTAL VALUE...............................................................113.2 ACCOUNTING BASIS VS. ECONOMIC BASIS........................................................................................133.3 REGULATORY MEASURE OF RISK......................................................................................................20
3.3.1 Introduction...............................................................................................................................203.3.2 Summary....................................................................................................................................213.3.3 Solvency Standards....................................................................................................................22
3.4 SHORT TERM VS. LONG TERM RISKS.................................................................................................293.5 KNOWN RISK AND EMERGING RISKS.................................................................................................303.6 FREQUENCY RISK (EARNINGS VOLATILITY) VS. SEVERITY RISK (SOLVENCY).................................31
3.6.1 Overview.....................................................................................................................................313.6.2 What belongs in a Care Report.................................................................................................323.6.3 The Mathematics of Frequency and Severity...........................................................................333.6.4 Modeling....................................................................................................................................34
3.7 VIEWED STAND-ALONE VS. FULL RISK PORTFOLIO...........................................................................354. USES OF RISK ASSESSMENTS.............................................................................................................414.1 RISK CONTROLLING...........................................................................................................................414.2 RISK TRADING...................................................................................................................................424.3 RISK STEERING..................................................................................................................................425. LIMITATIONS OF RISK ASSESSMENTS...............................................................................................445.1 UNDERSTANDING THE LIMITATIONS..................................................................................................445.2 THE CAUSES & DANGERS OF OVER-RELIANCE...................................................................................455.3 COMMUNICATING THE LIMITATIONS..................................................................................................466. DESCRIPTION OF CARE REPORT......................................................................................................47APPENDIX A – BIBLIOGRAPHY................................................................................................................48APPENDIX B – REFERENCES....................................................................................................................49APPENDIX C: RISK CREATED BY REGULATION (ROUGH!)......................................................................50Appendix D - The Mathematics of Frequency and Severity...................................................................52
2

DRAFT
Project OverviewComprehensive Actuarial Risk Evaluation (CARE) - this project will develop a white paper that describes a comprehensive evaluation of a risk. By comprehensive, I mean that the analysis will quantify risk from numerous perspectives, such as market consistent vs. fundamental value, short term vs. long term, known risks vs. emerging risk elements, frequency risk (earnings volatility) vs. severity risk (solvency); viewed stand-alone and in the context of the full risk portfolio.
Some concepts, such as regulation, are industry specific. In these cases, the paper will be limited to Life Insurance, P&C Insurance, Banking, Pensions and Investments. This does not mean that the rest of the paper can not be used for trans-industry assessments.
The goal for this project is that we, in the actuarial profession, position ourselves as the risk professionals who will be most qualified and prepared to completely evaluate a risk from all points of view. A document of this type will provide a standard for a thorough review and will provide a systematic description of the comprehensive evaluation that actuaries will use in risk reports. It will allow us to clearly cite what part of the comprehensive evaluation that we did or did not perform in a particular situation. This paper will provide a generic description of this risk evaluation and give numerous examples of how this may then be applied to specific risks that actuaries are commonly called to evaluate.
3

DRAFT
Project Working Group
Karen Adams ACAS, MAAA Nicholas J. Albicelli, F.S.A.Mei DongVivek GuptaDavid Hopewell FSA, CFADave Ingram, CERA - Project Leader Lars PralleLarry Rubin, FSA, MAAA Kailan ShangVictor Shi, FSA, MAAA - Project Manager Prabhdeep Singh, CERABob ThompsonElliot Varnell Betsy WardAndy White - Web Master
[Need to update this and fill in credentials for entire group]
4

DRAFT
1. Introduction - Why CARE?
In today's world, the risks facing large global financial firms become more and more complex and the severity of risk management failures force the stakeholders to demand from the senior management better risk transparency and a more robust risk-adjusted decision-making process. This demand has boosted the rapid development of ERM (enterprise risk management) in recent years.
There are various ERM frameworks in existence (including the CAS and COSO frameworks), but there are currently no global actuarial professional standards for ERM and risk evaluation performed by an actuary. The primary purpose of CARE is to provide a starting framework for a comprehensive evaluation of risk to be performed by actuaries to germinate the best actuarial practices in this field. The secondary purpose is to equip the actuarial profession with a valuable toolkit that increasingly demands more exposure at the highest levels of the financial institutions and that can contribute to the elevation of the reputation of and the demand for the actuarial profession.
Historically, risks in financial service industries are measured and managed by different cohorts of people with distinct backgrounds and siloed views on risks. Those different views of risks are often fragmented and inconsistent with each other. Incomplete or inconsistent risk evaluation greatly hinders successful risk management, as firms must create the "big picture" of risks for senior management to enable a company-level view on overall risk exposure, give perspective on risk-adjusted returns of various business activities, and empower the right risk-adjusted capital allocation decisions. The holistic view requires financial firms to adopt comprehensive and consistent risk assessment and measurement techniques to derive a broad panorama of the enterprise risks and enable the risk-adjusted decisions. CARE facilitates senior management involvement and enables an actuary to get a seat at the table by providing the top management with a "big picture" of risks to support the executive agenda.
Why comprehensive?
Small negligence can have big impacts
o Lessons learned from Barings Bank, Bear Stearns and other financial failures is that troubles created from one relatively small legal entity can have a huge impact on an organization no matter how robust / healthy other business are. It is not permissible to write insurance/coverage/CDF etc. for an "event that will never happen." and put down less than adequate funding to survive the event. If the firm can not survive the event, it should not be actuarially sound practice to say that it is insured/covered etc., no matter how unlikely the event seems to be.
Financial firm need deep and comprehensive understanding of the risks they are taking due to the nature of their risk-taking business
o No matter whether the risk management techniques are bottom-up or top-down, financial services firms need a holistic and comprehensive understanding of the risks. This means the firms should fully understand:
1) Individual risks2) Risk correlations3) Risks on the corporate balance sheet4) Risks that are off the corporate balance sheet6) Economic risk position (as opposed to only accounting view)5) Risks both at the holding company level as wll as the subsidiary level
5

DRAFT
6) Implications of risk position on the company activities and strategy Solve practicality issues
o Different sized companies have different levels of sophistication with regard to risk management.
o A comprehensive evaluation of risks could provide options such that insurers could select their best fit.
Conduct comparison and assessment of different risk measuring approaches o The goal of CARE is to gain deeper understanding of risks as well as risk measurement
approaches o Insurers need to know the advantages and limitations of each risk measuring approach and
develop methods for managing the limitations. Maintain a consistent view of risk appetite accross the enterprise to enable approproate risk-
adjusted business decisions o A comprehensive view on risk exposure allows the Board and senior management to set the
appropriate risk appetite for the firm, which can then be cascaded down to the business units and by risk type and used to guide strategic and tatical business decisions
Why actuarial?
Actuaries are in a good position to evaluate the risks in financial services business due to their strong analytical capabilities and technical expertise
Actuaries own the risk models - they understand the model, inputs, outputs, and limitations. o Actuaries have a healthy respect for the limitations of models. Models don't predict the
future and don't replace judgement. They merely help gain better insights and understandings as to what can go wrong given the inputs used.
Actuaries are the architects of product cash flows and resulting business economics Actuaries are PRUDENT risk experts - actuarial training focuses on prudently taking and managing
risks as well as a deep respect for the risk of the unknown.
6
DRAFT
2. Defining Risk
Risk is defined in the Compact Oxford English Dictionary as:
1. A situation involving exposure to danger.
2. The possibility that something unpleasant will happen.
3. A person or thing causing a risk or regarded in relation to risk: a fire risk.
Our definition of risk is the potential for an outcome with negative consequences. A negative consequence can be the failure to meet objectives, fulfill realistic expectations or take advantage of a positive (profitable) opportunity.
2.1 Perspective
The actuary assessing risk must look at it from a specific perspective. How is that perspective defined? The perspective is defined by:
The frame of reference - what entity is assuming or relinquishing the risk? Answers could be: a person, a company, a single line of insurance, a government, a group of companies etc.
The base-line - Where is the origin of the graph? (What graph?)
- Is the baseline solvent? In this case, the risk is the risk of insolvency. If the entity remains solvent, this is a "win" and insolvency is a "loss."
- Is the baseline a projected ROE so that meeting expected ROE is a win, and going below expected ROE is a loss?
- Is the baseline ROE in comparison to competitors' ROE? ( Note that this could be a way of measuring the cost of some lost opportunities, since if an obvious opportunity exists that is available to all, then it is likely that some competitors will take advantage of it. If your company or entity doesn't, then it will lose ground (profitability, market share etc.) in comparison to others.
- Is the risk absolute (i.e. relative to zero)
The nature of the consequences
- Negative consequences might be losses or they might be gains that are lower than the realistic expectations.
- What is the potential variability of the outcome and how bad (or good) can the outcome be?
- How are consequences measured? Are they quantifiable?
- Financial
- Reputational
- Temporal (lost time)
- Opportunity
- Others
7
DRAFT
From this perspective, the management of risk is not to predict the future. Instead it is about preparing what is possible with negative consequences. As addressed later, by projecting key financial figures, actuaries tend to model different types of risks and translate them into financial terms. However, this projection is certainly not a prediction of the future, but an assessment or measurement of the future with the best available information and business judgment.
It is likely that a single report would choose to measure risk in more than one way. The measurements used, (and possibly those not used) would be disclosed.
While it is not possible to model every risk, we should translate each risk into something fungible for example money based on the best obtainable information about the future. Otherwise, it becomes impossible to compare one risk to the other or to aggregate risks. Percentage of shareholders' equity, market value of assets, net revenue, and net profits are other common measures of risk. Translating lost opportunity, lost time, or lost reputation into monetary terms will either take defining the specific scenario or estimation of a range of likely results.
2.2 Taxonomy of Risk
There are many ways to classify risk. A risk assessment should examine each of these classifications for applicability.o Systemic vs. Non-Systemic: “Systemic” risk refers to the interrelations of various entities or their
exposures. An entity is exposed to systemic risk if due to contracts or other relations between entities that either (A) the liquidation of another non-affiliated entity (such as a bank or insurance company) would potentially cause the failure more than one non-affiliated entity including the entity being analyzed or (B) the failure of the entity being analyzed could potentially cause the failure of more than one non-affiliated entity.
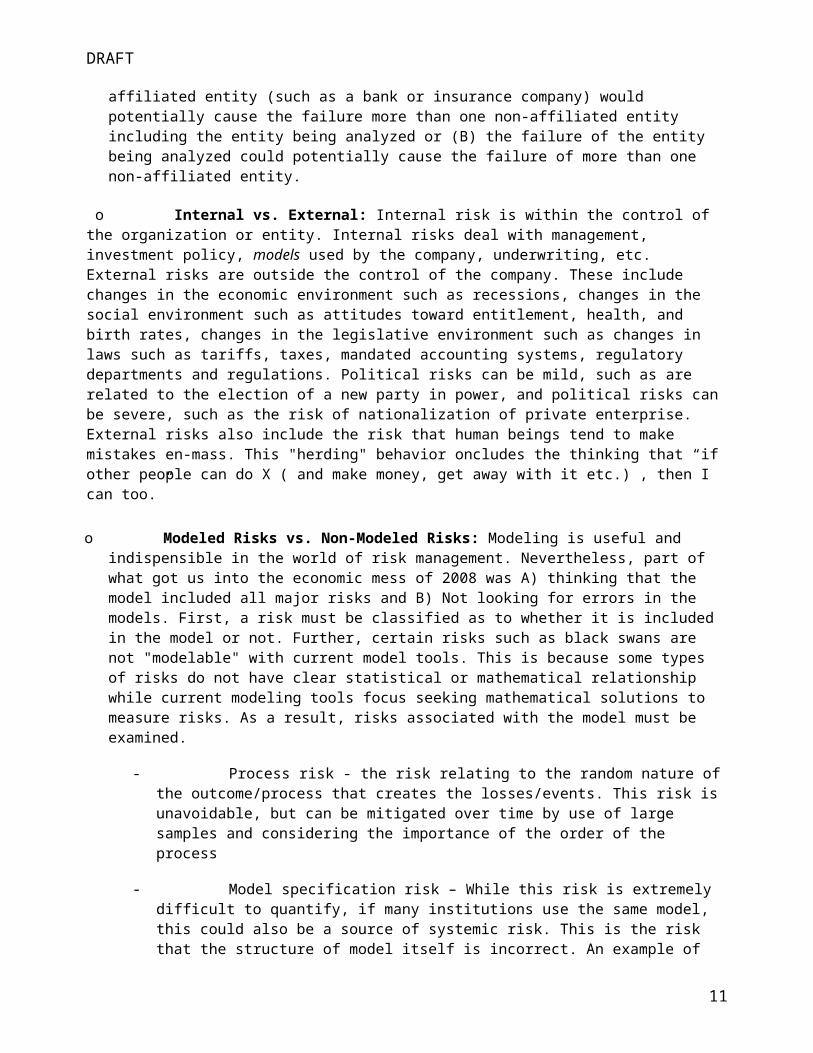
o Internal vs. External: Internal risk is within the control of the organization or entity. Internal risks deal with management, investment policy, models used by the company, underwriting, etc. External risks are outside the control of the company. These include changes in the economic environment such as recessions, changes in the social environment such as attitudes toward entitlement, health, and birth rates, changes in the legislative environment such as changes in laws such as tariffs, taxes, mandated accounting systems, regulatory departments and regulations. Political risks can be mild, such as are related to the election of a new party in power, and political risks can be severe, such as the risk of nationalization of private enterprise. External risks also include the risk that human beings tend to make mistakes en-mass. This "herding" behavior oncludes the thinking that “if other people can do X ( and make money, get away with it etc.) , then I can too.”
o Modeled Risks vs. Non-Modeled Risks: Modeling is useful and indispensible in the world of risk management. Nevertheless, part of what got us into the economic mess of 2008 was A) thinking that the model included all major risks and B) Not looking for errors in the models. First, a risk must be classified as to whether it is included in the model or not. Further, certain risks such as black swans are not "modelable" with current model tools. This is because some types of risks do not have clear statistical or mathematical relationship while current modeling tools focus seeking mathematical solutions to measure risks. As a result, risks associated with the model must be examined.
- Process risk - the risk relating to the random nature of the outcome/process that creates the losses/events. This risk is unavoidable, but can be mitigated over time by use of large samples and considering the importance of the order of the process
8
DRAFT
- Model specification risk – While this risk is extremely difficult to quantify, if many institutions use the same model, this could also be a source of systemic risk. This is the risk that the structure of model itself is incorrect. An example of this risk might be the erroneous use of the lognormal distribution when we should have used a lognormal curve below $100M and a pareto distribution above $100M
- Parameter selection risk – the risk that the parameters selected for the model are incorrect. Any model will include parameters. These parameters must be calibrated using either data or judgment (preferably both). Any data will always be limited in both volume and relevance. The selection of parameters will always be subject to parameter risk. Parameter risk can also be a source of systemic risk if many institutions use similar parameters.
· Example: Default rate is a parameter. If all insurers/creditors use a credit default rate that is too low, then when one institution fails, they may all fail. Mortgage insurers and mortgage lenders prior to 2007, used historical default rates to estimate maximum probable loss. These default rates were incorrect due to the fact that historical default rates were incurred in the era prior to “interest-only loans” sub-prime mortgages, and a large number of variable rate mortgages.
o Known vs. Emerging vs. Unknown risks: (Section 3.5) Risks fall across a spectrum, where at one extreme are the fully known loss distributions of closed games to the risks that have followed similar loss patterns for significant periods of time. Emerging risks have varying past experience that may or may not be sufficient to form a reliable prediction of future loss distribution. At the extreme end of the range are risks that are known to exist but that have almost totally uncertain loss distributions, and finally are those risks that are not currently known to exist, some of which may be “black swans”.
o Short Term vs. Long Term Risks: (Section 3.4) “Term” refers to the time between initiation of the event and conclusion of the event. This is not to be confused with high frequency versus low frequency risks. Global climate change, for example, is a long term risk experienced over decades. A hurricane is a low-frequency, high severity, and short-term risk. It is short term in the sense that the effects of the hurricane are incurred within the span of several days.
o Low Frequency High Severity vs. High Frequency Low Severity Risks (Section 3.6). High frequency low severity risks are events that because of their frequency are fairly well predictable in-aggregate. High frequency low severity risks include automobile physical damage, and home-owners insurance in non-catastrophe prone areas. Low frequency high severity events include hurricanes and earthquakes. Low frequency is not to be confused with Long Term ( section 3.4) . Term refers to the time span over which the event occurs. An earthquake is a low frequency event, and also a short term event. Some pollution events covered by the federal “Superfund” are long term in that the pollution was created over decades. Hopefully these are also low frequency events.
2.3 Risk appetite
As well as defining what is meant by 'risk', management must also decide on how much risk they want to expose themselves to, both in terms of target risk exposure and maximum limits on how much risk they are willing to take on. To define a risk appetite requires 'risk' to be defined in an explicit way including: frequency, magnitude and time horizon.
9
DRAFT
3. Multi-dimensionality of Risk
3.1 Market Consistent Value vs. Fundamental ValueOne of the most consequential decisions about how risk is measured is how to incorporate market data in the measurement of the risk. To quote Warren Buffett, "In the short run, the market is a voting machine. In the long run, it's a weighing machine." The purpose of the risk evaluation will be a key driver of the relative importance of market consistency of analysis performed. If the risk could lead to irreparable damage to the enterprise or its stakeholders in the short term then market consistency is of key importance. If it is possible to trade out of the impact of the risk then management will be interested in longer term assumptions based on best estimates rather than the whims of the market. In all cases though both approaches provide useful information. If the two approaches give widely different outputs then the reasons for these differences and their implications need to be clearly understood Assuming that the risk under consideration will be ultimately realized (if at all) as one or more cash flows whose amount and/or timing is uncertain, it is desirable to express information about that risk as a single value which is comparable to other amounts. One common way to express a risk as a single value is the cost of hedging or removing the risk; this can be called the "price" of the risk. For risks directly associated with readily marketable securities the quantification of the risk as an amount of cash held today is simply the current market value of the basket of securities required to hedge this risk since the risk can be completely neutralized by exchanging it for that amount of cash. There are many risks which cannot be priced so directly. Fortunately, there is a framework for dealing with contingent claims, that is, claims that are contingent on the value of some other directly measurable amount. The Fundamental Theorem of Asset Pricing asserts that a market is arbitrage-free if and only if there exists a martingale measure equivalent to the real world measure. This has been proven for a wide variety of processes. Arbitrage opportunities do not appear to be readily available in real markets, which is fortunate because arbitrage opportunities would be pathological to any reasonably simple model. Therefore, we assume no arbitrage, assume some underlying real world stochastic process, and find the equivalent martingale measure where we can price any cash flow by expectation under the martingale measure. Furthermore, if the market is assumed to be complete, then the martingale measure is unique, implying a single price for any instrument. Market consistentOf course, there are problems, such as what model to assume for a real world process (e.g. include jumps? how many factors in a multi-factor model?) but the problems are not insurmountable. These models usually give values for the risks which have several advantages over other methodologies. For example, they have both some theory and clearly observable data to support them, appear to be objective, and generally give reasonable values. Because of these positive characteristics, many market participants use these models in their decision-making process, which, combined with the fact that sometimes the assumptions hold well enough to accurately reflect the actual market process, tends to keep the actual market price around the levels indicated by the pricing models. The major drawback of these models, like all models, is that they are simply a reflection of reality, and while they are often useful, there are differences between the assumptions of the models and the real world and one should not confuse the map with the territory. For example, there are many markets which are not complete, and therefore do not support unique prices, or during times of stress, where firms cannot obtain the funding necessary to arbitrage away even real arbitrage opportunities so arbitrage opportunities persist. And
10
DRAFT
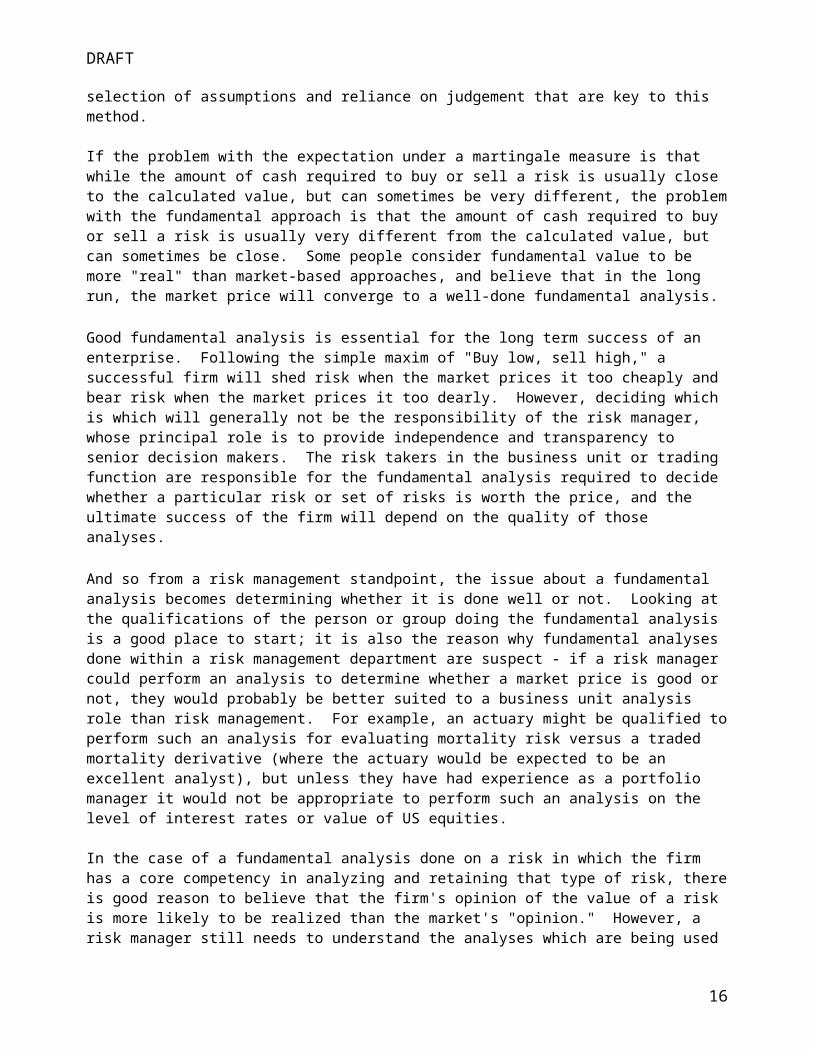
unfortunately for risk managers, it is generally in those scenarios where we are concerned about risk the most. Nevertheless, the fundamental theorem of asset pricing and the assumption of no arbitrage provides a powerful tool that is useful for projecting the price of a risk under many scenarios. Fundamental analysis The major alternative to pricing under a martingale measure is to use a fundamental analysis. A fundamental analysis is an attempt to arrive at the "true" value of a risk for the purpose of determining whether the market values the risk too dearly or too cheaply. It may use historical or even current price information but what distinguishes a fundamental analysis from a market analysis is the substitution of the judgement of the person doing the analysis for the value as seen in the market or as calculated based on market values and the Fundamental Theorem of Asset Pricing. Under a market-based approach, using the same methodology and the same data, two different practitioners will arrive at the same results (again, assuming a complete market so that prices are unique). However, two different fundamental analysts can use the same methodology and the same data and arrive at very different conclusions because of the selection of assumptions and reliance on judgement that are key to this method. If the problem with the expectation under a martingale measure is that while the amount of cash required to buy or sell a risk is usually close to the calculated value, but can sometimes be very different, the problem with the fundamental approach is that the amount of cash required to buy or sell a risk is usually very different from the calculated value, but can sometimes be close. Some people consider fundamental value to be more "real" than market-based approaches, and believe that in the long run, the market price will converge to a well-done fundamental analysis. Good fundamental analysis is essential for the long term success of an enterprise. Following the simple maxim of "Buy low, sell high," a successful firm will shed risk when the market prices it too cheaply and bear risk when the market prices it too dearly. However, deciding which is which will generally not be the responsibility of the risk manager, whose principal role is to provide independence and transparency to senior decision makers. The risk takers in the business unit or trading function are responsible for the fundamental analysis required to decide whether a particular risk or set of risks is worth the price, and the ultimate success of the firm will depend on the quality of those analyses. And so from a risk management standpoint, the issue about a fundamental analysis becomes determining whether it is done well or not. Looking at the qualifications of the person or group doing the fundamental analysis is a good place to start; it is also the reason why fundamental analyses done within a risk management department are suspect - if a risk manager could perform an analysis to determine whether a market price is good or not, they would probably be better suited to a business unit analysis role than risk management. For example, an actuary might be qualified to perform such an analysis for evaluating mortality risk versus a traded mortality derivative (where the actuary would be expected to be an excellent analyst), but unless they have had experience as a portfolio manager it would not be appropriate to perform such an analysis on the level of interest rates or value of US equities. In the case of a fundamental analysis done on a risk in which the firm has a core competency in analyzing and retaining that type of risk, there is good reason to believe that the firm's opinion of the value of a risk is more likely to be realized than the market's "opinion." However, a risk manager still needs to understand the analyses which are being used to make decisions about taking risk. Decision makers tend to look at measures of central tendency to make decisions; the question becomes whether this is this a good transaction "on average" or "most of the time." However, the risk manager needs to provide transparency into the whole array of possibilities, the "distribution," so to speak. A risk manager could make use of the fundamental analysis, potentially stressing key assumptions to try to look at this distribution or modifying the methodologies as a test for model error. A risk manager might also coordinate with the control function to ensure the integrity of the data being used in the analyses.
11

DRAFT
But where a fundamental analysis is believed to be done poorly, or the case of a risk retained where no fundamental analysis was ever done, it is tempting to try to fill in the blanks and perform a more thorough fundamental analysis within the risk management department. But without the appropriate expertise to do this properly, assigning a number to the risk might create a false sense of understanding of a risk which is not really well understood. A market-based approach to measuring this risk has the advantage of expressing the risk at a price that it actually can be disposed at, which is probably what should be done. If the risk cannot be hedged or disposed of or if management decides to retain the risk regardless of the quality of the analysis done in making the original decision to obtain the risk, the risk manager should work to ensure that the firm develop the expertise necessary to making proper decisions regarding that risk and others like it. In areas where the risk manager defers to the analysis done by the business units and performs oversight and analysis of model error of the fundamental models developed by subject matter experts, risk managers should develop their own market-based approach to looking at risk. Such an analysis highlights to senior decision makers those areas where a business unit's opinion of a risk and the market's opinion of the risk diverge most significantly, providing a useful second opinion on the level of risk that the firm is bearing. Further, when reporting risk measures to third parties, the relative subjectivity of fundamental based approaches as well as the greater likelihood for external parties to dispose of the risk at market prices makes it less appropriate when market-based alternatives are available.
3.2 Accounting Basis vs. Economic BasisAccounting Basis
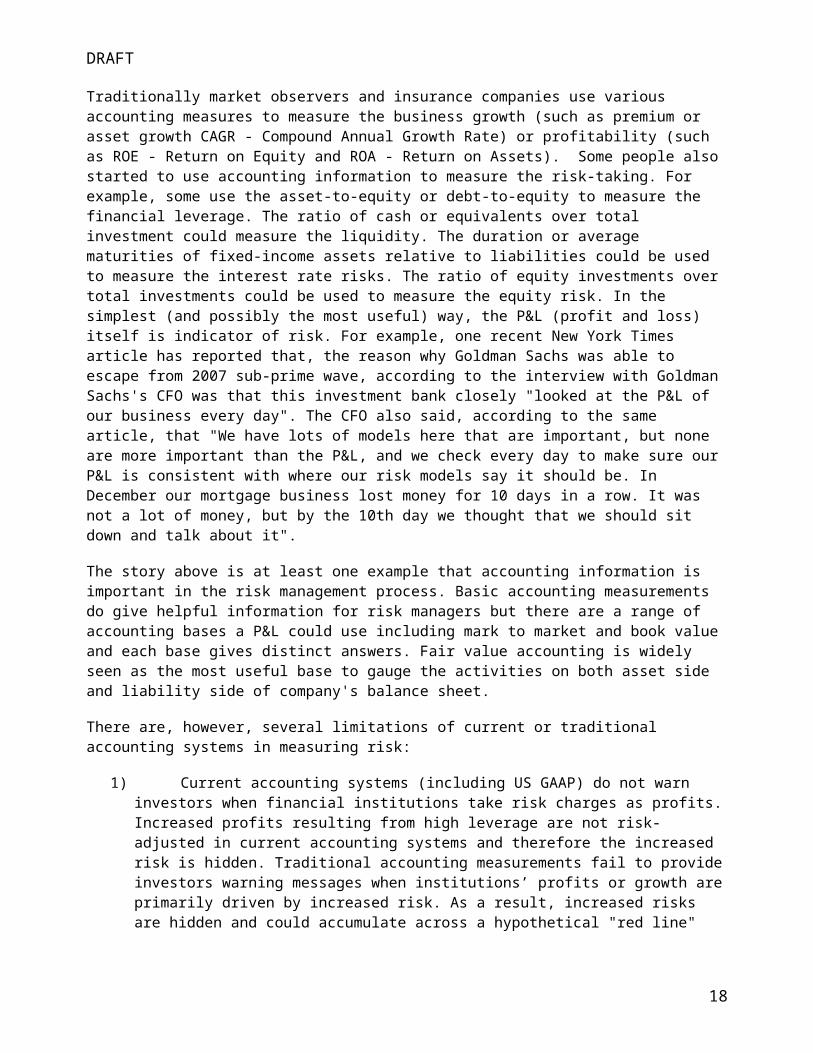
Traditionally market observers and insurance companies use various accounting measures to measure the business growth (such as premium or asset growth CAGR - Compound Annual Growth Rate) or profitability (such as ROE - Return on Equity and ROA - Return on Assets). Some people also started to use accounting information to measure the risk-taking. For example, some use the asset-to-equity or debt-to-equity to measure the financial leverage. The ratio of cash or equivalents over total investment could measure the liquidity. The duration or average maturities of fixed-income assets relative to liabilities could be used to measure the interest rate risks. The ratio of equity investments over total investments could be used to measure the equity risk. In the simplest (and possibly the most useful) way, the P&L (profit and loss) itself is indicator of risk. For example, one recent New York Times article has reported that, the reason why Goldman Sachs was able to escape from 2007 sub-prime wave, according to the interview with Goldman Sachs's CFO was that this investment bank closely "looked at the P&L of our business every day". The CFO also said, according to the same article, that "We have lots of models here that are important, but none are more important than the P&L, and we check every day to make sure our P&L is consistent with where our risk models say it should be. In December our mortgage business lost money for 10 days in a row. It was not a lot of money, but by the 10th day we thought that we should sit down and talk about it".
The story above is at least one example that accounting information is important in the risk management process. Basic accounting measurements do give helpful information for risk managers but there are a range of accounting bases a P&L could use including mark to market and book value and each base gives distinct answers. Fair value accounting is widely seen as the most useful base to gauge the activities on both asset side and liability side of company's balance sheet.
There are, however, several limitations of current or traditional accounting systems in measuring risk:
1) Current accounting systems (including US GAAP) do not warn investors when financial institutions take risk charges as profits. Increased profits resulting from high leverage are not risk-adjusted in current accounting systems and therefore the increased risk is hidden. Traditional accounting measurements fail to provide investors warning messages when institutions’ profits or growth are primarily driven by increased risk. As a result, increased risks are hidden and could
12

DRAFT
accumulate across a hypothetical "red line" without early warning and thus trigger a crash of investor confidence when the hidden risks explode.
2) Current accounting systems are not economic based, meaning that the earnings are neither risk-adjusted nor do they reflect changes in the market. Definitional differences of contracts can have a large impact on the accounting. Two contracts that are very similar from a cash flow perspective can show a very difference incidence of revenue and profit recongnition. This is because the current accounting system is created to match revenues with expenses rather than to reflect risk-taking or value creation. In addition the equity reported under the current accounting framework is not economic. If an investor is only looking at ROEs, he or she could incorrectly presume that a company with lower ROE is "worse" than an aggressive company with higher ROEs. Another example is that, in the U.S., the GAAP requires life actuaries to use the assumptions at policy acquisition to value their liabilities for certain types of business. This will soon change, for example as the methods for calculating life reserves in the United States are undergoing a fundamental change and will soon become “risk based”
3) Current accounting rules for insurance do not disclose to the investors all the risks that enterprise is taking. For example, although the asset-to-equity ratio can be used to measure the leverage, this is only one of many sources of risk. Practitioners must understand that different types of business have different risks, thus have different capital requirements. The leverage ratio for a company that is writing auto insurance and investing on government bonds may not be appropriate for a company whose balance sheet is loaded with variable annuities with guaranteed living benefits and investing in non-investment grade corporate bonds .
4) Current accounting rules (and maybe any accounting rules) are a product of compromise of interests of different counterparties and also incorporate a balance between theoretical correctness and practicality. Thus no single accounting statement may truly represent the specifics of an individual company.
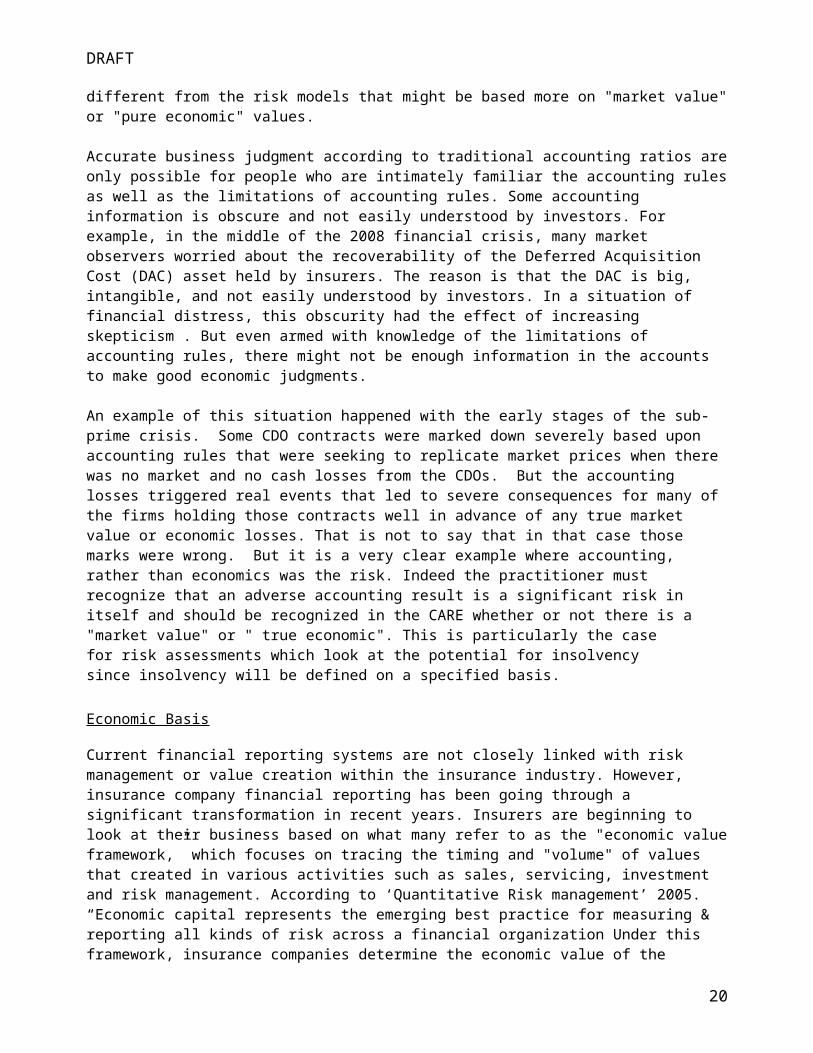
For all accounting systems, the actuary must be aware that accounting rules, however well intended or favorably described, may in some cases represent a different timing, amount or even direction of result than a "pure economic" or "real market" approach to risk. It is therefore always relevant for the actuary to test whether the accounted results are different from the risk models that might be based more on "market value" or "pure economic" values. Accurate business judgment according to traditional accounting ratios are only possible for people who are intimately familiar the accounting rules as well as the limitations of accounting rules. Some accounting information is obscure and not easily understood by investors. For example, in the middle of the 2008 financial crisis, many market observers worried about the recoverability of the Deferred Acquisition Cost (DAC) asset held by insurers. The reason is that the DAC is big, intangible, and not easily understood by investors. In a situation of financial distress, this obscurity had the effect of increasing skepticism . But even armed with knowledge of the limitations of accounting rules, there might not be enough information in the accounts to make good economic judgments. An example of this situation happened with the early stages of the sub-prime crisis. Some CDO contracts were marked down severely based upon accounting rules that were seeking to replicate market prices when there was no market and no cash losses from the CDOs. But the accounting losses triggered real events that led to severe consequences for many of the firms holding those contracts well in advance of any true market value or economic losses. That is not to say that in that case those marks were wrong. But it is a very clear example where accounting, rather than economics was the risk. Indeed the practitioner must recognize that an adverse accounting result is a significant risk in itself and should be recognized in the CARE whether or
13

DRAFT
not there is a "market value" or " true economic". This is particularly the case for risk assessments which look at the potential for insolvency since insolvency will be defined on a specified basis.
Economic Basis
Current financial reporting systems are not closely linked with risk management or value creation within the insurance industry. However, insurance company financial reporting has been going through a significant transformation in recent years. Insurers are beginning to look at their business based on what many refer to as the "economic value framework,” which focuses on tracing the timing and "volume" of values that created in various activities such as sales, servicing, investment and risk management. According to ‘Quantitative Risk management’ 2005. “Economic capital represents the emerging best practice for measuring & reporting all kinds of risk across a financial organization Under this framework, insurance companies determine the economic value of the capital invested in their business and the economic value of earnings to derive a risk-adjusted return on capital. Standard setters, primarily European insurance regulators through Solvency II and the International Accounting Standards Board through IFRS Phase II, propose adopting many of these concepts for solvency and performance reporting.
There are two major aspects of the "next generation" economic valuation:
1. The economic view of value creation (i.e. how, when and how much value is created)
2. Market consistency (i.e. how timely, transparent, reliable and comparable are the financial figures that investors rely on).
The economic view of the insurance business tracks how and when values are created for owners. In its simplest form, the economic value of earnings is equal to cash flow plus the change in the economic value of the assets minus the change in the economic value of liabilities. Economic liabilities are the present value of expected cash flows plus an additional amount that would provide investors a return for placing their economic capital at risk (the "risk margin"). Typically, economic earnings equal the risk margin, and economic earnings divided by economic capital represents the return on capital. This return on capital can be used to measure the value creation from insurance underwriting activities.
Management creates economic value if return on economic capital equals or exceeds the cost of capital. One of the core components of the economic view of insurance business is the nature of being "risk adjusted.” This means the values insurers create for their investors are adequate compensation for the risks the investors take. In order to accurately measure risk-taking activities such as underwriting and investment, from an economic perspective, an insurance company must construct an economic balance sheet and an economic income statement.
The market consistency is another key aspect of economic valuation. The fair value accounting (or mark-to-market accounting) is one of the major steps moving towards market consistency. The FAS 157 accounting rule under US GAAP is one of the important developments of this change although this accounting has been criticized during the 2008 financial crisis. Although FAS 157 currently has many problems to be corrected, it represents one key movement of more transparent and comparable financial reporting. It is by far the most reliable accounting to gauge the market expectations and deliver the "nearest to reality" information to investors. In our view, as part of the movement to economic valuation, the trend of using fair value reporting could not be reversed as investors do not want to go back to dark again.
One important development in the area of economic valuation is the growing popularity of market-consistent embedded value (MCEV). MCEV reporting, popular in Europe and Canada, tries to capture the value of an insurance business by discounting the future projected cash flows under the most realistic scenarios. The options and guarantees are valued consistently with the approaches in modern financial economics. The
14

DRAFT
investment assumptions are market consistent so that investors could compare company to company of their insurance underwriting performance as well as compare insurance operations to non-insurance financial institutions. Many large insurance firms already started to disclose their MCEV to in conjunction with their regular financial reporting such as GAAP or IFRS. However, the MCEV is still neither truly economic, nor fair value. This is because:
- The non-market assumptions (most actuarial assumptions) are still entity-specific, not market consistent.
- MCEV does not explicitly refer to risk margins, although it does include a cost of capital provision, which is implicitly a risk margin. Thus it is not fully risk-adjusted reporting.
- MCEV uses internal models to determine capital level as well as the cost of capital. Under MCEV, the compensation to the investor for assuming risk is typically calculated using a capital rate applied to the appropriate level of capital. This compensation is a cost no different than any other expense. In determining the appropriate level of capital, many companies rely on external rating agency models targeting a desired credit rating or regulatory capital requirement rather than internal economic capital estimates. While these capital models are grounded in assessing the underlying risk of the products, they generally employ "average" factors that do not vary by product and may not reflect the unique risks of the business being valued. Additionally, the cost of capital rate is typically based on company-specific targets and a company's own capital structure. The degree of consistency with external investor expectations varies. Instead of using an economic capital rate that is the market's view of the specific risk, MCEV typically employs the insurer's view of risk based on average factors.
Insurers generally face challenges on how to quantify the risk-taking and returns between two separate business activities - insurance underwriting and investment. One view could see insurance underwriting as a vehicle to raise funds via collecting premiums or fees. Insurance companies would then take this fund to generate profits through their strategic and tactical investment activities. Underwriting creates value by raising funds at a cost lower than the entity's risk adjusted cost of capital, including the case where this cost is negative (ie underwriting profit is generated). The key risks embedded in underwriting activities are both the systematic and catastrophic fluctuations in the claim paying process and also in companies' operations that support underwriting. Investment creates value by beating the benchmark return. The key risks in fund management are mainly credit risk, ALM risk, liquidity risk, and equity market volatility. Measuring value-added relative to risk of those two different functions would significantly enhance management's decision making and increase the company's transparency. This is actually the "heart and soul" of economic valuation.
1. Economic Balance Sheet.
An insurance company's balance sheet essentially shows the company's value creation status under today's environment. Insurers entered contracts with policyholders by giving "promises" when future loss events occur in exchange of compensation - premiums or fees. From this perspective, insurers are funding their balance sheet by "borrowing" money from policyholders except their future re-payments are contingent on certain events. Another source of funding is the capital raised from shareholders
Economic view of assets
The economic view of assets represents the market value of the funds insurers raised from different sources: policyholders and shareholders. This economic view should not include any intangible assets such as goodwill under US GAAP or IFRS. Asset managers add value by beating the benchmarks (For an explanation of the benchmark, see the appendix).
15
DRAFT
Economic view of liabilities
The economic view of liabilities represents the market value of insurance obligations. For business without material embedded options; this economic view should value liabilities under deterministic scenarios. For business with material embedded options, the economic view must be consistent with option valuation methods in the financial market. Although market valuation methods may have to use entity-specific assumptions, it should use market inputs as far as possible.
Economic capital
Insurers' capital level is determined by the risks they are exposed to. There are many risk based capital concepts in the insurance industry. In the past, risk based capital was determined by regulatory requirements or rating agency models using a target rating. There are some rule of thumb linkages of both regulatory and rating agency capital. For example, an RBC ratio of 350% in the U.S. is approximately an AA rating from S&P. In recent years, the industry has actively discussed and implemented the economic capital concept - quantifying a company's capital level according to entity specific risks. The most popular way to quantify economic capital is with a bottom-up approach:
1. Some types of risks (such as credit, equity, insurance and /or operational risks) are modeled on a business unit level by shocking several key risk factors such as equity performance, interest rate, mortality or policyholder behavior assumptions. Stochastic economic scenarios will generally be provided to do stress testing.
2. Diversification effects will be considered on a corporate level after aggregating risks together. When determining the level of economic capital, the most popular definition is the level of capital that an insurance company must have to be able to absorb all losses within 12 months with a 99.5% probability. This VaR measure is used in the upcoming Solvency 2 regime in the European Union, the current UK regime and in Australia.
No matter how the economic capital is approached, the current practices of economic capital modeling represent management's view of risks. In a broader context, there are two basic philosophies how insurers could look at their balance sheet and capitalization:
1. The economic capital is to mature the future obligations to keep the company adequately capitalized even under severe economic or underwriting shocks. This is called the "liability runoff" view of economic capital. This view of economic capital measures an insurance company's ability to meet its future obligations under alternative scenarios and is the approach generally preferred by US regulators.
2. The economic capital is to compensate the market participants with the risks embedded in the business. This is so-called "exit value" view of economic capital, which measures (on a risk adjusted basis) the funds that are available to investors, or in simple words, how much capital the company need for investors willing to purchase their business without paying additional costs.
Funding of economic capital
It is challenging task of discussing how to fund the capital in an insurance company's balance sheet. There are two major sources of capital for a typical public company:
1. Fund capital with shareholders' equity 2. Fund capital by issuing debts to creditors.
16

DRAFT
It is obviously more expensive if a company chooses to fund their capital with equity. However, this is also safer than borrowing. The purpose of setting up economic capital is to ensure adequate capitalization level of the company. Funding capital with borrowing inevitably increases the leverage of the company, and thus the risk of the company. On the other hand, for capital intensive businesses like insurance, funding capital with equity leads to lower performance, especially when equity capital is scarce or expensive. Some writers have commented that economic capital is the definition of how much equity should be in the business and that debt should be used to fund capital needs, such as the difference between economic and regulatory capital, that is above economic.Capital can also be funded with "soft capital" sources such as surplus notes, subordinated debts, credit facilities, or other forms of contingent capital. Compared with equity, those are generally "cheaper" capital sources. However, depending on the risk profiles and contract features, these sources of capital might create additional risks paticularily if economic capital is not at the right level.
2. Economic Income Statement
The economic view of income statement captures the underlying economics of insurance. In theory, it should
correctly reflect the changes of the economic balance sheet and clearly identify the sources of income (via
various activities that either add or destroy values).
The key to the economic view of income statement is to identify the real sources of income. The possible
sources of income for insurance business may include (but are not limited to):
Gain at issue through acquisition of new policies
o Economic rent capturing policyholder inefficiency
o Value creation via proprietary distributions
o Cost of acquisition (of new policies) lower than cost of capital
Experience variance (e.g. mortality, morbidity, spread, expenses, taxes, etc)
Release / increase of risk margins
Assumption changes and model changes
Reduction of frictional costs (via activities such as risk management, capital planning or transactions)
Proprietary investment and trading activities by outperforming a benchmark (after risk adjustments).
The investment spread could be attributed into:
o True trading outperformance via asset allocation and security selection
o Profits from increased leverage
o Intentional ALM mismatch and /or hedging ineffectiveness
3.3 Regulatory Measure of Risk
17
DRAFT
3.3.1 Introduction
A Comprehensive Actuarial Risk Evaluation (CARE) needs to include consideration of the applicable prudential regulatory standards. In many jurisdictions, the prudential standards have been migrating to very well considered risk based values for both technical provisions (reserves) and for capital requirements. But consideration of the prudential standards is necessary whether those standards are based on a good risk evaluation or not. The CARE should include a statement comparing the regulatory standards for the risk or company being evaluated to the company's internal capital assessment and the other bases for risk evaluation. Situations where the regulatory standards are higher than the company's internal capital assessment the other evaluations should be clearly identified as well as risks where the standards are significantly lower than the company's assessment other evaluation bases. The CARE report should include appropriate cautions about each of those situations as they arise.
Firms that take risks where the regulatory standard is significantly higher than their own assessment other risk evaluations maywill sometimes choose to ignore the regulatory standards in their decision making. And firms that take risks where the regulatory standards are significantly lower than their other evaluations are often tempted to base their decisions on the "official" standard. The first type of firm may ultimately hold a level of capital that regulators deem inadequate as returns do not reflect the cost of the excess regulatory capital.s will sometimes run into trouble with their regulator for capital adequacy issues The second type of firms will have their rude awakening eventually. This epiphany could occur when large random losses occur which are improbable over any short-term horizon (low frequency), but inevitable in the long term (high impact), when the external environment changes unexpectedly, or even when the regulatory standards are suddenly revised upwards to a more reasonable level that they had not prepared for.
Another important element that should be considered in a CARE report is the manner in which the regulatory standard applies AFTER a major loss. In some situations, the regulator standards have acted to acerbate an adverse scenario, requiring larger amounts of capital after a major loss in order to replenish capital up to the pre-loss standards. This "day after" analysis should also be a part of a CARE report.
It is also necessary to realize that the existence of regulation itself poses risks. This section is devoted to regulatory risk measures. The fact that regulation itself can create uncertainty and competitive advantages (disadvantages) is a separate issue and some of the risks created by regulation are enumerated in Appendix C
3.3.2 Summary
This section describes the major world-wide regulatory standards. These are RBC, MCCSR, Basel II, Solvency II, the international rating agencies (private, but nevertheless a de-facto regulatory standard), international Accounting Standards, GAAP and SAP. RBC (Risk Based Capital) used in the United States to monitor insurance company solvency. The MCCSR (Minimum Continuing Capital and Surplus Requirements) is used in Canada to regulate insurance company solvency and is similar to RBC. Basel II is used in the EU and for large banks in the United States and appears to be ready to become the world-wide standard for bank regulation over the next several years. Solvency II is the solvency standard for insurance companies in the European Union. The rating agencies Bests, Fitch, Moody’s and Standard and Poor’s are used world-wide to assess the stability of financial institutions and even governments throughout the world. These private companies are not affiliated with any country or regulatory body, but nevertheless, financial firms invest a great deal of time and money making sure that their ratings by these companies are at the level targeted by the directors and demanded by stockholders.
A summary of the solvency regulation standards overviewed in this paper is presented in the following table.
18

DRAFT
Regulatory Standard Life Health
Property
and
Casualty
Pen-
sion Banks
Investment
Firms Countries
RBC ( Risk Based
Capital) x x x US Only
MCCSR x x x Canada Only
Solvency II x x x EU
Basel II x x EU, US Core Banks1[1] & more2[2]
Rating Agencies 3[3] x x x x x x world-wide
Regualtory capital requirements are unfortunately specific to various countries or groups of countries. We have included requirements that have emerged as international standards such as Basel II, and Solvency II. It is possible that future versions of this paper will include unique regulations for additional countries, such as India, Australia, China etc.
3.3.3 Solvency Standards
The following discussion enumerates the solvency and credit worthiness standards for a select set of regulatory environments and a select set of financial areas. The main focus for regulators is solvency. Other areas of significant regulation are consumer affordability risk transfer, pricing and market conducting. However, issues other than solvency have been excluded at this time, due to the fact that the risk of insolvency/default is the one area in which regulators have created risk measures.
Although insolvency is generally defined by the fact that liabilities exceed assets, another possible measure for a stock company is attainment of less than investment grade status. A phenomenon called the death spiral occurs when a company is classified by a rating organization as “less than investment grade.” Potential customers shy away from a company with a low rating, but as the customers leave, the ratings fall lower which leads to leading to fewer customers etc …
3.3.3.1 United States RBC (Risk Based Capital) Solvency for Insurance: Before we discuss the RBC standard, here is a word from on RBC and Normal Operating Capital In general,
the minimum standards set by RBC are so low that a company within normal operating levels is usually
uninterested in this value.
1
2
3
19
DRAFT
One of the authors has seen an example, in practice, where a well run company had an RBC below the action level. In this case, however, the result was misleading because the company in question was a subsidiary of a large holding company with plenty of combined capital. This example shows that it may not be meaningful to look at the risks and/or capital requirements of one member of a group in isolation.
Now, onto understanding RBC.
Reference: NAIC Property/Casualty Insurance Company Risk-Based Capital Requirements by Sholom Feldblum www.casact.org/pubs/proceed/proceed96/96297.pdf
This is the abstract from the above paper: "The risk-based capital requirements adopted by the NAIC in 1994 are a major advance in the solvency regulation of property/casualty insurance companies. The components of the risk-based capital formula are grounded in actuarial and financial analyses of the risks faced by insurance companies and of the capital needed to guard against those risks. The intricacy of the risk-based capital formula" ... "make the new capital requirements difficult to follow. This paper leads the reader through the formula" ... "The paper first takes the reader through the components of the risk-based capital formula, as well as the “covariance adjustment” connecting them. The emphasis is on the development and justification of the charges, not simply on the accounting entries needed. Casualty actuaries were instrumental in developing several components of the risk-based capital formula: the covariance adjustment, the offset for claims-made business, the offset for loss-sensitive contracts, the treatment of workers compensation tabular loss reserve discounts, and the additional charges for rapidly growing companies. In discussing the actuarial considerations in these five issues, the paper demonstrates how actuarial science has major practical implications for insurance regulation. To be effective, the risk-based capital formula must be combined with statutory enactments empowering regulatory officials to take action against financially distressed companies. The paper explains the “action levels” in the NAIC Risk-Based Capital Model Act, as well as the various potential uses of the risk-based capital results.
Summary of United States RBC ( Risk Based Capital) Calculation for insurers.
Within the United States in 2008, the main tool for regulators to assess the capital adequacy for Insurance P&C companies is RBC ( Risk Based Capital ) . This is a complicated sophisticated tool introduced in 1994 by the NAIC that calculates the required capital of an insurance P&C company based on various risk factors such as underwriting risk, credit risk, and market risk. From a regulator's standpoint, the main fault, if there is one, is that it doesn't give regulators the authority to act soon enough.
Note: Insurers in the United States are required to annually fill out a large book called the "Annual Statement.” A copy of this book is sent to each of the states in which the company does business. The process of filling out the Annual statement includes such things as completing 10-year loss triangles by line of business -- Footnote: (the fact that the state regulatory system was able to mandate the release of company-by-company loss triangle information is a huge accomplishment and a tribute to both Richard Roth and the state based regulatory system in the US). Usually, an insurer purchases software that helps complete the Annual Statement and also runs error checks on the data. In the process of filling out the annual statement, the software calculates an RBC for each insurer, so the insurer does not have to understand the intimate details of the formula, although they generally do understand that poor loss development and low surplus levels will hurt (lower) their RBC ratio.
The capital charges that go into calculating the US LIFE RBC are
Asset risk (C0 & C1) asset default , fluctuation in fair value of assets
20

DRAFT
Insurance risk (C2) inadequate pricing, underestimation of claims reserves
Interest rate risk (C3) losses due to changes in interest rate, mismatch of asset and liability cash flows
Business risk (C4)
Risk Categories: The capital charges that go into calculating the US P&C RBC areR0 : Assets with affiliates and guarantees for affiliates Investments in insurance affiliates, Non-controlled assets, Guarantees for affiliates, Contingent liabilitiesR1 : Cash, Bonds and short term investments Fixed income securities: Cash, Bonds, Bond size adjustment factor, Mortgage loans Short term investments Collateral loans Asset concentration adjustment for fixed income securitiesR2 : Equity investments Common stocks, Preferred stocks, Real estate, Other invested assets, Aggregate write-ins for invested assets, Asset concentration adjustment for equity investmentsR3 : Credit risk Reinsurance recoverables, other receivablesR4 : Reserving risk Basic reserving risk charge, Offset for loss-sensitive business Adjustment for claims-made business, Loss concentration factor, Growth charge for reserving riskR5 : Written premium risk Basic premium risk charge, Offset for loss-sensitive business, Adjustment for claims-made business Premium concentration factor, Growth charge for premium risk
Capital Charge = R0 + square root of ([R12 + R22 + (.5R3) 2 + (.5R3+R4) 2 + R52] )
The RBC Ratio = Total Adjusted Capital/ (2* Capital Charge)
Reference: NAIC Property/Casualty Insurance Company Risk-Based Capital Requirements by Sholom Feldblum
The following table describes the regulatory responses required as a result of RBC levels.
Name RBC Ratio Event
N/A Above 200% None
Company Action Level 150% to 200% Company must provide a plan of action
Regulatory Action Level 100% to 150% Regulators may take action such as prohibiting new writings
Authorized Control Level 70% to 100% Rehabilitation is Authorized but not Mandatory
Mandatory Control Level less than 70% Rehabilitation or Liquidation Mandatory
21

DRAFT
3.3.3.2 Canada MCCSR (Minimum Continuing Capital and Solvency Requirements) Solvency for Insurance:
MCCSR is very similar to RBC, although there are significant differences. The table below comes from a paper written by Sun Life Insurance Company of Canada, and compares RBC to MCCSR for annuities.
Sun Life - MCCSR vs. RBC and Canadian Companies in the US.pdf
3.3.3.3 European Union - Solvency II – Solvency Standards for Insurance
European financial services regulations are broadly separated into 3 distinct areas and legislation is designed specifically for each area. These areas are:
Banking (Basel I and Basel II) Insurance and Pension Funds (Solvency I and Solvency II) Investment Services
The EU is in the process of implementing Solvency II. The legislation is close to being adopted at the first stage after the council of ministers agreed a draft wording. A vote of the European parliament is expected in Q1 2009 and it is expected that the legislation will be passed.
Solvency II has been described as a Basel III for Insurance because it tries to take a holistic and risk sensitive view of regulatory capital. Diversification between risks is allowed for in Solvency II contrary to Basel II.
The key features of Solvency II are as follows:
Best-Estimate Valuation of Liabilities (including Market Consistent Valuation and Risk
Margins) o The principle behind this is that all prudent margins are removed from the valuation
of liabilities and placed in an explicit capital requirement in excess of the value of the
liabilities. Market Consistent Valuation
o Assets and Liabilities will need to be calculated on a market consistent basis. This
means that P&C cash flows will need to be discounted and life insurance will need
to take account of the time value of any options or guarantees in the products. Risk Margins
o Where liabilities are not traded in a deep and liquid market a pseudo market price
needs to be inferred. Solvency 2 looks likely to adopt the Swiss Cost of Capital
approach to calculating the pseudo market price of non-traded liabilities. Multi-Level Regulatory Capital Regime with progressive regulatory intervention
22

DRAFT
o The first level of regulatory intervention comes when an insurer breaches Solvency
Capital Requirement (SCR). There is a more severe point of regulatory intervention
when an insurer breaches the Minimum Capital Requirement (MCR). Risk Sensitive Model for Regulatory Capital covering (Market, Credit, Insurance,
Operational) o It is likely that the regulatory capital model will be very similar to that used in a series
of Quantitative Impact Studies that have taken place over recent years. This model
involves the market consistent balance sheet behind recalculated under a series of
adverse stresses (for example equity markets down 32%). After each stress the
extra capital required is noted. The individual additional capital requirements are
then aggregated via a hierarchy of correlation matrices to arrive at the Solvency
Capital Requirement. o It looks likely that the Minimum Capital Requirement will be based on a fraction of
the SCR with a cap and floor. Internal Models for Regulatory Capital
o Insurers will be able to apply to use their own internal models for the calculation of
regulatory capital. To qualify the insurance company management must proves that
they have a good model and that the model is embedded into the decision making
process of the company (the Use Test). Regulators must approve internal models
before they can be accepted for the calculation of regulatory capital. Application
processes for internal models are starting in 2009. Three Pillars
o As with Basel 2 there will be 3 pillars to the regulation. The above points relate to
Pillar 1. The highlight of Pillar 2 is the Own Risk & Solvency Assessment in which
the company has to make an assessment of the capital it requires considering all
risks to which it is exposed - not just those covered by Pillar 1. In Pillar 3 covers
disclosure of the risks and capital required.
Until recently there was also a mechanism for group support which has been dropped at the final draft.
While Solvency 2 is not due for implementation until 2012 several European countries already have similar regulatory frameworks that could be labeled Solvency 1.5. They share many of the features of Solvency 2 and indeed much of the design of Solvency 2 has drawn on the experiences of these countries. Countries who have adopted Solvency 1.5 regimes include UK, Switzerland, Sweden, Denmark and Netherlands.
While Solvency 2 has been designed by the European Union will likely be adopted by affiliate countries to the European Union. It will also be important for any companies with a European parent who will need to report on Solvency 2.
23
DRAFT
3.3.3.4 European Union Basel II Solvency Standards for Banks:
As was stated before, European financial services regulations is broadly separated into 3 distinct areas and legislation is designed specifically for each area. These areas are:
Banking (Basel I and Basel II) Insurance and Pension Funds (Solvency I and Solvency II) Investment Services
The Basel II accord was implemented in 2006 in the European Union as the Capital Requirements Directive and came into full effect in 2008. Some modifications have been proposed
The Capital Requirement Directive can be found here:
http://eur-lex.europa.eu/LexUriServ/site/en/oj/2006/l_177/l_17720060630en00010200.pdf
The Basel 2 Accord can be found here:
http://www.bis.org/publ/bcbs107.htm
The banking regulation page at the EU can be found here:
http://ec.europa.eu/internal_market/bank/regcapital/index_en.htm#consultation
The following extract from the UK Regulator website summarizes Basel 2 / CRD.
"The new Basel Accord has been implemented in the European Union via the Capital Requirements Directive (CRD). It affects banks and building societies and certain types of investment firms. The new framework consists of three 'pillars'. Pillar 1 of the new standards sets out the minimum capital requirements firms will be required to meet for credit, market and operational risk. Under Pillar 2, firms and supervisors have to take a view on whether a firm should hold additional capital against risks not covered in Pillar 1 and must take action accordingly. The aim of Pillar 3 is to improve market discipline by requiring firms to publish certain details of their risks, capital and risk management."
Source: http://www.fsa.gov.uk/Pages/About/What/International/basel/index.shtml
3.3.3.5 Rating Agency Systems:All of the agencies below issue both long term and short term ratings based on the ability of an entity to meet debt obligations over a short time horizon and then over a long term horizon. Each agency uses its own proprietary methodology and rating system, but the results are usually similar.
Standard & Poor—Standard and Poor’s methodology is similar in theory to RBC, however the factors and formulas used by S&P are proprietary. Standard and Poor’s ratings are based on a capital adequacy model. S&P’s credit ratings for long term obligations in order of best to worst are AAA,AA,A,BBB,BB,B,CCC,CC,C and D. If a company is not rated it is indicated using the letters NR.
Fitch – According to Fitch’s website, the Fitch rating for banks is based on 1) The economic and operating environment, 2) Ownership and Support 3) Management Strategy and Franchise 4) Risk Management 5)
24
DRAFT
Financial Strength and 6) Corporate Governance. Ratings are decided upon in a committee setting. The economic and operating environment includes accounting practices, regulatory framework, and competition. Financial strength includes profitability, funding, capital, and liquidity. Fitch’s bank ratings range from A to F, where A is a very strong bank, B is a strong bank, C is an adequate bank with some issues, E is a bank with serious problems, F is a bank which has defaulted or would have defaulted without external support.
To rate insurance companies, Fitch uses a proprietary model called “prism” which 1) uses country specific data to model liabilities 2) assesses the effect of interest rate changes, evaluates the benefits of diversification, and includes historical loss default percentages. Fitch ratings in order from best to worst are AAA, AA, A, BBB, BB,B, CCC,CC,C,RD and D. These are long term ratings based on a company’s perceived ability to pay financial obligations.
AM Best --AM Best's Capital Model is similar in design to the NAIC RBC model. The types of risks are similar. The formula itself is also similar. Both take the square root of the squared numbers after adding half of the credit risk to the reserving risk. Of the four rating agencies, AM Best is the one with the most experience in rating insurance companies.
Moody’s -- Moody’s issues bank scores that measure a bank’s probability of needing assistance. Moody’s bank ratings from best to worst are the following. A,B,C,D,E where a bank rated “E” is most likely to need assistance to meet obligations.
Moody’s insurance ratings from best to worst are the following: Aaa, Aa1, Aa2, Aa3, A1, A2, A3, Baa1, Baa2, Baa3, Ba1,Ba2,Ba3, B1,B2,B3,Caa1,Caa2,Caa3,Ca and C. Ratings Baa3 and above are considered investment grade. An insurance company with a rating of C is likely in default. Moody’s also has three special rating WR – withdrawn rating , P – Provisional and NR – Not Rated.
Links to the rating agencies websites are included below.
Link to AM Best's Overview http://www.ambest.com/about
3.3.3.5 Other
Pensions Schemes
Pension Schemes are currently outside the scope of Solvency 2 although there has been much debate of whether or not they should be included. For the time being most pension schemes will not be covered by Solvency
Much of the pensions risk management currently taking place in the European Union is a result of realization at board level of the substantial market and longevity risk that many corporations find themselves exposed to now that accounting standards are forcing disclosure of pension liabilities.
As in the US, the UK has created a pension insurance agency called the Pension Protection Fund in order to insure against pension fund deficits.
Asset Management
In the European Union the Investment Management sector is largely regulated by the Markets in Financial Instruments Directive (MiFiD).
25
DRAFT
MiFid Page
http://ec.europa.eu/internal_market/securities/isd/index_en.htm
Other Countries:
These are countries outside of the European Union and North America who I am aware of having some sort of RBC style system.
Australia o Similar to Solvency 2. Liability valuation, risk categories, a factor based prescribed
method and internal models. Canada
o A factor based system. Risk categories, minimum capital test, dynamic capital
adequacy testing, minimum continuing capital and surplus requirement on ratings. Singapore
o Valuation of assets and liabilities, risk categories, and a risk based capital system. Switzerland
o Valuation of assets and liabilities, risk categories, standard model, scenario testing
to determine the target capital and internal models.
Source: "Solvency" by Arne Sandstrom
26
DRAFT
3.4 Short Term vs. Long Term risksRisk manifestation can happen in different time frames. While in some cases, the manifestation is perceived as a sudden event, in other cases it can take an extended period before a risk that has become manifest is actually perceived as such. In the first case, the negative event is triggered by a sudden change of the external conditions in a short time; therefore these risks can be called short term risks. In the second case, a gradual change of the external conditions lead to the negative consequences we refer to as risk manifestations; therefore these risks can be called long term risks.
Examples for short term risks include:
- Weather phenomena (storms, hail)- Natural catastrophes (flood, earthquake)- Accidents- Man-made catastrophes- Pandemics with short incubation periods (e.g. influenza)
Examples for long term risks include:
- Climate change- Longevity risk (in pensions)- Pandemics with long incubation periods (e.g. AIDS, CJD)- Environmental contamination
When a short term risk becomes manifest, the fact that a loss has been incurred is known quickly, even if the amount will evolve during the settlement phase. Example: if a factory has burned, the reconstruction price and the cost of the business interruption can be quantified.
With long term risks, the manifestation happens gradually; therefore it could be years, decades or even centuries before the entire impact can be stated with certainty. Example: Due to innovations in the medical field, people live longer. This increases pension payouts. When will we know the true distribution, and when will life span increases cease?
For many purposes, a standard has arisen of determining a value for all risks based upon the same time horizon. This is a very helpful approach, since the combination of risk assessment values that were evaluated over their full exposure period was problematic. The standard period that is most popular is one year. This is used for Solvency 2 in Europe and has been adopted by many firms in other areas.
To do a one-year evaluation of risks with longer exposure periods, the definition of the ending value for the risks becomes very important. The CRO Group in Europe has recommended (need citation) that the ending value be a market value or a market consistent value. In this way, the future exposure to the risk beyond the end of the year is reflected.
While this approach has several advantages, it also presents several problems. First, since it does not capture the full emergence of the risk, it is possible that this measure will understate the risk of longer term exposures. By understating the risk, it might encourage insurers to shift more and more to offering products with long deferred emergence of problems. Second, the process as described in (citation) does not clearly even take into account likely swings of market values for market traded risks and does not consistently treat non-traded risks. It is possible that this process mishandles the two components of market price for risk. One component is the market view of the level of the risk, the other is a supply demand based fluctuation. The stated process for the market traded risks does not necessarily require a full provision for the supply
27

DRAFT
demand portion of the margin. Additionally, there is no supply-demand based fluctuation provision in the determination of the non-traded risks. Because of this, non-traded risks will have more stable risk evaluations than market traded risks. This may increase the preference for non-traded risks. In summary, the danger with the one year protocol is that it will encourage firms to emphasize longer term non-traded risks over shorter term traded risks.
3.5 Known Risk and Emerging RisksFrank Knight famously delineated risks with known loss distributions from uncertainty with unknown loss distribution in his 1921 book Risk Uncertainty and Profit. Today's risk managers would see a different breakdown as being most significant.
First of all, the only risks with fully known loss distributions are closed games of chance. All other situations have varying degrees of Knightian Uncertainty. Consequently, instead of seeing certainty vs. uncertainty as a black-and-white issue, it makes sense to view risks as falling across a spectrum of color from certainty to uncertainty. At the extreme end of certainty are the fully known loss distributions of closed games. Next come the risks that have followed similar loss patterns for significant periods of time, then risks where there is less or varying past experience that may or may not be sufficient to form a reliable prediction of future loss distribution. Next to the extreme end of uncertainty are risks that are known to exist but that have almost totally uncertain loss distributions. And finally at the most extreme end are those risks that are not currently known to exist. So in terms of a risk assessment, the actuary needs to determine and document an opinion of where along the spectrum of uncertainty each risk sits as well as the information and reasoning that leads to that conclusion.
Emerging risks are those risks that have either unknown severity or (more commonly) unknown frequency. Reasons for uncertainty in frequency and severity include 1) the event has never happened 2) the frequency of the event is so low that there are no credible statistics to gather to form a frequency distribution or 3) because the event has emerged due to changes in the social and economic framework of the world (the last item is frequently referred to as paradigm shifts). In reality items 2 & 3 often overlap where some past events may have occurred but changes in the environment reduce the pool of experience due to decreased relevance of past data.
"Black Swan risks," as coined by Nassim Taleb in his 2007 book, The Black Swan, are similar to but not the same as emerging risks. Black Swan risks are massively adverse events that are totally unexpected in advance. Something like a major influenza pandemic could not be classified as a Black Swan because it is anticipated but has unknown frequency. The pandemic would be correctly classified as an "Emerging Risk".
There are a number of techniques for assessing emerging risks. These methods include, scenario analysis, the Delphi Technique, and Monte-Carlo modeling.
Scenario Analysis: With a scenario analysis, a particular set of circumstances are declared to have happened and the consequences of those circumstances are developed. In the absence of historical data expert opinion is typically used in designing the scope of the scenario and its impact. The scenarios show the range of potential outcomes for the risk. As a further development a probability may be attached to the scenario. If a wide enough range of scenarios are produced with corresponding frequency & severity assessments this would allow Monte Carlo modelling to be performed.
Delphi techniques: The Delphi technique is a method for extracting expert opinion based on the assumption that group judgments are more valid than individual judgments. A group of independent experts is requested to make estimates of the likelihood & impact of events. The experts answer questionnaires in several rounds. After each round a facilitator provides a summary of the experts’ forecasts from the previous round as well as the reasoning they provided for their judgments. Experts are encouraged to consider the replies from other
28
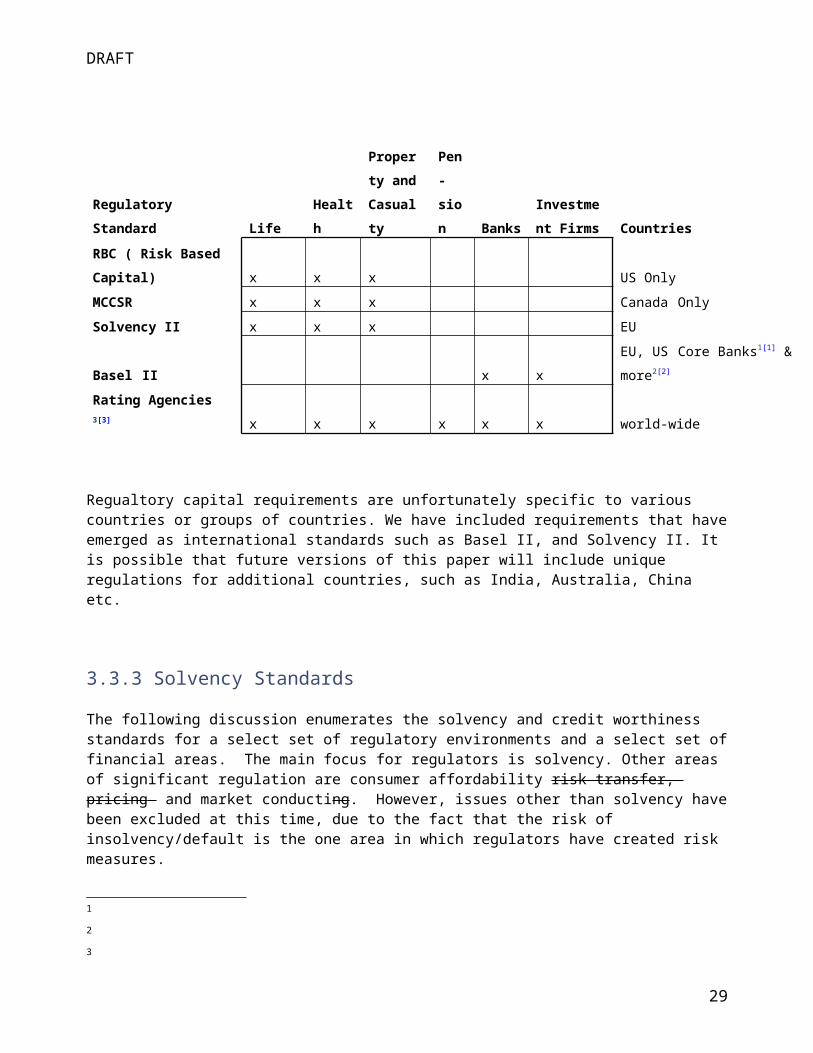
DRAFT
members of the group from previous rounds, both quantitative and qualitative. The aim is that during this process the group will converge towards a consensus, and that consensus is a close match for the true underlying answer.
Monte Carlo Modeling: If the frequency and severity are unknown, but ranges of these values can be estimated, then it is possible to assign distributions to frequency and severity, and run simulations to gain insight into the ranges of possible losses. Actuaries prefer certainty, but sometimes it is necessary to gain insight into events about which little is known, and modeling can be used to gain this insight. Monte Carlo modeling produces a series of simulations which can be examined to assess the range of losses and their expected return periods.
A further input for a Monte Carlo model are the dependencies between variables (not selecting these is equivalent of implicitly selecting the variables to be independent). This is the area where the risk evaluator is most likely to be at the ‘emerging’ end of the scale and assumptions are most likely to be judgement based.
As an example from general insurance, this technique could be used to assess the ability of a large entity with multiple locations to survive an event of unknown frequency and severity such as terrorism. In the case of modeling terrorism, loss severity may be modeled to included worker's compensation, bodily injury and property damage. The assigned frequency distribution, for example, may be different for each location and inversely related to the distance to the nearest suspected terrorism target.
A further example is quantitative operational risk modelling in banks. For shorter return periods internal & external loss data should be available (ie we are at the more 'known' end of the spectrum). For the longer return periods data is likely to be either unavailable or of low relevance (so we are toward the 'emerging' end of the spectrum). For the longer return periods scenario analysis, producing both frequency & severity, is used. The two are combined to perform Monte Carlo modelling so that various points along the aggregated distribution can be examined.
It is critically important to communicate the extreme uncertainty of probabilities developed using simulations with unknown frequency and severity distributions. This is particularly the case when looking at emerging events where the impact of extrapolation may amplify any error in modeling assumptions. Communicating uncertainty is further examined later in the paper.
3.6 Frequency Risk (earnings volatility) vs. Severity Risk (solvency)
3.6.1 OverviewInsurers tend to group insurance products and insurable events into high-frequency low-severity versus low frequency high severity. The law of large numbers works very well for high-frequency low severity events so that the expected value of pooled losses becomes very predictable. The law of large numbers still applies to low frequency high severity event, however it may take decades or even centuries for the "large number" of events needed to occur. Combining a constantly evolving business environment and management time horizons this means that the law of large numbers is of much less relevance to these extreme events. Often for low frequency high severity events the insurer is not able to determine the statistical distribution of the event making modeling problemetic and exposing the insurer to what many today call "Black Swan Risk".
It is possible to make the economic value of an event more predictable (less risky) by various risk mitigation techniques, for example though the purchase of (re)insurance. This converts the unpredictable loss event from an insurance risk to a credit risk. Conversely, the (re)insurance company that takes on the portion of the loss excess of a certain value is assuming a great deal of unpredictability/risk.
29

DRAFT
What about “low-frequency-low-severity risks” and “High-frequency-high-severity-risks”? Low frequency low severity risks are low risk and consequently of less interest. High frequency high severity risks are uncommon and for these risks other forms of risk mitigation are likely to be more suitable than insurance. An example is hurricane risk in Florida or flood risk for houses built in a flood plain. Without government intervention insurers will naturally avoid any situation where large losses occur frequently, i.e. where the product of frequency and severity exceeds the ability of the entity to fund the loss at the premium an insured is willing to pay.
Examples of high frequency low severity events include:
1) Private passenger automobile physical damage insurance and
2) Homeowners property insurance ( in non-coastal / non-earthquake/ non-cat areas )
Examples of low frequency high severity events include:
1) Hurricane or earthquake damage2) Life Insurance policies with very high sums insured.
3) Directors and officers insurance claims
4) Terrorism
Examples listed above are primarily non-life insurance examples with maximal potential losses ranging from several million to billions of dollars. Life insurance products with several million dollar limits, or health insurance policies where a single operation could cost millions of dollars would also be included in the high severity low frequency list.
Auto insurance that covers physical damage is one of the most commonly used examples of a high frequency low severity risk. In fact, due to the law of large numbers, it is so predictiable that companies with many automobiles often choose to self insure rather than purchase insurance..
We sometimes hear terms like frequency risk vs. severity risk. Frequency risk can refer to the uncertainty arising from regular and relatively lower impact events. Severity risk is generally the high impact events such as natural catastrophe that may result in solvency issues for companies. Frequency risk and severity risk can both drive the company to failure. However, a lot of currently popular risk management practices focus on frequency risks. The reason is not because severity risk has less importance, but it is just because severity risk is extremely challenging to measure and mitigate. Competition can result in competitors holding inadequate capital against severity risk given the difficulties in measuring it. A CARE report needs to cover both apects.
High severity, low frequency events are riskier in many senses.
- Higher coefficient of variation- More risk to insolvency
- More difficult for management to understand
- A few years, or even possibly a couple of decades of experience may not be sufficient for accurately quantifying the risk
30
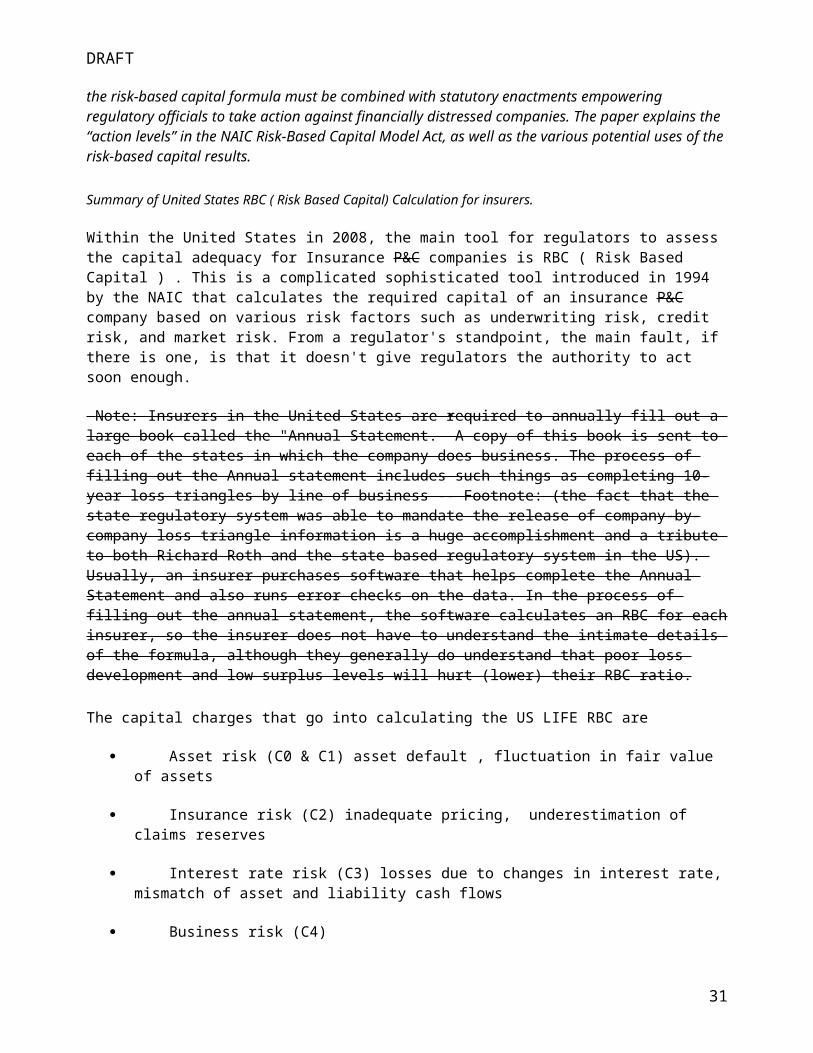
DRAFT
- More difficult for the general public to understand (and consequently possibly subject to political pressure)
One way to quantify the risk associated with a high severity, low frequency event is to model it. However the care report should disclose that the model is a representation of what might happen and does not replace judgement.
3.6.2 What belongs in a Care Report
A first step in quantifying a risk is to assign to the risk a frequency and a severity when applicable. This can be done empirically using historical data, or it can be done judgmentally. The starting point should normally be empirical analysis based on available data but expert judgment should always be used in tandem. The CARE report should recognize that the statistics used in the empirical analysis were developed in the world of yesterday which may not be the world of tomorrow. Furthermore a range of frequencies and a range of severities should be assigned. It is generally not the expected severity that causes an entity to fail, it is a one-in-fifty or a one-in-one hundred event that causes turmoil. Another scenario that can lead to a crisis is a higher than expected frequency accompanied by a higher than expected severity. An example of this is two back-to-back hurricanes.
It is natural to provide frequency in terms of number of occurrences per year or per month, but this type of data will be misleading as the entity grows, shrinks, or otherwise changes. It is best to provide frequency in terms of an “exposure base” such as number of automobiles, square feet, number of employees, revenue, profit, units sold etc.
A loss that occurs once every 20 years is called a 95th percentile loss. A loss that occurs once every 100 years is referred to as a 99th percentile loss. Many business practitioners feel that looking at losses at the 95th and 99th percentiles is at best very difficult, at worst excessive and unreasonable. This is understandable given the premise that successful businessmen, especially entrepreneurs, tend to be optimists. However, a business that intends to survive over a span of several decades must consider at a minimum losses at the 95th percentile and 99th percentile. There are many reasons for this:
1) An entity is exposed to more than one risk. Every one of these risks has a range of severities. The more risks an entity is exposed to, the higher the probability that at least one of them will experience a 95th or 99th percentile loss. It is not possible to predict ahead of time which risk will hit the large severity. Suppose an entity has exposure to 5 different independent risks, the probability that at least one of them will experience a 95th percentile loss in the next 20 years is 99.6%. Furthermore the probability that at least one of them will experience a 99th percentile loss in that 20 year period is 63%
2) Experts judgement used to determine the return period of events is not perfect. Consequently, what the experts label as a 1-in-100 event, might in reality be a 1-in-25 event. One reason for this is that there is very limited data for determining frequencies and severities at return times of one every 100 or one every 20 years, so there is a large degree of uncertainty in any estimate. A second reason is that sometimes there is political pressure from diverse entities to lower the expected losses provided by modelers. Last but not least there may be structural change to the frequency and severity distributions over time (paradigm shift) which may be hard to recognise with limited data.
31
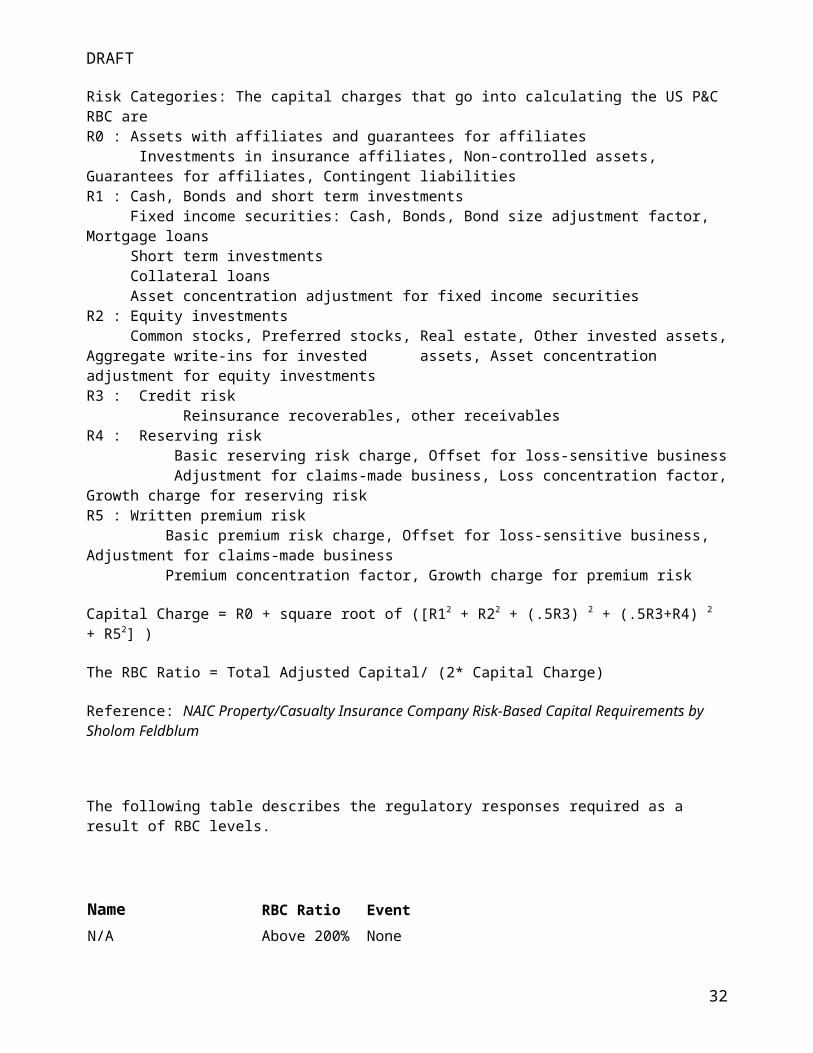
DRAFT
3.7 Viewed stand-alone vs. Full risk portfolioIntroduction
The Comprehensive Actuarial Risk Evaluation reflects each risk that is evaluated both on a stand alone basis and as it stands within the entire portfolio of risks for the entity. This is because the entity risk managers need to know both pieces of information for risk controlling, for risk pricing, risk based performance measurement and for risk steering. The difference between the values of these two bases is referred to as the Diversification Benefit. The Diversification Benefit is described in detail below. Knowing the two numbers also tells the risk manager the degree to which the aggregate risk level and the degree of capital adequacy depends upon the level of interdependency assumptions. This is important because the interdependency assumptions are often the assumptions that are formed with the most limited amount of data supporting them and may change as market conditions change.
From strategic risk management perspective, stand-alone and portofolio views of risks represent two distinctive philosophy in managing risks. Stand-alone view is a typical bottom up view of risks, where risk managers diagnose individual risk factors starting from individual risk "cells". Then they need to aggregate those risks and take diversification effects to derive a bigger picture on companies' risk exposures. Portfolio view of risk, on the other hand, represents a top-down view of risks. The final goal for portfolio view of risks is to clearly understand the risks embedded in the enterprise's overall balance sheet. Under portfolio view of risks, though individual risk factors interact each other, company's overall risk profile should demonstrate certain observable reactivity with macro-economic or other external environment. Driven by those two different views, risk managers are required to understand three distinctive risk management activities:
Risk controlling Risk pricing Risk steering
For risk controlling, it is usually more practical to set a limit for each risk on a stand-alone basis. However, the level of the limit might be set reflecting the impact that the risk has on the risk level of the entire portfolio.
For Risk Pricing, the risk manager needs to know the stand alone risk levels, as they are often indicative of market prices. In some cases market participants will take on risks at rates lower than the stand alone value because of the amount of diversification benefit that they have determined in their risk portfolio. If a risk manager sees pricing that indicates this situation based upon the stand alone risk values, then they should make that known in their CARE report as this may indicate shareholder value being allocated incorrectly. In addition, they should also indicate how the market price compares to the fully diversified risk value.
The same sort of analysis should be applied when the actuary is reviewing the reserve risk. The CARE report should identify the level of reserve risk on a stand alone and on a fully diversified basis.
Risk steering is primarily concerned with the most effective utilization of the diversification benefit. A very useful piece of information for the Risk Steering process is the diversification benefit as a percentage of the stand alone risk.
Risk steering should also be concerned with who owns the diversification benefit. To the extent diversification reduces the amount of required capital and this reduction is allocated to the stand-alone lines, the required returns for the stand-alone lines are reduced. Yet it can be argued that shareholders invest in diversified financial institutions in the expectations that they will benefit from diversification. Otherwise there is no reason for a shareholder not to invest in a portfolio of single risk companies and gain the diversification through their portfolio. If we take this as a given we might conclude that shareholders invest
32
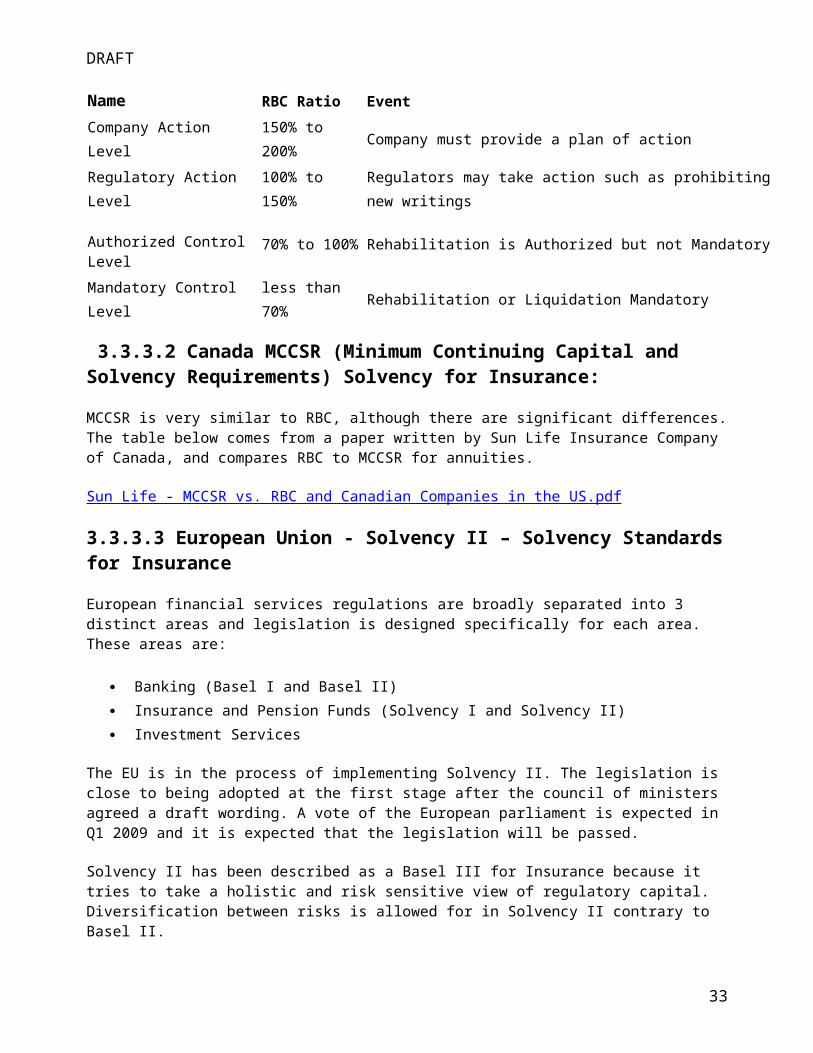
DRAFT
in a diversified financial institution in the anticipation of getting the same level of returns as a portfolio of stand-alones with a lower amount of capital invested. If we accept this then the gains from diversification belong to the shareholder and the capital allocated to stand-alone lines should not be reduced in performance measurement.
Diversification Benefit
Diversification has been long used by financial institutions for effective risk management. Each risk type has different correlation to other risk types. Aggregating risk exposures to incorporate the diversification benefit gives a better and more accurate risk evaluation of the whole portfolio.
From the perspective of the insurance industry, diversification has enabled policyholders to buy protection at a reasonable price by pooling the risks of individual insureds. Insurance companies use reinsurance, hedging strategies, product diversification, and geographic diversification for risk management.
Generally speaking, we can measure diversification benefit at three levels:
1. Between different risk factors (Market risk, Credit risk, Insurance risk, Operation risk, etc.)2. Between different products (Endowments, variable annuity, etc.)3. Between different geographic regions (Developed market, emerging market, etc.)
Aggregation Method
Quantification of the diversification benefit is important for effective risk management. Some methods for quantification of the "diversification benefit" are listed below
(1) Statistical approach: use statistical methods to aggregate the values from different risk factors
Correlation matrix Copula
(2) Structural approach: risk factors are aggregated at a scenario level( i.e. economic scenario) with correlation between scenarios built in. The aggregate value distributions are then generated based on these general scenarios
33
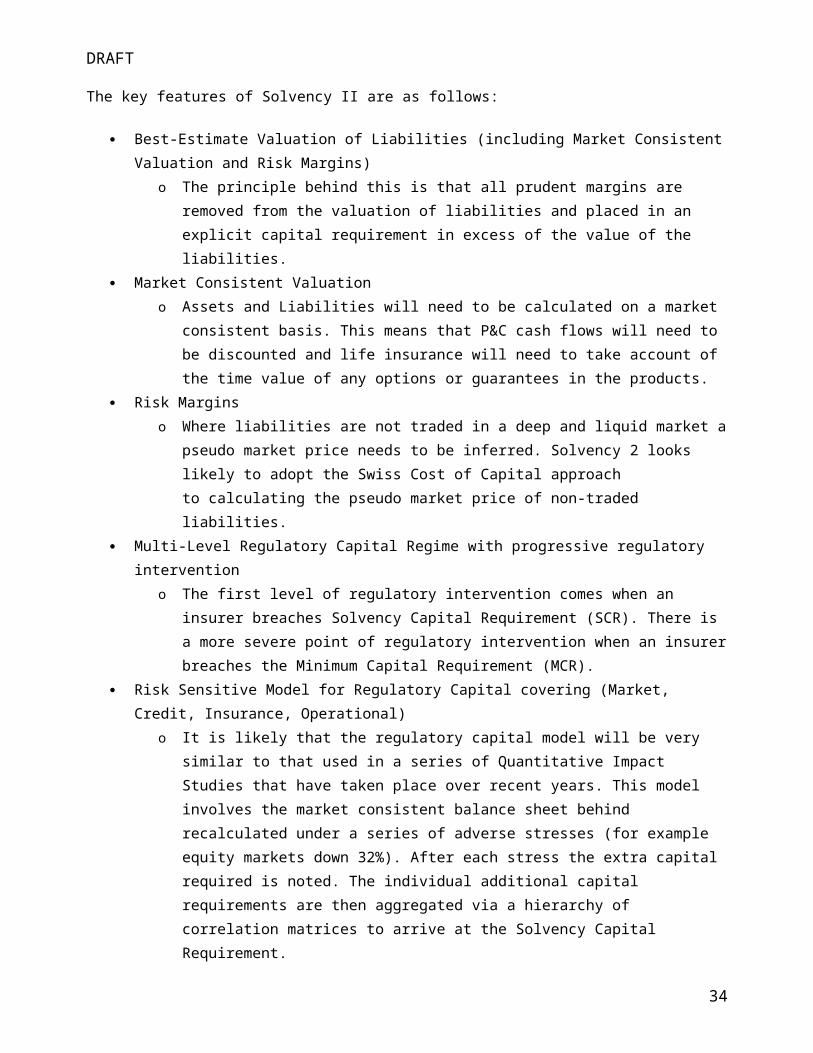
DRAFT
5. Uses of Risk AssessmentsThe CARE is primarily used to support Risk Management activities. While the CARE might be a part of a process for determining accounting values or swolvency values for risk, it is primarily intended to support the work of making decisions about actions to take to treat or not treat risks.
There are three broad categories of Risk Management uses for risk assessments:
Risk Controlling Risk Trading Risk Steering
[Insert chart --> page 52 of the link: http://www.soa.org/files/pdf/2009-chicago-erm-fisher.pdf ]
5.1 Risk Controlling
Risk Controlling is a fundamental activity that seeks to restrict exposure to potential losses or risks. Almost all business activities include some amount of risk control activity. In insurance companies, the major risk controlling activities included underwriting of insurance risks, underwriting of credit risks, authority limits and exposure limits for each of those areas. It also included internal audit and other functions for controlling operational risks. Eventually, some firms added in controls around other risks such as interest rate and equity risks using ALM and hedging as a risk control processes. In banks, the same sorts of credit and operational risk controlling activities existed. In non-financial firms, there was often a large added physical component to loss controlling. Safety and industrial engineering programs worked on physical risks. In addition, many non-financial firms have large exposure to physical property risks that are insurable. So management of an insurance program became a major risk control process. In addition, there are supply chain and raw materials risks. These are managed by a variety of techniques, including but not limited to hedging. And in all firms, managing foreign exchange and liquidity risks were practiced to varying degrees.
Most commonly, these risks were managed in isolation by specialists in each particular risk element. This is the most traditional picture of risk management. The advancement to risk controlling that ERM brings is the possibility of bringing all of these risks to the same table, looking at them on some comparable basis and determining the degree to which a firm wants to retain or reduce exposure to risks on a consistent basis from a top down point of view. Consistent Risk Assessment is the method for achieving this comparable view of risk for aggregate risk controlling.
Risk controlling often starts with a “Statement of Risk Appetite” that could include a limit of the amount of a risk. This limit can be stated in terms of some activity metric. For example, amount of assets for investment limits or premiums for insurance limits. However, for this method to be effective, the risks need to be broken into small classes with fairly homogenous levels of risk.[1]
An example showing why limits must be applied to homogeneous classes follows. Suppose that "Bonds" are limited to $100 million. It does not make sense to apply the same $100 million limit to U.S. treasuries or to CCC Corporate bonds. If the limit is stated as $100 million of bonds with no more than 10% below investment grade, then the $10 million could be in BB or CCC bonds. There are very different levels of risk for BB versus CCC holdings.
To make risk controlling adhere to a more constrained range of risks, the limit can be stated in terms of a risk assessment value. One common risk assessment value that is often used is Value at Risk. (see Specific Risk Metrics for other values)
34

DRAFT
5.2 Risk Trading
Risk Trading is the second major type of ERM activity. Modern ERM can be traced to the trading businesses of banks. Hard lessons from uncontrolled risk trading led to the development of processes and standards for controlling the traded risks. A major element in these systems is the function of valuing, or in other words, pricing of risks. For this discussion, all activities that include the deliberate acquisition of risks for the purpose of making a profit by management of a pool of risks to be risk trading. With that definition, insurance and reinsurance companies can be seen to be pure risk trading firms. Actuaries are at the heart of this activity as major players in the pricing and valuation of insurance risks. With this method of organizing risk management activities, it is clear that most actuarial activity is and has always been risk management. In fact, as is usually boasted, the actuarial profession probably has over 100 years more experience in risk management than any other field of risk management.
Risk assessment for pricing purposes involves the assessment of expected losses as well as the range of potential losses. The pricing process uses this information as well as the risk preference function of the risk trader to form a target price for a risk. This target price is compared to the market price. The risk trader will make decisions to buy or sell a risk depending on the relationship between the target price and the market price.
Some risk trading is not based on risk assessment but only on analysis of the market prices. This type of trading is only viable if there is a liquid market (or as some call it a "Greater Fool").
ERM changes risk pricing by introducing a consistent view of valuing risk margins across all risks. For actuaries and insurance products this has taken the form of economic capital and cost of capital pricing. Risk assessments are done that provide consistent information for all risks. Most commonly, the risk margins are then assessed relative to standard deviation of losses or in relation to extreme event losses stated in terms of Value at Risk or Expected Shortfall.
5.3 Risk Steering
At a fundamental level, actuarial practice has been organized along the basic insurance principle of diversification. Risk pricing for insurers has been a compromise between the cost of risk to the customer with a highly specific risk and the cost of risk to the insurer with a diversified pool of risks.
Management has always looked to choose strategies that enhance firm value. ERM and CARE provide an entire new and more quantitative approach to this high level activity.
At the macro level, management will leverage the risk and reward information that comes from the ERM systems to optimize the risk reward mix of the entire portfolio of insurance and investment risks that they hold. Proposals to grow or shrink parts of the business and choices to offset or transfer different major portions of the total risk positions can be viewed in terms of risk adjusted return. This can be done as part of a capital budgeting / strategic resource allocation exercise and can be incorporated into regular decision making. Some firms bring this approach into consideration only for major ad hoc decisions on acquisitions or divestitures and some use it all of the time.
There are several common activities that may support the macro level risk exploitation:
35

DRAFT
Economic Capital. Realistic risk capital for the actual risks of the company is calculated for all risks and adjustments are made for the imperfect correlation of the risks. Identification of the highest concentration of risk as well as the risks with lower correlation to those higher concentration risks is the risk information that can be exploited. Insurers will find that they have a competitive advantage in adding risks to those areas with lower correlation to their largest risks. Insurers should be careful to charge something above their “average” risk margin for risks that are highly correlated to their largest risks. In fact, at the macro level as with the micro level, much of the exploitation results from moving away from averages to specific values for sub classes. Risk Adjusted Value. Activities are compared by either a "return for risk" ratio or a risk adjusted value calculation. In the return for risk (often called RAROC) approach, earnings are divided by risk capital. (see Specific Risk Metrics.) Alternately, Embedded Value is calculated in various forms that include an adjustment for risk often including cost of embedded options and cost of risk capital (also discussed in Specific Risk Metrics). Also, Franchise Value can be calculated that reflects risk directly through a survivorship approach. In the RAROC and Embedded Value calculations, it is important to include risk adjusted terminal values for any assets or liabilities that are not fully settled during the period being measured. Franchise values, though calculated over a longer time period, face the same issue at whatever future point the calculation is cut-off. Risk Adjusted Product Pricing. Product pricing reflects the cost of capital associated with the economic capital of the product as well as volatility of expected income. Product profit projections show the pure profit as well as the return for risk of the product. Risk adjusted value added is another way of approaching this that has the advantage that it does not favor shrinkage of the business as a rate driven risk adjusted rate of return does. Capital Budgeting. The capital needed to fulfill proposed business plans is projected based on the economic capital associated with the plans. Acceptance of strategic plans includes consideration of these capital needs and the returns associated with the capital that will be used. Risk exploitation as described above is one of the ways to optimize the use of capital over the planning period. Risk Adjusted Compensation. An incentive system that is tied to the risk exploitation principles is usually needed to focus attention away from other non-risk adjusted performance targets such as sales or profits. In some cases, the strategic choice with the best risk adjusted value might have lower expected profits with lower volatility. That will be opposed strongly by managers with purely profit related incentives. Those with purely sales based incentives might find that it is much easier to sell the products with the worst risk adjusted returns. A risk adjusted compensation situation creates the incentives to sell the products with the best risk adjusted returns.
Risk Steering can be seen as a process for finding and choosing the businesses with the better risk adjusted returns to emphasize in firm strategic plans. Their competitors will find that their path of least resistance will be the businesses with lower returns or higher risks.
5.4 Other Uses for CARE
36

DRAFT
Accounting Values for risks might be subject to constraints that are based upon values that do not confirm to
accounting rules that are developed with a CARE. For example, an accounting value could be based upon a
market value but be subject to testing with one of the other bases for risk evaluation.
Solvency values are sometimes stated in terms of one particular metric - such as a 1 year Var at 99.5%. But subject to testing comparing to another metric, such as 95% CTE on a run-off basis. This approach is broadly consistent with CARE and the CARE should provide the information for such a comparrison.
Some firms might develop their aggregate capital target based upon one metric but base their capital allocation scheme upon a different metric. The CARE should support that type of usage.
37
DRAFT
6. Limitations of Risk Assessments
6.1 Understanding the limitations"The essential problem is that our models, ..., as complex as they have become, are still to simple to capture the full array of governing variables that drive global economic reality. A model, of necessity, is an abstraction from the full detail of the real world[i1] ."
Any model is a simplified representation of reality. It is a tool and should only be used as such. Any model must balance the following
Practicality & usability (technology, ease of use - including time constraints, ease of understanding & communicating) Accuracy
As George E P Box said "All models are wrong, but some are useful". For example Newton's laws are relatively simple and provide an excellent explanation of mechanics in the vast majority of situations. It is critical however to understand the limitations of any model and make sure these are understood by any users of the model. In the case of Newton's laws it would be disastrous to use them in calculations involving very high speeds and / or strong gravitational fields.
"The users of the models need to be clear on not only what they know and what their models quantify, but also need to know the limits of their knowledge and their models"
Key to understanding the limitations of any model are a thorough understanding of the assumptions underlying the model and how well they hold in the particular circumstance the model is being used for. The robustness of models – particularly when there is uncertainty surrounding the inputs is crucial to understand. One fundamental method for understanding the robustness of a model is to use stress tests where one parameter / model element is changed at a time to assess its impact. Stress tests can help us identify: - What are the key parameters? - How sensitive are the outputs to these parameters? It is important to use judgement for any model used. Scenario testing, often using ‘expert’ judgment is a common method to create alternative answers for comparison testing. Another test is to determine which model parameters reproduce market pricing Deviation of model answers of these tests from the scenarios produced does not necessarily suggest the model is flawed, but it does raise some interesting questions – both of the model and the judgment used to construct the scenarios.
6.2 The causes & dangers of over-reliance Lack of understanding of the limitations of a model and lack of questioning & skepticism can lead to false reliance on the results. Why would we be over-reliant on a model, even when we are aware of its limitations? Human factors and lack of imagination are an issue.
Overconfidence - people tend to overestimate their ability to predict outcomes and their control over risk and uncertainty.
38

DRAFT
Hindsight bias - Most models are grounded in historical experience. However historical experience occured in a world that is different then today. Technology, social changes, environmental changes constantly change the state of the world. Additionally the standard stochastic technique is to project numerous scenarios based on a a given mean and standard deviation. If thousands of possible scenarios are possible in the future then thousands of potential scenarios were possible in the past. The actual historical path is one of thousands of possibilities that could have happened and may not necessarily be the mean. A healthy dose of skepticism is a necessary component in the determination of parameters for a risk model.
Survivor bias - Many have seen the proof that when looking at the historical performance stocks have outperformed bonds. However in looking at the data in hindsight analysis typically starts by looking at existing companies. This type of analysis tends to ignore companies that are no longer around or even for equity markets that may no longer exist. Failure to include failures as well as survivors in determining the parameters for a risk assessment can significantly understate risk.
Abandonment of judgment – this could be due to a variety of reasons:- Lack of understanding could lead to the analyst hiding behind a model. How many times have
you heard someone justifying an approach by proclaiming ‘it’s a standard technique’ rather than really justifying how relevant the technique is to the situation?
Extrapolation to tails – a risk when using models is when they are used outside of their comfort zone. If
a model is used to understand events which lie outside of the experience used to parameterize the it then the level of confidence in the outputs is (or at least should be) severely reduced. A simple example can point out the flaws in this approach. A model that fits a linear reduction in mortality due to mortality improvement will eventually reach a point where not only humans are immortal but where mortality is negative (people return from the dead).
The level of understanding of an issue can be allocated to one of four categories[i2]:
Known knowns (answers) Known unknowns (questions) Unknown unknowns (black swans) Wrongly believed to be known
Known knowns should present no risk (if they are truly known). Models address known unknowns. We have a question and we can attempt to answer it. We know what our risk models are trying to assess.
Unknown unknowns present the second biggest problem. We cannot answer a question if we don't know the question. All we can do is guess at the question and hope our answer covers it. In the case of risk assessments we can make subjective allowances for this category of risk but cannot accurately analyse it. It is the job of every risk assessor to minimise the size of this group of risks by asking as many questions as possible and researching the answers and by monitoring emerging trends and sources of risk. At the least an assessment of the order of magnitude of potential unknown unknowns should be provided.
The most dangerous category are the issues wrongly believed to be known. These can lead us to a false sense of security and overconfidence in our models. The category of ‘wrongly believed to be known’ actually becomes a more severe issue.
39
DRAFT
6.3 Communicating the limitationsCommunication is a crucial step in any risk modeling exercise. Following hurricanes KRW in 2005 there were many criticisms of catastrophe models, in particular that they failed to predict the disastrous consequences of the levees failing. The model vendors responded that the models were not intended to cover the flooding due to the prolonged pressure on the levees rather than from overtopping storm surge. Whether the flaws in the estimates of insured loss were due to model deficiencies or user error one thing that clearly failed somewhere along the line was communication of the limitations of the models. A CARE report includes statements about the degree to which the above limitations would apply to the particular risk evaluation. The report might include statements that compare the limitations of the risk evaluation to other common risks. For example, if the CARE report includes an evaluation of the risk in a portfolio of venture fund investments, the limitations might be compared to another investment portfolio such as an index in the major stock exchange of the same market.
The CARE report should also identify the situations and scenarios in which the model results would be unreliable. The situations considered should include:
i. The data is found to be insufficiently un-representative of the underlying situation.
ii. There is a disconnect between the market price of risk and the model price. This is either due to a profit opportunity or a model defect.
iii. The implicit assumptions of the model that drive the formation of the formulas that make up the model are no longer valid.
iv. The explicit assumptions are no longer valid because the environment is not sufficiently similar to the situation when the assumptions were formed. (This is something that most risk model procedures challenge every time the model is updated. The usual procedure of most models is to refresh many and possibly all of the assumptions on every major update and some of the assumptions on minor updates.)
v. The behavior or make up of customers regarding their payment of premiums or their take-up of benefits is sufficiently different from the prior assumption.
It is important that these points of unreliability be identified in advance so that if the changes in the world are drifting towards such a point, there is some additional credibility to making important changes to the model.
Without this step, it is possible that incremental changes will not be recognized as fully detrimental to the risk assessment validity.
Key issues when communicating uncertainty include:
- Materiality- Clarity (avoiding confusion)- Circumstances in which model / risk assessment will or will not be appropriate- Potential Impact
40
DRAFT
7. Description of CARE Report
The users of a CARE should be able to place a high degree of reliance on the information's relevance, transparency of assumptions, completeness and comprehensibility, including the communication of any uncertainty inherent in the information
The CARE report must contain the following elements:
1. Purpose of the report.2. Qualifications of the actuary preparing the report - education, experience and credentials.
3. Expected users and usage of the report as well as limitations of the report, including the ways the report should not be used.
4. Statement of adherence to other specific actuarial standards and discussion of scope of those reports in comparison to this document.
5. Discussion of data used for the analysis:
The reasonableness of any prior period data, studies, analyses, or methods; key assumptions and rationale behind them;
Any forward-looking assumptions and rationale behind them; A statement that no unaccounted material events have occurred prior to the valuation date that could
potentially impact the asset adequacy analysis on which the actuary’s analysis is based
6. Description of methods and assumptions used for the analysis:
Discussion of reasons for choosing these methods and assumptions, including description of other possible methods and assumptions that were not used and the rational for deprioritizing them
Discussion of the validation of models used and peer review performed.
7. Presentation of analysis results:
Risk types Ranking of various risks by risk measures:
o Comparisons of different risk measures should explain the situations where the ranking of risks changes significantly if different measures are used. For example, different ranking of risks might result when looking at standard deviation (or volatility) vs. a VaR or other tail risk measure. The report should explain why these differences arise, and whether one particular risk measure and the resulting ranking are more indicative of the nature of a particular risk than another.
8. Retention: the actuary should indicate reasonable steps taken to ensure the documentation is retained for a reasonable period of time, and no less than the length of time necessary to comply with any statutory, regulatory, or other requirements. This can be achived by, for example, copying a company legal secretary on the report. The actuary need not retain the documentation personally; it is sufficient to be retained by the actuary’s employer.
41
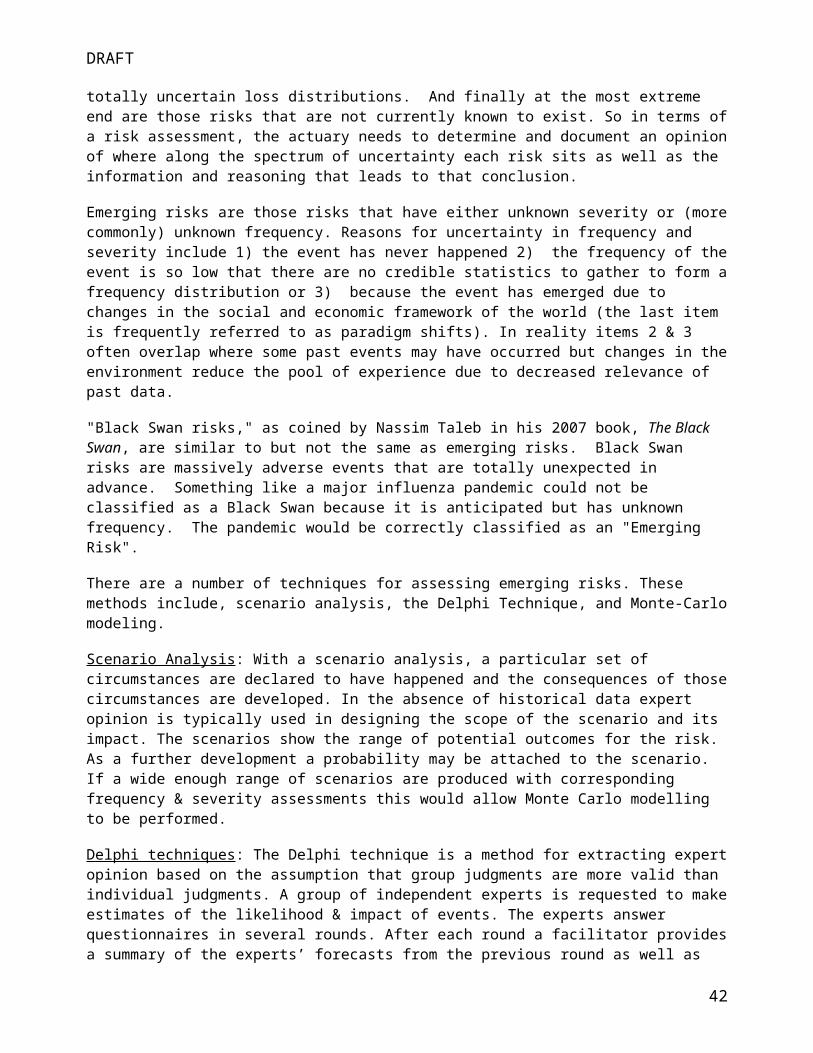
DRAFT
9. Conclusions: a CARE Report is primarily an expository report. The actuary is not required to come to any conclusions from the findings. However, it may be very valuable to the users of the report and beneficial for the elevating the CARE discussion that the actuary gives his or her expert perspective on the potential implications of the risk exposures to the company and provides recommendations on the tactical actions the senior management might need to take to mitigate the risk (e.g., explore hedging, reallocate capital, diversify asset holdings, investigate reinsurance, etc.)
42
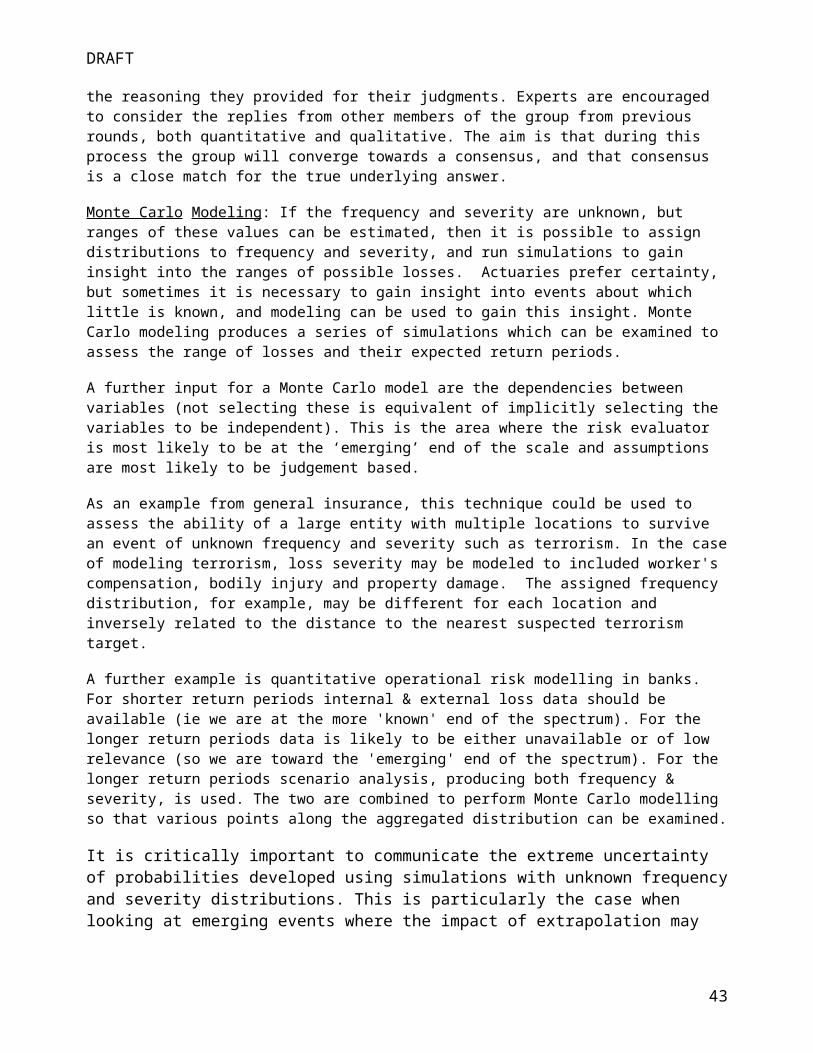
DRAFT
Appendix A – Bibliography
43

DRAFT
Appendix B – References
Wikipedia article on Risk Assessment
http://en.wikipedia.org/wiki/Risk_assessment
EPA Risk Assessment Portal
http://www.epa.gov/risk/
Heart Attach Risk Assessment
http://www.americanheart.org/presenter.jhtml?identifier=3003499
IT Risk Assessment
http://www.ucop.edu/irc/itsec/risk.html
Individual Investment Risk Tolerance Assessment
http://findarticles.com/p/articles/mi_qa3743/is_200310/ai_n9307426
Limitations in risk measurement
http://www.actuaries.asn.au/IAA/upload/public/GIS08_3c_PPT_Riley%20&%20Colling.pdf
44

DRAFT
Appendix C: Risk Created by Regulation (Rough!)
1) Restrictive regulation.
a. Restrictions either prevent the entity from meeting their goals or create a significant
monetary burden.
b. Concrete Examples:
i. Restrictions on profit margins,
ii. Restrictions on pricing differentials between classes,
iii. Requirements for capital adequacy,
iv. Requirements for reinsurance deposits,
v. Requirements for documentation/data reporting etc.
c. Countermeasures:
i. Avoid jurisdictions with burdensome regulations
ii. Be more efficient than the competition at adhering to regulation
2) Unexpected Changes in Regulation.
a. Regulations change in a way that requires the company to change the way it does business,
creating significant expense and/or revenue loss for the company.
b. Concrete examples include
i. New restrictions on pricing differentials between classes
ii. Elimination of a classification or underwriting criteria ( gender, pregnancy, age, zip-
code, pre-exisiting conditions)
iii. Additional documentation required
iv. New taxes
c. Countermeasures:
i. Keep abreast of legislation
ii. If there are quasi-governmental committees that have industry members, think about
nominating one of your employees for the committee.
3) Inept or Dishonest Regulation:
a. Regulators in a particular jurisdiction create burdens by not reacting to requests, written
correspondence, phone calls, meetings etc 9in expected ways.
b. Concrete examples include:
i. Losing paperwork
ii. Expecting bribes or other favors
iii. Not returning calls
45

DRAFT
iv. Civil servants not understanding their jurisdictions regulations
v. Excessive turnover in personelle such that a request for some approval must be
reinitiated.
c. Countermeasures:
i. Experience
ii. Consultants with experience
iii. A relationship with a civil servant within the jurisdiction.
4) Too Little Regulation.
a. Competitors are able to engage in “unwise” practices that allow them to gain market share.
These practices will eventually put the competitors out of business, but not until they have
caused you pain. When the companies do go out of business you may be required to bail out
the insureds via an assessment or guarantee fund.
5) Catastrophe Pools
a. Some jurisdictions require that all insurers participate in the losses for weather
catastrophes. Sometimes complicated rules for participation percentages depend on how
much voluntary business the company writes.
b. Concrete examples
i. Texas Wind Pool
ii. Mississippi Wind Pool.
c. Countermeasure: Use cat modeling and understand the jurisdiction rules to determine the
extent of the risk for your company and how to mitigate it.
6) Last but most important, inefficient competition.
a. The risk that your company’s method of dealing with the regulations creates a competitive
disadvantage for your company.
b. Concrete examples
i. Company is not as efficient at completing documentation as competition.
ii. Company incurs fines due to lack of understanding of regulation.
iii. Company interprets regulation as more restrictive than it is.
46

DRAFT
Appendix D - The Mathematics of Frequency and Severity
The Law of Large Numbers and Variance of a Sample:
The law of large numbers and the variance of a sample are the reasons why an event that is very risky, and would bring disaster to an individual, becomes manageable and less risky when an insurance company, or self-insuring entity pools the risk with other similar risks.
The law of large numbers: Suppose that L is a random variable denoting the loss that could be experienced by event. L has an unknown distribution with mean and variance E(L) and VAR(L) . If a random sample of N such losses are pooled together. Let L-bar denote the average of those losses. Then E(L-bar) = E(L) and VAR(L-bar) = Var(L)/N. Thus, if risk is measured by variance, then the risk becomes smaller and smaller as more and more risks are pooled.
The Variance of a sum of Random Variables
For many risks, there is uncertainty associated with both the frequency (number of occurrences) and the size of the occurrences. The following mathematics shows how the variance of a total annual loss is affected by uncertainty in the number of occurrences and the size of each of those occurrences.
Let N and X be mutually independent random variables.
N takes on a value of zero or one. N is frequency.
X denotes the severity of each event.
Denote S = X1 + X2 + X3 + ... + XN where N is a random variable.
Then
1) E(S ) = E(N)*E(X)
2) VAR(S) = E(N)VAR(X) + VAR(N)*[E(x)]^2
Note that the distribution N*X, which is the product of the two distributions is called a "compound distribution" and is a significantly different distribution.
Mitigating frequency & severity risk with reinsurance
Suppose that management chooses its risk appetite for underwriting exposure to be:
- Maximum loss from a single event at a return period of one-in-250- Over a time horizon of one future underwriting year
- An acceptable magnitude of $20m
The modelled gross loss from a particular event may be as follows
Percentile Exceedence Occurs Loss in Millions
47

DRAFT
25.0% 3 out of 4 years $ 0.2
33.0% 2 out of 3 years $ 0.5
50.0% One out of 2 years $ 0.7
67.0% One out of 3 years $ 2.2
75.0% One out of 4 years $ 3.4
80.0% One out of 5 years $ 4.2
90.0% One out of 10 years $ 8.1
95.0% One out of 20 years $ 20.7
99.0% one out of 100 years $ 91.7
99.6% One out of every 250 years $ 203.9
Then the risk in its entirety is unacceptable; the firm can only absorb 10% of the risk below prudently.
One option would be to accept 10% of the risk. This might involve ceding 90% of the risk on a proportional basis. Another option would be to only insure losses below $20 million by purchasing insurance for the $190 M XS $20 M layer, thus gaining protection from an event slightly larger than the projected 250 year event.
48

DRAFT
Appendix E - Relevant insurance accounting standards
The world appears to be moving toward one more-or-less uniform accounting basis. The change in the accounting basis does little to change the risks. However, it changes the format in which risks are reported and/or calculated.
IASB
IFRS 4 (Current) - Insurance Accounting
IFRS 4 Phase II - Insurance Accounting
IFRS 7 - Disclosure of Financial Instruments
IAS 19 - Pension Scheme Accounting
United States:
Currently within U.S., insurance companies are required to balance their books in two different accounting systems.
Statutory: For most P&C lines of business, losses are not discounted, consequently there is an implicit risk margin included in their reserves. For life and annuity products, the losses are discounted at prescribed valuation interest rates.
GAAP: Losses are discounted and there is no implicit or explicit risk margin (except for certain traditional life products). For certain traditional life products such as whole life and term life, they are valued under the GAAP standard FAS 60, where a provision of adverse deviation is required for prudence. This provision could be considered as a margin for future uncertainties. However, it is not a true risk margin.
49

DRAFT
Appendix F - Economic Capital concepts
Replicating portfolio
The concept of a replicating portfolio attracts more and more attention in recent years, especially in Europe. The replicating portfolio is constructed to mimic the liability cash flow payoff by using simple types of asset classes such as bonds, equities or options. For example, in the case of a simple form of term insurance, the replicating portfolio could be constructed with risk free government bonds. The market value of this replicating portfolio could be viewed as the market value of the underlying insurance liabilities.
The value of the replicating portfolio reflects the present value of their insurance cash flows arising from underwriting activities (without taking any financial risks) discounted at the risk free rate plus a margin that reflects the risks or costs in pure underwriting activities. Then the replicating portfolio is "lent" to asset managers as their "liability.” The replicating portfolio also becomes the benchmark for the asset management performance measurement. To the extent that asset managers purely invest in the replicating portfolio, there is no economic value added, as the same effect will be felt on both the liability and asset side. To the extent that asset managers can beat the benchmark at a risk-adjusted basis, they are adding value to this company.
The liability run-off view of Economic Capital
This is perhaps the most familiar view to life insurance actuaries, assumes insurance companies keep and maintain the insurance contracts they have entered into with their policyholders until contract termination due to maturity, death, surrenders, annuitization or replacement. With general insurance this is to the extinction of liabilities. Under this view, both regulators and policyholders are afforded security (with a certain level of confidence) that insurance companies are able to cover their future obligations over the lifetime of the pooled contracts.
The exit value view of Economic Capital
This treats the insurance contracts as pooled risks that could be transferred to other market participants. In order for another market participant to accept (purchase) the contractual rights and obligations of the pooled insurance policies at a reasonable price, an insurance company has to set up and incorporate a certain level of risk allowance. These risk allowances compensate the other market participant for taking over the risks associated with the transferred business. For life insurance business, these risks include not only the volatilities in earnings and the risk that the expected value of future obligations is incorrect, but also guarantees and options provided to policyholders as well as any frictional costs, illiquidity, operational risks, paradigm shifts and "black swan events.” Under this view a regulator can transfer the liabilities of an insolvent insurer to one that is solvent.
Gain at issue
When accounting for market inefficiencies, analysts generally take one of two positions: Either there is a gain at issue– in which the company creates value simply through the sale of an insurance contract – or there is no gain at issue.
Proponents of gain at issue contend that insurers should be able to recognize an immediate gain for any premiums expected to be received during the life of a contract that are over and above those implicitly required by the risk margin associated with the business being written. Gain at issue advocates assert that amounts that exceed compensation for bearing risk can be generated through inefficiencies in insurance sales, such as insurers' market knowledge and experience in pricing and policyholders' inability to fully value
50
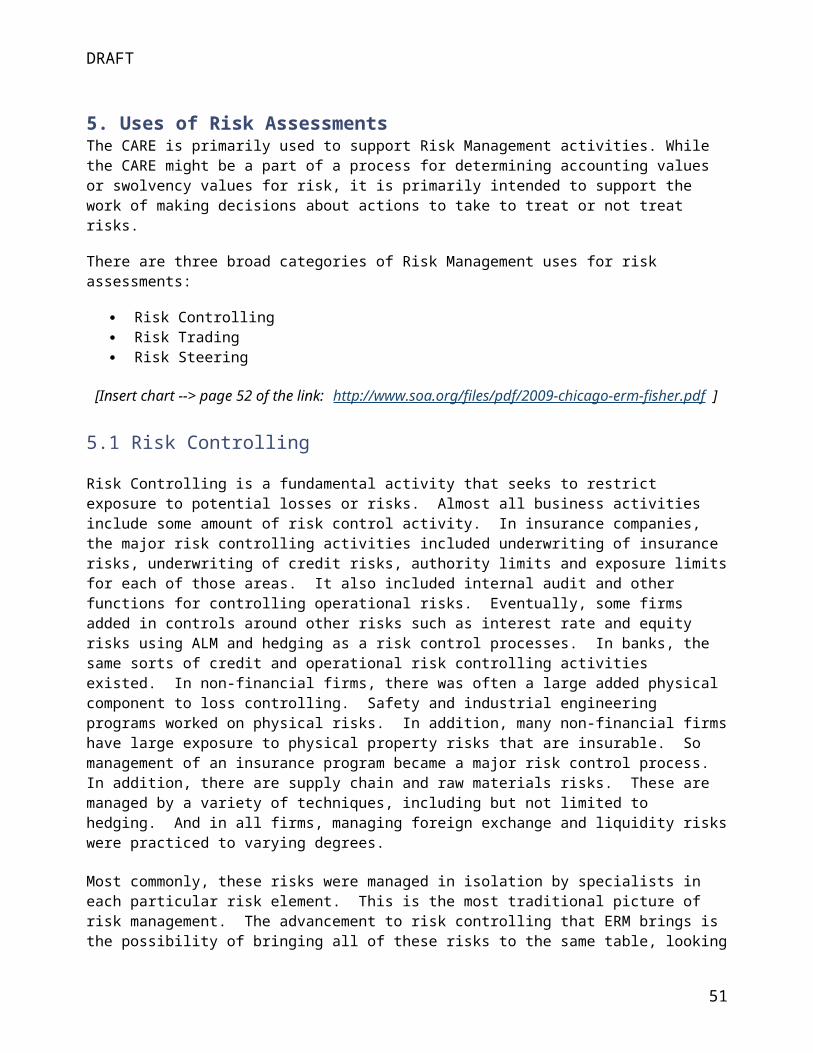
DRAFT
all the options and guarantees in their contracts. The sales process itself can result in policyholders paying a higher price which generates economic rent by capturing policyholder inefficiency and, therefore, a gain at issue for the insurer.
On the other hand, those who believe in no gain at issue view the premium received as the primary or even the only indication of the appropriate risk margin required by the market.
Many proponents of no gain at issue acknowledge the possibility of economic rent due to policyholder inefficiencies, but question whether it can be reliably measured. They have raised other concerns as well, including whether income from gain at issue could be recognized in the absence of a legal obligation on the part of a policyholder to pay future amounts that exceed the costs of providing benefits and services (although on a truly economic basis a probability weighting of future profits may be most appropriate).
No gain at issue advocates also have a logical argument in their favor: the economic rent which would create gain at issue theoretically cannot exist in an efficient market – and fair value accounting assumes that markets in fact are efficient.
51
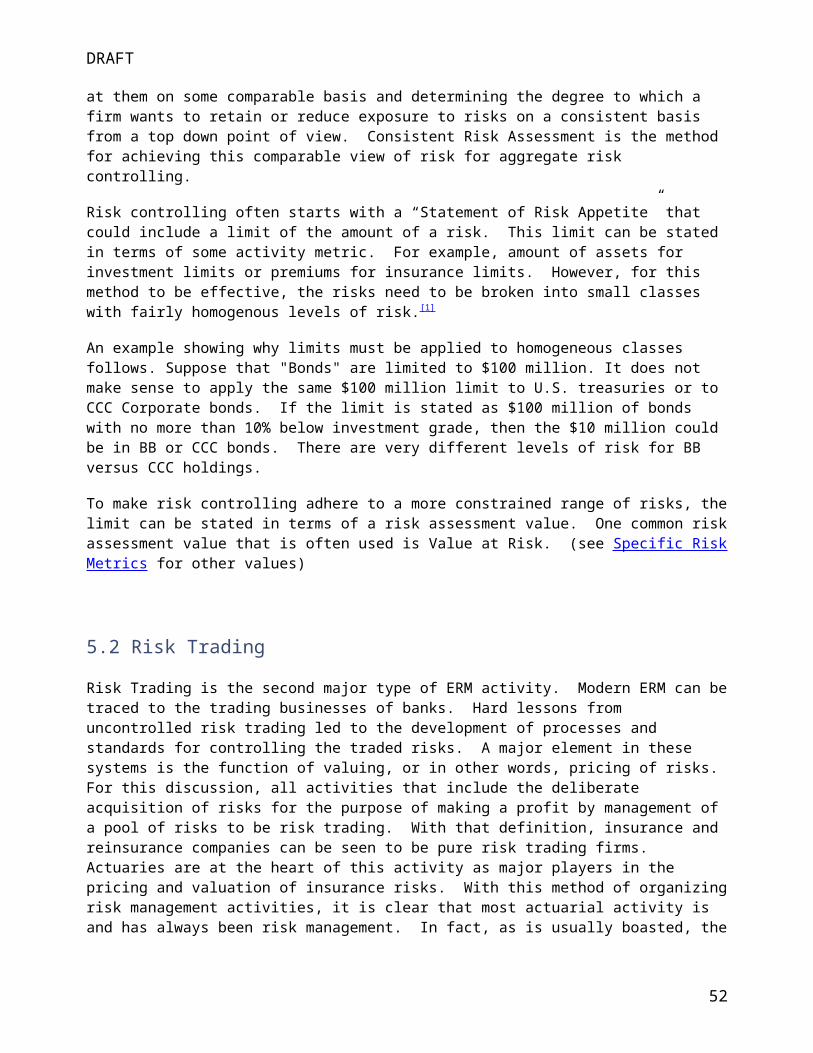
DRAFT
Appendix G – Specific risk metrics
Management Risk Appetite Style Risk Metrics
Value (or Earnings) at Risk Expected Shortfall (or Value or Earnings) (CTE)
o Article about CTE
Typical Regulatory / Rating Agency Risk Metrics
Value at Risk o UK ICAS (Pillar 2) Regime o Proposed Solvency 2 Standard o South Africa (new PGN-110) {need to verify}
Expected Shortfall (CTE) o US Regs? {can someone from US advise where CTE is used?} o South Africa (old PGN-110)
Hedging Style Risk Metrics
(Modified) Duration Convexity Greeks
o Delta o Gamma
Cross-Gammas o Vega o Theta o Rho
Investment Management Style Risk Metrics
(Alpha) Beta (Specific Risk)
Pure Statistical Risk Metrics (Distribution Moments)
First o Mean
Second o Standard Deviation o Covariance o Semi-Deviation
Third o Skew
Fourth
52
DRAFT
o Kurtosis
Extra Material
Total capital vs. regulatory required minimum capital
Perhaps we can use this material:
http://rmtf.soa.org/rmtf_rmm.html
53
DRAFT
Appendix H – Risk types
There are many types of different risks depending how people define them. As a brand new perspective, the risks could be viewed in two broad categories:
1. Statistical risks - risks generally can be measured or modelled with mathematical or statistical approaches such as stochastic modelling. These risks include:
Market risk Credit risk Insurance risk ALM mismatch risk Liquidity risk
2. Non-statistical risks - risks that are impossible or extremely difficult to model with existing knowledge of them. These risks include:
Black swan Paradigm shift Reputational risk Opportunity risk Strategic risk
Statistical risks are the focus of currently popular risk management techniques (such as Economic Capital modelling), and economic performance measurements (such as MCEV and replicating portfolio). However, it is increasingly accepted that non-statistical risks are often the driver of failures. In the following sections, instead of describing modelling techniques, we give examples of each types of risks for readers to gain familiarity of risk types.
Market Risk
Market risk is a collective term for risks that are related to the changes and fluctuations of the financial markets. Such risks involve fluctuations in the equity market, interest rate curve level and shape, and currency exchange rates, for example. Market risk can lead to unexpected changes to company's capital position and create higher volatilities in company's earnings. Market risk is generally one of the key focus areas for financial services players in their risk management or economic capital management activities.
Credit RiskCredit risk is the risk that other parties cannot/will not honor their obligations fully or that there will be a material delay in the payment. Because there are many types of counterparties—from individuals to suppliers/vendors, to sovereign governments—and many different types of obligations—from auto loans to derivatives transactions—credit risk takes many forms. Institutions manage it in different ways. The sub-prime mortgage meltdown starting from late 2006 is deeply rooted in credit risk mismanagement.
Insurance RiskInsurance risk is also commonly referred to as hazard risk or underwriting risk. It is a risk of loss resulting when the pricing or underwriting of a product established is nto commensurate with the true risk a product brings on. An example of insurance risk is asbestos-related liabilities for Lloyd's. Asbestos was widely used as a fireproofing and insulation material until the 1970s when it was found to be linked to cancer and other
54
DRAFT
diseases. Lloyd's, the London based underwriter, had massive exposure to asbestos related liabilities, whose ugly head only surfaced in the 1980s and 1990s. However, the latency and the massive amount of the liability almost brought the underwriter to the brink of extinction. Another example of insurance risk was the massive underpricing of equity guarantees by life insurers in mid-1990s.
Asset Liability Risk
Asset liability risk is a risk of mismatch between the values of asset and liability due to, for example, interest rate fluctuations. The problem is not that the value of assets might fall or that the value of liabilities might rise, but that the capital might be depleted by narrowing of the difference between assets and liabilities—that the values of assets and liabilities might fail to move in tandem. Asset-liability risk is a leveraged form of risk. The capital of most financial institutions is small relative to the firm's assets or liabilities, so small percentage changes in assets or liabilities can translate into large percentage changes in capital.ALM risk originally was interchangeable with interest rate risk. But development in Asset Liability Management has largely expanded this concept. Asset Liability Risk today can mean any risks that will cause asset / liability mismatch. Asset-liability management is a series of techniques to manage the two sides of the economic balance sheet moving in offsetting ways to counterbalance the market risk exposure of asets and liabilities. One example is the US mutual life insurance company the Equitable. During the early 1980s, the USD yield curve was inverted, with short-term interest rates spiking into the high teens. The Equitable sold a number of long-term guaranteed interest contracts (GICs) guaranteeing rates of around 16% for periods up to 10 years. During this period, GICs were routinely for principal of USD 100MM or more. Equitable invested the assets short-term to earn the high interest rates guaranteed on the contracts. Short-term interest rates soon came down. When the Equitable had to reinvest, it couldn't get nearly the interest rates it was paying on the GICs. The firm was crippled. Eventually, it had to demutualize and was acquired by the AXA Group in early 1990s.
Liquidity Risk
Liquidity risk is financial risk due to uncertain liquidity. An institution might have a sudden need for liquidity if its credit rating falls, it experiences sudden unexpected cash outflows, or some other event causes counterparties to avoid trading with or lending to the institution. A firm is also exposed to liquidity risk if markets on which it depends are subject to loss of liquidity. The story of Baldwin United (BU) is an example of liquidity risk. BU was a holding company whose main holdings were in life insurance, property and casualty insurance, and mortgage insurance. In addition, BU owned a few other companies, such as a piano manufacturing company and a trading stamps company. BU's life companies sold billions of dollars worth of accumulation annuities with high credited interest rates. These high rate were essentially guaranteed by a bailout provision, which waived the surrender charge if the company credited an interest rate lower than a very high bailout rate. BU borrowed a substantial amount of money to purchase a mortgage insurance company and stated quickly that it would repay the debt over a short period. The company was implementing a tax strategy of shifting the gains and losses from its life companies to its property and casualty companies, and for the strategy to work, the mortgage company needed to make money. When the US economy experienced a downturn in the early 1980s, mortgage default rates increased. Soon the mortgage insurance company was not making enough money for the strategy to work. BU said it would need more time to repay the loan for the mortgage insurance company, and this, in combination with some other negative reporting, caused the "run on the bank". Because the investment in the mortgage insurance company was such a huge part of the portfolio (approximately 20%), the total market value of assets at the time of the run was not enough to support the calls on BU's liabilities. Ironically, this happened in spite of the significant value of the mortgage insurance company: It went public for a few years
55

DRAFT
later, with a market value of $1 billion. In the end, policy owners eventually recovered their money with interest, although credit interest rates were substantially less than the bailout rates.
Black Swan
The Black Swan theory refers to a large-impact, hard-to-predict, and rare event beyond the realm of normal expectations. The "Black Swan" theory (capitalized) refers only to events of large consequence and their dominant role in history. Black Swan events are a special category of what is called outliers.
The beginning of the 21st century is marked with black swan event - the 9/11 terrorist attack caused almost a depletion of terrorism coverage from P/C private insurers. The federal government has to step in eventually to create TRIA (Terrorism Risk Insurance Act) to ensure availability of terrorism insurance - as large construction projects were put into halt due to the inability of contractors to obtain such insurance. Hurricane Katrina is another event that caused catastrophic losses to P/C insurers, especially in the homeowner insurance market. While many insurers considered a hurricane of the same magnitude of Katrina, they did not include the potential of the Levees in New Orleans failing. The industry has to revisit exclusions of flood damage, and the effectiveness of NFIP (National Flood Insurance Program) to maintain soundness of this type of insurance protection.
Paradigm Shift
Paradigm shift refers to a change in a model or pattern that has been nearly universally accepted. For example, a change in consumer buying habits from buying airline tickets through travel agents to buying them over the Internet would be a paradigm shift.
Paradigm shifts are prominent in the media industry. Flat-screen high definition TV has replaced almost all traditional telethon TV. DTV is also replacing traditional video-recording. DVD and CD pretty much drives video cassette entirely out of the marketplace. I-pod and MP-3 players have replaced walkman and portable CD players. Netflix is challenging Blockbuster. Movie-on-demand is challenging movie rental business. All these paradigm shifts show progresses that businesses have to try hard to keep up with.
A paradigm shift also happened in the healthcare insurance industry. In the 1970's physicians were considered low risk for disability coverage. With the rise of the HMO's many physicians concluded that it would be better to retire on disability rather then work through chronic health issues. Hence, HMO caused a paradigm shift that completely changed physicians' coverage choice.
Reputational Risk
Reputation risk is the risk that negative publicity regarding an institution’s business practices will lead to a loss of revenue or litigation. For retail payment-related systems, reputation risk is linked with customer expectations regarding the delivery of retail payment services, and whether the institution is meeting its regulatory and consumer protection obligations relating to those services. An institution’s reputation, particularly the trust afforded it by customers and counter-parties can be irrevocably tarnished due to perceived or real breaches in its ability to conduct business securely and responsibly. In addition, financial institutions are responsible for risks associated with the activities of third-party service providers with which they contract. For example, deficiencies in security and privacy policies that result in the release of customer information by a service provider may result in reputation damage.
The Korean car maker, Hyundai, first made a name for itself in the United States in the late 1980s. The car was popular at first, but soon earned a reputation for developing rust and other quality problems. The
56
DRAFT
company was "haunted" by its reputation in the 1990s when it was trying to launch newer products. However, beginning in 2001, to help overcome its reputation for poor quality, the company announced a 10-year, 100,000-mile warranty, which was far more comforting than the industry's standard three-year, 30,000-mile warranty, and essentially guaranteed the car for its entire expected working life.
Meanwhile, the Hyundai Sonata was selected to be the official taxicab during the Beijing Olympics. In January 2008, Hyundai grabbed further attention in the US by offering to take back a car that is financed or leased by a worker who subsequently loses a job, as consumers were reeling from the collapse in housing and stock market prices and growing fears of unemployment,. When the program was introduced, the Hyundai Assurance program was seen as more than just a marketing campaign, but also as psychological affirmation that the economy was not going to collapse entirely. The program paid off well -Analysts proclaimed the program a success when Hyundai reported U.S. sales were up 14% in January compared to the same month a year earlier, while the entire U.S. auto market fell 37%.
Operational risk
An operational risk is a risk arising from execution of a company's business functions. As such, it is a very broad concept including e.g. fraud risks, legal risks, physical or environmental risks, etc.
The best example of operational risk in the insurance industry is the market conduct around issuing illustrations with vanishing premiums in the early 1980's. Due to high interest rates at the time companies were able to illustrate that if a company paid only a small number of premiums the investment income paid on reserves as part of the dividend would be sufficient to pay all future premiums. As interest rates fell many of these vanishing premiums reappeared resulting in class action law suits against carriers.
Another example illustrating operational risk is Enron, the Houston Texas company originally involved in transmitting and distributing electricity and natural gas throughout the United States. The company developed, built, and operated power plants and pipelines while dealing with rules of law and other infrastructures worldwide. In 1998, Enron moved into the water sector, creating the Azurix Corporation, which it part-floated on the New York Stock Exchange in June 1999. Azurix failed to break into the water utility market, and one of its major concessions, in Buenos Aires, was a large-scale money-loser. After the move to Houston, many analysts criticized the Enron management as swimming in debt. The Enron management pursued aggressive retribution against its critics setting the pattern for dealing with accountants, lawyers and the financial media.
Enron grew wealthy due largely to marketing, promoting power and the fraudulently inflated stock price. Enron was hailed by many, including labor and the workforce, as an overall great company, praised for its large long-term pensions, benefits for its workers and extremely effective management until its exposure in corporate fraud. As was later discovered, many of Enron's recorded assets and profits were inflated, or even wholly fraudulent and nonexistent. Debts and losses were put into entities formed "offshore" that were not included in the firm's financial statement, and other sophisticated and arcane financial transactions between Enron and related companies were used to take unprofitable entities off the company's books.
Opportunity risk
The risk that a better opportunity may present itself after an irreversible decision has been made. Such risks are prominent when there is a technology shift in the market. For example, it can happen when a product will lose its patent protection or that a manufacturing process becomes outdated. It can also happen when a new technology enters marketplace.
57

DRAFT
The opportunity risk is perfectly illustrated by the competition in the cellular phone market. Motorola's failure to pursue both analog and digital cellular-phone technology allowed Nokia to become the industry leader. Later, Nokia's decision to concentrate on high-end smart phones and spending 80% of its R&D budget toward this market, led them to not double bet on moderately priced phones. This allowed rival Samsung to capitalize on and become dominant in the midrange phones market, increasing the overall risk level of Nokia's market position.
Strategic risk:
There is no commonly accepted standard definition of strategic risk. It is identified as a potentially significant risk in Pillar II of the Basel II framework, but no definition is provided. In its Pillar II guidelines, the Committee of European Banking Supervisors (CEBS) suggests the following: Strategic risk is "the current or prospective risk to earnings and capital arising from changes in the business environment and from adverse business decisions, improper implementation of decisions or lack of responsiveness to changes in the business environment.
The failure of a large retail store, Kmart, is a classic example of strategic risk. Kmart was an innovator of new concepts in mass-merchandizing industry by developing low-price merchandizing concept with operations started in 1937, 30 years before Wal-Mart and Target even entered the market. However, through time, it loses its niches on three fronts: the prices it offers, the segment of customers it targets at, and the shopping experience it brings to its customers. The loss on these three fronts made Kmart indistinguishable from and eventually losing to its major competitors, which subsequently drove the Company into bankruptcy.
58


