Embed Size (px)
Citation preview

©CourseCollege.com
1
26 Financial Statement Analysis
Financial statement
analysis should always involve the statement of cash flows
from Chapter 17
Learning Objectives
1. Describe and apply methods of percentage analysis of financial statements
2. Describe and apply methods of ratio analysis of financial statements
ProfitDebit Credit or
Loss
Expenses
BALANCE SHEET INCOME STATEMENT
Assets Liabilities Revenue
Equity

©CourseCollege.com
2
Vertical
HorizontalComparing statement components over time periodsComparing statement components over time periods
Comparing statement componentsto a total from the same statement
Comparing statement componentsto a total from the same statement
O26.1
Objective 26.1: Describe and apply methods of percentage
analysis of financial statements

©CourseCollege.com
3
Horizontal –comparing across time
O26.1
Year 1Year 1
Profitor
Loss
Expenses
INCOME STATEMENT
Revenue
25,600
Year 2Year 2
Profitor
Loss
Expenses
INCOME STATEMENT
Revenue
31,200
Year 3Year 3
Profitor
Loss
Expenses
INCOME STATEMENT
Revenue
37,500
Year 4Year 4
Profitor
Loss
Expenses
INCOME STATEMENT
Revenue
38,400
What year had the greatest increase in sales?
OR
How much have sales grown over 4 years?

©CourseCollege.com
4
Horizontal Analysis
O26.1
150%=
$ 38,400 (Year 4)
$ 25,600 (Year 1)
Year 4 Sales are 150% of Year 1 sales

©CourseCollege.com
5
Horizontal analysis -trends
Calculating the
percentage of base year for each period helps spot
trends
Year 1 Year 2 Year 3 Year 4 Year 5Sales 330,500 347,025 343,720 353,635 363,550% of Yr 1 100% 105% 104% 107% 110%
Base Year

©CourseCollege.com
6
Horizontal analysis -trends
343,720330,500 = 1.04 =
104%
Year 1 Year 2 Year 3 Year 4 Year 5Sales 330,500 347,025 343,720 353,635 363,550% of Yr 1 100% 105% 104% 107% 110%
Thedenominator
is Year 1 Sales.

©CourseCollege.com
7
Vertical –comparing component with a total from the same statement
O26.1
Year 1Year 1
Profitor
Loss
Equity
BALANCE SHEET
Assets Liabilities
What part of total assets is total equity?
250,0001,000,000
©CourseCollege.com
8
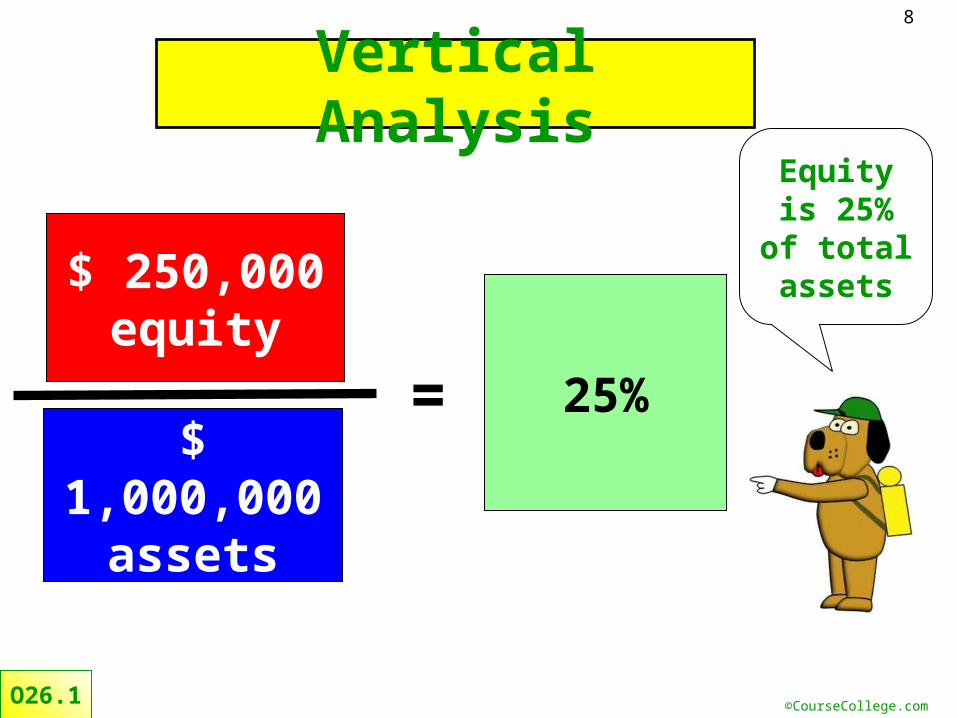
Vertical Analysis
O26.1
25%=
$ 250,000 equity
$ 1,000,000
assets
Equity is 25% of total
assets

©CourseCollege.com
9
Vertical –comparing component with a total from the same statement
O26.1
Year 1Year 1
Profitor
Loss
Equity
BALANCE SHEET
Assets Liabilities
What part of total assets is Cash?
Cash
400,000Total assets
50,000

©CourseCollege.com
10
Vertical Analysis
O26.1
12.5%=
$ 50,000 cash
$ 400,000 total
assets
Cash is 12.5% of
total assets

©CourseCollege.com
11
Assets Liabilities% %
Cash 94,500 2% AP 167,000 4%AR 678,000 17% Taxes payable 21,000 1%Inventory 824,500 21% Current liab. 188,000 5%Current assets 1,597,000 41%
Long term debt 1,407,000 36%Prop., Plant, Equip. 2,345,000 59% Total liabilities 1,595,000 40%
EquityTotal equity 2,347,000 60%
Total assets 3,942,000 100% Total liab. & eq. 3,942,000 100%
2010 Year end Balance SheetHill Corporation
Assets Liabilities% %
Cash 125,000 3% AP 210,000 5%AR 794,500 18% Taxes payable 13,400 0%Inventory 805,400 18% Current liab. 223,400 5%Current assets 1,724,900 39%
Long term debt 1,401,200 32%Prop., Plant, Equip. 2,650,800 61% Total liabilities 1,624,600 37%
EquityTotal equity 2,751,100 63%
Total assets 4,375,700 100% Total liab. & eq. 4,375,700 100%
2011 Year end Balance SheetHill Corporation
Using vertical analysis*
Hill’s cash position
has increased
* Comparing with the same firm in a
different fiscal period
* Comparing with the same firm in a
different fiscal period

©CourseCollege.com
12
Assets Liabilities% %
Cash 68,400 6% AP 45,600 4%AR 29,400 2% Taxes payable 31,500 3%Inventory 131,700 11% Current liab. 77,100 6%Current assets 229,500 19%
Long term debt 546,000 46%Prop., Plant, Equip. 956,700 81% Total liabilities 623,100 53%
EquityTotal equity 563,100 47%
Total assets 1,186,200 100% Total liab. & eq. 1,186,200 100%
2010 Year end Balance SheetHatch Corporation
Using vertical analysis*
Hatch has a stronger
cash position
* Compare to others. (Firms
compared should be in the same industry
with similar operations)
* Compare to others. (Firms
compared should be in the same industry
with similar operations)
Assets Liabilities% %
Cash 94,500 2% AP 167,000 4%AR 678,000 17% Taxes payable 21,000 1%Inventory 824,500 21% Current liab. 188,000 5%Current assets 1,597,000 41%
Long term debt 1,407,000 36%Prop., Plant, Equip. 2,345,000 59% Total liabilities 1,595,000 40%
EquityTotal equity 2,347,000 60%
Total assets 3,942,000 100% Total liab. & eq. 3,942,000 100%
2010 Year end Balance SheetHill Corporation

©CourseCollege.com
13
Combining horizontal and vertical
Horizontal
O26.1
Year 1 Year 2 Year 3 Year 4 Year 5Sales 330,500 347,025 343,720 353,635 363,550% of Yr 1 100% 105% 104% 107% 110%
Year 1 Year 2 Year 3 Year 4 Year 5COGS 214,825 235,977 240,604 275,835 298,111% of Yr 1 100% 110% 112% 128% 139%% COGS 65% 68% 70% 78% 82%Gross Profit 115,675 111,048 103,116 77,800 65,439% GP 35% 32% 30% 22% 18%Other exp. 99,150 96,126 89,367 61,532 49,079% Other exp. 30% 28% 26% 17% 14%Net Income 16,525 14,922 13,749 16,267 16,360% NI 5.0% 4.3% 4.0% 4.6% 4.5%NI as % Yr1 100% 90% 83% 98% 99%
Vertical

©CourseCollege.com
14
Combining horizontal and vertical
O26.1
Year 1 Year 2 Year 3 Year 4 Year 5Sales 330,500 347,025 343,720 353,635 363,550% of Yr 1 100% 105% 104% 107% 110%
Year 1 Year 2 Year 3 Year 4 Year 5COGS 214,825 235,977 240,604 275,835 298,111% of Yr 1 100% 110% 112% 128% 139%% COGS 65% 68% 70% 78% 82%Gross Profit 115,675 111,048 103,116 77,800 65,439% GP 35% 32% 30% 22% 18%Other exp. 99,150 96,126 89,367 61,532 49,079% Other exp. 30% 28% 26% 17% 14%Net Income 16,525 14,922 13,749 16,267 16,360% NI 5.0% 4.3% 4.0% 4.6% 4.5%NI as % Yr1 100% 90% 83% 98% 99%
Has the firm been able to maintain
profitability over th
ese 5 years?

©CourseCollege.com
15
Combining horizontal and vertical
Sales have
grown
O26.1
Year 1 Year 2 Year 3 Year 4 Year 5Sales 330,500 347,025 343,720 353,635 363,550% of Yr 1 100% 105% 104% 107% 110%
Year 1 Year 2 Year 3 Year 4 Year 5COGS 214,825 235,977 240,604 275,835 298,111% of Yr 1 100% 110% 112% 128% 139%% COGS 65% 68% 70% 78% 82%Gross Profit 115,675 111,048 103,116 77,800 65,439% GP 35% 32% 30% 22% 18%Other exp. 99,150 96,126 89,367 61,532 49,079% Other exp. 30% 28% 26% 17% 14%Net Income 16,525 14,922 13,749 16,267 16,360% NI 5.0% 4.3% 4.0% 4.6% 4.5%NI as % Yr1 100% 90% 83% 98% 99%
%Net income
has droppe
d

©CourseCollege.com
16
Objective 26.2: Describe and apply methods of ratio analysis of
financial statements
O26.2
Liquidity & Safety
measures
Leverage & Solvency measures
Efficiency measures
Profitability & Market measures
CATEGORIES
©CourseCollege.com
17
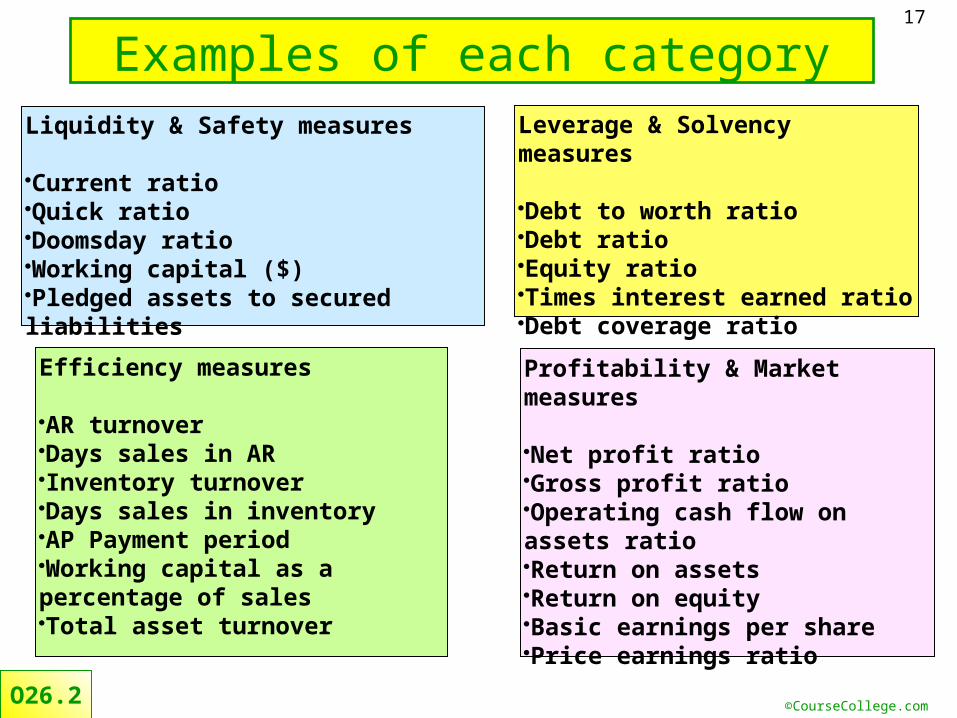
Examples of each category
O26.2
Liquidity & Safety measures
Current ratioQuick ratioDoomsday ratioWorking capital ($)Pledged assets to secured liabilities
Leverage & Solvency measures
Debt to worth ratioDebt ratioEquity ratioTimes interest earned ratioDebt coverage ratio
Efficiency measures
AR turnoverDays sales in ARInventory turnoverDays sales in inventoryAP Payment periodWorking capital as a percentage of salesTotal asset turnover
Profitability & Market measures
Net profit ratioGross profit ratioOperating cash flow on assets ratioReturn on assetsReturn on equityBasic earnings per sharePrice earnings ratio

©CourseCollege.com
18
Examples of
O26.2
Liquidity & Safety measures
Current ratioQuick ratioDoomsday ratioWorking capital ($)Pledged assets to secured liabilities

©CourseCollege.com
19
Current Assets
Current Liabilities
Current Ratio
Working Capital
Current Assets
Current Liabilities
Current ratio and working capital
O26.2

©CourseCollege.com
20
The current ratio answers the following question:
How many dollars of current assets are available to pay each dollar of current liabilities scheduled?
The higher the number, the more dollars of current assets are available and therefore the more liquid is the particular balance sheet being studied.
Current ratio
Current Assets
Current Liabilities
Current Ratio
O26.2

©CourseCollege.com
21
Current Ratio Example
ASSETS LIABILITIESCash 25,600 Accounts Payable 165,700Accounts Receivable 56,700 Current liabilities 165,700Inventory 98,200 Notes Payable 36,750Supplies 2,100 Total 202,450
Current assets 182,600Equipment 121,000 EQUITY
Owner, Capital 283,750Total 486,200 Total 486,200
Current ratio Current assets/Current LiabilitiesCR = 1.10
BALANCE SHEETAs of 12/31/07
RAMOS Distributors
$1.10 of current assets are available to pay each dollar
of current liabilities
?1.10O26.2
©CourseCollege.com
22
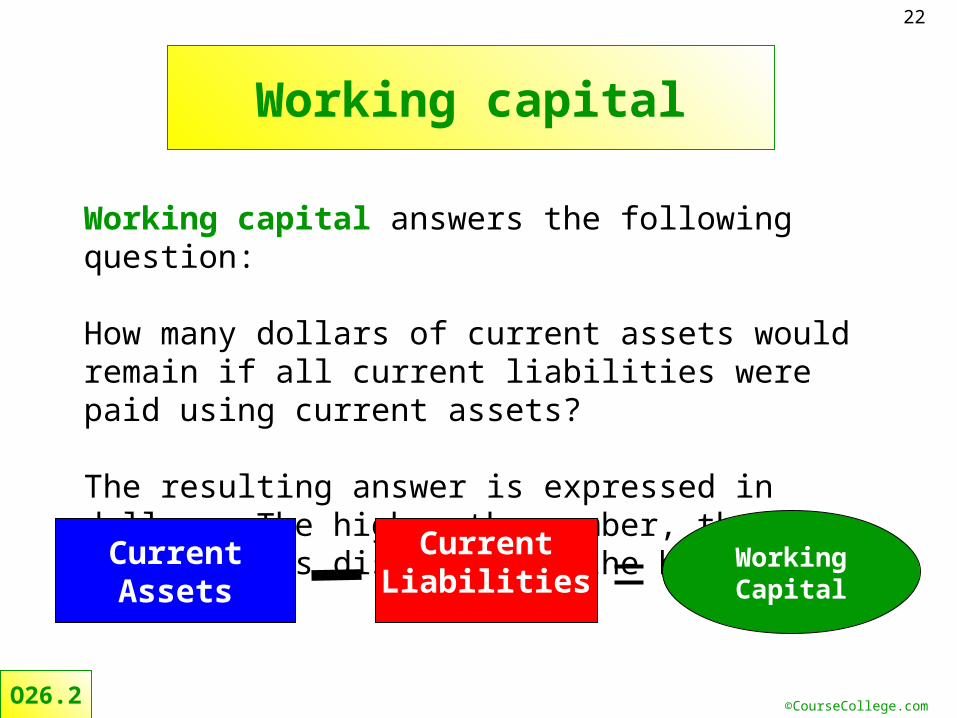
Working capital answers the following question:
How many dollars of current assets would remain if all current liabilities were paid using current assets?
The resulting answer is expressed in dollars. The higher the number, the more liquidity is displayed by the balance sheet.
Working capital
Working Capital
Current Assets
Current Liabilities
O26.2

©CourseCollege.com
23
Working Capital Example
ASSETS LIABILITIESCash 25,600 Accounts Payable 165,700Accounts Receivable 56,700 Current liabilities 165,700Inventory 98,200 Notes Payable 36,750Supplies 2,100 Total 202,450
Current assets 182,600Equipment 121,000 EQUITY
Owner, Capital 283,750Total 486,200 Total 486,200
Working capital Current assets - Current LiabilitiesWorking capital = 16900.00
BALANCE SHEETAs of 12/31/07
RAMOS Distributors
$16,900 of current assets would remain if
current assets were used to pay all current
liabilities
?$16,900O26.2
©CourseCollege.com
24
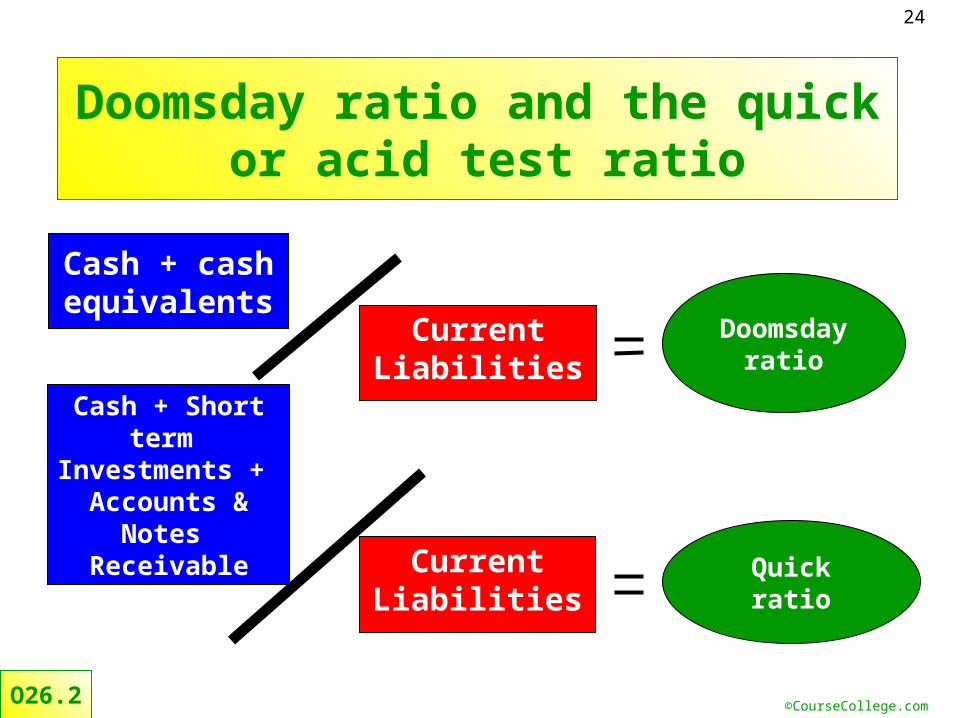
Cash + cash equivalents
Current Liabilities
Doomsday ratio
Quick ratio
Doomsday ratio and the quick or acid test ratio
Cash + Short term
Investments + Accounts &
Notes Receivable Current
Liabilities
O26.2
©CourseCollege.com
25
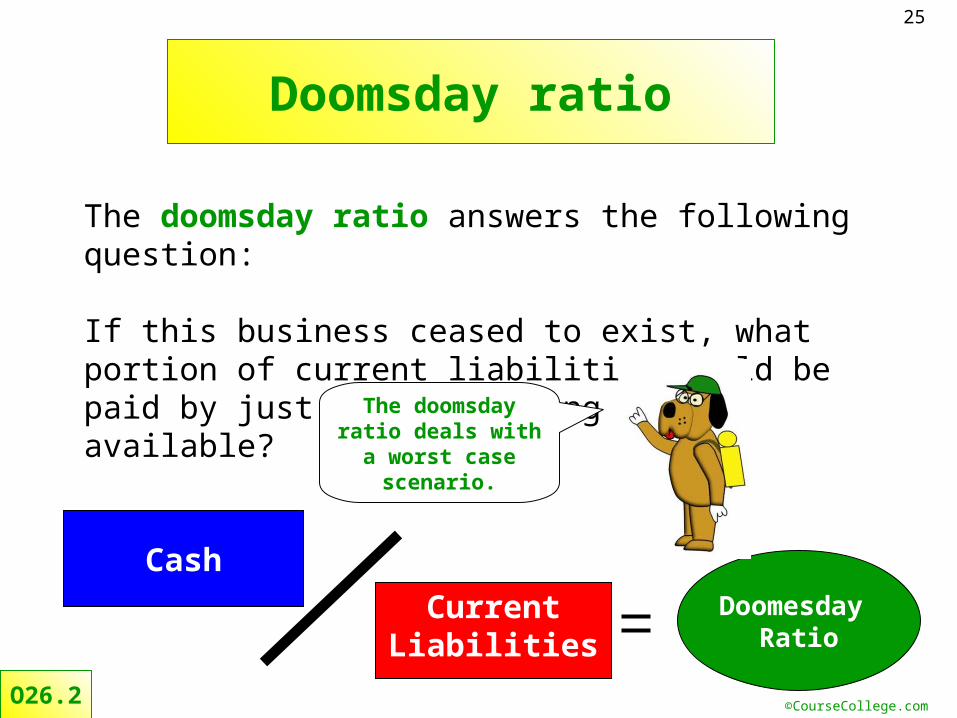
The doomsday ratio answers the following question:
If this business ceased to exist, what portion of current liabilities could be paid by just using existing cash available?
Doomsday ratio
Cash
Current Liabilities
Doomesday
Ratio
The doomsday ratio deals with a
worst case scenario.
O26.2

©CourseCollege.com
26
Doomsday Ratio Example
ASSETS LIABILITIESCash 25,600 Accounts Payable 165,700Accounts Receivable 56,700 Current liabilities 165,700Inventory 98,200 Notes Payable 36,750Supplies 2,100 Total 202,450
Current assets 182,600Equipment 121,000 EQUITY
Owner, Capital 283,750Total 486,200 Total 486,200
Doomesday ratio Cash / Current liabilitiesDratio 0.15
BALANCE SHEETAs of 12/31/07
RAMOS Distributors
15% of current liabilities could be
paid with cash available
?.15O26.2

©CourseCollege.com
27
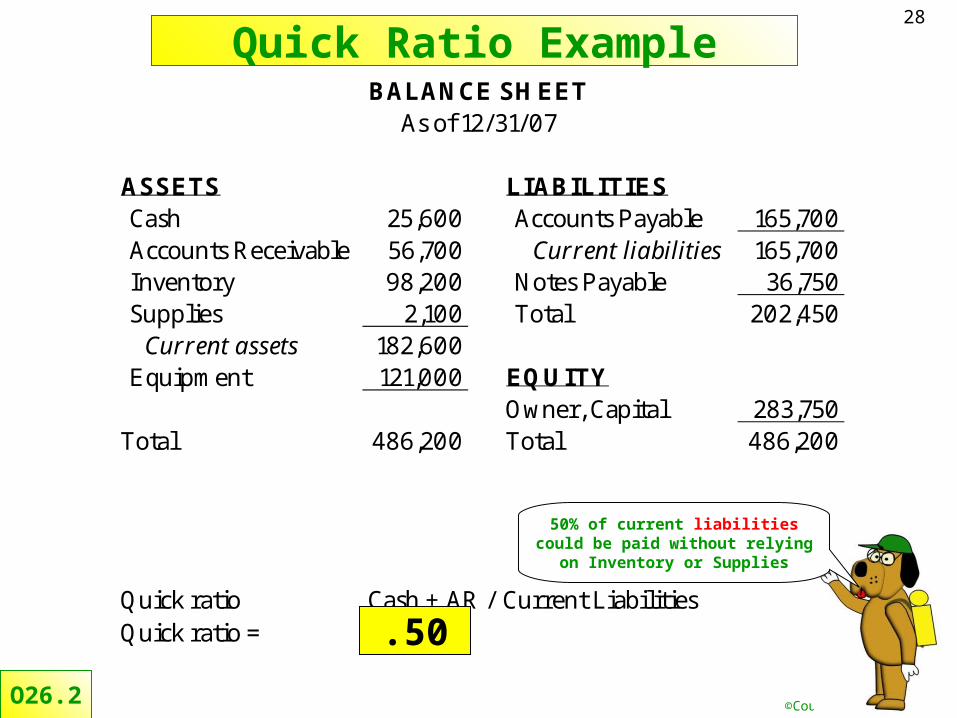
The quick ratio answers the following question:
How many dollars of cash, short term investments, accounts and notes receivable are available to pay current assets?
Quick ratio
Current Liabilities
Quick Ratio
Notice Inventory is not included
Cash + Short term
Investments + Accounts &
Notes Receivable
O26.2
©CourseCollege.com
28
Quick Ratio Example
ASSETS LIABILITIESCash 25,600 Accounts Payable 165,700Accounts Receivable 56,700 Current liabilities 165,700Inventory 98,200 Notes Payable 36,750Supplies 2,100 Total 202,450
Current assets 182,600Equipment 121,000 EQUITY
Owner, Capital 283,750Total 486,200 Total 486,200
Quick ratio Cash + AR / Current LiabilitiesQuick ratio = 0.50
BALANCE SHEETAs of 12/31/07
50% of current liabilities could be paid without relying on
Inventory or Supplies
?.50
O26.2
©CourseCollege.com
29
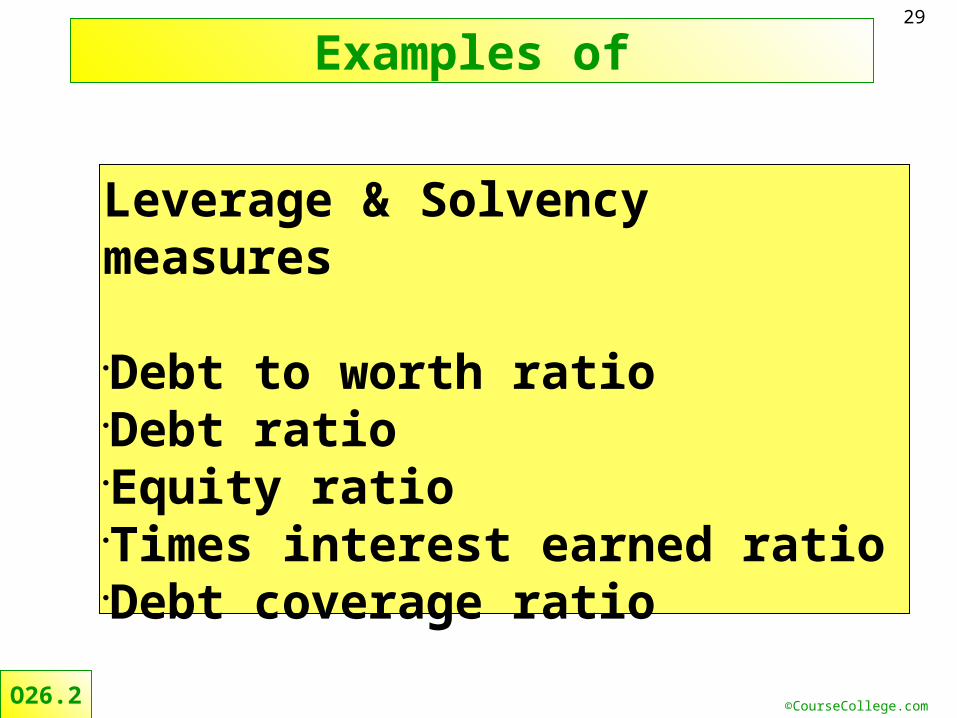
Examples of
O26.2
Leverage & Solvency measures
Debt to worth ratioDebt ratioEquity ratioTimes interest earned ratioDebt coverage ratio

©CourseCollege.com
30
Assets Liabilities
Balance Sheet
Equity
Leverage
Highly Leveraged (claims on assets are mostly from liabilities)
Assets Liabilities
Balance Sheet
Equity
Limited Leverage (claims on assets are mostly from equity)
O26.2
©CourseCollege.com
31
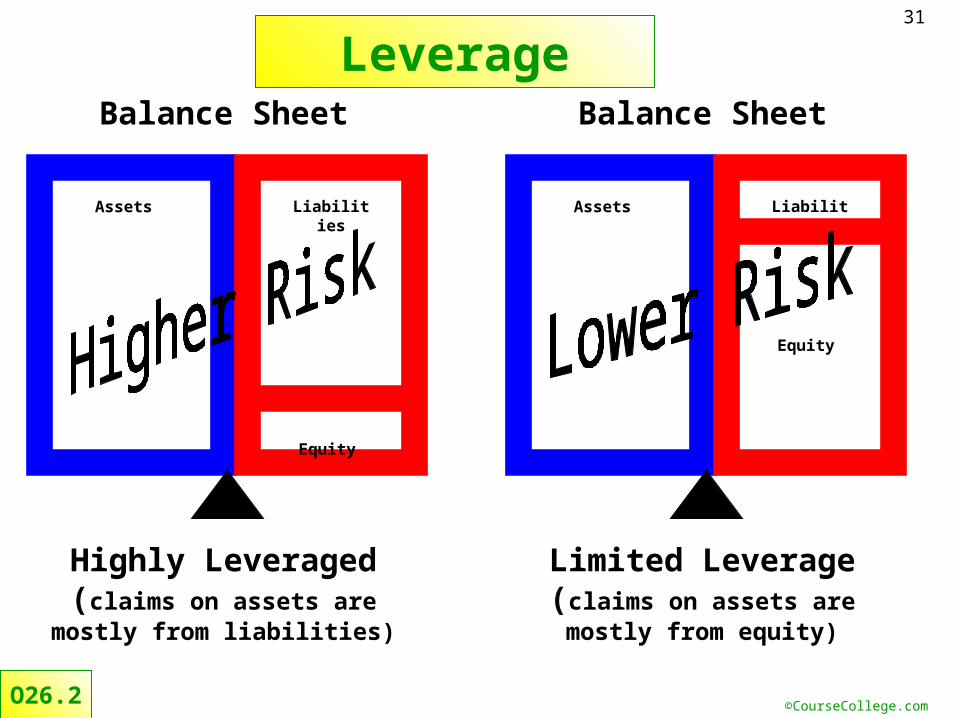
Assets Liabilities
Balance Sheet
Equity
Leverage
Highly Leveraged (claims on assets are mostly from liabilities)
Assets Liabilities
Balance Sheet
Equity
Limited Leverage (claims on assets are mostly from equity)
O26.2

©CourseCollege.com
32
The debt to worth ratio answers the following question:
For every $1 of Equity, how many dollars of Liabilities does the firm owe?
Debt to worth ratio
Total Liabilitie
s Debt to Worth
A leverage measure
Total Equity
O26.2

©CourseCollege.com
33
Debt to Worth Example
ASSETS LIABILITIESCash 24,000 Accounts Payable 56,000Accounts Receivable 34,500 Salaries Payable 3,400Inventory 67,800 Notes Payable 1,200Supplies 1,500 Total 60,600Equipment 43,200
EQUITYOwner, Capital 110,400
Total 171,000 Total 231,600
Debt to Worth = Total Liab/Total EquityD/W = 0.55
BALANCE SHEETAs of 12/31/07
CASE SUPPLY
Each dollar of Equity supports
55 cents of Liabilities
O26.2

©CourseCollege.com
34
The debt ratio answers the following question:
What percentage of total assets is supported by debt?
Debt ratio
Total Liabilitie
sDebt ratio
A leverage measure
Total Assets
O26.2

©CourseCollege.com
35
Debt ratio Example
ASSETS LIABILITIESCash 24,000 Accounts Payable 56,000Accounts Receivable 34,500 Salaries Payable 3,400Inventory 67,800 Notes Payable 1,200Supplies 1,500 Total 60,600Equipment 43,200
EQUITYOwner, Capital 110,400
Total 171,000 Total 231,600
Debt ratio = Total Liab/Total AssetsDebt ratio = 0.35
BALANCE SHEETAs of 12/31/07
DRUTCH SUPPLY
Each dollar of Assets is supported
by 35 cents of
Liabilities
O26.2

©CourseCollege.com
36
Times Interest Earned Ratio
Adjusted accrual income = the sum of accrual net income + interest expense + income tax expense + non cash expenses such as depreciation, amortization and depletion.
The higher the ratio, the more adequate earnings
are to cover interest expense
Times interest earned
Interest expense
Adjusted accrual income=
O26.2

©CourseCollege.com
37
Debt Coverage Ratio
Adjusted accrual income = the sum of accrual net income + interest expense + income tax expense + non cash expenses such as depreciation, amortization and depletion.
The higher the ratio, the more adequate earnings are to cover debt service
payments
Debt Coverage Principal & Interest
payments
Adjusted accrual income=
O26.2

©CourseCollege.com
38
Example -Times interest earned and Debt coverage ratios
Assets LiabilitiesCash 123,000 Accounts Payable 536,700Accounts receivable 345,000 Current Portion Long Term Debt 138,600Inventory 410,500 Long Term Debt 823,400Property, Plant, Equipment 1,200,500 Total liabilities 1,498,700
Equity Total assets 2,079,000 Owner, Capital 580,300
Sales 2,347,000
Cost of Goods Sold 1,760,250 Adjusted accrual income 376,150Wages expense 210,600 (NP +Inc tax exp + Int exp + depr)Depreciation expense 60,025 Times Interest earned 4.3Interest expense 86,580 Adjusted accrual income / Interest expenseMisc expense 38,400 Debt Coverage 1.7
Net Profit 191,145
Balance Sheet -Ruiz RecyclingAs of 12/31 2009
Adjusted accrual income/ ( Principal + Interest exp)
Income StatementFor the year ended 12/31/09
X
X
O26.2
©CourseCollege.com
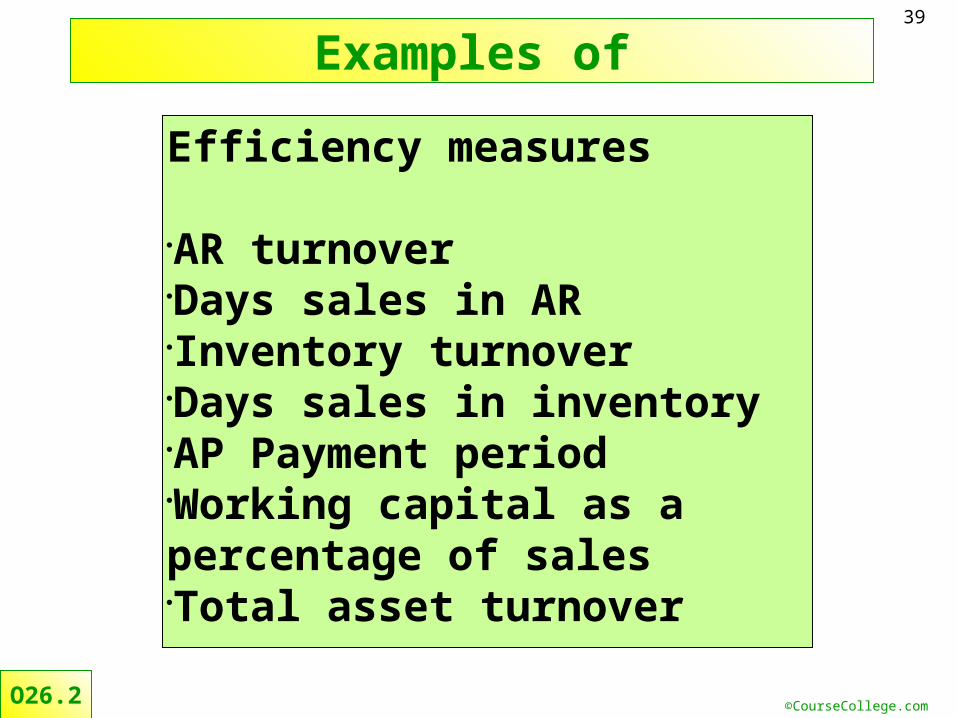
39
Examples of
O26.2
Efficiency measures
AR turnoverDays sales in ARInventory turnoverDays sales in inventoryAP Payment periodWorking capital as a percentage of salesTotal asset turnover

©CourseCollege.com
40
The AR turnover ratio answers the following question:
How many times did the firm sell its’ average Accounts Receivable.
AR Turnover
SalesAR
Turnover
Average AR is often calculated
as:(Beg AR +End
AR)/2
Average Accounts Receivable
O26.2

©CourseCollege.com
41
The days’ sales uncollected answers the following question:On average, how many days will it take to collect the current AR total?
Days’ Sales Uncollected(in AR)
AR
Sales
Days’ Sales
Uncollected
The AR balance is the end of year
total. Sales is for the
year.
X 365
O26.2

©CourseCollege.com
42
Assets 2007 2008 Liabilities 2007 2008 Cash 9,000 10,000 Accounts Payable 45,000 41,500 Accounts receivable 75,000 81,000 Inv. Loan 18,000 14,400 Alllowance for Uncol. Accounts (2,500) (2,600) Total liabilities 63,000 55,900
Inventory 151,000 164,000 Equity Total assets 232,500 252,400 Owner, Capital 169,500 196,500
Sales 654,000
Cost of Goods Sold 490,500 Average AR 75,450Wages expense 61,000 (net AR for years 2007 +2008) / 2Uncollectible account AR turnover 8.7 expense 2,000 (Sales / Avg. AR)Miscellaneous expense 73,500 Days' Sales Uncollected 43.8
Net Profit 27,000 (365 x AR / Sales)
Income StatementFor the year ended 12/31/08
days
X
Balance Sheet -April's GiftsAs of 12/31 2007 and 2008
Example
O26.2

©CourseCollege.com
43
Inventory turnover answers the following question:How many times did the firm sell their average inventory during the year?
Inventory Turnover
COGS
Average Inventor
yInventory Turnover
Remember to use the Average
Inventory
O26.2

©CourseCollege.com
44
Days Sales in Inventory answers the following question:How many days sales of inventory remain in the present balance of inventory?
Days Sales in Inventory
COGS
Ending Inventor
y
Days Sales in
Inventory
Remember to use the ending Inventory
X 365
O26.2

©CourseCollege.com
45
Assets 2007 2008 Liabilities 2007 2008 Cash 9,000 10,000 Accounts Payable 45,000 41,500 Accounts receivable 75,000 81,000 Inv. Loan 18,000 14,400 Alllowance for Uncol. Accounts (2,500) (2,600) Total liabilities 63,000 55,900
Inventory 151,000 164,000 Equity Total assets 232,500 252,400 Owner, Capital 169,500 196,500
Sales 654,000
Cost of Goods Sold 490,500 Average Inventory 157,500Wages expense 61,000 (Inventory for years 2007 +2008) / 2Uncollectible account Inventory turnover 3.1 expense 2,000 (COGS / Avg. Inv.)Miscellaneous expense 73,500 Days' Sales In Inventory 122.0
Net Profit 27,000 (365 x Inv. / COGS)
Income StatementFor the year ended 12/31/08
days
X
Balance Sheet -April's GiftsAs of 12/31 2007 and 2008
Example –Inventory ratios
O26.2

©CourseCollege.com
46
The AP payment period answers the following question:How many days is the firm expected to take to pay the present balance of Accounts Payable?
AP payment period
COGS
APAP
payment period
The AP balance is the end of year
total. COGS is for the
year.
X 365
O26.2

©CourseCollege.com
47
Harianto ImportsIncome StatementFor the year ending 12/31/07
Assets Liabilities Sales 630,000Cash 56,000 AP 186,000 Less Sales R&A (7,560)AR 122,000 Credit Line 110,000 Net Sales 622,440
Inventory 311,000 Loan Payable 10,400 ExpensesSupplies 12,000 Total Liab. 306,400 COGS 478,800Equipment 45,000 Equity Wages 63,500
Owner, Capital 239,600 Supplies 1,120Total Assets 546,000 Total Liab. + Equity 546,000 Rent 18,500
Utilities 13,400Miscellaneous 1,200
Total Expenses 576,520
142 DAYS
Net Income 45,920(AP/COGS x 365)
Harianto ImportsBalance SheetAs of 12/31/07
AP Payment Period
Example –AP payment period
186,000 / 478,800 x 365 = 142
O26.2

©CourseCollege.com
48
Total Asset Turnover Ratio
Total asset turnover ratio is:
Net Sales / Average total assets
Sales
AverageAssets
The higher the turnover
ratio, the more
effective management is in utilizing
assets to generate
sales
O26.2

©CourseCollege.com
49
Total asset turnover -Example
Assets 2007 2008 Liabilities 2007 2008Cash 34,000 28,500 Accounts Payable 198,500 187,500Accounts receivable 265,000 301,400 Equipment loan 173,000 169,500Inventory 535,000 575,000Property Plant Equip 275,600 264,600 Total liabilities 371,500 357,000
Accumulated Depr. (175,500) (196,500) Equity Total assets 934,100 973,000 Owner, Capital 562,600 616,000
Sales 3,356,800
Cost of Goods Sold 2,517,600 Average Assets 953,550Wages expense 314,900 (TA for years 2010 +2011) / 2Depreciation expense 21,000Selling expense 296,700
Miscellaneous expense 153,200 Total asset turnover 3.5
Net Profit 53,400
X
Balance Sheet -Chen DistributorsAs of 12/31 2010 and 2011
( Sales/ Average assets)
Income StatementFor the year ended 12/31/08
O26.2

©CourseCollege.com
50
Examples of
O26.2
Profitability & Market measures
Net profit ratioGross profit ratioOperating cash flow on assets ratioReturn on assetsReturn on equityBasic earnings per sharePrice earnings ratio

©CourseCollege.com
51
%Net Sales 894,580
Cost of Goods Sold 435,500
Gross Profit 459,080 51%
Operating expenses 324,480
Net Profit 134,600 15%
All Fit Health SupplyIncome Statement
For the Year ending December 31, 2007
%Net Sales 894,580
Cost of Goods Sold 435,500
Gross Profit 459,080 51%
Operating expenses 324,480
Net Profit 134,600 15%
All Fit Health SupplyIncome Statement
For the Year ending December 31, 2007
134,600 / 894,580 = 15%.
Or $.15 out of every sales dollar was
remains as net profit.
O26.2
Net Profit ratio

©CourseCollege.com
52
%Merchandise Sales 869,580Discount Card Sales 25,000 Net Sales 894,580
Cost of Goods Sold 435,500
Gross Profit 459,080 51%
Total operating expenses 324,480
Net Profit 134,600 15%
Income StatementFor the Year ending December 31, 2007
%Merchandise Sales 869,580Discount Card Sales 25,000 Net Sales 894,580
Cost of Goods Sold 435,500
Gross Profit 459,080 51%
Total operating expenses 324,480
Net Profit 134,600 15%
Income StatementFor the Year ending December 31, 2007
459,080 / 894,580 = 51%.
Or $.51 out of every sales
dollar was left to cover
remaining expenses and profit after the
cost of sold merchandise
was deducted.
O26.2
Gross Profit ratio

©CourseCollege.com
53
Basic earnings per share
Net income available to common stockholdersdivided by
# of Common shares outstanding
Net income less preferred dividends
average # of common shares outstanding
O26.2
Weighted average common
shares during the earning
period

©CourseCollege.com
54
Price earnings ratio
Market price per share
Basic earnings per share
O26.2
How many times are investors paying for the annual earnings
per share?

©CourseCollege.com
55
End Unit 26