Embed Size (px)
Citation preview

COM 5023 – Quantitative Research Methods
Course Materials Handbook
(Spring 2010)
Prepared by
H. Paul LeBlanc III
for
The University of Texas at San Antonio
Department of Communication
Copyright © 2007-2010, H. Paul LeBlanc III.All rights reserved.

TABLE OF CONTENTS
Syllabus............................................................................................................................................1
List of Important Dates ...................................................................................................................4
Schedule of Assignments and Activities ..........................................................................................5
Grade Monitoring Form...................................................................................................................6
Assignment 1: Research Topics.......................................................................................................7
Assignment 2: Univariate Descriptive Statistics..............................................................................8
Assignment 3: Associational Hypotheses .......................................................................................9
Assignment 4: Pearson Product-moment Correlation....................................................................10
Assignment 5: Comparative Hypotheses ......................................................................................11
Assignment 6: Independent Samples t ...........................................................................................12
Assignment 7: One-way ANOVA.................................................................................................13
Assignment 8: Factorial ANOVA..................................................................................................14
Assignment 9: Chi-Square..............................................................................................................15
Assignment 10: Ordinal Non-parametric Tests .............................................................................16
List of Communication Research Journals.....................................................................................17
References ......................................................................................................................................18
COM 5023 (Spring 2010), page 1
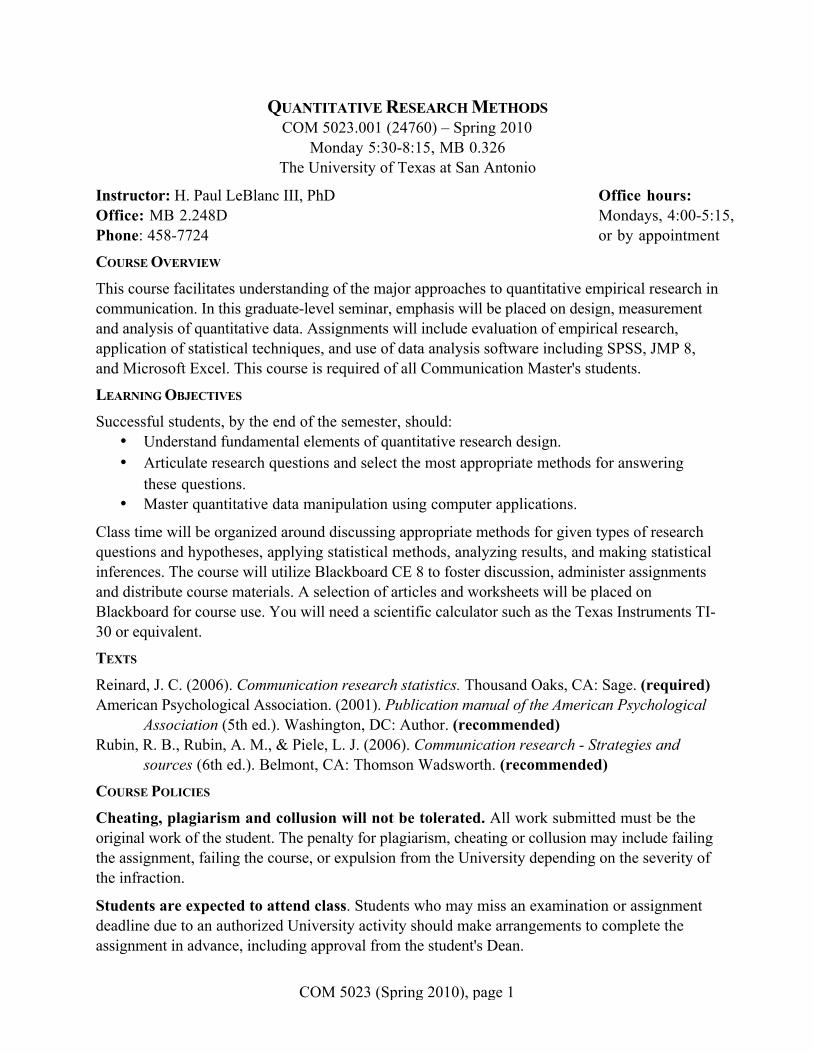
QUANTITATIVE RESEARCH METHODSCOM 5023.001 (24760) – Spring 2010
Monday 5:30-8:15, MB 0.326The University of Texas at San Antonio
Instructor: H. Paul LeBlanc III, PhD Office hours:Office: MB 2.248D Mondays, 4:00-5:15,Phone: 458-7724 or by appointment
COURSE OVERVIEW
This course facilitates understanding of the major approaches to quantitative empirical research incommunication. In this graduate-level seminar, emphasis will be placed on design, measurementand analysis of quantitative data. Assignments will include evaluation of empirical research,application of statistical techniques, and use of data analysis software including SPSS, JMP 8,and Microsoft Excel. This course is required of all Communication Master's students.
LEARNING OBJECTIVES
Successful students, by the end of the semester, should:• Understand fundamental elements of quantitative research design.• Articulate research questions and select the most appropriate methods for answering
these questions.• Master quantitative data manipulation using computer applications.
Class time will be organized around discussing appropriate methods for given types of researchquestions and hypotheses, applying statistical methods, analyzing results, and making statisticalinferences. The course will utilize Blackboard CE 8 to foster discussion, administer assignmentsand distribute course materials. A selection of articles and worksheets will be placed onBlackboard for course use. You will need a scientific calculator such as the Texas Instruments TI-30 or equivalent.
TEXTS
Reinard, J. C. (2006). Communication research statistics. Thousand Oaks, CA: Sage. (required)American Psychological Association. (2001). Publication manual of the American Psychological
Association (5th ed.). Washington, DC: Author. (recommended)Rubin, R. B., Rubin, A. M., & Piele, L. J. (2006). Communication research - Strategies and
sources (6th ed.). Belmont, CA: Thomson Wadsworth. (recommended)
COURSE POLICIES
Cheating, plagiarism and collusion will not be tolerated. All work submitted must be theoriginal work of the student. The penalty for plagiarism, cheating or collusion may include failingthe assignment, failing the course, or expulsion from the University depending on the severity ofthe infraction.
Students are expected to attend class. Students who may miss an examination or assignmentdeadline due to an authorized University activity should make arrangements to complete theassignment in advance, including approval from the student's Dean.
LeBlanc
COM 5023 (Spring 2010), page 2
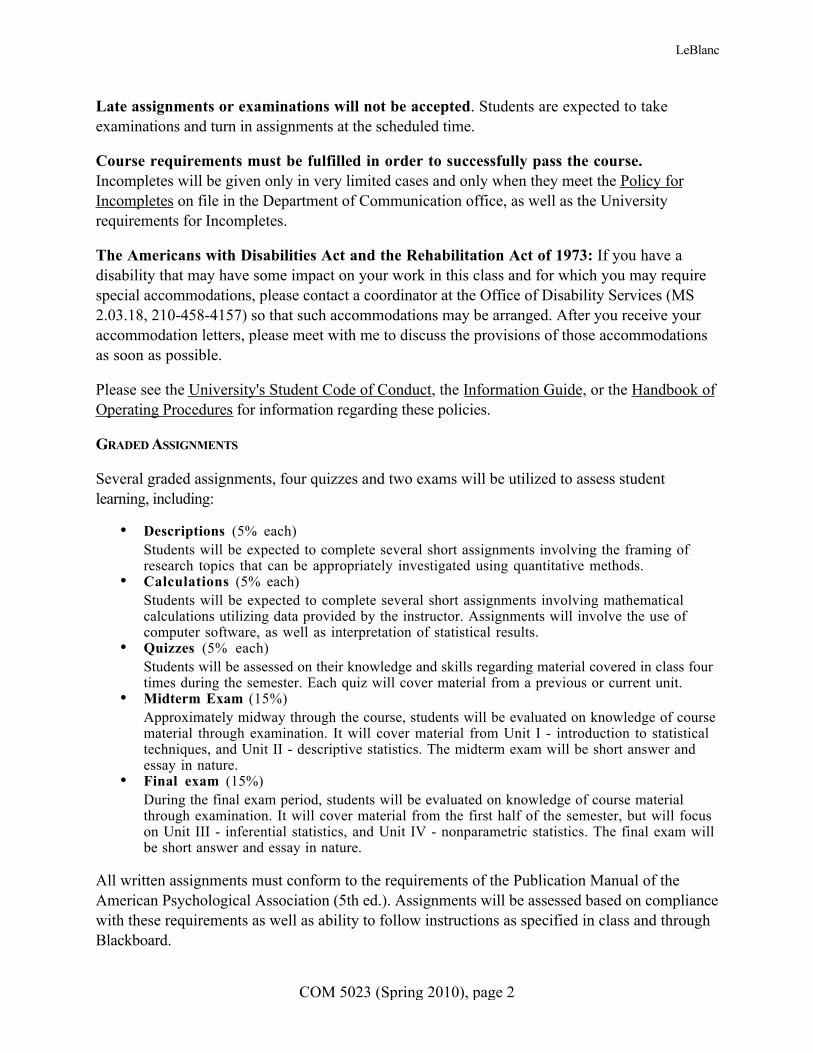
Late assignments or examinations will not be accepted. Students are expected to takeexaminations and turn in assignments at the scheduled time.
Course requirements must be fulfilled in order to successfully pass the course.Incompletes will be given only in very limited cases and only when they meet the Policy forIncompletes on file in the Department of Communication office, as well as the Universityrequirements for Incompletes.
The Americans with Disabilities Act and the Rehabilitation Act of 1973: If you have adisability that may have some impact on your work in this class and for which you may requirespecial accommodations, please contact a coordinator at the Office of Disability Services (MS2.03.18, 210-458-4157) so that such accommodations may be arranged. After you receive youraccommodation letters, please meet with me to discuss the provisions of those accommodationsas soon as possible.
Please see the University's Student Code of Conduct, the Information Guide, or the Handbook ofOperating Procedures for information regarding these policies.
GRADED ASSIGNMENTS
Several graded assignments, four quizzes and two exams will be utilized to assess studentlearning, including:
• Descriptions (5% each)Students will be expected to complete several short assignments involving the framing ofresearch topics that can be appropriately investigated using quantitative methods.
• Calculations (5% each)Students will be expected to complete several short assignments involving mathematicalcalculations utilizing data provided by the instructor. Assignments will involve the use ofcomputer software, as well as interpretation of statistical results.
• Quizzes (5% each)Students will be assessed on their knowledge and skills regarding material covered in class fourtimes during the semester. Each quiz will cover material from a previous or current unit.
• Midterm Exam (15%)Approximately midway through the course, students will be evaluated on knowledge of coursematerial through examination. It will cover material from Unit I - introduction to statisticaltechniques, and Unit II - descriptive statistics. The midterm exam will be short answer andessay in nature.
• Final exam (15%)During the final exam period, students will be evaluated on knowledge of course materialthrough examination. It will cover material from the first half of the semester, but will focuson Unit III - inferential statistics, and Unit IV - nonparametric statistics. The final exam willbe short answer and essay in nature.
All written assignments must conform to the requirements of the Publication Manual of theAmerican Psychological Association (5th ed.). Assignments will be assessed based on compliancewith these requirements as well as ability to follow instructions as specified in class and throughBlackboard.

LeBlanc
COM 5023 (Spring 2010), page 3
GRADING POLICIES
• Descriptions (50 pts. each) 900 - 1000: A• Calculations (50 pts. each) 800 - 899: B• Quizzes (50 pts. each) 700 - 799: C• Midterm examination (150 pts.) 600 - 699: D• Final examination (150 pts.) BELOW 600: F
Grades are earned and will be calculated on a cumulative scale. Grades can be calculated bydividing the raw score of the assignment by the total points possible for the assignment. Gradesare calculated using a 1000-point scale. For example, if the total number of points that can beachieved on an assignment is 50, then that assignment is worth 5% of the final grade. The finalexam is worth 150 points. Therefore, a raw score of 128 on the final exam is 12.8% of the finalgrade. Extra credit will not be assigned for any student due to poor performance or missedassignment. Grades are not rounded. You may obtain your current grade for assignments inBlackboard for this course.
GRADING RATIONALE
A Exceptionally well-prepared completion of assignment indicating effort, individualizedstyle, and impact expected of effective communication.
B Unusually well-prepared completion of assignment indicating original application ofcourse materials and individual imagination distinctly superior to average effort.
C Satisfactory completion of assignment indicating effort normally expected of the majorityof students (basic preparation, correct procedure, and disciplined technique.)
D Unsatisfactory completion of assignment indicating technical irregularity, misperceivedobjectives or methods, unorganized effort, or failure to follow directions.
F Failure to complete assignments during the scheduled time through lack of evident effort.
All students will be expected to follow the instructions as they are presented, meet the gradingcriteria, and turn in each assignment by the due date in order to earn a "B." As per Universityregulations, neither the instructor nor the office staff will report grades by telephone, fax or email.
This course is designed to meet the University of Texas at San Antonio’s Quality EnhancementPlan (QEP) which includes four goals for students: (a) enhance quantitative literacy, (b)understand the role of numbers in professional and personal lives, (c) Know how to reason andthink using numbers, and (d) use data to make better decisions.

LeBlanc
COM 5023 (Spring 2010), page 4
LIST OF IMPORTANT DATES
January 11: Classes begin.
January 15: Final date for adding the course.
January 18: MLK Jr. Holiday. No class.
January 19: Assignment 1 due.
January 26: Assignment 2 due.
January 27: Final date for dropping the course without a “W”.
February 2: Assignment 3 due.
February 9: Assignment 4 due.
February 16: Assignment 5 due.
February 19: Midterm grades due.
March 1: Midterm Exam.
March 9: Assignment 6 due.
March 15-19: Spring Break.
March 22: Final date for dropping course.
March 23: Assignment 7 due.
March 30: Assignment 8 due.
April 6: Assignment 9 due.
April 13: Assignment 10 due.
April 26: Last Day of Class. Final date for withdrawing from all classes.
May 3: Final Exam 5:00pm - 7:30.
May 11: Final grades due.
Dates for class assignments and exams will not be altered. We will meet during the FinalExamination period. Unless otherwise indicated, assignments are due as assigned beforeMidnight.
LeBlanc
COM 5023 (Spring 2010), page 5
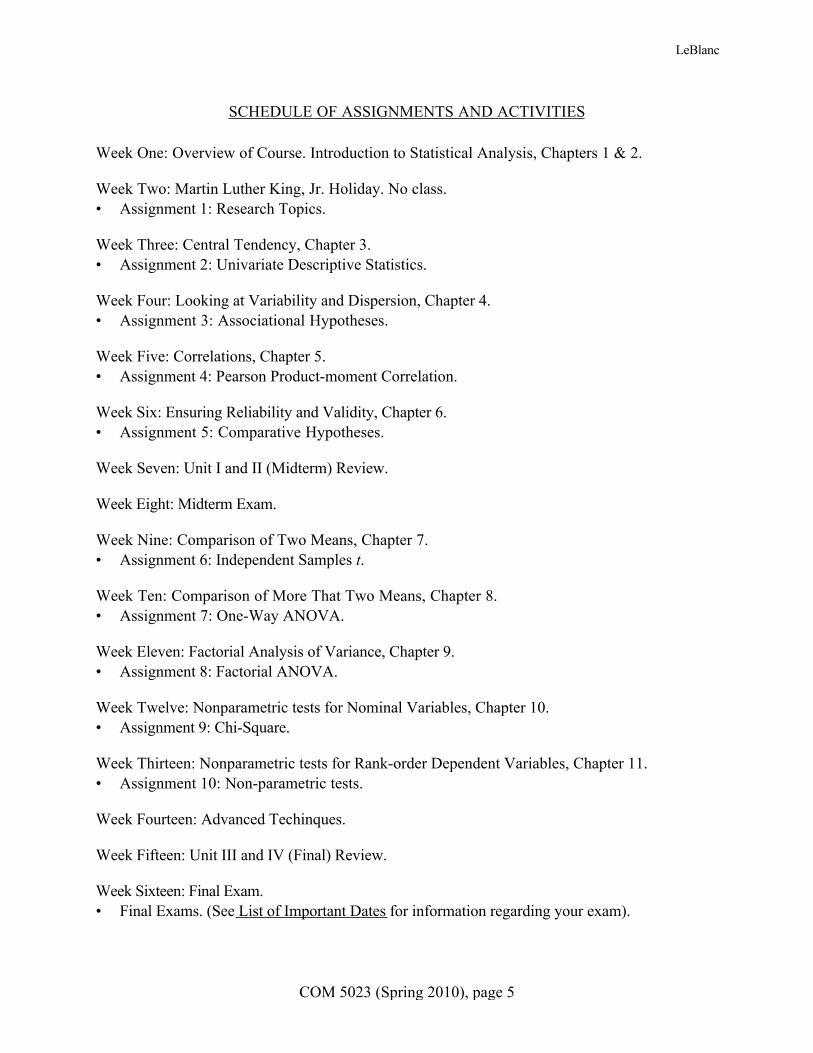
SCHEDULE OF ASSIGNMENTS AND ACTIVITIES
Week One: Overview of Course. Introduction to Statistical Analysis, Chapters 1 & 2.
Week Two: Martin Luther King, Jr. Holiday. No class.• Assignment 1: Research Topics.
Week Three: Central Tendency, Chapter 3.• Assignment 2: Univariate Descriptive Statistics.
Week Four: Looking at Variability and Dispersion, Chapter 4.• Assignment 3: Associational Hypotheses.
Week Five: Correlations, Chapter 5.• Assignment 4: Pearson Product-moment Correlation.
Week Six: Ensuring Reliability and Validity, Chapter 6.• Assignment 5: Comparative Hypotheses.
Week Seven: Unit I and II (Midterm) Review.
Week Eight: Midterm Exam.
Week Nine: Comparison of Two Means, Chapter 7.• Assignment 6: Independent Samples t.
Week Ten: Comparison of More That Two Means, Chapter 8.• Assignment 7: One-Way ANOVA.
Week Eleven: Factorial Analysis of Variance, Chapter 9.• Assignment 8: Factorial ANOVA.
Week Twelve: Nonparametric tests for Nominal Variables, Chapter 10.• Assignment 9: Chi-Square.
Week Thirteen: Nonparametric tests for Rank-order Dependent Variables, Chapter 11.• Assignment 10: Non-parametric tests.
Week Fourteen: Advanced Techinques.
Week Fifteen: Unit III and IV (Final) Review.
Week Sixteen: Final Exam.• Final Exams. (See List of Important Dates for information regarding your exam).
LeBlanc
COM 5023 (Spring 2010), page 6
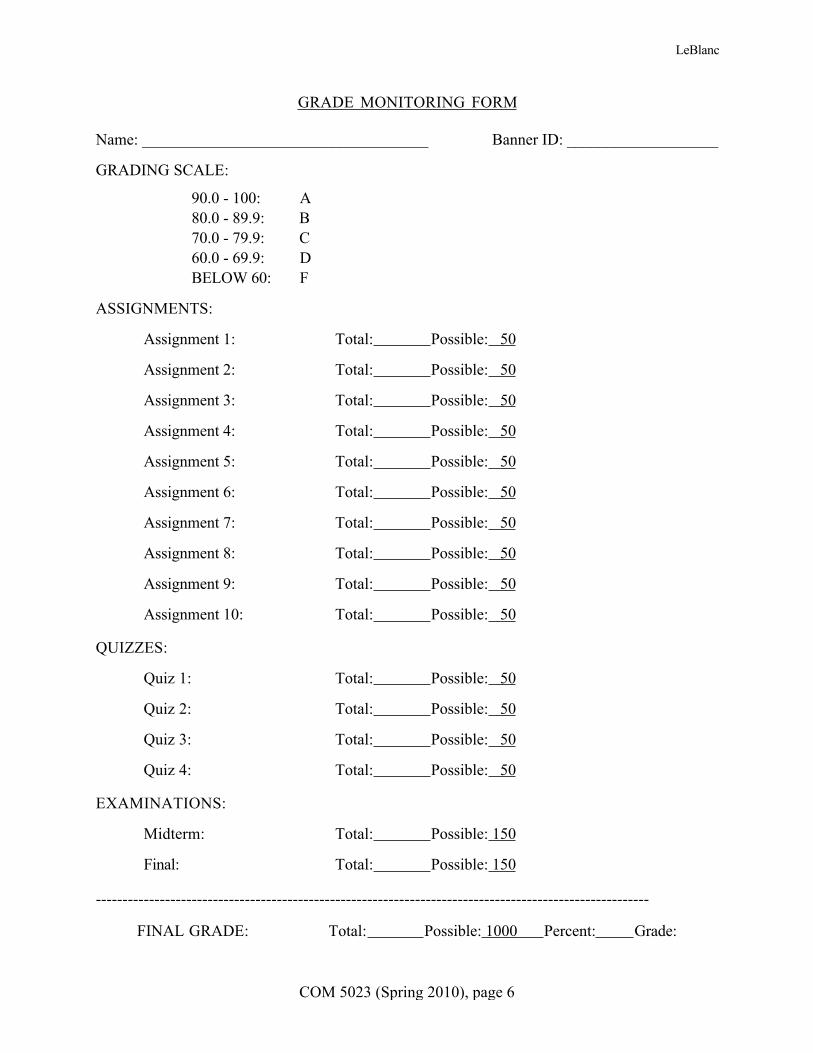
GRADE MONITORING FORM
Name: ____________________________________ Banner ID: ___________________
GRADING SCALE:
90.0 - 100: A80.0 - 89.9: B70.0 - 79.9: C60.0 - 69.9: DBELOW 60: F
ASSIGNMENTS:
Assignment 1: Total: Possible: 50
Assignment 2: Total: Possible: 50
Assignment 3: Total: Possible: 50
Assignment 4: Total: Possible: 50
Assignment 5: Total: Possible: 50
Assignment 6: Total: Possible: 50
Assignment 7: Total: Possible: 50
Assignment 8: Total: Possible: 50
Assignment 9: Total: Possible: 50
Assignment 10: Total: Possible: 50
QUIZZES:
Quiz 1: Total: Possible: 50
Quiz 2: Total: Possible: 50
Quiz 3: Total: Possible: 50
Quiz 4: Total: Possible: 50
EXAMINATIONS:
Midterm: Total: Possible: 150
Final: Total: Possible: 150
--------------------------------------------------------------------------------------------------------
FINAL GRADE: Total: Possible: 1000 Percent: Grade:

LeBlanc
COM 5023 (Spring 2010), page 7
Assignment 1Research Topics
Objective: To frame a research topic as an investigation testable through statistical analysis.
Directions: Develop two topic descriptions for topics you might be interested in researching.Each description should be no more than a paragraph long, but should specify the domain ofstudy, the phenomena of interest, and the purpose of the study.
For each topic, specify five research questions and five hypotheses. Each of the five hypothesesshould reflect the one of the research questions, but be reformulated into a testable statement.Additionally, each research question could have one variable to be measured, but each hypothesisshould have at least two but no more than three variables to be measured. Keep in mind there aretwo basic types of hypotheses: associational and comparative.
Treat each topic separately by giving the topic a title followed by the paragraph description, thefive research questions, and the five hypotheses. Each topic with its description, researchquestions and hypotheses are worth 25 points.
Submit your homework electronically as per in class and Blackboard instructions.
This assignment (and subsequent written assignments) should be written in formal styleaccording to the American Psychological Association (APA) style manual (5th ed.). Include inthe header your last name on the top right (as you would a running head. Submit the assignmentvia Blackboard Assignments Link in this format (LastnameF1.doc). Please use Microsoft Word,or save in RFT format. (50 points)
Evaluation of the Research Topics assignment will be based on the following criteria:
I. Topic OneA. Description: Domain, Phenomena, Purpose (10 pts.)B. Five Research Questions (5 pts.)C. Five Hypotheses (10 pts.)
II. Topic TwoA. Description: Domain, Phenomena, Purpose (10 pts.)B. Five Research Questions (5 pts.)C. Five Hypotheses (10 pts.)

LeBlanc
COM 5023 (Spring 2010), page 8
Assignment 2Univariate Descriptive Statistics
Objective: To conduct basic computation of quantitative data.
Directions: Using the Classroom Interaction Rules Survey and the Excel data file (HPLMA.XLS)available on Blackboard, calculate the following measures:
1) Mean, Standard Deviation, Minimum, and Maximum for the age variable.
2) Mean and Standard Deviation for each of the compliance (c) variables on each rule, andthe Mean and Standard Deviation for each of the importance (i) variables on each rule.
3) The Grand Mean and Grand Standard Deviation for all of the compliance (c) variables,and the Grand Mean and Grand Standard Deviation for all of the importance (i)variables.
4) Mean and Standard Deviation for each of the compliance (c) variables on each rule foreach gender separately, and the Mean and Standard Deviation for each of theimportance (i) variables on each rule for each gender separately.
5) The Grand Mean and Grand Standard Deviation for all of the compliance (c) variablesfor each gender separately, and the Grand Mean and grand Standard Deviation for allof the importance (i) variables for each gender separately.
6) The frequencies and percentages for the gender variable.
* Note: Use the second "results" Worksheet in the Excel file (HPLMA.XLS) to record yourresponses to the above items. Round all means, standard deviations, and percentages to two (2)decimal places. Frequencies, minimum and maximum figures should be given in whole numbers.
Submit your homework electronically as per in class and Blackboard instructions.
Evaluation of the Univariate Descriptive Stats assignment will be based on the following criteria:
I. Mean, SD, Min, Max for age (5 pts.)II. Mean and SD
A. For each compliance rule (5 pts.)B. For each importance rule (5 pts.)
III. Grand Mean and Grand SDA. For all compliance rules (5 pts.)B. For all importance rules (5 pts.)
IV. Mean and SD by genderA. For each compliance rule (5 pts.)B. For each importance rule (5 pts.)
V. Grand Mean and Grand SD by genderA. For all compliance rules (5 pts.)B. For all importance rules (5 pts.)
VI. Frequencies and Percentages by gender (5 pts.)

LeBlanc
COM 5023 (Spring 2010), page 9
Assignment 3Associational Hypotheses
Objective: To distinguish associational type hypotheses in the research literature.
Directions: Find five examples of hypotheses which associate continuous variables in theresearch literature. For each of the hypotheses found, list the relevant findings as published intheir corresponding articles.
1) Type the hypothesis as stated in the article. Give the hypothesis number and pagenumber of the hypothesis (in parentheses following the hypothesis).
2) Type the major finding associated with each hypothesis. Type the finding in twoforms: Paraphrase and direct quote, according to APA citation style. The direct quoteshould contain the statistics in proper format (see below).
3) Give the full bibliographic reference for the hypothesis.
Note: The major findings for each hypothesis should be specified in the Results section of anempirical article. It is possible to locate more than one hypothesis of the type required for thisassignment in a single article. You do not need necessarily to find five articles. However, for eachhypothesis found, complete numbers 1 - 3 above before going to the next hypothesis.
Simple association of continuous variables can be accomplished with a Pearson’s product-moment correlation test. Predicted association (causal) of continuous variables can beaccomplished with a linear regression or multiple regression depending on the number ofdependent variables. The statistical format of the Pearson correlation is r = .43, N = 213, p < .05.A regression should report R2, Adj. R2, R2Δ, or β (depending on the type), as well as otherstatistics including a report of significance in the form: p < .05.
Submit your homework electronically as per in class and Blackboard instructions.
Evaluation of the Associational Hypotheses assignment will be based on the following criteria:
I. Hypotheses (3 pts. for each)II. Major findings
A. Paraphrase (1 pt. for each)B. Direct quote (2 pts. for each)C. APA citation and statistical format style (5 pts.)
III. ReferencesA. Typed reference for each hypothesis (2 pts. for each)B. APA reference style (5 pts.)

LeBlanc
COM 5023 (Spring 2010), page 10
Assignment 4Pearson Product-moment Correlation
Objective: To compute a correlation coefficient using Pearson’s Product-Moment test.
Directions: Your instructor will provide you with an SPSS or JMP 8 data file. Examine the datafile to determine which variables are measured continuously. You will conduct a series ofstatistical tests in SPSS or JMP 8 and report the findings in a Word document to be submittedelectronically.
1) Find a variable which is measured on a continuous scale.
2) Find another continuous variable which may be treated as a dependent.
3) Suggest a research question to be tested for the variables selected in 1 and 2 above.
4) Choose and run the appropriate test for the research question.
5) Report the findings in paragraph form, in a Word document.
Note: This assignment will have to be accomplished in a computer lab on campus.
Evaluation of the Pearson Correlation assignment will be based on the following criteria:
I. Appropriately selected independent variable (5 pts.)II. Appropriately selected dependent variable (5 pts.)III. Appropriately devised Research Question or Hypothesis (10 pts.)IV. Appropriately selected statistical tests
A. Tests with appropriate variables (10 pts.)B. Appropriate options selected (5 pts.)
V. Output formatA. Statement of findings (10 pts.)B. Correct APA style (5 pts.)

LeBlanc
COM 5023 (Spring 2010), page 11
Assignment 5Comparative Hypotheses
Objective: To distinguish comparative type hypotheses in the research literature.
Directions: Find five examples of directional hypotheses comparing groups or conditions in theresearch literature. For each of the hypotheses found, list the relevant findings as published intheir corresponding articles.
1) Type the hypothesis as stated in the article. Give the hypothesis number and pagenumber of the hypothesis (in parentheses following the hypothesis).
2) Type the major finding associated with each hypothesis. Type the finding in twoforms: Paraphrase and direct quote, according to APA citation style. The direct quoteshould contain the statistics in proper format (see below).
3) Give the full bibliographic reference for the hypothesis.
Note: The major findings for each hypothesis should be specified in the Results section of anempirical article. It is possible to locate more than one hypothesis of the type required for thisassignment in a single article. You do not need necessarily to find five articles. However, for eachhypothesis found, complete numbers 1 - 3 above before going to the next hypothesis.
Comparison of means between two groups or two conditions can be accomplished with aStudent's t, with an ANOVA, or with a Chi-Square test. Comparison of means or variancesbetween more than two groups could be accomplished with some variant of the ANOVA. Thestatistical format of t-test results are usually reported in this form: t(234) = 4.32, p = .014.ANOVA is a little more complicated depending on whether it is simple oneway, factorial, ormultivariate. What you will look for, however, is something like: F(2,368) = 5.53, p = .023.Comparison of frequencies between two or more groups or conditions is typically accomplishedwith a Chi-Square test. The statistical format of the Chi-Square test results are usually reportedin this form: χ2(3, N = 48) = 23.14, p < .05.
Submit your homework electronically as per in class and Blackboard instructions.
Evaluation of the Comparative Hypotheses assignment will be based on the following criteria:
I. Hypotheses (3 pts. for each)II. Major findings
A. Paraphrase (1 pt. for each)B. Direct quote (2 pts. for each)C. APA citation and statistical format style (5 pts.)
III. ReferencesA. Typed reference for each hypothesis (2 pts. for each)B. APA reference style (5 pts.)
LeBlanc
COM 5023 (Spring 2010), page 12
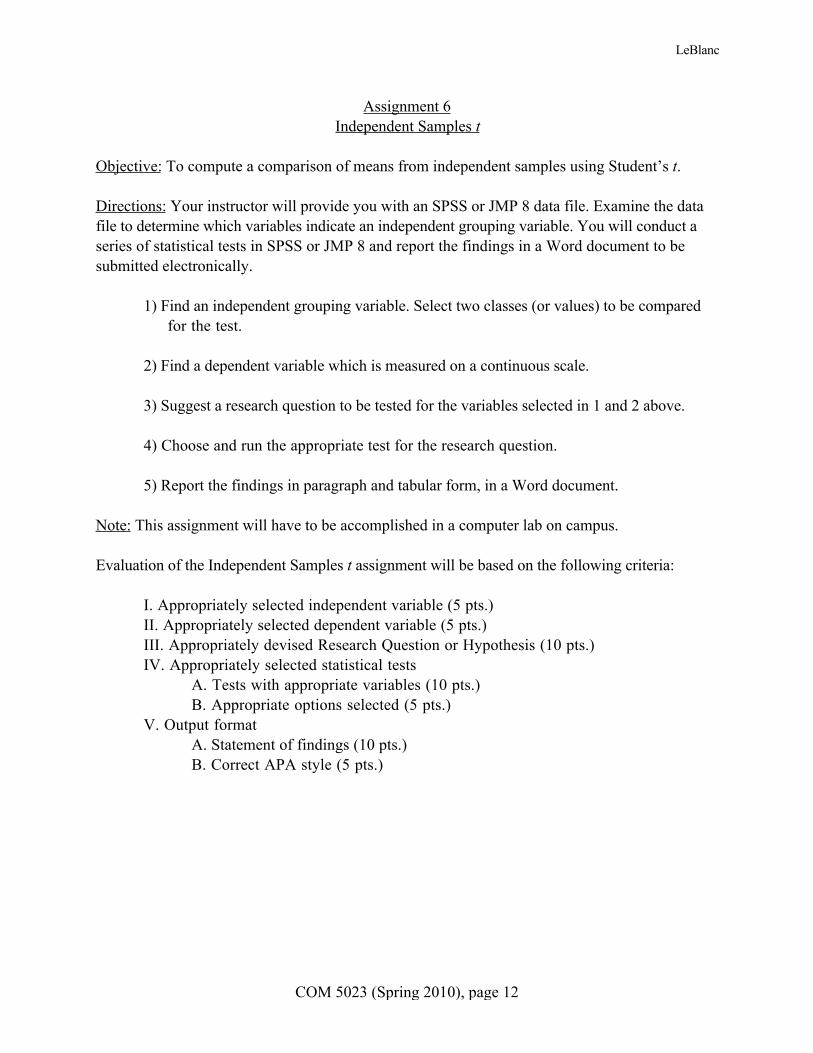
Assignment 6Independent Samples t
Objective: To compute a comparison of means from independent samples using Student’s t.
Directions: Your instructor will provide you with an SPSS or JMP 8 data file. Examine the datafile to determine which variables indicate an independent grouping variable. You will conduct aseries of statistical tests in SPSS or JMP 8 and report the findings in a Word document to besubmitted electronically.
1) Find an independent grouping variable. Select two classes (or values) to be comparedfor the test.
2) Find a dependent variable which is measured on a continuous scale.
3) Suggest a research question to be tested for the variables selected in 1 and 2 above.
4) Choose and run the appropriate test for the research question.
5) Report the findings in paragraph and tabular form, in a Word document.
Note: This assignment will have to be accomplished in a computer lab on campus.
Evaluation of the Independent Samples t assignment will be based on the following criteria:
I. Appropriately selected independent variable (5 pts.)II. Appropriately selected dependent variable (5 pts.)III. Appropriately devised Research Question or Hypothesis (10 pts.)IV. Appropriately selected statistical tests
A. Tests with appropriate variables (10 pts.)B. Appropriate options selected (5 pts.)
V. Output formatA. Statement of findings (10 pts.)B. Correct APA style (5 pts.)

LeBlanc
COM 5023 (Spring 2010), page 13
Assignment 7One-way ANOVA
Objective: To compute a comparison of means from more than two independent samples using aOne-way ANOVA.
Directions: Your instructor will provide you with an SPSS or JMP 8 data file. Examine the datafile to determine which variables indicate an independent grouping variable. You will conduct aseries of statistical tests in SPSS or JMP 8 and report the findings in a Word document to besubmitted electronically.
1) Find an independent grouping variable. Select at least three classes (or values) to becompared for the test.
2) Find a dependent variable which is measured on a continuous scale.
3) Suggest a research question to be tested for the variables selected in 1 and 2 above.
4) Choose and run the appropriate test for the research question.
5) Report the findings in paragraph and tabular form, in a Word document.
Note: This assignment will have to be accomplished in a computer lab on campus.
Evaluation of the One-way ANOVA assignment will be based on the following criteria:
I. Appropriately selected independent variable (5 pts.)II. Appropriately selected dependent variable (5 pts.)III. Appropriately devised Research Question or Hypothesis (10 pts.)IV. Appropriately selected statistical tests
A. Tests with appropriate variables (10 pts.)B. Appropriate options selected (5 pts.)
V. Output formatA. Statement of findings (10 pts.)B. Correct APA style (5 pts.)

LeBlanc
COM 5023 (Spring 2010), page 14
Assignment 8Factorial ANOVA
Objective: To compute a comparison of means from independent samples with more than onegrouping variable using a Factorial ANOVA.
Directions: Your instructor will provide you with an SPSS or JMP 8 data file. Examine the datafile to determine which variables indicate independent grouping variables. You will conduct aseries of statistical tests in SPSS or JMP 8 and report the findings in a Word document to besubmitted electronically.
1) Find two independent grouping variables. Select at least two classes (or values) to becompared for the test for each of the independent variables.
2) Find a dependent variable which is measured on a continuous scale.
3) Suggest a research question to be tested for the variables selected in 1 and 2 above.
4) Choose and run the appropriate test for the research question.
5) Report the findings in paragaph and tabular form, in a Word document.
6) Note which effect, Main or Interaction, has the greatest influence, if any, on thedependent variable.
Note: This assignment will have to be accomplished in a computer lab on campus.
Evaluation of the Factorial ANOVA assignment will be based on the following criteria:
I. Appropriately selected independent variables (5 pts.)II. Appropriately selected dependent variable (5 pts.)III. Appropriately devised Research Question or Hypothesis (10 pts.)IV. Appropriately selected statistical tests
A. Tests with appropriate variables (10 pts.)B. Appropriate options selected (5 pts.)
V. Output formatA. Statement of findings (10 pts.)B. Correct APA style (5 pts.)

LeBlanc
COM 5023 (Spring 2010), page 15
Assignment 9Chi-Square
Objective: To compute a comparison of frequencies from independent samples using a Chi-Square test.
Directions: Your instructor will provide you with an SPSS or JMP 8 data file. Examine the datafile to determine which variables indicate independent grouping variables. You will conduct aseries of statistical tests in SPSS or JMP 8 and report the findings in a Word document to besubmitted electronically.
1) Find an independent grouping (nominal level) variable.
2) Find a dependent variable which is measured nominally.
3) Suggest a research question to be tested for the variables selected in 1 and 2 above.
4) Choose and run the appropriate test for the research question. Be sure to select ameasure of effect size and the appropriate options for contingency table output.
5) Report the findings in paragraph amd tabular form, in a Word document, followingAPA rules.
Note: This assignment will have to be accomplished in a computer lab on campus.
Evaluation of the Chi-Square assignment will be based on the following criteria:
I. Appropriately selected independent variable (5 pts.)II. Appropriately selected dependent variable (5 pts.)III. Appropriately devised Research Question or Hypothesis (10 pts.)IV. Appropriately selected statistical tests
A. Tests with appropriate variables (10 pts.)B. Appropriate options selected (5 pts.)
V. Output formatA. Statement of findings (10 pts.)B. Correct APA style (5 pts.)

LeBlanc
COM 5023 (Spring 2010), page 16
Assignment 10Ordinal Non-parametric Tests
Objective: To compute a comparison of ranks from independent samples using an Ordinal-leveldata appropriate non-parametric test.
Directions: Your instructor will provide you with an SPSS or JMP 8 data file. Examine the datafile to determine which variables indicate independent grouping variables. You will conduct aseries of statistical tests in SPSS or JMP 8 and report the findings in a Word document to besubmitted electronically.
1) Find an independent grouping (nominal level) variable.
2) Find a dependent variable which is measured ordinally.
3) Suggest a research question to be tested for the variables selected in 1 and 2 above.
4) Choose and run the appropriate test for the research question. Be sure to select ameasure of effect size and the appropriate options for contingency table output.
5) Report the findings in paragraph and tabular form, in a Word document, followingAPA rules.
Note: This assignment will have to be accomplished in a computer lab on campus.
Evaluation of the Ordinal Non-Par Tests assignment will be based on the following criteria:
I. Appropriately selected independent variable (5 pts.)II. Appropriately selected dependent variable (5 pts.)III. Appropriately devised Research Question or Hypothesis (10 pts.)IV. Appropriately selected statistical tests
A. Tests with appropriate variables (10 pts.)B. Appropriate options selected (5 pts.)
V. Output formatA. Statement of findings (10 pts.)B. Correct APA style (5 pts.)

LeBlanc
COM 5023 (Spring 2010), page 17
LIST OF COMMUNICATION RESEARCH JOURNALS
Journals Library LocationCommunication Education PN 4071 S74Communication Monographs PN 4077 S6Communication Quarterly PN 4071 T6Communication Reports P87.C58 (Trinity University)Communication ResearchCommunication Research ReportsCommunication Studies (formerly Central States Speech Journal) PN 4001 C45Communication TheoryDiscourse Processes P 302 D55Human Communication Research P 91.3 H85Journal of Applied Communication Research HM 258 J67Journal of Communication P 87.J6Journal of Nonverbal BehaviorQuarterly Journal of Speech PN 4071 Q3Research on Language and Social Interaction P 1.P36Southern (Speech) Communication Journal PN 4071.S65Western Journal of (Speech) Communication PN 4071.W45
Related JournalsAmerican Sociological ReviewChild DevelopmentDevelopmental PsychologyFamily RelationsFamily ProcessJournal of AdolescenceJournal of Applied Social PsychologyJournal of Early AdolescenceJournal of Family IssuesJournal of Marriage and the FamilyJournal of Personality and Social PsychologyJournal of Social IssuesJournal of Social and Personal RelationshipsJournal of Youth and AdolescenceResearch in Sociology of Education and SocializationSmall Group ResearchSocial Psychology Quarterly
Abstracts (Reference)Communication Abstracts P 87.C59733Psychological Abstracts BF 1.P65Sociological Abstracts HM 1.S67

LeBlanc
COM 5023 (Spring 2010), page 18
REFERENCES
American Psychological Association. (2001). Publication manual of the American Psychological
Association (5th ed.). Washington, DC: Author.
Andrews, F. M., Klem, L., Davidson, T. N., O’Malley, P. M., & Rodgers, W. L. (1981). A guide
for selecting statistical techniques for analyzing social science data (2nd ed.). Ann Arbor,
MI: The University of Michigan: Institute for Social Research.
Blalock, H. M., Jr. (1979). Social statistics (Rev. 2nd ed.). New Yor: McGraw-Hill.
Child, D. (1970). The essentials of factor analysis. London: Holt, Rinehart, and Winston.
Christensen, L. B., & Stoup, C. M. (1991). Introduction to statistics for the social and behvioral
sciences (2nd ed.). Pacific Grove, CA: Brooks/Cole.
Cooley, W. W., & Lohnes, P. R. (1971). Multivariate data analysis. New York: John Wiley &
Sons.
Coolidge, F. L. (2006). Statistics: A gentle introduction. Thousand Oaks, CA: Sage.
Edwards, A. L. (1984). An introduction to linear regression and correlation (2nd ed.). New York:
W. H. Freeman.
Edwards, A. L. (1985). Multiple regresion and the analysis of variance and covariance (2nd ed.).
New York: W. H. Freeman.
Glass, G. V., & Stanley, J. C. (1970). Statistical methods in education and psychology. Englewood
Cliffs, NJ: Prentice-Hall.
Kirkpatrick, L. A., & Feeney, B. C. (2003). A simple guide to SPSS for Windows: For versions
8.0, 9.0, 10.0, & 11.0 (rev. ed.). Belmont, CA: Thomson/Wadsworth.

LeBlanc
COM 5023 (Spring 2010), page 19
Mertler, C. A., & Vannatta, R. A. (2002). Advanced and multivariate statistical methods:
Practical application and interpretation (2nd ed.). Los Angeles: Pyrczak.
Norusis, M. J. (2005). SPSS 13.0 statistical procedures companion. Upper Saddle River, NJ:
Prentice-Hall.
Ray, W. J. (1997). Methods: Toward a science of behavior and experience (5th ed.). Pacific
Grove, CA: Brooks/Cole.
Reinard, J. C. (2006). Communication research statistics. Thousand Oaks, CA: Sage.
Rubin, R. B., Rubin, A. M., & Piele, L. J. (2006). Communication research - Strategies and
sources (6th ed.). Belmont, CA: Thomson Wadsworth.
Smith, M. J. (1988). Contemporary communication research methods. Belmont, CA:
Wadsworth.
Vogt, W. P. (2005). Dictionary of statistics and methodology: A nontechnical guide for the social
sciences (3rd ed.). Thousand Oaks, CA: Sage.
Vogt, W. P. (2007). Quantitative research methods for profesionals. Boston: Pearson Education.