Embed Size (px)
Citation preview

32 California Agricultural Resource Directory 2008–2009
County Statistical Data
California’s counties reported an increase of 15 percent in the value of their agricultural
production for 2007. Fourteen counties reported a value of production in excess of $1.1 billion. Fresno continued as the leading county with an agricultural production value of $5.34 billion, an increase of 10.4 percent over 2006. Tulare County was second in value of production with $4.87 billion, a 25.9 percent increase from 2006. Kern had an increase of 22.7 percent in production to $4.09 billion, moving the county to third in value. Monterey’s smaller increase of 9.5 percent to $3.82 billion in agricultural produc-tion dropped the county to fourth in value.
Notes to the Agricultural Commissioners’ DataThe gross value of production published in this report includes all farm production, whether sold into usual marketing channels or used on the farm where produced. Values placed on pasture and range feed are included and fresh fruit and vegetable crop values are based on the free-on-board (f.o.b.) packed price.
Values are recorded for all products grown during the calendar year, regardless of when they are marketed. The county agricultural commissioners’ reports also provide statistics on a broader range of commodities than estimates prepared by other agencies. Because of these concepts, the state total for gross dollar values summarized in this report differs from the cash receipts to farmers estimated by USDA’s National Agricultural Statistics Service, California Field Office. The larger total value reported by the agricultural commissioners results from the different definitions used in estimating total value of produc-tion rather than cash receipts to producers. Some counties are now including timber as a part of their crop report, following the pattern set by the California Agricultural Commissioners and Sealers Association. Since it is not comparable to earlier county summaries, timber has not been made a part of the main tables of this report. The total value reported by the counties, including timber, is 0.2 percent more than the $43.9 billion recorded in the table “County Rank by Gross Value of Agricultural Production, 2006-2007” on page 34.
Notable Changes in County Ranks and Percentages of the State Total, 2007
Rank Commodity Changes in County Rankings
1 Milk and Cream Tulare leads with nearly 26 percent of the state total2 Grapes, All Fresno leads, followed closely by Kern and Tulare3 Nursery Products San Diego continues to lead with more than 20 percent of the total4 Cattle and Calves Tulare is No. 1, followed by Fresno and Imperial5 Almonds Fresno leads with 18 percent, followed by Stanislaus6 Lettuce Monterey still leads with 63 percent of the state total7 Strawberries Monterey and Ventura lead with nearly 60 percent of the total8 Alfalfa Hay Kern leads the way, followed by Tulare and Imperial9 Oranges Tulare leads with 48 percent of the total, followed by Kern10 Chickens Fresno and Merced lead the state with more than 70 percent11 Tomatoes, Processing Fresno leads with nearly 41 percent, followed by Yolo and San Joaquin12 Walnuts, English San Joaquin leads, followed closely by Tulare and Stanislaus13 Flowers and Foliage San Diego has more than 50 percent of the total14 Rice (Excl. seed) Colusa leads with more than 28 percent, followed by Butte15 Silage, All Tulare leads with 31 percent, followed by Merced and Stanislaus
County Statistical Data

California Agricultural Resource Directory 2008–2009 33
County Statistical DataCounty Statistical Data
California Timber IndustryCalifornia has more forestland than any state, except Alaska. Nearly two billion board feet (equivalent to 132,000 homes) of commercial lumber are produced from California’s private and public timberlands each year, making the Golden State the third largest producer of wood products in the nation. California’s abundant forests could provide nearly 100 percent of the state’s demand for wood.
County Agricultural Commissioners’ ReportsCopies of individual county agricultural commis-sioners’ reports may be requested or obtained directly from each county agricultural commissioner’s office. For your convenience, a listing is included in the phone directory section of this publication. Many of the counties also publish these reports on their Web sites. USDA’s National Agricultural Statistics Service, California Field Office publications are available free-of-charge at www.nass.usda.gov/ca.
Phot
o by
Ed
Will
iam
s
California’s Leading Timber Counties, 2007 1
Timber Rank County Timber Volume Total Agricultural Value (Including Timber)
Timber Value Timber Percentage of Total Agricultural Value
Million Bd. Ft. $1,000 $1,000 Percent
1 Humboldt 296,840 270,269 147,114 54.42 Siskiyou 246,141 235,848 59,344 25.23 Shasta 191,618 141,949 43,949 31.04 Mendocino 103,031 171,854 43,648 25.45 Plumas 136,521 49,170 28,070 57.1
1 Timber volume and timber value data are from the State Board of Equalization, Timber Tax Division.

34 California Agricultural Resource Directory 2008–2009
County Statistical Data
1 Totals vary slightly from totals published by counties due to classification differences between county and state reports.2 Three county agricultural commissioners’ reports were not available at publication. The last years available were used for this report: Trinity County (2003), Humboldt and Tuolumne counties (2006).
Source: County agricultural commissioners’ reports and State Board of Equalization, Timber Tax Division
County Rank by Gross Value of Agricultural Production, 2006–2007 1
County 2 ––––––––––––––– Rank Without Timber ––––––––––––––– ––––––––––––––––– Rank With Timber –––––––––––––––––
2006 2007 PercentChange
Timber Value
2006 2007 Percent Change
$1,000 $1,000 $1,000 $1,000 $1,000
Fresno 4,843,392 (1) 5,345,352 (1) 10.4 2,735 4,845,438 (1) 5,348,087 (1) 10.4Tulare 3,870,843 (2) 4,873,743 (2) 25.9 296 3,872,062 (2) 4,874,039 (2) 25.9Kern 3,335,910 (4) 4,092,107 (3) 22.7 482 3,335,969 (4) 4,092,589 (3) 22.7Monterey 3,490,076 (3) 3,823,287 (4) 9.5 3 3,490,076 (3) 3,823,290 (4) 9.5Merced 2,284,457 (5) 3,001,667 (5) 31.4 7 2,284,463 (5) 3,001,674 (5) 31.4Stanislaus 2,148,152 (6) 2,412,339 (6) 12.3 0 2,148,152 (6) 2,412,339 (6) 12.3San Joaquin 1,684,275 (7) 2,005,185 (7) 19.1 6 1,684,283 (7) 2,005,191 (7) 19.1Kings 1,289,186 (11) 1,761,852 (8) 36.7 0 1,289,186 (11) 1,761,852 (8) 36.7Ventura 1,505,588 (8) 1,547,263 (9) 2.8 17 1,505,604 (8) 1,547,280 (9) 2.8San Diego 1,461,476 (9) 1,536,260 (10) 5.1 9 1,461,485 (9) 1,536,269 (10) 5.1Imperial 1,307,615 (10) 1,369,147 (11) 4.7 0 1,307,615 (10) 1,369,147 (11) 4.7Riverside 1,102,438 (12) 1,257,520 (12) 14.1 0 1,102,445 (12) 1,257,520 (12) 14.1Madera 1,032,500 (13) 1,219,297 (13) 18.1 987 1,032,902 (13) 1,220,284 (13) 18.1Santa Barbara 1,016,735 (14) 1,103,323 (14) 8.5 0 1,016,735 (14) 1,103,323 (14) 8.5San Luis Obispo 630,614 (15) 653,870 (15) 3.7 12 630,625 (15) 653,882 (15) 3.7Sonoma 593,905 (16) 639,056 (16) 7.6 5,498 600,229 (16) 644,554 (16) 7.4San Bernardino 436,400 (18) 572,167 (17) 31.1 0 436,400 (19) 572,167 (17) 31.1Glenn 375,126 (22) 493,504 (18) 31.6 380 375,126 (22) 493,884 (19) 31.7Butte 434,550 (19) 490,784 (19) 12.9 16,550 454,203 (18) 507,334 (18) 11.7Santa Cruz 407,928 (21) 485,127 (20) 18.9 6,413 414,267 (21) 491,540 (20) 18.7Napa 477,760 (17) 484,729 (21) 1.5 17 477,787 (17) 484,746 (21) 1.5Colusa 422,697 (20) 484,525 (22) 14.6 0 422,697 (20) 484,525 (22) 14.6Yolo 370,196 (23) 453,539 (23) 22.5 0 370,196 (23) 453,539 (23) 22.5Sutter 358,845 (24) 377,941 (24) 5.3 0 358,845 (24) 377,941 (24) 5.3Sacramento 306,487 (25) 364,859 (25) 19.0 27 306,521 (25) 364,886 (25) 19.0San Benito 270,940 (27) 293,090 (26) 8.2 0 270,940 (28) 293,090 (26) 8.2Solano 233,406 (30) 268,255 (27) 14.9 16 233,406 (31) 268,271 (28) 14.9Orange 287,881 (26) 255,216 (28) -11.3 25 287,907 (27) 255,241 (29) -11.3Santa Clara 243,231 (29) 254,482 (29) 4.6 444 244,461 (30) 254,926 (30) 4.3Los Angeles 270,915 (28) 253,388 (30) -6.5 0 270,915 (29) 253,388 (31) -6.5Tehama 162,749 (33) 190,737 (31) 17.2 12,976 177,597 (34) 203,713 (33) 14.7Siskiyou 170,046 (31) 176,504 (32) 3.8 59,344 217,971 (32) 235,848 (32) 8.2San Mateo 164,478 (32) 168,751 (33) 2.6 4,118 168,523 (35) 172,869 (34) 2.6Yuba 158,282 (34) 148,350 (34) -6.3 5,014 163,119 (36) 153,364 (36) -6.0Mendocino 137,239 (35) 128,206 (35) -6.6 43,648 190,618 (33) 171,854 (35) -9.8Humboldt 123,155 (36) 123,155 (36) 0.0 147,114 294,783 (26) 270,269 (27) -8.3Shasta 89,499 (37) 98,000 (37) 9.5 43,949 139,960 (37) 141,949 (37) 1.4Modoc 85,950 (38) 91,807 (38) 6.8 5,329 91,344 (38) 97,136 (38) 6.3Contra Costa 83,426 (39) 76,641 (39) -8.1 7 83,436 (39) 76,648 (39) -8.1Lake 68,427 (40) 71,868 (40) 5.0 803 68,766 (41) 72,671 (40) 5.7Marin 49,437 (43) 67,133 (41) 35.8 0 49,437 (45) 67,133 (41) 35.8Lassen 59,148 (41) 59,565 (42) 0.7 5,468 72,484 (40) 65,033 (42) -10.3Placer 52,115 (42) 52,381 (43) 0.5 7,348 63,698 (42) 59,729 (43) -6.2Del Norte 47,104 (44) 46,628 (44) -1.0 5,671 54,552 (43) 52,299 (45) -4.1Alameda 43,414 (45) 42,441 (45) -2.2 11 43,424 (47) 42,452 (47) -2.2Mono 29,311 (48) 36,887 (46) 25.8 38 29,336 (50) 36,925 (48) 25.9El Dorado 29,327 (47) 34,643 (47) 18.1 18,521 52,174 (44) 53,164 (44) 1.9Amador 29,757 (46) 28,433 (48) -4.4 4642 32,557 (49) 33,075 (50) 1.6Mariposa 27,660 (49) 28,247 (49) 2.1 922 28,812 (51) 29,169 (51) 1.2Tuolumne 26,380 (50) 26,380 (50) 0.0 9,249 37,864 (48) 35,629 (49) -5.9Plumas 20,300 (51) 21,100 (51) 3.9 28,070 49,112 (46) 49,170 (46) 0.1Inyo 18,026 (52) 19,980 (52) 10.8 0 18,026 (54) 19,980 (53) 10.8Calaveras 16,411 (53) 15,414 (53) -6.1 4,907 25,246 (52) 20,321 (52) -19.5Nevada 8,938 (54) 9,566 (54) 7.0 6,744 16,260 (55) 16,310 (55) 0.3Sierra 6,419 (55) 6,514 (55) 1.5 9,437 11,661 (56) 15,951 (56) 36.8Alpine 4,887 (56) 4,723 (56) -3.4 0 4,890 (57) 4,723 (57) -3.4Trinity 2,320 (58) 2,320 (57) 0.0 17,143 25,246 (52) 19,463 (54) -22.9San Francisco 3,141 (57) 1,589 (58) -49.4 0 3,141 (58) 1,589 (58) -49.4
Total 38,210,870 43,950,837 15.0 474,397 38,744,977 44,425,234 14.7
California Agricultural Resource Directory 2008–2009 35
County Statistical Data
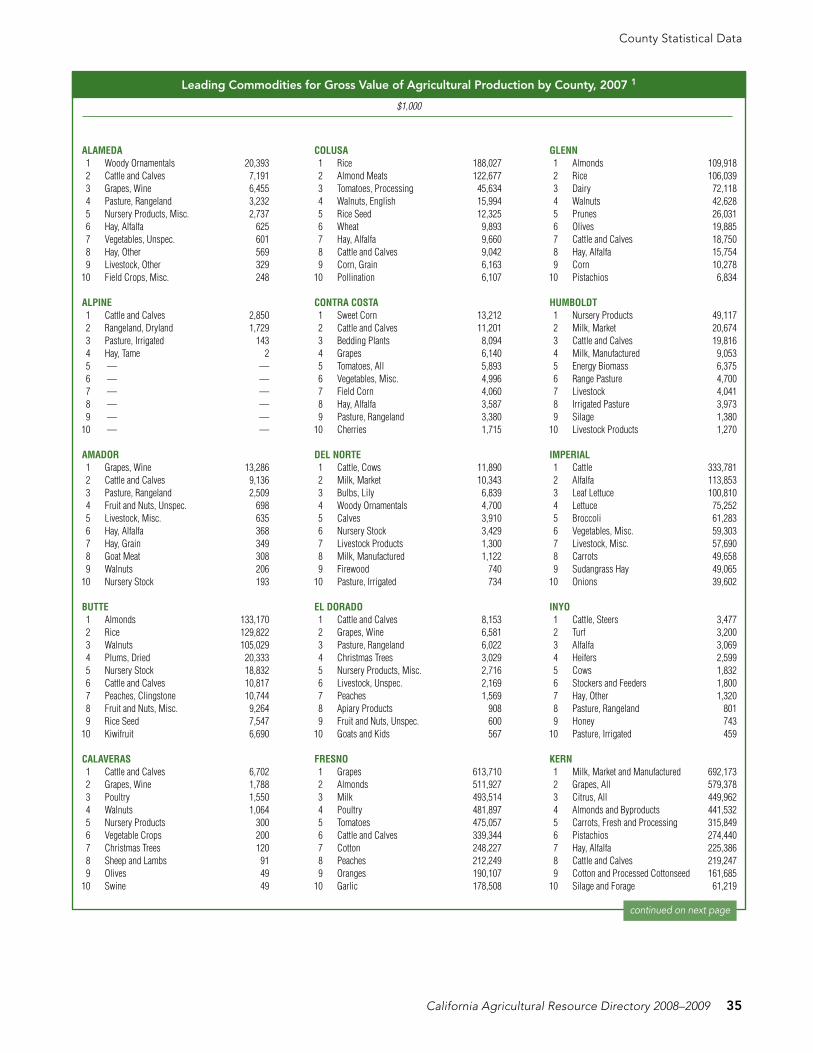
Leading Commodities for Gross Value of Agricultural Production by County, 2007 1
$1,000
ALAMEDA1 Woody Ornamentals 20,3932 Cattle and Calves 7,1913 Grapes, Wine 6,4554 Pasture, Rangeland 3,2325 Nursery Products, Misc. 2,7376 Hay, Alfalfa 6257 Vegetables, Unspec. 6018 Hay, Other 5699 Livestock, Other 329
10 Field Crops, Misc. 248
ALPINE1 Cattle and Calves 2,8502 Rangeland, Dryland 1,7293 Pasture, Irrigated 1434 Hay, Tame 25 — —6 — —7 — —8 — —9 — —
10 — —
AMADOR1 Grapes, Wine 13,2862 Cattle and Calves 9,1363 Pasture, Rangeland 2,5094 Fruit and Nuts, Unspec. 6985 Livestock, Misc. 6356 Hay, Alfalfa 3687 Hay, Grain 3498 Goat Meat 3089 Walnuts 206
10 Nursery Stock 193
BUTTE1 Almonds 133,1702 Rice 129,8223 Walnuts 105,0294 Plums, Dried 20,3335 Nursery Stock 18,8326 Cattle and Calves 10,8177 Peaches, Clingstone 10,7448 Fruit and Nuts, Misc. 9,2649 Rice Seed 7,547
10 Kiwifruit 6,690
CALAVERAS1 Cattle and Calves 6,7022 Grapes, Wine 1,7883 Poultry 1,5504 Walnuts 1,0645 Nursery Products 3006 Vegetable Crops 2007 Christmas Trees 1208 Sheep and Lambs 919 Olives 49
10 Swine 49
COLUSA1 Rice 188,0272 Almond Meats 122,6773 Tomatoes, Processing 45,6344 Walnuts, English 15,9945 Rice Seed 12,3256 Wheat 9,8937 Hay, Alfalfa 9,6608 Cattle and Calves 9,0429 Corn, Grain 6,163
10 Pollination 6,107
CONTRA COSTA1 Sweet Corn 13,2122 Cattle and Calves 11,2013 Bedding Plants 8,0944 Grapes 6,1405 Tomatoes, All 5,8936 Vegetables, Misc. 4,9967 Field Corn 4,0608 Hay, Alfalfa 3,5879 Pasture, Rangeland 3,380
10 Cherries 1,715
DEL NORTE1 Cattle, Cows 11,8902 Milk, Market 10,3433 Bulbs, Lily 6,8394 Woody Ornamentals 4,7005 Calves 3,9106 Nursery Stock 3,4297 Livestock Products 1,3008 Milk, Manufactured 1,1229 Firewood 740
10 Pasture, Irrigated 734
EL DORADO1 Cattle and Calves 8,1532 Grapes, Wine 6,5813 Pasture, Rangeland 6,0224 Christmas Trees 3,0295 Nursery Products, Misc. 2,7166 Livestock, Unspec. 2,1697 Peaches 1,5698 Apiary Products 9089 Fruit and Nuts, Unspec. 600
10 Goats and Kids 567
FRESNO1 Grapes 613,7102 Almonds 511,9273 Milk 493,5144 Poultry 481,8975 Tomatoes 475,0576 Cattle and Calves 339,3447 Cotton 248,2278 Peaches 212,2499 Oranges 190,107
10 Garlic 178,508
GLENN1 Almonds 109,9182 Rice 106,0393 Dairy 72,1184 Walnuts 42,6285 Prunes 26,0316 Olives 19,8857 Cattle and Calves 18,7508 Hay, Alfalfa 15,7549 Corn 10,278
10 Pistachios 6,834
HUMBOLDT1 Nursery Products 49,1172 Milk, Market 20,6743 Cattle and Calves 19,8164 Milk, Manufactured 9,0535 Energy Biomass 6,3756 Range Pasture 4,7007 Livestock 4,0418 Irrigated Pasture 3,9739 Silage 1,380
10 Livestock Products 1,270
IMPERIAL1 Cattle 333,7812 Alfalfa 113,8533 Leaf Lettuce 100,8104 Lettuce 75,2525 Broccoli 61,2836 Vegetables, Misc. 59,3037 Livestock, Misc. 57,6908 Carrots 49,6589 Sudangrass Hay 49,065
10 Onions 39,602
INYO1 Cattle, Steers 3,4772 Turf 3,2003 Alfalfa 3,0694 Heifers 2,5995 Cows 1,8326 Stockers and Feeders 1,8007 Hay, Other 1,3208 Pasture, Rangeland 8019 Honey 743
10 Pasture, Irrigated 459
KERN1 Milk, Market and Manufactured 692,1732 Grapes, All 579,3783 Citrus, All 449,9624 Almonds and Byproducts 441,5325 Carrots, Fresh and Processing 315,8496 Pistachios 274,4407 Hay, Alfalfa 225,3868 Cattle and Calves 219,2479 Cotton and Processed Cottonseed 161,685
10 Silage and Forage 61,219
continued on next page

36 California Agricultural Resource Directory 2008–2009
County Statistical Data
Leading Commodities for Gross Value of Agricultural Production by County, 2004a
$1,000
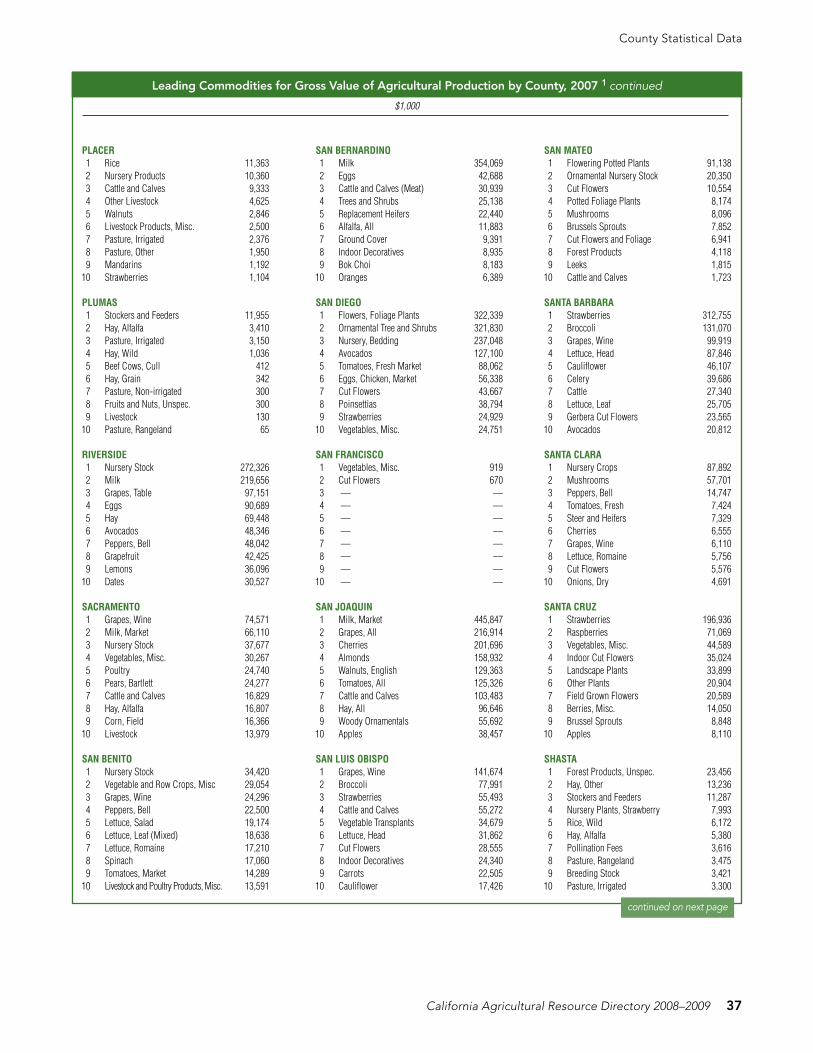
Leading Commodities for Gross Value of Agricultural Production by County, 2007 1 continued
KINGS1 Milk 692,1852 Cotton 234,8363 Cattle and Calves 161,2964 Alfalfa 85,5935 Pistachios 78,8106 Tomatoes, Processing 70,4987 Corn Silage 49,2738 Almonds 48,2209 Walnuts 46,033
10 Peaches 41,199
LAKE1 Grapes, Wine 43,4492 Pears, Bartlett 12,5043 Nursery Products 5,1124 Walnuts 4,0325 Cattle and Calves 2,4666 Field Crops, Misc. 1,6367 Pears, Asian 8598 Pears, Unspec. 6129 Pasture, Rangeland 450
10 Vegetables, Misc. 236
LASSEN1 Hay, All 32,2772 Livestock 13,6433 Strawberry Plants 5,3594 Pastureland 3,7635 Mint 1,2326 Nursery Field Crops, Misc. 1,0007 Wild Rice 6248 Wheat 4639 Aftermath 460
10 — —
LOS ANGELES1 Ornamental Tree and Shrubs 104,6812 Bedding Plants 43,1443 Vegetables, Root 27,7074 Orchard Fruit 16,4755 Hay, Alfalfa 9,2866 Dairy and Livestock 8,5137 Indoor Plants, Flowering 4,4258 Indoor Plants, Foliage 4,2849 Grapes 4,136
10 Strawberries 3,008
MADERA1 Milk, Market 287,5432 Almonds 233,1543 Grapes, Wine 117,0424 Pistachios 83,4555 Grapes, Raisin 65,4586 Replacement Heifers 54,1627 Grapes, Table 42,3688 Alfalfa Hay 41,3649 Cattle and Calves 40,399
10 Nursery Stock 34,866
MARIN1 Milk, Market 38,9232 Cattle and Calves 7,8293 Poultry 6,7604 Pasture, Rangeland 5,2215 Aquaculture 2,6336 Fruits and Vegetables, Misc. 1,8107 Sheep and Lambs 1,1498 Silage 8249 Grapes, Wine 756
10 Nursey Stock 643
MARIPOSA1 Cattle and Calves 17,7302 Rangeland 6,2193 Poultry, All 1,5714 Livestock and Poultry Products, Misc. 1,5515 Forest Products 9726 Fruits and Nuts, Misc. 2567 Livestock, Misc. 2328 Sheep and Lambs 1809 Grapes, Wine 140
10 Field Crops, Misc. 119
MENDOCINO1 Grapes, Wine 75,3482 Pears, Bartlett 14,0503 Cattle and Calves 6,3434 Milk 4,6195 Pasture 3,6466 Nursery 3,5847 Range 1,7458 Pears, Bosc 1,4689 Apples 1,420
10 Pears, Red 1,409
MERCED1 Milk, Market and Manufactured 1,049,0522 Chickens, Fryers and Others 326,0463 Almonds (Kernel Basis) 311,3104 Cattle and Calves 236,3395 Tomatoes, Market and Processing 144,0506 Sweet Potatoes 130,1107 Eggs, Chicken (Market) 124,9988 Hay, Alfalfa 110,8229 Corn, Silage 76,951
10 Turkeys 62,451
MODOC1 Hay, Alfalfa 25,5992 Cattle and Calves 19,5843 Potatoes 12,2424 Vegetables, Misc. 6,8445 Wheat 4,9156 Onions 4,8807 Pasture, Irrigated 4,5008 Hay, Grain 3,5369 Pasture, Rangeland 3,360
10 Hay, Wild 3,150
MONO1 Alfalfa 11,3442 Stockers and Feeders 8,0003 Steers 4,7204 Heifers 3,6385 Hay, Other 3,3006 Cows 2,0727 Sheep and Lambs 1,6098 Pasture, Irrigated 1,4859 Pasture, Rangeland 440
10 Bulls 189
MONTEREY1 Leaf Lettuce 613,3062 Strawberries 604,9393 Head Lettuce 508,5994 Nursery 342,1255 Broccoli 260,4106 Grapes 251,6047 Spring Mix 175,2758 Spinach 128,5289 Vegetables, Misc. 117,734
10 Celery 117,276
NAPA1 Grapes, Wine 472,6072 Nursery Products 6,4333 Cattle and Calves 3,1584 Livestock Products 8035 Olives 6346 Vegetables, Misc. 3617 Fruits and Nuts, Misc. 2858 Pasture, Rangeland 2809 Sheep and Lambs 61
10 Hay, Grain 48
NEVADA1 Heifers and Steers, Fed 2,9142 Grapes, Wine 2,0873 Pasture, Range 1,3304 Pasture, Irrigated 1,1985 Cows, Cull 6166 Fruits and Vegetables 5537 Nursery Products 4718 Sheep and Lambs 2349 Livestock 101
10 Livestock Products 62
ORANGE1 Woody Ornamentals 149,9262 Strawberries 41,1013 Nursery, Flower Prpg. Materials 18,5814 Potted Plants 17,6255 Fruits and Nuts, Misc. 14,5196 Vegetables, Misc. 10,4727 Cut Flowers 1,0208 Cucumbers 4759 Pasture, Rangeland 465
10 Livestock 347
California Agricultural Resource Directory 2008–2009 37
County Statistical Data
Leading Commodities for Gross Value of Agricultural Production by County, 2004a
$1,000
Leading Commodities for Gross Value of Agricultural Production by County, 2007 1 continued
PLACER1 Rice 11,3632 Nursery Products 10,3603 Cattle and Calves 9,3334 Other Livestock 4,6255 Walnuts 2,8466 Livestock Products, Misc. 2,5007 Pasture, Irrigated 2,3768 Pasture, Other 1,9509 Mandarins 1,192
10 Strawberries 1,104
PLUMAS1 Stockers and Feeders 11,9552 Hay, Alfalfa 3,4103 Pasture, Irrigated 3,1504 Hay, Wild 1,0365 Beef Cows, Cull 4126 Hay, Grain 3427 Pasture, Non-irrigated 3008 Fruits and Nuts, Unspec. 3009 Livestock 130
10 Pasture, Rangeland 65
RIVERSIDE1 Nursery Stock 272,3262 Milk 219,6563 Grapes, Table 97,1514 Eggs 90,6895 Hay 69,4486 Avocados 48,3467 Peppers, Bell 48,0428 Grapefruit 42,4259 Lemons 36,096
10 Dates 30,527
SACRAMENTO1 Grapes, Wine 74,5712 Milk, Market 66,1103 Nursery Stock 37,6774 Vegetables, Misc. 30,2675 Poultry 24,7406 Pears, Bartlett 24,2777 Cattle and Calves 16,8298 Hay, Alfalfa 16,8079 Corn, Field 16,366
10 Livestock 13,979
SAN BENITO1 Nursery Stock 34,4202 Vegetable and Row Crops, Misc 29,0543 Grapes, Wine 24,2964 Peppers, Bell 22,5005 Lettuce, Salad 19,1746 Lettuce, Leaf (Mixed) 18,6387 Lettuce, Romaine 17,2108 Spinach 17,0609 Tomatoes, Market 14,289
10 Livestock and Poultry Products, Misc. 13,591
SAN BERNARDINO1 Milk 354,0692 Eggs 42,6883 Cattle and Calves (Meat) 30,9394 Trees and Shrubs 25,1385 Replacement Heifers 22,4406 Alfalfa, All 11,8837 Ground Cover 9,3918 Indoor Decoratives 8,9359 Bok Choi 8,183
10 Oranges 6,389
SAN DIEGO1 Flowers, Foliage Plants 322,3392 Ornamental Tree and Shrubs 321,8303 Nursery, Bedding 237,0484 Avocados 127,1005 Tomatoes, Fresh Market 88,0626 Eggs, Chicken, Market 56,3387 Cut Flowers 43,6678 Poinsettias 38,7949 Strawberries 24,929
10 Vegetables, Misc. 24,751
SAN FRANCISCO1 Vegetables, Misc. 9192 Cut Flowers 6703 — —4 — —5 — —6 — —7 — —8 — —9 — —
10 — —
SAN JOAQUIN1 Milk, Market 445,8472 Grapes, All 216,9143 Cherries 201,6964 Almonds 158,9325 Walnuts, English 129,3636 Tomatoes, All 125,3267 Cattle and Calves 103,4838 Hay, All 96,6469 Woody Ornamentals 55,692
10 Apples 38,457
SAN LUIS OBISPO1 Grapes, Wine 141,6742 Broccoli 77,9913 Strawberries 55,4934 Cattle and Calves 55,2725 Vegetable Transplants 34,6796 Lettuce, Head 31,8627 Cut Flowers 28,5558 Indoor Decoratives 24,3409 Carrots 22,505
10 Cauliflower 17,426
SAN MATEO1 Flowering Potted Plants 91,1382 Ornamental Nursery Stock 20,3503 Cut Flowers 10,5544 Potted Foliage Plants 8,1745 Mushrooms 8,0966 Brussels Sprouts 7,8527 Cut Flowers and Foliage 6,9418 Forest Products 4,1189 Leeks 1,815
10 Cattle and Calves 1,723
SANTA BARBARA1 Strawberries 312,7552 Broccoli 131,0703 Grapes, Wine 99,9194 Lettuce, Head 87,8465 Cauliflower 46,1076 Celery 39,6867 Cattle 27,3408 Lettuce, Leaf 25,7059 Gerbera Cut Flowers 23,565
10 Avocados 20,812
SANTA CLARA1 Nursery Crops 87,8922 Mushrooms 57,7013 Peppers, Bell 14,7474 Tomatoes, Fresh 7,4245 Steer and Heifers 7,3296 Cherries 6,5557 Grapes, Wine 6,1108 Lettuce, Romaine 5,7569 Cut Flowers 5,576
10 Onions, Dry 4,691
SANTA CRUz1 Strawberries 196,9362 Raspberries 71,0693 Vegetables, Misc. 44,5894 Indoor Cut Flowers 35,0245 Landscape Plants 33,8996 Other Plants 20,9047 Field Grown Flowers 20,5898 Berries, Misc. 14,0509 Brussel Sprouts 8,848
10 Apples 8,110
SHASTA1 Forest Products, Unspec. 23,4562 Hay, Other 13,2363 Stockers and Feeders 11,2874 Nursery Plants, Strawberry 7,9935 Rice, Wild 6,1726 Hay, Alfalfa 5,3807 Pollination Fees 3,6168 Pasture, Rangeland 3,4759 Breeding Stock 3,421
10 Pasture, Irrigated 3,300
continued on next page

38 California Agricultural Resource Directory 2008–2009
County Statistical Data
Leading Commodities for Gross Value of Agricultural Production by County, 2004a
$1,000
Leading Commodities for Gross Value of Agricultural Production by County, 2007 1 continued
1 The data rankings were extracted from county agricultural commissioners’ reports, where published. Those not ranked by the counties were ranked by USDA’s National Agricultural Statistics Service, California Field Office. Timber was omitted in rankings. Three county agricultural commissioners’ reports were not available at publication. The last years available were used for this report: Trinity County (2003), Humboldt and Tuolumne counties (2006).
SIERRA1 Stockers and Feeders 3,6662 Pasture, Irrigated 1,0303 Hay, Alfalfa 7444 Hay, Wild 5635 Hay, Grain 2006 Pasture, Non-irrigated 1207 Beef Cows, Cull 1188 Fruits and Nuts, Unspec. 359 Pasture, Range 24
10 Livestock 15
SISKIYOU1 Hay, Alfalfa 42,4402 Nursery Plants, Strawberry 35,2333 Cattle 17,4824 Potatoes 12,0405 Field Crops, Misc. 11,3216 Wheat 10,9837 Nursery Products 6,0008 Onions 5,4709 Hay, Other 5,309
10 Cows 4,968
SOLANO1 Nursery Products 56,6112 Alfalfa 24,6803 Tomatoes, Processing 23,9554 Cattle and Calves 23,2735 Walnuts 21,9556 Milk, Market 17,0227 Grapes, Wine 8,0958 Almonds 6,9359 Corn, Field 6,761
10 Sheep and Lambs 6,489
SONOMA1 Grapes, Wine 416,5502 Milk, Market 98,7073 Livestock and Poultry, Misc. 39,5014 Livestock and Poultry Products,
Misc. 19,915
5 Nursery, Ornamentals 10,8726 Cattle and Calves 10,8407 Vegetables, Misc. 7,6558 Nursery Products, Misc. 7,2739 Nursery, Bedding Plants 5,400
10 Apples 5,194
STANISLAUS1 Milk, All 745,3872 Almonds 465,8003 Chickens, All 222,4314 Cattle and Calves 164,2165 Walnuts 119,0656 Silage, All 77,8647 Deciduous Fruit and Nut Nursery 74,8608 Tomatoes 59,9869 Turkeys, All 54,541
10 Peaches, All 52,745
SUTTER1 Rice 136,9102 Walnuts 61,1113 Peaches 36,8384 Tomatoes 19,4125 Dried Plums 16,8546 Almonds 11,0427 Nursery Products 9,8828 Cattle and Calves 9,1849 Alfalfa 7,708
10 Melons 7,318
TEHAMA1 Walnuts 53,8042 Almonds 26,2833 Prunes 24,3754 Olives 20,0685 Milk, Manufactured 7,9126 Milk, Market 7,8167 Stockers and Feeders 7,6248 Fruits and Nuts, Misc. 4,0789 Pasture, Rangeland 3,720
10 Cattle on Feedlot 3,393
TRINITY1 Cattle and Calves 9662 Range Pasture 7363 Grapes, Wine 2374 Irrigated Pasture 1785 Fruit and Nut Crops 1006 Grain Hay 497 Nursery Products 288 Other Hay 259 Christmas Trees and Cut Greens 1
10 — —
TULARE1 Milk 1,897,4572 Oranges, Navel and Valencia 533,6043 Cattle and Calves 502,4554 Grapes 477,6235 Alfalfa, Hay and Silage 164,3876 Corn, Grain and Silage 146,3307 Walnuts 119,1268 Peaches, Clingstone and
Freestone88,863
9 Almonds, Meats and Hulls 83,14410 Plums 81,800
TUOLUMNE1 Livestock 14,7052 Cattle and Calves 6,3963 Range Pasture 2,8004 Firewood 1,3375 Bees 3646 Fruit and Nut Crops 2357 Sheep and Lambs 1608 Irrigated Pasture 1449 Other Hay 114
10 Livestock Products 91
VENTURA1 Strawberries 366,4282 Nursery Stock 292,9893 Lemons 235,1244 Celery 169,5125 Tomatoes 86,4866 Raspberries 69,2687 Avocados 52,9118 Cut Flowers 48,6469 Peppers 39,676
10 Valencia Oranges 19,393
YOLO1 Tomatoes, Processing 100,0122 Hay, Alfalfa 51,9583 Grapes, Wine 46,5134 Rice 32,8365 Seed Crops 31,9526 Almonds 28,9157 Organic Production 19,4768 Walnuts 18,8729 Cattle and Calves 15,870
10 Wheat 12,179
YUBA1 Rice 44,8812 Walnuts 32,4033 Peaches, Clingstone 16,6774 Milk 12,8905 Cattle and Calves 8,6056 Prunes 6,6837 Pasture, All 4,0188 Kiwifruit 3,3359 Almonds, All 3,012
10 — —

California Agricultural Resource Directory 2008–2009 39
County Statistical Data
1 Three county agricultural commissioners’ reports were not available at publication. The last years available were used for this report: Trinity County (2003), Humboldt and Tuolumne counties (2006).2 Includes trees, shrubs, vines, bedding plants, bulbs and turf not included in flowers and foliage.3 Includes cut flowers, potted plants, foliage plants and indoor decoratives.
Commodity Rank and Leading Counties by Gross Value of Agricultural Production, 2007 1
Commodity ––– State ––– –––––––––––––––––––––– Five Leading Counties by Rank and Percentage of State Total –––––––––-––––––––––––––Rank Value 1 Percent
of Value2 Percent
of Value3 Percent
of Value4 Percent of
Value5 Percent of
Value$1,000
Milk and Cream 1 7,303,049 Tulare 26.0 Merced 14.4 Stanislaus 10.2 Kern 9.5 Kings 9.5Grapes, All 2 4,004,735 Fresno 15.6 Kern 14.5 Tulare 11.9 Napa 11.8 Sonoma 10.4Nursery Products 2 3 3,178,651 San Diego 20.2 Ventura 9.2 Monterey 8.8 Riverside 8.5 Orange 5.9Cattle and Calves, All 4 2,787,366 Tulare 18.0 Fresno 12.2 Imperial 12.0 Merced 8.5 Kern 7.9Almonds 5 2,639,123 Fresno 18.3 Stanislaus 17.6 Kern 15.8 Merced 11.9 Madera 8.8Lettuce 6 1,940,868 Monterey 63.4 Fresno 10.1 Imperial 10.0 Santa Barbara 6.3 San Benito 3.5Strawberries 7 1,624,165 Monterey 37.2 Ventura 22.6 Santa Barbara 19.3 Santa Cruz 12.1 San Luis Obispo 3.4Alfalfa Hay 8 1,291,367 Kern 17.5 Tulare 12.3 Imperial 8.8 Merced 8.6 Fresno 7.2Oranges 9 1,103,527 Tulare 48.4 Kern 26.6 Fresno 17.3 San Diego 2.5 Ventura 1.9Chickens 10 1,019,198 Fresno 39.5 Merced 32.0 Stanislaus 21.8 Tulare 5.4 San Joaquin 0.7Tomatoes, Processing 11 858,513 Fresno 40.6 Yolo 11.6 San Joaquin 10.7 Kings 8.2 Merced 5.4Walnuts, English 12 824,804 San Joaquin 15.7 Tulare 14.4 Stanislaus 14.4 Butte 12.8 Sutter 7.4Flowers and Foliage 3 13 796,061 San Diego 50.3 Santa Barbara 12.5 Santa Cruz 7.9 Monterey 7.8 San Luis Obispo 6.6Rice (Excl. Seed) 14 664,538 Colusa 28.3 Butte 20.1 Sutter 19.5 Glenn 16.3 Yuba 6.8Silage, All 15 631,123 Tulare 30.8 Merced 15.7 Stanislaus 12.3 Kings 11.2 Kern 9.7Cotton Lint 16 624,647 Fresno 33.4 Kings 30.0 Kern 17.9 Merced 10.0 Tulare 4.5Pistachios 17 621,560 Kern 44.2 Madera 13.4 Tulare 12.8 Kings 12.7 Fresno 12.6Broccoli 18 593,407 Monterey 43.9 Santa Barbara 22.1 San Luis Obispo 13.1 Imperial 10.3 Fresno 5.3Peaches, All 19 539,509 Fresno 41.2 Tulare 16.5 Stanislaus 9.8 Kings 7.6 Sutter 6.8Carrots 20 463,241 Kern 68.2 Imperial 10.7 Monterey 5.1 San Luis Obispo 4.9 Fresno 3.7Eggs, Chicken 21 450,944 Merced 28.1 Riverside 20.1 San Diego 12.5 Stanislaus 10.7 San Bernardino 9.5Lemons 22 435,122 Ventura 54.0 Kern 12.2 Tulare 8.9 Riverside 8.2 Fresno 4.5Tomatoes, Fresh Market 23 391,328 Fresno 33.1 Merced 25.0 San Diego 22.5 San Joaquin 8.6 Stanislaus 4.0Celery 24 361,425 Ventura 46.9 Monterey 32.4 Santa Barbara 11.1 San Luis Obispo 3.3 San Benito 3.0Cherries 25 326,150 San Joaquin 61.8 Fresno 9.7 Stanislaus 8.3 Tulare 6.1 Kern 5.5Nectarines 26 271,087 Fresno 59.1 Tulare 27.9 Kings 8.2 Kern 1.9 Los Angeles 1.7Avocados 27 268,933 San Diego 47.3 Ventura 19.7 Riverside 18.0 Santa Barbara 7.7 Orange 4.3Plums 28 256,174 Fresno 54.3 Tulare 31.9 Kings 6.8 Kern 5.1 Madera 1.1Onions 29 251,011 Fresno 50.1 Imperial 15.8 Kern 9.6 Los Angeles 4.9 Monterey 4.1Bell Peppers 30 226,350 Riverside 21.2 Kern 18.7 Ventura 17.5 San Benito 9.9 Fresno 8.5Turkeys 31 217,460 Fresno 31.3 Merced 28.7 Stanislaus 25.1 Kings 9.6 Tulare 3.0Spinach 32 205,426 Monterey 62.6 Imperial 9.4 San Benito 8.3 Ventura 4.5 Riverside 3.7Wheat (Excl. Seed) 33 205,315 Kern 23.6 Imperial 14.3 Kings 9.9 Fresno 7.9 Yolo 5.9Cauliflower 34 202,858 Monterey 51.0 Santa Barbara 22.7 Imperial 11.4 San Luis Obispo 8.6 Riverside 4.9Garlic 35 201,055 Fresno 88.9 Kern 8.5 Kings 1.6 Santa Clara 0.5 San Benito 0.4Salad Greens, Misc. 36 192,897 Monterey 90.9 Imperial 8.0 Santa Barbara 0.5 San Benito 0.4 Fresno 0.1Mushrooms 37 183,481 Monterey 39.9 Santa Clara 31.4 Ventura 18.0 San Diego 5.6 San Mateo 4.4Pasture and Range, Other 38 172,452 Merced 7.3 Tulare 6.8 Stanislaus 6.4 Monterey 6.2 San Luis Obispo 5.9Cottonseed 39 172,108 Kern 28.9 Kings 27.5 Fresno 23.1 Merced 11.5 Tulare 4.2Cantaloupe 40 168,367 Fresno 59.4 Imperial 21.5 Merced 11.8 Stanislaus 2.9 Riverside 2.0Raspberries 41 165,060 Santa Cruz 43.1 Ventura 42.0 Monterey 15.0 San Bernardino — Los Angeles —Corn for Grain 42 158,646 San Joaquin 35.5 Sacramento 10.3 Tulare 7.7 Merced 7.0 Glenn 6.5Sweet Potatoes 43 135,975 Merced 95.7 Stanislaus 3.5 Kern 0.8 San Bernardino — San Benito —Potatoes (Incl. Seed) 44 131,748 Kern 45.2 San Joaquin 13.6 Riverside 9.7 Siskiyou 9.3 Modoc 9.3Plums, Dried 45 131,705 Glenn 19.8 Tehama 18.5 Butte 16.1 Sutter 12.8 Tulare 7.4Tangerines 46 121,305 Kern 53.9 Tulare 26.7 Riverside 12.7 San Diego 2.4 Ventura 1.8Apples 47 107,631 San Joaquin 35.7 Kern 16.1 Fresno 9.4 El Dorado 7.6 Santa Cruz 7.5Olives 48 102,030 Tulare 44.6 Glenn 21.0 Tehama 19.7 Butte 5.5 Fresno 4.9Pasture, Irrigated 49 94,396 Tulare 13.7 Merced 7.4 Stanislaus 5.5 Fresno 5.3 Modoc 4.8Sweet Corn 50 92,075 Fresno 29.9 Imperial 24.2 San Joaquin 14.9 Contra Costa 14.3 Riverside 6.4Grain Hay 51 92,063 Merced 20.8 Stanislaus 20.2 Kern 13.9 Tulare 9.2 Modoc 3.8Artichokes 52 91,708 Monterey 80.9 Santa Barbara 8.1 Riverside 6.0 Imperial 3.4 San Benito 0.9Cabbage 53 78,397 Monterey 43.9 Ventura 13.5 San Luis Obispo 10.0 Santa Barbara 8.9 Imperial 8.9Asparagus 54 77,393 San Joaquin 42.0 Monterey 23.7 Fresno 16.8 San Benito 5.5 Merced 4.7Pears 55 76,886 Sacramento 31.6 Mendocino 22.0 Lake 18.2 Fresno 9.9 Yuba 8.2Watermelon 56 76,804 Fresno 30.0 Kern 20.1 San Joaquin 19.6 Imperial 17.5 Riverside 10.3Dry Beans 57 70,392 Stanislaus 23.9 San Joaquin 13.3 Tulare 8.7 Colusa 7.8 Fresno 7.4Grapefruit 58 65,965 Riverside 63.3 Tulare 16.1 San Diego 8.8 Kern 8.5 Imperial 2.2Sudan Hay 59 63,720 Imperial 77.0 Solano 5.7 Stanislaus 5.3 Tulare 4.8 Merced 4.4Sugar Beets 60 62,113 Imperial 62.9 Fresno 29.8 Merced 5.1 Kern 1.0 Tulare 0.8Sheep and Lambs 61 61,229 Fresno 18.7 Kern 14.8 Imperial 13.1 Solano 10.6 Merced 6.4Honeydew Melons 62 56,259 Fresno 52.5 Imperial 16.8 Sutter 11.1 Riverside 9.7 Yolo 5.8Hogs and Pigs 63 49,056 Tulare 51.4 San Bernardino 21.3 Fresno 18.2 Stanislaus 5.2 Kern 0.7Dates 64 48,622 Riverside 62.8 Imperial 34.9 Tulare 1.4 Fresno 0.5 San Bernardino 0.2Vegetable and Vinecrop Seeds 65 45,282 Colusa 33.3 Fresno 15.0 Imperial 13.7 Santa Barbara 7.7 San Joaquin 7.7Apricots 66 45,254 Stanislaus 40.6 Fresno 22.5 Kern 7.5 San Joaquin 7.2 Merced 7.1Kiwifruit 67 44,751 Tulare 66.4 Butte 15.6 Yuba 7.5 Fresno 5.2 Sutter 2.5Alfalfa seed 68 35,147 Imperial 67.5 Fresno 31.8 Lassen 0.7 — — — —Squash 69 31,375 Santa Barbara 39.5 Fresno 13.8 San Diego 8.0 Monterey 6.3 Tulare 5.5Honey 70 29,667 Tulare 50.3 Kern 10.5 Fresno 8.8 Merced 8.2 San Diego 7.4