Embed Size (px)
Citation preview

County Board Work SessionSeptember 1, 2015

What’s been done
• Additional materials prepared on geographic distribution of affordable housing
• Open Houses in July
• Virtual open house and survey
• Additional meetings with community groups
• Request to Arlington Public Schools for information
• Arlington County Fair
• Review of AHMP and IF revisions with Working Group
• Revised redline versions (8.0) released August 18
2

What’s been doneSurvey Results
3
Strongly Agree, 45%
Agree, 18%
Neutral, 4%
Disagree, 16%
Strongly Disagree,
17%
• Prevent loss of MARKs
• Produce CAFs primarily in transit corridors
• Integrate affordable housing goals into County planning -sector and area plans
Agreement with AHMP policies

What’s been doneSurvey Results
Reasonableness of Forecast
Strongly Agree, 31%
Agree, 30%
Neutral, 5%
Disagree, 15%
Strongly Disagree,
19%
4

AHMP and IF Revisions
• Historical context (page 2-3).
• Region context (p. 5 and 13)
• Future of MARKs (p. 6 and 20)
• Commission on Aging recommendations
(AHMP p. 7, 17, 27 and IF p. 26)
• Planning Commission recommendations
(AHMP p.7 and IF p. 15)
• Appendix B and C (p. 37 - 41)
• Form Based Code recommendation deleted
5

AHMP and IF RevisionsGeographic Distribution
AHMP
• Affordable Housing Forecast map included
• Distribution policy 1.1.4 –link the policy to the forecast map
Implementation Famework
• Reference to the 2040 Forecast of Housing Affordable up to 60% AMI as guidance for AHIF guidelines (p. 5)
• R/ECAP Map removed
• No net new affordable units in census tracts with concentrated poverty
• Explanation of current LIHTC incentives for production in low poverty areas.
• Recommendation to encourage VHDA to further incentivize production in higher income areas.
• Linkage of Area Plans to AHMP goals 6

• Affordable Rental Supply Goal
• Distribution of Affordable Housing
• Cost of Implementation
• Monitoring and Evaluation
• Near-term Implementation Priorities
Outstanding Issues
7

Alternative Definition of Affordability Housing + Transportation costsH+T Index 45%
Housing Alone 30%
Affordable Rental Supply Goal
Median Income100% AMI
Moderate Income (80% AMI)
Low Income~60% AMI
Housing 29% 36% 49%
Transportation 11% 14% 16%
H+T 40% 50% 65%8

Basis for Target
Virginia Code § 15.2-2223 D.The comprehensive plan shall include the designation of areas and implementation of measures for the construction, rehabilitation and maintenance of affordable housing, which is sufficient to meet the current and future needs of residents of all levels of income.
Draft AHMP Objective 1.1Produce and preserve a sufficient supply of affordable rental housing to meet current and future needs.
Affordable Rental Supply Goal
9
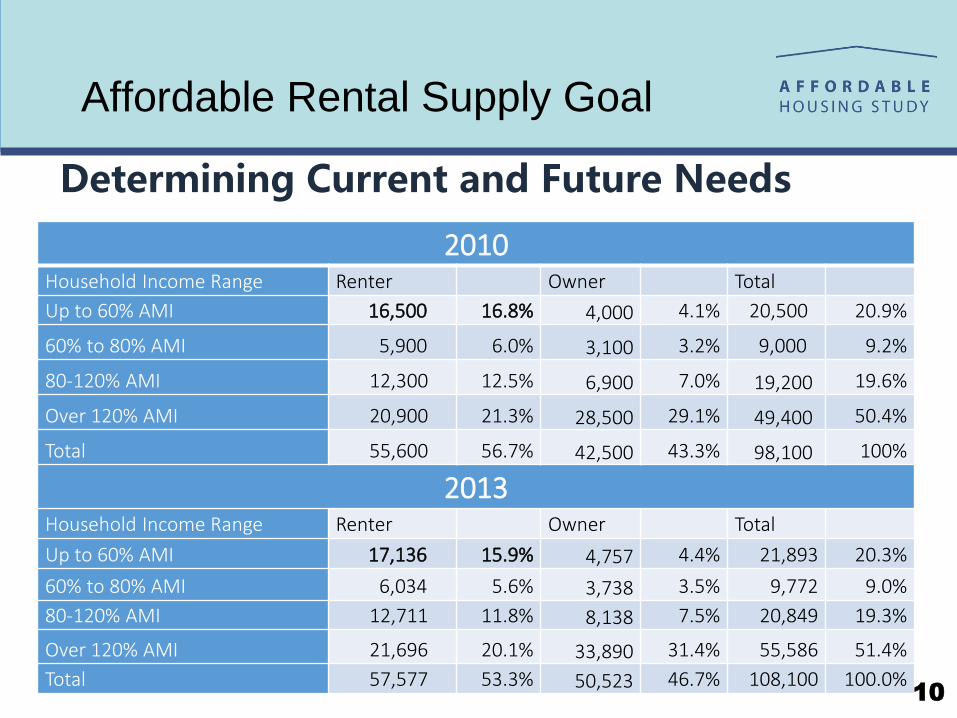
Determining Current and Future Needs
2010Household Income Range Renter Owner Total
Up to 60% AMI 16,500 16.8% 4,000 4.1% 20,500 20.9%
60% to 80% AMI 5,900 6.0% 3,100 3.2% 9,000 9.2%
80-120% AMI 12,300 12.5% 6,900 7.0% 19,200 19.6%
Over 120% AMI 20,900 21.3% 28,500 29.1% 49,400 50.4%
Total 55,600 56.7% 42,500 43.3% 98,100 100%
2013Household Income Range Renter Owner Total
Up to 60% AMI 17,136 15.9% 4,757 4.4% 21,893 20.3%
60% to 80% AMI 6,034 5.6% 3,738 3.5% 9,772 9.0%
80-120% AMI 12,711 11.8% 8,138 7.5% 20,849 19.3%
Over 120% AMI 21,696 20.1% 33,890 31.4% 55,586 51.4%
Total 57,577 53.3% 50,523 46.7% 108,100 100.0%
Affordable Rental Supply Goal
10

Determining Current and Future Needs
Therefore…
By 2040, 17.7% of the County’s housing stock should be affordable rentals to meet the needs of renter households with incomes at or below 60% AMI.
2040 forecastHousehold Income
Range
Renter Owner Total
Up to 60% AMI 22,800 17.7% 4,800 3.7% 27,600 21.5%
60% to 80% AMI 8,200 6.4% 3,800 3.0% 12,000 9.3%
80-120% AMI 16,600 12.9% 7,800 6.1% 24,500 19.1%
Over 120% AMI 29,100 22.6% 35,400 27.5% 64,500 50.2%
Total 76,600 59.6% 52,000 40.4% 128,600 100%
Affordable Rental Supply Goal
11

17.7% Target is long-range and aspirational
CAFs up to 60% AMI+ MARKS up to 60% AMI= Housing Affordable at 60% AMI
Affordable Rental Supply Goal
12

13
Discussion
Affordable Rental Supply Goal
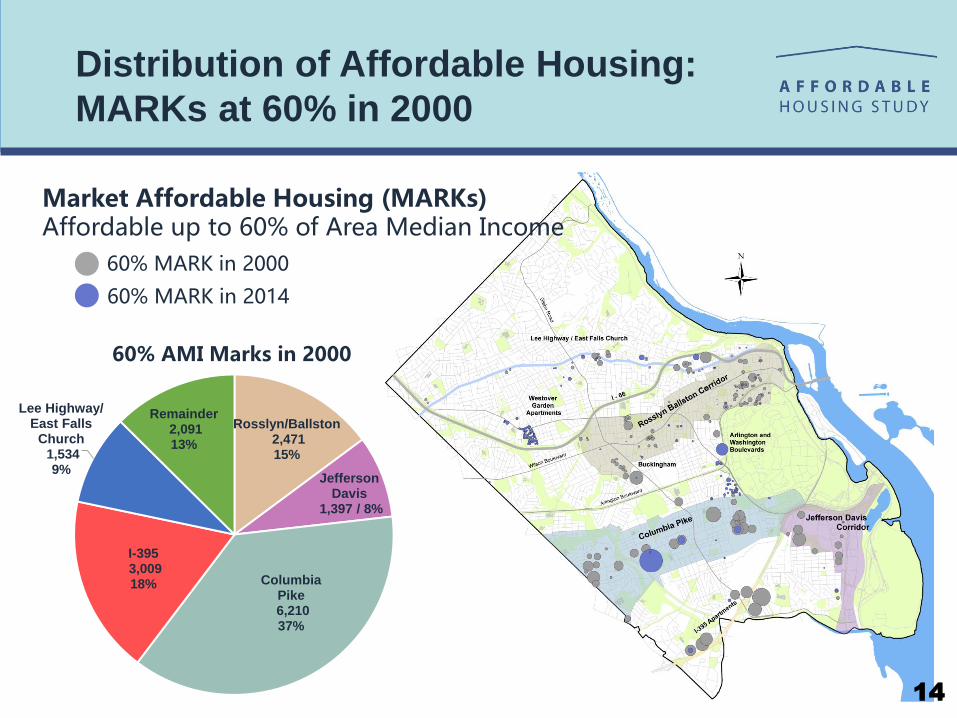
Distribution of Affordable Housing:
MARKs at 60% in 2000
Market Affordable Housing (MARKs)Affordable up to 60% of Area Median Income
60% MARK in 2000
60% MARK in 2014
Rosslyn/Ballston2,471 15%
Jefferson Davis
1,397 / 8%
Columbia Pike6,210 37%
I-3953,009 18%
Lee Highway/East Falls
Church1,534 9%
Remainder2,091 13%
60% AMI Marks in 2000
14

Market Affordable Housing (MARKs)Affordable up to 60% of Area Median Income
60% MARK in 2000
60% MARK in 2014
Rosslyn/Ballston97 3%
Jefferson Davis33 1%
Columbia Pike1,608 48%
I-39583 2%
Lee Highway/East Falls Church
288 …
Remainder1,224 37%
60% AMI Marks in 2014
Distribution of Affordable Housing:
MARKs at 60% in 2014
15

Distribution of Affordable Housing
MARKs up to 80% in 2014
Current Affordable Housing Committed Affordable (CAFs) and Market Affordable up to 80% AMI (Includes MARKs up to 60%)
Rosslyn Ballston
1,936 / 13%
Jefferson Davis
1,591 / 10%
Columbia Pike5,077 33%
I-3953,001 19%
Lee Highway/East Falls
Church1,615 10%
Remainder
2,398 15%
80% MARK in 2014
CAF in 2015
MARKs up to 80% AMI in 2014
16

Current Affordable Housing Committed Affordable (CAFs) and Market Affordable up to 80% AMI (Includes MARKs up to 60%)
80% MARK in 2014
CAF in 2015
Rosslyn Ballston2,034 28%
Jefferson Davis
455 / 6%
Columbia Pike2,149 30%
I-395557 8%
Lee Highway/East Falls Church
266 / 4%
Remainder1,721 24%
Committed Affordable Housing in 2015
Distribution of Affordable Housing
CAFs in 2015
17

Distribution of Affordable Housing:
2040 Forecast Affordable up to 60% AMI
In 2015
60% of area
median income
(AMI) for a family
of four is $65,520. For
a one-person household
60% AMI is $45,900.
Where would this housing be located?
18
Areas Today 2040 ShareMetro Corridors 2,619 7,200 32%
Rosslyn Ballston 2,131 5,000 22%
Jefferson Davis 488 2,200 10%
Columbia Pike 3,757 5,000 22%
Western Pike 2,300 10%
Central Pike 1,400 6%
Eastern Pike 1,250 5%
Foxcroft Heights 50 0%
Other Areas 4,139 10,600 46%
I-395 640 3,000 13%
Lee Highway/East
Falls Church554 2,500 11%
Remainder 2,945 5,100 22%
Buckingham 1,500 7%
Westover 700 3%
Arlington and
Wash. Blvds1,400 6%
Unidentified* 1,500 7%
Total 10,515 22,800 100%

Distribution of Affordable Housing:
Past-Present-Future
The following charts represent the past, current and projected future distribution of housing units (MARKs and CAFs) affordable to households earning 60% of Area Median Income (AMI)* or less.
*60% of Area Median Income (AMI) is approximately $65,500 for a family of four.
19
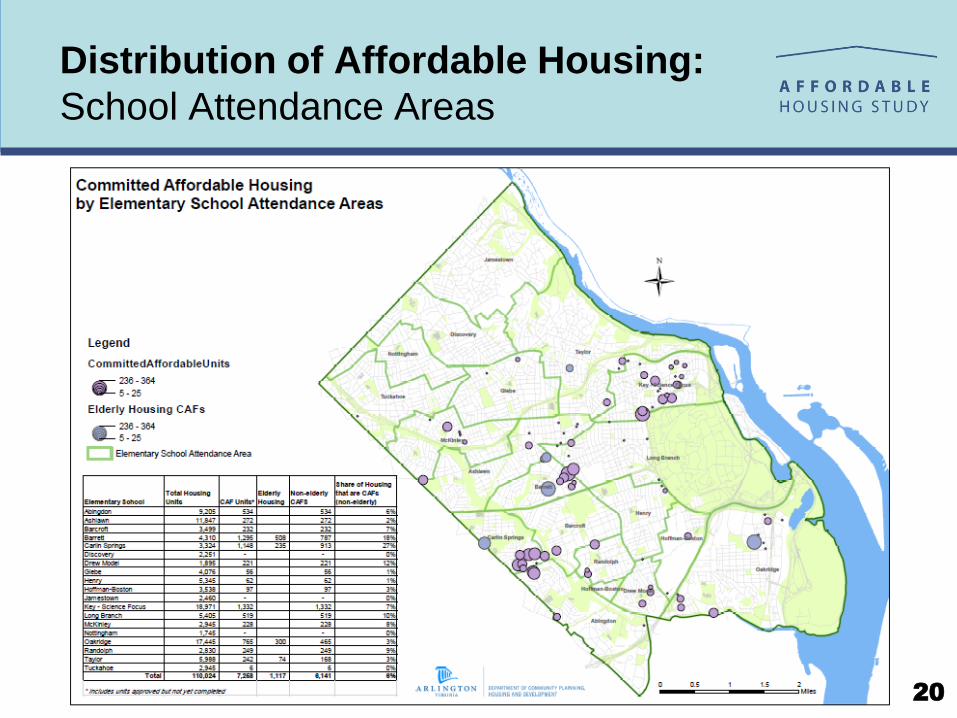
Distribution of Affordable Housing:
School Attendance Areas
20

Distribution of Affordable Housing
21
Discussion

Affordable Housing Investment Fund (AHIF)
$12,456,017 (FY 2016)
Housing Grants
$8,913,507 (FY 2016)
Real Estate Tax Relief Program
$4,500,000 (FY 2016)
Cost of Implementation
22

AHIF Achieving Goal 1: Housing Supply
$12,456,017 (FY 2016)
Factors impacting the number of units that will need to be
financed
1) Presence of MARKs2) Production of CAFs through land use tools 3) The overall amount of growth that is realized
Factors affecting the amount of General Fund needed
1) Loan repayments2) Developer contributions 3) Other funding sources (federal funds, recordation fees)4) AHIF cost per unit
Cost of Implementation
23
$12 to $20 million annually in General Fund resources
estimated to meet the 2040 rental objective
Cost of Implementation
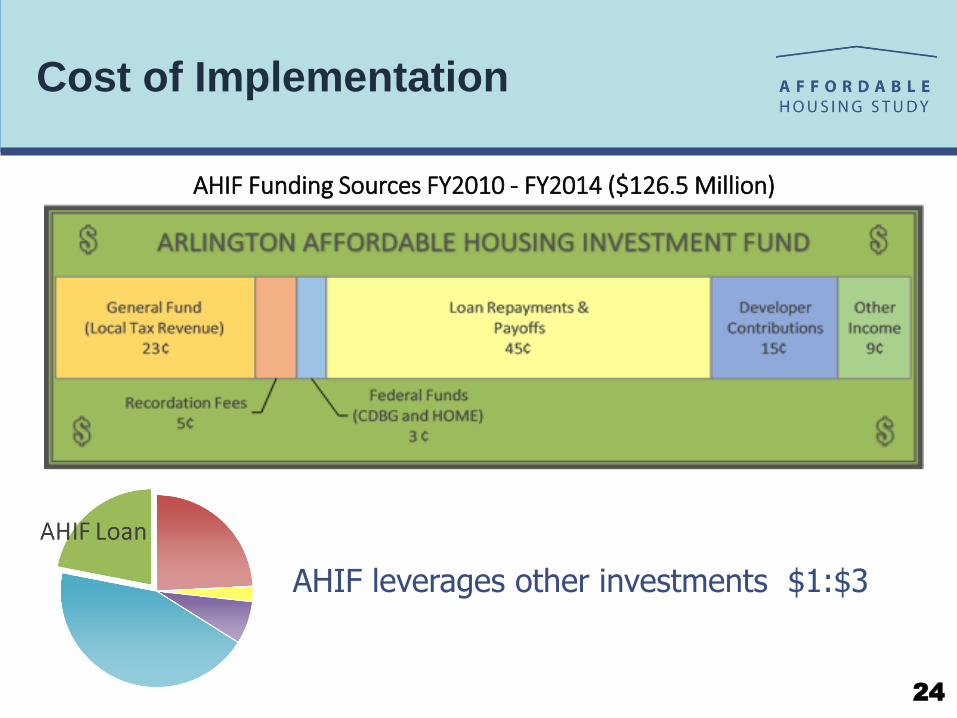
24
AHIF Funding Sources FY2010 - FY2014 ($126.5 Million)
AHIF leverages other investments $1:$3

Housing Grants Goal 1: Access$8,913,507 (FY 2016)
Factors impacting the number of Housing Grants
1) Number of eligible households2) Number of Housing Choice Vouchers3) Availability of housing within rental limits4) Willingness of landlords to accept Housing Grants
Factors impacting the cost of Housing Grants
1) Availability of CAFs at lower affordability levels (50% AMI and 40% AMI)
Cost of Implementation
25

Housing Grants Goal 1: Access
Cost of Implementation
Relationship between Housing Grants and CAFs
80% of rental assistance recipients live in CAFs
30% of CAF units are occupied by households with rental
assistance
26

Reaching 40%
and below
Full cost of housing
AHIF and LIHTC
Development Assistance
One Time Allocation
60 years affordable to
60% AMI Households
Housing Grant
Direct Housing Assistance
Year by Year Allocation
Reduces housing cost to
40% of income.
Tenant Pays 40% of
income
Cost of Implementation
27

Reaching 40%
and below
Full cost of housing
AHIF and LIHTC
Development Assistance
One Time Allocation
60 years affordable to
50% AMI Households
Housing Grant
Direct Housing Assistance
Year by Year Allocation
Reduces housing cost to
40% of income.
Tenant Pays 40% of
income
Cost of Implementation
With 50% AMI CAF
28

Cost of Implementation
Housing Grants and 50% AMI CAFs
A Average monthly Housing Grant assistance $590
B Average yearly assistance $7,080
C Difference between 60 % and 50% CAF monthly rent $220
D Estimated yearly cost savings to housing grant of a 50% unit $2,640
E Estimated cost of additional AHIF required to attain 50% AMI Affordability (per unit)
$35,000
F Annualized AHIF cost ($35,000/30) $1,167
G Potential annual savings per housing grant including additional AHIF cost (D – F)
$1,473
H Potential savings over 30 years $44,190
29

Real Estate Tax Relief Goal 2: Access$4,500,000 (FY 2016)
Factors impacting cost of RETR program
1) Number of eligible households2) Locally established eligibility requirements3) Exemption or Deferment
Cost of Implementation
30
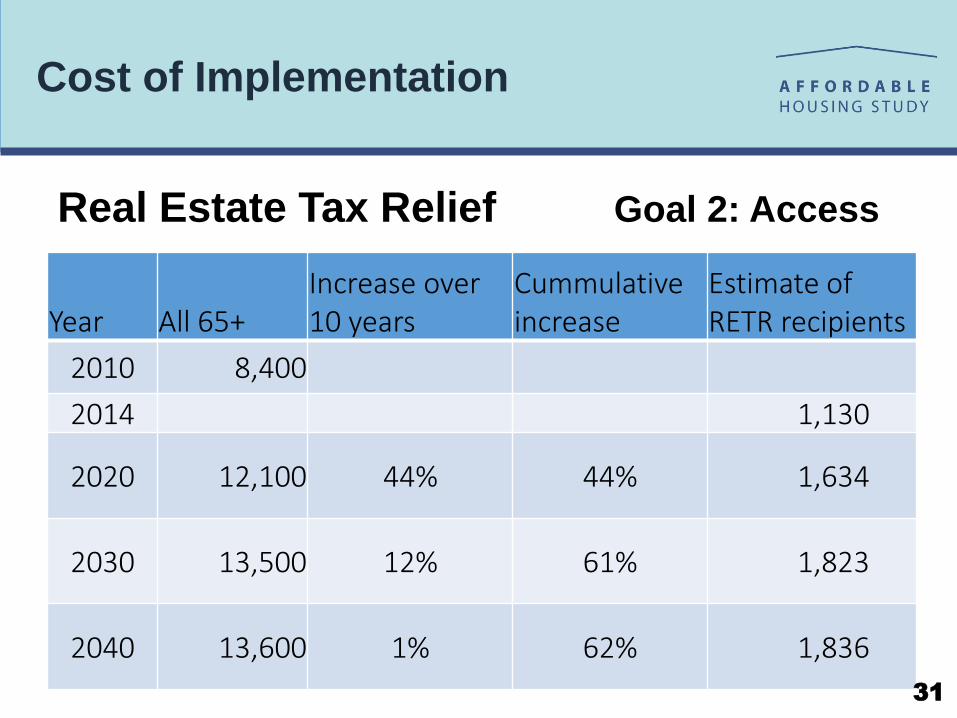
Cost of Implementation
Year All 65+ Increase over 10 years
Cummulative increase
Estimate of RETR recipients
2010 8,400
2014 1,130
2020 12,100 44% 44% 1,634
2030 13,500 12% 61% 1,823
2040 13,600 1% 62% 1,836
Real Estate Tax Relief Goal 2: Access
31

32
Discussion
Cost of Implementation

Monitoring and Evaluation
Monitoring and Evaluation Plan
• To be prepared by staff and presented to
the County Board.
• Definition of indicators to be used in
measuring progress towards achieving the
AHMP goals and objectives.
• Reports will be completed annually.
33

34
Discussion
Monitoring and Evaluation

Near Term Priorities
• AHIF – revising guidelines to reflect geographic distribution policy
• Accessory Dwelling Ordinance
• Affordable by Design Study
• Assistance for Condominium Associations
35

36
Discussion
Near Term Priorities
Help us build a solid foundation for the future of housing in Arlington.
housing.arlingtonva.us/[email protected]
37