Embed Size (px)
Citation preview


Country Report
Pro-poor Intervention Strategies in Irrigated Agriculture in Asia
Poverty in Irrigated Agriculture: Issues and Options
India
Intizar Hussain, editor Study Team/Contributors: MVK Sivamohan
Christopher Scott Intizar Hussain
Bouma Jetske Deeptha Wijerathne
Sunil Thrikawala
Country Org Logo

ii
Hussain, I. 2004. (Ed.) Pro-poor Intervention Strategies in Irrigated Agriculture in Asia: India. Colombo, Sri Lanka: IWMI. 204p. (Country report India) ISBN Number 92 90 90 547 6 poverty / land resources / water resources / irrigation programs / institutional development / institutions / organizations / irrigation management / water supply / water distribution / water policy / financing / water rates / cost recovery / irrigation systems / irrigated farming / social aspects / economic aspects / dams / constraints / river basins / catchment areas / soils / crop production / cereals / public sector / employment / investment / dams / development projects / water rights / legislation / privatization / water users’ associations / farmers’ associations / water supply / indicators / irrigation scheduling / groundwater irrigation / water allocation

iii
Contents List of Tables and Figures iv Acknowledgement vi Study Background 1 Part 1 – Poverty and Irrigation in India
1.1 Introduction 3 1.2 Historical and Contextual Frame 4
a. Rural poverty in India 7 b. Water and land resources of India 18
1.3 Poverty Alleviation Initiatives in India – An Overview 26 1.4 Impact of Irrigation on Poverty – Review of Evidence 30 1.5 Performance of Irrigation Project – An Overview 42 1.6 Institutional Reforms in Irrigation – An Overview 49 1.7 Summing Up 57
Part 2 – Institutional Arrangements for Irrigation Management in India
2.1 Introduction 65 2.2 National-level Institutions for Irrigation Management 66 2.3 State-level Institutions for Irrigation Management 78 2.4 Local-level Formal and Informal Institutions for Water Supply
and Distribution 106 2.5 Irrigation Financing: Water Charges and Cost Recovery 112
Part 3 – Poverty in Irrigation Systems – An Analysis for Strategic Interventions
3.1 Introduction 118 3.2 Study Settings and Data 119 3.3 Poverty in Irrigated Agriculture: Spatial Dimensions 137
a. Socio Economic Features of Selected Systems 137 b. Poverty in selected Systems: Linkages and Spatial Dimensions 143
3.4 Determinants of Poverty in Irrigated Agriculture 155 3.5 Irrigation System Performance and Associated Impacts on Poverty 171 3.6 Analysis of Water Management Institutions: Implications for the Poor 181 3.7 Summary and Conclusions 188
Annexures

iv
List of Tables and Figures
Table 1.2.1. Rural Poverty Lit trends upto 1980 09 Table 1.2.2. River Basins in India 20 Table 1.2.3. Distribution of Soils 21 Table 1.2.4. Production and Yields of Crops 22 Table 1.2.5. Public Sector Investments in Irrigation 24 Table 1.2.6. Irrigation and Utilization 25 Table 1.4.1. Irrigated Agriculture and food grain production 33 Table 1.4.2. Per hectare production in different CAD projects 34 Table 3.2.1. River flows: Krishna basin 120 Table 3.2.2. Allocation of waters : Krishna Basin 120 Table 3.2.3. Sources of Irrigation 122 Table 3.2.4. Productivity of Principal Crops 122 Table 3.2.5. Plan-wise outlays in AP – Irrigation Schemes 122 Table 3.2.6. General features of the Command Areas 125 Table 3.2.7. Salient features of the selected irrigation system 126 Table 3.2.8. Area Irrigated : Harsi System 128 Table 3.2.9. Cropping Pattern : Harsi System 128 Table 3.2.10. Area under Irrigation: Harsi Command 129 Table 3.2.11. Area under Irrigation: Halali System 129 Table 3.2.12. Cropping Pattern: Halali system 129 Table 3.2.13. Selection criteria of villages selected for study 130 Table 3.2.14. Household sampling in Irrigation systems in AP 132 Table 3.2.15. Sample size for selected systems in MP 135 Table 3.2.16. Household sampling in irrigation systems in MP 135 Table 3.3.1. Types of houses in different project areas 137 Table 3.3.2. Facilities in housing premises in project areas 138 Table 3.3.3. Halali system – MP 139 Table 3.3.4. Harsi system – MP 139 Table 3.3.5. Nagarjuna Sagar Left Command – AP 140 Table 3.3.6. Krishna Delta System - AP 141 Table 3.3.7. Employment Pattern in the four Irrigation Systems 142 Table 3.3.8 . Income Poverty Indicators for the four systems 143 Table 3.3.9. Official Poverty figures for AP and MP 144 Table 3.3.10. Expenditure poverty indicators for the four systems 144 Table 3.3.11. Who are the poor in NSLC and KDS 145 Table 3.3.12. Who are the poor in Harsi and Halali 145 Table 3.3.13. Poor Vs Non-poor landholding households in NSLC and KDS 146 Table 3.3.14. Poor Vs Non-poor landholdings in Halali 147 Table 3.3.15. Poor Vs Non-poor landholdings in Harsi 147 Table 3.3.16. Correlation between different variables and poverty per capita – Halali 148 Table 3.3.17. Correlation between different variables and poverty per capita – Harsi 148 Table 3.3.18. Distribution of Poverty in NSLC and KDS- 149 Table 3.3.19. Distribution of Poverty in Harsi and Halali 149 Table 3.3.20. Agricultural production and farm income in NSLC 150 Table 3.3.21. Agricultural production and farm income in KDS 150 Table 3.3.22. Agricultural production and farm income in Halali 150 Table 3.3.23. Agricultural production and farm income in Harsi 151 Table 3.3.24. Distribution of Landholding size over the irrigation system 151 Table 3.3.25. Socio-economic indicators for marginal, small, large farmers in NSLC 151

v
Table 3.3.26. Socio-economic indicators for marginal, small, large farmers in KDS 152 Table 3.3.27. Socio-economic indicators for poor and non-poor farmers in Halali and Harsi 153 Table 3.3.28. Average household expenditure on medicines and education in
Harsi and Halali 153 Table 3.4.1. Effect of Irrigation on Poverty in two systems – Irrigated and non-irrigated 156 Table 3.4.2. Effect of Irrigation on Poverty in two systems – head, middle and tail
of both systems vs non-irrigated 157 Table 3.4.3. Effect of Irrigation on Poverty in two systems- head and middle of both
systems vs Tail 158 Table 3.4.4. Effect of Irrigation on Poverty in two systems(MP)- irrigated vs
non-irrigated 159 Table 3.4.5. Effect of Irrigation on Poverty in two systems(MP) - head, middle
and tail of both systems vs non-irrigated 160 Table 3.4.6. Effect of Irrigation on Poverty in two systems(MP) - head, and middle
of both systems vs tail 161 Table 3.5.1. Productivity , equity and water supply indicators for the four irrigation
Systems 172 Table 3.5.2. Productivity , equity and water supply indicators for the four irrigation
systems in AP (reach-wise) 173 Table 3.5.3. Economic, financial, environmental and infrastructure sustainability
Indicators 175 Table 3.5.4. Economic, financial, environmental and infrastructure sustainability
indicators in AP (reach-wise) 176 Table 3.5.5. Institutional\Organizational \Management effectiveness indicators
for the four irrigation systems 176 Table 3.5.6. Institutional\Organizational \Management effectiveness indicators
in AP reach-wise) 177 Table 3.5.7. Water charges and collection in AP 178 Table 3.5.8. Crop Productivity before and after PIM 179 Table 3.5.9. Assessment of Impact of PIM 179 Figure 1.2.1. Change in Rural Poverty 1983-2000 17 Figure 1.2.2. Change in Urban Poverty - 1983 – 2000 17 Figure 2.5.1. Structure of the Irrigation Department 114 Figure 2.5.2. Structure of the Department of Water Resources 115 Figure 3.2.1. Irrigated area under major , medium, and minor irrigation in AP 123 Figure 3.2.2. Schematic map showing major and minor distributaries in KDS 133

vi
Acknowledgement We are thankful to Dr Kishor Goswami who worked as research analyst on the project for a short term for meticulously crosschecking the survey data and calculating poverty figures in Andhra Pradesh (AP). Thanks are due to several government officers in AP and MP (Madhya Pradesh) for providing support during field work and all the level officials, academia, NGOs and representatives of farmers who interacted with the study teams at different points of time. Thanks are also due to all the librarians, government officials and academia who helped us in identifying literature sources and other documents. We are thankful to Dr. Ranjitha Puskur, Special Project Scientist, IWMI, for her valuable suggestions in the preparation of this report. Contribution from Deeptha Wijerathne and Sunil Thrikawala in quantitative analysis is also gratefully acknowledged. This work is carried out in collaboration with national partners, SRIJAN in Madhya Pradesh and IRDAS (Institute of Resource Development and Management) in Andhra Pradesh. We are thankful to Mr. P Narayana, Mr. M Surender Reddy and Mr. B Ram Kumar for their help and comments. Ms. R Navanitha, apart from providing secretarial assistance, provided help in analysis of data. We record our deep appreciation and thanks to her.

1
Study Background
Agriculture in India as a whole has made remarkable progress over the past three decades. The average annual growth recorded in agriculture and allied sectors (forestry, and fishing) during the post reform years 1992-93 to 1999-2000 was 3.9 percent compared to 3.6 percent in the period 1980-81 and 1991-92 (at 1993-94 prices). Even if growth in food grains, the most dominant segment of crop agriculture, decelerated from 2.9 percent to 2 percent in the post reform period (while population growth rate is 2.1 percent, according to the population census of 2001), there has been a high growth maintained in wheat (3.6 %) and even rice (2.2 %) leading perhaps to the problem of excess stock of food grains (nearly 44 million tons). Robust growth in food grains production, despite below-normal rainfall in some regions, characterized 1999-2000, yielding a record food grains output of 208.9 million tons (GoI 2001). During the last 10 years (1990-2000), food grains area has ranged from 123 million hectares to 130 million hectares, the inter-year variation being influenced by weather conditions.
Despite these achievements, the productivity of a large part of irrigation systems remains severely constrained by inadequacy of some or all inputs. Such low-productivity areas are characterized by persistent rural poverty. The distribution of the benefits from irrigation development is thus largely skewed and unequal. While the determinants of low productivity are numerous and complex, they are to a large extent associated with poor performance of many of the established irrigation systems, which causes low, inequitable, and unreliable water supplies in those areas1.
The overall goal of irrigation development in India has been the improvement of national food security, rural and agricultural development and economic growth. Starting from the First Plan period, huge investments in canal irrigation have been made to achieve these objectives and important results were no doubt obtained. Irrigation has become the ‘prime engine’ in agricultural production and significant strides have been made in poverty reduction. Yet, entrenched pockets of poverty persist in many states, which raises serious questions about intervention strategies in the face of systemic poverty. Though the importance of irrigation is well recognized by several studies, irrigation-poverty linkages have not been studied in a greater depth.
However, over a period of time it is increasingly felt that investments in irrigation systems alone were not enough; the management of systems was crucial too. It became apparent that the operation and maintenance of the irrigation system and allocation of available water largely determine irrigation performance and the extent to which the objectives of irrigation development are being met. Research has shown that in India, irrigation performance of large and medium scale irrigation projects in general, has been poor. Historically, these systems have been managed by the state with little participation of the users. Irrigation administration has become highly centralized and supply-oriented at the discretion of government agencies. In order to improve irrigation performance in India, irrigation sector reforms have been taken up since the last decade, decentralizing management and devolving power to the users concerned. The effects of these changes on the efficiency and equity of water use are not yet clear: especially with regard to poverty, the linkages between irrigation performance, management reform and poverty alleviation have hardly been assessed.
1 Low-productivity regions are located largely in the tail- end areas of government-managed irrigation systems in most parts of India. However, the level of poor performance varies from Bihar and Uttar Pradesh to the Krishna Delta System in Andhra Pradesh and Vishweshwaraiah Canal System in Karnataka.

2
Objective
The overall goal of the proposed study is to promote and catalyze equitable economic growth in rural areas through pro-poor irrigation interventions in the participating DMCs (including Bangladesh, the People’s Republic of China [PRC], India, Indonesia, Pakistan, and Vietnam). The immediate objective is to determine what can realistically be done to improve the returns to poor farmers in the low-productivity irrigated areas within the context of improving the overall performance and sustainability of the established irrigation schemes.
This report synthesizes the findings of a two-year study in India focusing on the states of Andhra Pradesh and Madhya Pradesh as part of a six-country research project led by the International Water Management Institute (IWMI) and supported by the Asian Development Bank. The central research issues in this context are “whether and to what extent irrigation development and past irrigation management practices have contributed towards achieving the broader goal of socio-economic upliftment of rural communities, and if it has not, then, what are the causes of under-achievements and how have these affected the lives of the poor in rural agricultural communities.”
In order to ensure comparability of results and findings across six countries and diverse contexts within countries, the following hypotheses were framed at the inception of the project: 1. Command areas of specific canal reaches receiving less irrigation water per ha have lower
productivity and a higher incidence of poverty. 2. Under existing conditions, small, marginal and poor farmers receive less benefits from irrigation
than large and non-poor farmers. 3. The greater the degree of O&M (Operations and Maintenance) cost recovery the better the
performance of irrigation management. 4. Effective implementation of PIM/IMT (Participatory Irrigation Management/Irrigation Management
Transfer) leads to improved irrigation system performance, which in turn reduces poverty. 5. An absence of clearly defined water allocation and distribution procedures, and absence of effective
and clear water rights (formal and informal) adversely affects the poor more than the non-poor. 6. There is scope for improving performance of irrigation systems under existing conditions, with
effective and improved institutional arrangements.
Elaborate framework for research was developed and the conceptualization and work plan was developed for the six-country study by IWMI2. The national partners were advised to follow the guidelines with some modifications as suitable to specific country contexts. These were further refined through a series of workshops at national level and a regional workshop.
The focus of the study was on selected representative low productivity irrigated areas with an emphasis on identifying and assessing a set of appropriate economic, financial, institutional governance and technical interventions at field and system levels and framework as far as they affect the poor’s access to water resources. The study employs both qualitative as well as quantitative methods of analyses though the emphasis is on in depth quantitative analysis. 2 See International Water Management Institute (2001) Inception report and draft work plan, IWMI, Colombo (mimeo).

Part—1 Poverty and Irrigation in India
1.1 Introduction
1.2 Historical and Contextual Frame
a. Rural poverty in India
b. Water and land resources of India
1.3 Poverty Alleviation Initiatives in India – An Overview
1.4 Impact of Irrigation on Poverty – Review of Evidence
1.5 Performance of Irrigation Project – An Overview
1.6 Institutional Reforms in Irrigation – An Overview
1.7 Summing Up
3
PART I
Poverty and Irrigation in India
1.1. INTRODUCTION
In spite of a substantial natural endowment of water resources in India, their utilization has remained un-even. The country as a whole is likely to reach a state of water crisis before 2025, with significant water scarcity being experienced already in some regions of the country. The economy is no longer predominantly dependent on agriculture, yet, about two-thirds of the population living in rural areas do depend on it for their livelihood. Irrigated agriculture in this context has become the ‘prime engine’ of agricultural production. Paradoxically, food grains surplus co-exists with chronic and absolute poverty. Significant strides have been made in poverty reduction both in rural and urban areas. However, entrenched pockets of poverty persist in many states which raises serious questions about intervention strategies in the face of systemic poverty.
This part of the report is in the nature of a literature survey to establish the present state of knowledge on the impact of irrigation/management on poverty, with a specific focus on irrigated commands of major and medium irrigation projects in India. This forms the first foundation component of the study.
The literature review examines previous studies on impacts of irrigation/management on poverty, and linkages between irrigation and poverty in the background of a wider canvas. While doing so, a discussion on water-related institutions, policies, regulations, water charges and recovery, water related laws are not included as they form a substantial part of the second foundation component of the studies on institutional arrangements for irrigation management in India.
The literature survey is based on published and mimeographed materials collected from several libraries and state governments and government of India offices. Interactions with a number of government officials and researchers helped us in organizing the report and synthesising diverse aspects in a coherent fashion.

4
1.2. HISTORICAL AND CONTEXTUAL FRAME
The early history of the Indian economy, ever since the colonial rule roughly through the first half of the post-independence period, was punctuated with recurring famines, droughts and floods. ‘Vagaries of monsoon’ was the explaining phrase for fluctuations in GDP. From 1970 onwards the scenario changed as the Indian economy was no longer prominently driven by fluctuations in agricultural GDP. Bad rainfall years in 1987-88 and 1991-92 did not negatively affect the GDP unlike the earlier drought years (1957-58, 1965-67, 1972-73 and 1979-80). This trend to a great measure was a result of the extensive irrigation infrastructure created in the country through massive investments, and also because of the dwindling influence of agriculture itself on the GDP. The share of agriculture which stood at 55 percent of the GDP in 1950, had dropped to 26 percent in 1999. The GDP growth rate of 3.5 percent per annum before 1973-74 improved to 5 percent per annum thereafter indicating better economic performance in the latter half of the post-independence era. However, this does not undermine the crucial importance of agriculture in the Indian economy. Though lagging behind some of the Asian ‘Tigers’, India has made impressive strides in the agricultural sector and achieved self-sufficiency in food grains production. Agriculture is still the mainstay of 60.23 percent of the population living in rural areas and it will continue to be so. Fully 46.66 percentof the rural population is self-employed in agriculture and allied activities and 13.5 percent are agricultural laborers. However, there is inter state variation among the rural poor: 38.5 percent come under self-employed in agriculture followed by 23.32 percent agricultural laborers (Pant and Kakali 2001). Thus agriculture still contributes to the lion’s share of total employment in India. Dandekar(1981), holds the view that the growing disparity between agriculture and non-agriculture sectors in per capita GDP arises primarily from the structural features of the Indian economy. Despite this disparity the population does not move from agriculture to non-agriculture. “Agriculture is the parking lot for the poor” in India (Dandekar 1994).
Growth and equity are well-recognized objectives of national policy as reflected in the Five Year Plan documents and policy statements. However, one of the most hotly debated issues in the Indian context has been whether the growth process has actually benefited the poor (Panda 2000). The theoretical and empirical explorations in development studies have long engaged the attention of academia on the distributional aspects of economic growth. This was sought to be understood in terms of the inter-relationship between economic growth, income inequality, poverty and welfare among the various regions and the constituent socio-economic groups at the national and international levels. Abundant literature on poverty-related aspects thus sprang up both at macro and micro levels. The literature on poverty-related issues can be broadly classified into four overlapping time periods: i) the initial decades of independence up to 1968, ii)the green revolution period up to 1980’s, iii) the pre-economic reform decade of 1980-1990 and iv) the post economic reform period from 1991 onwards. Contextual developments in the country, to an extent also, prompt segregation into these four periods during which the literature on poverty-related issues had continued to evolve. In the initial period, studies on inequality and poverty had a major focus on the aspects of measurement. Rich statistics have been accumulated on income and consumption ever since the National Sample Survey (NSS) started collecting data. Several of the studies were based on NSS data during that period but had to make necessary adjustments for estimation. Social scientists joined the fray by measuring poverty based on per capita calorie requirements. On the socio-economic front the thrust in the initial years was on institutional and agrarian reforms as well as expansion of the agrarian base. The principles of ‘Democratic Socialism’ saw

5
greater degrees of state intervention for the welfare of the people. The zamindari (landlord-tenant) system and the intermediary tenures, which existed during that time covering 40 percent of the cultivated area were abolished. Tenancy Laws were enacted in several states providing security of tenure to the tenant. Roughly two million agricultural co-operatives came into existence and the credit provided by them increased from 8 percent of total borrowings of cultivators in 1950 to 30 percent by the mid-1960’s (Radhakrishna 1993).
However, during this period the underlying trend of growth remained modest and was based more on area expansion than on improvement of yield. While the gross irrigated area increased from 22.6 million hectares (m ha) in 1950-51 to 32.7 m ha in 1966-67, the fertilizer consumption per hectare – an indicative index of technological change – was only 7 kg per hectare in 1966-67 (Rao 1996). By this time several studies on poverty attempted to determe the number of people below the poverty line (BPL) based on income or consumption. Ahluwalia (1978) examined the trends in the incidence of poverty for 14 different years for the time period 1956-57 to 1973-74 for India as a whole and for individual states. He adopted both Sen’s poverty index (Ps) and the traditional head count method in his analysis. Though a significant time trend was not visible, he found a statistically inverse relationship between rural poverty and agricultural performance for India as a whole. The same relationship was also observed in different states.
The next period up to 1980 was broadly the phase of the ‘green revolution’, which started in 1965 and continued through the early 90’s. Following Kuznet’s findings that income equality takes an inverted ‘U’ shape as the economy grows, some scholars claimed that the poor hardly gained from the ‘green revolution’, while many others found evidence of the “trickle down” phenomenon. Evidence on the distributional changes accompanying growth is mixed, but historical evidence for a number of countries shows only gradual change over fairly long periods. In India, the income gini coefficient remained almost constant from 1951 through 1992, with a mean of 32.6 and standard deviation of 2.0 (Li et al. 1998). The sectoral composition of growth also makes a difference for poverty reduction. Ravallion and Datt (1996) provide evidence for India that faster agricultural growth is strongly and unconditionally associated with both urban and rural poverty reduction.
Lipton and Longhurst (1989) cite the example of Indian Punjab to illustrate the dramatic transformations that have occurred with the widespread adoption of green revolution technologies. They opine that modern varieties do reach small farmers, reduce risk, raise employment and restrain food prices. Yet, the benefit in terms of poverty reduction appears to be modest. They observe that the poor are increasingly land-poor and dependent on wage labor. They argue that the benefits to the poor as consumers, (low food prices) are captured largely by their employers, who can pay lower wages. The green revolution phase was signified by desperate attempts to make a breakthrough in domestic food production. With the spread of high- yielding varieties, agricultural production showed a dramatic upward trend from 24 million tons in 1950 to 31 million tons in 1966, 43 million tons in 1972 and further 54 million tons in 1979. The gross irrigated area increased from 33 m ha in 1967 to 52 m ha in 1984 and over the same period, fertilizer consumption increased from 7 kg / ha to 45 kg / ha.
Rural poverty in India declined from 56.44 percent in 1973-74 to 53.07 percent in 1977-78. In the 70’s, strategies for poverty eradication were part of a larger belief in the importance of ‘growth with redistribution’. The production cum technology approach was supplemented by several interventions by the government to provide food and employment security to the poor. However, they remained as modest relief measures. In spite of wide ranging interventions and the green revolution, the poor appear to have

6
continued under considerable economic pressure. The per capita annual availability of food grains remained at 161 Kg during 1976-80 like in 1956-60 (Rao 1996). Although technology made an important difference for poverty reduction it was not the only contributing factor. Institutional change, sometimes responding to technological change and sometimes to government policy or social pressures, was also important. (Bussolo and O’Connor 2002).
From the early 1980s’ phase of fiscal belt-tightening and interventions, the policy moved away from redistribution and basic needs towards structural adjustments and market-oriented economies. Poverty as such was given a relatively low priority during the 1980s (Gita Sen 1999). There is ample evidence to show that the rate of decline of poverty was higher in the 1980’s than in the 1970’s. This can be attributed to higher growth in agricultural production, slower growth in food grain prices and the presence of safety nets. The safety nets are in the form of drought and flood relief programs (during the years of natural calamities) and the public distribution system (PDS) for basic commodities during the 1980’s. The GDP growth rate increased to 5 percent in the 1980s when an expansionary fiscal policy was adopted together with limited trade liberalization. However, this could not be sustained for long and led to a major balance of payments crisis in 1991. The crisis during 1991 arose out of excessive public spending and large and inefficient public sector functioning during the 1980s. Gaurav Datt (1999) estimates a mixed picture of moderate decline in urban poverty rates, but relatively unchanging levels of rural poverty after the economic reforms from 1991 onwards, which he surmises was because of a differential growth in average living standards in urban and rural areas. After 1993-94 not many studies on poverty are available. However, the latest official statistics shows that rural poverty is coming down compared to urban poverty in states like Andhra Pradesh. Detailed literature review on poverty and irrigation is presented in the following sections.

7
1.2A. RURAL POVERTY IN INDIA
Poverty is an age-old phenomenon in the Indian sub-continent. Evidences on Poverty in India in the late 18th century and 19th century vividly portray the then existing socio-economic environment and the mercenary impact of alien rule in accentuating the poverty of the masses. However, rigorous estimates on poverty started after independence. “It took 20 years for the national poverty rate to fall below – and stay below – its value in the early 1950s” (Revallion and Datt 1996). However, the absolute number of poor in the country still remains high accompanied by glaring regional imbalances.
A quick review of literature on rural poverty in general cannot be avoided here for, aspects of irrigation, agriculture and poverty are significantly embedded in the researches on rural poverty in India.
i) Early decades of independence upto 1968
There are two literature surveys on rural poverty related to the time periods of early decades of independence upto 1968 and the other upto 1980s. The first one is on poverty, income distribution and development (Sastry 1980) and the second on rural poverty (Thakur 1985). In the introduction, Sastry traces the debate on development, economic growth, income distribution and inequality in different countries and sets the stage for the literature survey on income and expenditure inequality in India. In the absence of official figures on income distribution in the early stages, several organizations and individual scholars tried to arrive at the pattern of distribution on a wider base. Some of them were based on consumer expenditure (from National Sample Survey (NSS) data) and others defined size distribution of personal incomes based on some simple hypotheses on saving behavior.
Absolute poverty adopting an objective boundary line called the BPL (below poverty line) became the frame of reference for several empirical studies measuring poverty. The BPL is defined in terms of per capita household consumer expenditure. Some of the important studies in this context often quoted are by Minhas (1970), Tiwari (1968), Ojha (1970), Dandekar and Rath (1971), Bardhan (1979). Minhas was criticized for underestimating the poor falling below the poverty line by excluding the expenditure on health and education. Dandekar and Rath’s study became controversial because of the revisions they made to NSS Consumer expenditure data of 1967-1988, and also for their use of national income deflator for the conversion of current price data into 1960-61 prices. Dandekar (1981) pointed out that their study of 1971 used the classification of the household on the basis of per capita monthly expenditure for calculating incidence of poverty, and not per capita caloric availability which was linked to the assessment of under nutrition. Ever since 1970s India has been predominantly concerned with income poverty. This began with the working group (GOI 1962) of economists set up by the Government of India to decide the extent of poverty in the country. It set the trend for defining and measuring poverty by using either income or consumption.
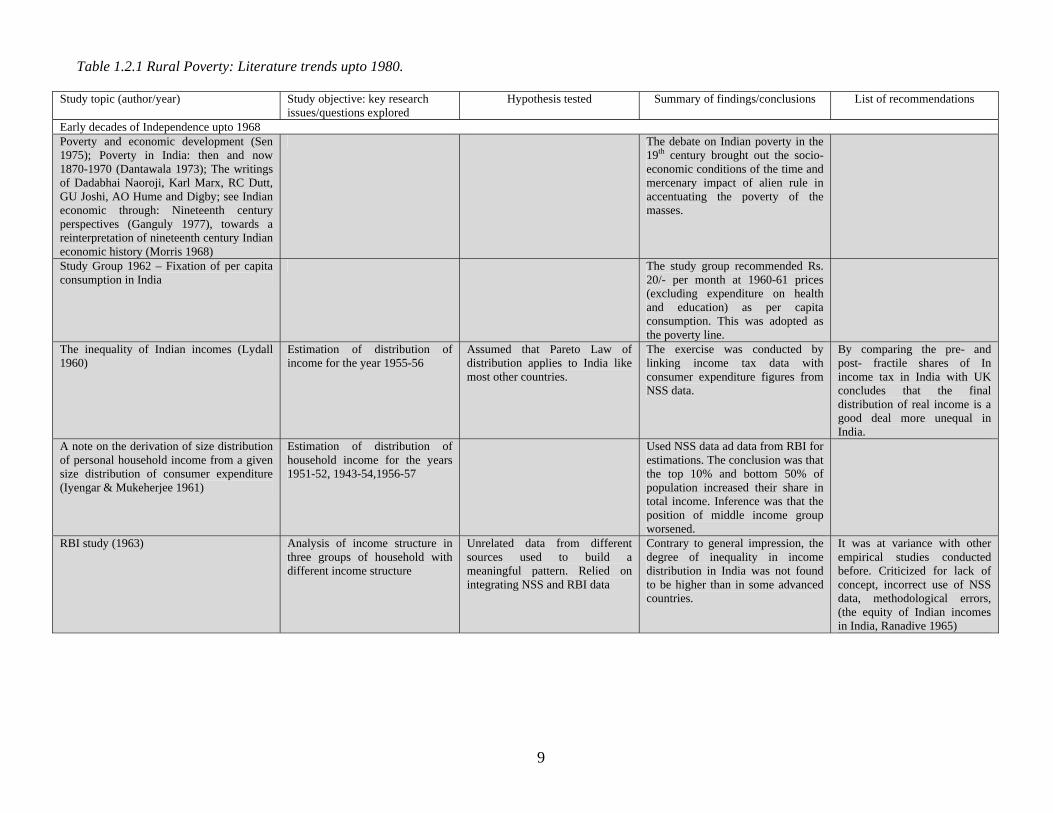
A brief annotated reference of some of the important studies pertinent to the period 1950s to 1980s is given in table. 1.2.1. The literature survey shows that the concern of researchers was more on ‘measurement’ and ‘methodologies’ for estimating poverty. While measuring poverty in the early decades, the regional variations were not taken into account by researchers in estimating prices of food items and other requirements.

8
In the 1950s and 1960s development was viewed as linked to high rates of growth in aggregate and per capita incomes by national leadership as well as aid-giving agencies. While attempting reformatory measures like abolition of Zamindari system, tenancy legislations, etc., during the First Five -Year Plan period, agriculture got a clear policy direction which to an extent benefited the poor. However, ‘trickle down’ theory fortified the approach of aggregate growth. The assumption was that reduction of poverty could only be tackled after a certain level of attainment of GDP (Graffin 1976).
9
Table 1.2.1 Rural Poverty: Literature trends upto 1980.
Study topic (author/year) Study objective: key research issues/questions explored
Hypothesis tested Summary of findings/conclusions List of recommendations
Early decades of Independence upto 1968 Poverty and economic development (Sen 1975); Poverty in India: then and now 1870-1970 (Dantawala 1973); The writings of Dadabhai Naoroji, Karl Marx, RC Dutt, GU Joshi, AO Hume and Digby; see Indian economic through: Nineteenth century perspectives (Ganguly 1977), towards a reinterpretation of nineteenth century Indian economic history (Morris 1968)
The debate on Indian poverty in the 19th century brought out the socio-economic conditions of the time and mercenary impact of alien rule in accentuating the poverty of the masses.
Study Group 1962 – Fixation of per capita consumption in India
The study group recommended Rs. 20/- per month at 1960-61 prices (excluding expenditure on health and education) as per capita consumption. This was adopted as the poverty line.
The inequality of Indian incomes (Lydall 1960)
Estimation of distribution of income for the year 1955-56
Assumed that Pareto Law of distribution applies to India like most other countries.
The exercise was conducted by linking income tax data with consumer expenditure figures from NSS data.
By comparing the pre- and post- fractile shares of In income tax in India with UK concludes that the final distribution of real income is a good deal more unequal in India.
A note on the derivation of size distribution of personal household income from a given size distribution of consumer expenditure (Iyengar & Mukeherjee 1961)
Estimation of distribution of household income for the years 1951-52, 1943-54,1956-57
Used NSS data ad data from RBI for estimations. The conclusion was that the top 10% and bottom 50% of population increased their share in total income. Inference was that the position of middle income group worsened.
RBI study (1963) Analysis of income structure in three groups of household with different income structure
Unrelated data from different sources used to build a meaningful pattern. Relied on integrating NSS and RBI data
Contrary to general impression, the degree of inequality in income distribution in India was not found to be higher than in some advanced countries.
It was at variance with other empirical studies conducted before. Criticized for lack of concept, incorrect use of NSS data, methodological errors, (the equity of Indian incomes in India, Ranadive 1965)

10
Patterns of income distribution and savings (Lokanathan 1967)
Size distribution of income for the country as a whole was estimated. Study income distribution was conducted in 1960 and study on savings in 1962 and both were put together
Results of the two studies showed that upto 1% of the rural households had a per capita income which was 12 times the per capita income of the poorest 5% of the households. A similar pattern was observed for urban areas also.
Pattern of income distribution in India 1953-54 to 1959-60 (Ranadive 1968)
Study on trends in income distribution Kuznet’s hypothesis 1. The income structure in India is comparable to that in other under- developed countries. Greater income inequality observed in India also compared to developed countries.
2. Ten years of planning had no impact on the income tax structure narrowing inequalities.
Distribution of Income: Trends since Planning (Ranadive 1971) mimeo as quoted in (Sastry 1980)
Estimation of various measures of inequality for income and consumption expenditure
Measures of inequality covered were (i) the concen-tration ratio (ii) standard deviation of logarithms (iii) Co-efficient of variation and iv) share of lower and higher deciles
The study covered income and expenditure separately both for rural and urban areas separately.
A configuration of Indian Poverty. Inequality and levels of living (Ojha 1970)
Poverty Estimations Adopting calorie norm of Rs. 2,250 per capita, the study assumes 66% of the calories obtained from food grains, cereals and pulses in urban areas and 80% in rural areas.
The study looks at both rural and urban poverty for the year 1960-61 and at rural poverty for the year 1967-68.
Concludes that 70% of the rural population for the year 1967-68 were below the level of minimum food grain consumption. The study excluded expenditure on health, education and housing.
Poverty in India (Dandekar 1971) and Nilakanth Rath .
Estimation of poverty, review of developments and future projections and policies.
Used NSS data without corrections. Asserts that the growth of economy was slow and small gains of development were monopolized by richer sections. Cautioned at the possible widening gulf between rich and poor.
It was estimated that in 1960-61, about 33.12% of rural population and 48.64% of urban population lived on diets inadequate in terms of calories. Rich have to bear the burden if solutions to poverty are viewed from the framework of private property.
On the minimum level of living of rural (Bardhan 1970).
Estimation of poverty Time series profile of the rural and urban poor showed a sharp rise in incidence of poverty over time.
The findings were in contrast to those of Minhas,. Main objection to the study was for using agricultural labor consumer price index for deflating the consumption of rural poor.

11
Rural poverty land distribution and development (Minhas B S 1974)
Estimation of poverty. Based on figures recommended by 1962 study group. Estimated that the poor decreased from 173 million in 1956-57 to 154 million in 1967-68. He took lower figure of Rs. 200 per annum (BPL) for rural population.
Expenditure on health, education were not taken into account and hence the estimates were criticized as under estimates.
Inequality and poverty in rural India (Bhatty 1974).
Incidence of poverty among different rural occupational groups.
Adopting both Sen’s poverty index and also the head count quantified incidence of poverty at different levels of per capita monthly income at 1968-69 prices. The study used survey data of National Council of Applied Economic Research.
Shows that the incidence of poverty is severe among agricultural laborers and least among non-agricultural work force in villages.
Estimates of population figures of BPL were lower like Vaidyanathan’s (1974), when compared to Dandekar & Rath (1971) Minhas (1970) and Ojha (1970).
Poverty in rural India: A decomposition analysis (Padmaja Pal et. al 1986).
Assessing incidence of poverty among different sections of population in rural India.
Based on 28th round NSS household budget data relating from October 73 – June 74.
The contributions of different categories to the overall poverty in rural areas were computed using head count ratio and as decomposable units as worked out by Chakravarthy (1984).

12
ii) The Green Revolution period upto 1980
It was argued by Tyagi (1982) that, the estimates of poverty during 1960’s were ‘overestimates’ which got moderated over the years and they cannot be taken at their face value. His analysis cautioned against the erroneous tendency to arrive at conclusions in establishing the relationship between the trends in rural poverty and agricultural growth in the country based on such figures. Contrary to what was deduced from NSS data by some experts, agricultural growth certainly had a positive impact on rural poverty. The spectacular success of green revolution and the mounting evidence of its short-term and long-term impacts, which was clearly perceptible during that period, drove the policy makers to focus on technology-based strategies thereafter. The production cum technology approach to agriculture supplemented by various policy measures like food and employment security to the poor, several targeted and area development programs improved the economic scenario of the country. Income poverty declined significantly between the mid-1970s and end 1980s, the period when India had a higher and stable trend rate of agricultural growth. Interestingly, green revolution could not however bring in higher growth rates of different crops except wheat and rice. In fact, the growth rates were less in post-green revolution period (1966-85) than in the pre-green revolution times (1950-65) Hanumanth Rao et.al ,(1988) attribute this trend to the fact that green revolution was effective with only some high yielding crops confined to some areas and was unable to compensate for the slowing down trend in the expansion of area under crops. The green revolution has helped agricultural growth undoubtedly, but government initiatives were not commensurate with growth to distribute the benefits equitably. Its impact was first felt in the states of Punjab, Haryana and Western Uttar Pradesh and later on gradually spread to the southern states of Andhra Pradesh and Tamilnadu.
Researches on poverty continued during this period bringing in more refinements in measurement and tools. Two of the important time series studies during this period were by Ahluwalia (1978) and Dutta (1980). The paper by Ahluwalia establishing relationship between rural poverty and agricultural performance, triggered off several empirical researches on the subject. Inverse relationships were observed in between the two variables, thereby asserting the ‘trickle down’ mechanisms. Based on the evidence from all over the country the findings of Ahluwalia’s study were as follows:
a. No discernable trend observed between 1956-57 and 1973-74. b. Reduced incidence of poverty was associated with improved agricultural performance
measured as an increase in the net domestic product in agriculture per head of rural population at 1960-61 prices and;
c. There was no underlying time trend in the incidence of rural poverty.
Many other studies, which followed lent support to the hypothesis while several others expressed reservations (Khan and Griffin 1979, Griffin and Ghose 1979, Bardhan 1985).
The data on net domestic product was taken in yet another study (Balakrishna 1981) for the period 1974-75 and 1977-78 for arriving at the poverty trend. This study found that the incidence of poverty was on a decline even in terms of absolute numbers during that period. The results of this study were in question because data from different sources and for different base

13
years was utilized for the calculations (Thakur 1985). This period also witnessed a great deal of interest among writers on estimates of poverty (Neelakanth Rath 1996) reminds us that “till 1962-73, due to the absence of quantity data on various items of food consumed in the annual survey reports (NSS), and subsequently due to the quinquennial surveys, scholars as well as the planning commission devised ways of updating the poverty line for a particular year to any later year in order to read off from the available, total per capita expenditure data, the poverty line at current prices and the incidence of poverty in that year.”
iii) Pre-reform decade (1980-1990)
The Government of India appointed a Task Force to work out projections of minimum needs and effective consumption demands in 1979. Their recommendations formed the basis for the Planning Commission for estimating incidence of poverty since the Sixth Five-Year Plan. Poverty lines were fixed at Rs. 49.09 per capita per month for rural areas and Rs. 56.64 for urban areas at 1973-74 prices. Thus, firstly their estimates were based on uniform urban and rural poverty lines in spite of the presence of inter-state differentials in prices within urban and rural areas, and secondly on the uniform upward revision of NSSO data (Pant and Kakali 2001). The task force recommended an intake norm of 2435 calories. However, the difficulty in adopting an all India norm was not only because of its inability to account for inter-state variations but also because of the innate variations across the states in the food habits. Hence, examination of consumer expenditure patterns statewise, to identify separately for each state to decide which consumer expenditure level satisfies a given nutritional level intake norm, was thought of as a preferred method of assessing poverty. Mundle (1983), suggested the use of multiple poverty lines along with head count, for over a period to decide BPL.
Three different poverty measures were used frequently in the literature (Martin Ravallion & Gaurav Datt 1996). They are:
1. The head count index to measure the incidence of poverty. 2. Poverty gap index to determine the depth of poverty as well as its incidence and 3. The squared poverty gap measuring the severity of poverty.
Writing on the developments on the agricultural front Rao (1996), vividly portrayed the
scenario of the decade and referred to two articles to reassert the economic view that dynamic agriculture brings in growth impulses in other rural sectors. While the initial periods of independence witnessed distributive policies as marked by land reforms; the green revolution era though, opened up opportunities for human development by achieving self-sufficiency in food grains, could not better the prospects of the poor. The period starting from 1980, however, could not offer much in terms of agricultural policy initiatives. The dominant mood of policy makers was to achieve self-sufficiency in food grains at any cost. As agriculture employs a large portion of the work force, all its policies borrowed a tinge of the anti-poverty programs (Desai 1993). However, the agricultural growth rate during 1980-90 was impressive than in any time after independence. Three factors were found to be responsible for the trend: i) Expansion of area

14
under crops because of dynamic technologies ii) more impressive yield growth for not only food crops but also non-food crops indicating wider technology diffusion and iii) food grains output increased in several less developed and under-developed areas (Sawant and Achutan 1995). Further, private sector capital formation continued to be on an upward swing throughout the decade more than off-setting the decline in public sector capital formation (Mishra and Chand 1995).
One of the important conclusions in the context of inter-sectoral linkage and sectoral composition of economic growth, however, was that “the relative effects of growth within each sector, and its spill-over effects on the other sector reinforced the importance of rural economic growth to national poverty reduction”. Both primary (agriculture) and tertiary (trade services, transport, etc) sector’s growth reduced the national poverty whereas growth in secondary sector (manufacturing) had no conspicuous impact (Ravillion and Datt 1996) and the decline of poverty from 53.07 percent in 1977-78 to 39.03 percent in 1987-88 became possible because of the public distribution system. The inflow of food grains from rural areas was considerably checked because of food grains distribution, which was the single largest factor that contributed to the decline of poverty (Tendulkar and Jain 1995). Thus, it will suffice to mention here that several tools were used in measuring poverty and several refinements were attempted to improve the data available. Following are the type of parameters often used in poverty estimations i) head count ratio for incidence of poverty ii) Gini ratio for income inequality among population, iii) income gap ratio iv) Poverty gap ratio to understand depth of poverty, v) Sen’s index and vi) FGT index of poverty for assessing incidence, depth and severity of poverty.
Robert Chambers (1988) was critical of the literature on poverty, which laid emphasis hitherto on numbers, NSS data, measurements and methods and called for a different approach to infuse a clear understanding of poverty issues from the poor themselves by adopting ‘role reversals’.
“Yes, economic growth has the potential to reduce income poverty”, wrote Shiva Kumar (2002) “but equating growth with income poverty reduction is too simplistic. True, there is an association between economic growth and poverty reduction but this association is at best weak. In the latter half of the 1980s, for example, despite rapid economic growth, income poverty did not decline. Similarly all the states recorded significant declines in income poverty from the mid 1970s to the end 1980s even though, the green revolution was limited in geographical coverage, and most states did not record any significant increase in agriculture value-added per head of rural population.”
iv) Post economic reform period (1991 onwards)
As pointed out earlier, the cumulative effect of excessive public spending in the previous decade though had brought down incidence of poverty, lead the country to an unprecedented economic crisis and large fiscal deficit. Added to this India in 1990-91 was passing through a phase of political turmoil, exhausted foreign credit resources, and inefficient functioning of public sector undertakings.
Immediate corrections were called for through economic reforms in 1991 which included fiscal, monetary and price reforms, opening-up economy to foreign investors, trade liberalization,

15
de-licensing and privatization. These macro reforms had a salutary effect on the stand-still economy.
Davendra Kumar and Kakali’s (2001) paper examined the impact of reforms on rural poverty and argued that the impact of reforms was not felt at the micro level. The paper examined the impact by using household income data from a survey of 33,230 rural households in 16 states. It was found that sharp increase of food grain and other prices as a result of input prices, the raise in the issue price of wheat and rice, and the decline of per capita expenditure on rural development programs were factors responsible for heightened poverty incidence during the first year of reforms. The argument was that any reform affecting agriculture in India would have negative results and the rise in agricultural output would always have a positive impact in reducing rural poverty. They concluded that providing irrigation facilities and other steps by the government to boost farm sector investments would go a long way in reducing rural poverty.
According to the National Human Development Report (GOI 2002) “At National Level the incidence of poverty on the head count ratio declined from 44.48 percent in 1983 to 26.10 percent in 1999-2000. It was a decline of nearly 8.5 percentage points in the ten-year period between 1983 and 1993-94 followed by a further decline of nearly 19 percentage points in the period between 1993-94 and 1999-2000. While the proportion of poor in the rural areas declined from 45.65 percent in 1983 to 27.09 percent in 1999-2000, the decline in urban areas has been from 4.79 percent to 23.62 percent during the period”. Despite achieving a higher economic growth of 6 percent annually during 1990-98, the pace of poverty reduction slowed down in the nineties says the World Development Report 2000-2002. However, the report said that more recently growth has accelerated and poverty has fallen. The report like others highlighted the marked differences in poverty incidence within the country. The report reiterated that poverty reduction would require faster growth which in turn required liberalization especially in agriculture, and better provision of physical and social infrastructure which is lacking in most deprived parts of India.
In spite of the rich data base India has, the debate on accuracy of the figures, use of deflators, reconciling different sets of data available, etc continued to figure in the literature and research for refinements. The official estimate of BPL for India’s population in 1993-94 was placed at 35 percent.
Analysing why some states in India fared better in reducing poverty, (Datt G and Martin Ravallion 1996), showed that there is no sign of trade-offs between growth and pro-poor distributional outcomes. Sound growth in rural areas stemming from State Development spending and presence of good initial physical and human infrastructure was found to be the main factor in poverty reduction as exemplified by Punjab and Haryana. The other approach was based on human resource development as typified by the Kerala experience. The study found that no state had a right mix of both the elements.
Ninan (2000) probed into the role of different factors on poverty levels using time series analysis of all India data and also cross-sectoral data for the two different points of time namely, pre-reform and post-reform period. The study pointed out that policies accelerating agricultural growth, access to PDS, infrastructure development and measures to control inflation helped poverty reduction effectively.
16
The World Bank (2000) in their report on India summarized “In the mid 1990s growth increased sharply and human development indicators continued to improve. Yet, poverty rates, even in the urban areas, declined only marginally. The inconsistencies between the National Accounts and the National Sample Survey that are used to measure poverty suggest that this may be a statistical artefact”. The report attributes higher average inflation and more rapid increase in food prices in 1990s, and agricultural sector’s inability to raise in labor demand as plausible reasons for this slowdown. It also felt that the disparity in responding to reforms by different states was the fundamental element for the impasse. The report called for among other things an immediate reform in agriculture sector. The report asserts “the issue is not reforms and stabilization, which were clearly needed to correct an unsustainable situation, but incomplete and partial reforms.” Reworking on NSS data and other sources (Deaton & Dreze 2002) a new set of integrated poverty and inequality estimates were presented in a study for India and Indian states for the years 1987-88 and 1999-2000. It endorses the view that poverty declined in the 1990s, yet proceeded more or less on similar line with earlier trends (head-count ratio). However, regional imbalances as reflected by development indicators and growth rates continued during the period. The study found no support for the sweeping claims that the nineties have been a period of ‘unprecedented improvement’ or ‘widespread impoverishment’.
The issue of poverty in the government agenda was on a low priority during 1980s. By the 1990s a new poverty agenda surfaced with the World Bank’s Development Report as a counterpart to the so called “Washington Consensus” on structural reforms (Gita Sen 1999). By this the market-led growth itself was considered as primary and the role of state and focused anti-poverty programs were felt as secondary. Now, the concept of poverty encompasses wider aspects of stakeholder participation, role of governance and livelihood concerns. Levels of income often fail to capture deprivations like – educational deprivation as can be seen in Madhya Pradesh and Andhra Pradesh though the rural poor are less; Kerala, Tamil Nadu and Andhra Pradesh though have lowest levels of child malnutrition, have lowest levels of per capita income. So also, income poverty levels cannot capture richness or poverty of human lives. It is not argued here that income does not count, it matters a lot in improving other factors associated with poverty alleviation. However, the need is to shift attention from income poverty to ‘poverty and inequality of opportunities’ – economic, social and political (Shiv Kumar 2002). Human Development Report and approaches of several aid-giving agencies on livelihoods broadened the concept of poverty beyond a narrow income definition to include dimensions of human deprivations that are critical to quality of life. The definition of poverty thus is multi-dimensional and includes access to social services, self-respect and autonomy. Participation is considered as central to poverty reduction, which encompasses elements of opportunity, empowerment and security (Maxwell et.al 2001).

17
Figure 1.2.1. Change in rural poverty, 1983-2000.
Figure 1.2.2. Change in urban poverty, 1983-2000.
Source: Planning Commission

18
1.2B. WATER AND LAND RESOURCES OF INDIA
It is well known that the availability and the extent of natural resources of a country – especially land and water – contribute to agricultural growth which is by and large accepted as the “engine of growth” for the economies of several developing countries. India has abundant natural resources, which can be harnessed for a dynamic agricultural growth process in the country.
Covering about 329 million hectares (mha) of area, India comprises different physiographic regions, namely i) the mountainous region of the Himalayas ii) the Indo-Gangetic Plains iii) the central highlands, the peninsular plateau and iv) the eastern and western coastal belts. In addition several islands also come under the territory of the country. India has a land frontier over 15,000 Km and a coastline stretching over 6,000 Km, and is the seventh largest and second most populated country in the world. The mountain ranges of Himalayas, Aravallis, Vindhyas, Sathpuras, Eastern and Western Ghats and the north-eastern ranges are the sources of its streams and rivers, which drain the waters received by rain and snowmelt across the country and joining the Bay of Bengal or the Arabian sea. The Himalayan mountains and the seas around the country influence its climate, which ranges from extreme heat to extreme cold. These climatic conditions in turn influence the distribution of water resources in the country.
i) Water Resources
Nature has bestowed bountiful water resources and sunshine in much of the landmass, which is flat and cultivable in the vast tracts of the Indo-Gangetic plains and costal areas. The land available for cultivation is estimated at 186 mha. There are 24 major rivers flowing in the country with many tributaries linking them. The river basins represent the key source of fresh water – both surface and ground water in the country. The mean annual total discharge of the rivers flowing in various parts of the country is estimated at 1879.45 Km3 (GOI 1995).
The contribution of snow and glacier melt from the Himalayas support the flows in the three main river systems of Indus, Ganges and Brahmaputra, making average yield per unit area double than that of the peninsular river systems, which are dependent on rainfall. More than 50 percent of the water resources of India are located in various tributaries of these three northern rivers. Most of the rivers in the south peninsular India like the Cauvery, the Narmada and the Mahanadi are fed through ground water discharges and are supplemented by monsoon rains thus having limited flows in non-monsoon months (Lal 2001). The long-term average rainfall figures of 117 cm in India are quite high, though they may vary in time and space (100 mm to 11,000 mm). The southwest monsoon during June to September and the northeast monsoon during November to December bring forth rains to the country often accompanied by floods and cyclone disasters.
Considering the rainfall, water availability and agro economic conditions, the Planning Commission’s approach paper to the Ninth Five-Year Plan suggested the following classification of regions in the country (Government of India 1999):

19
High productivity region: Well developed with irrigation facilities and moderate rainfall like the north-western region of Punjab, Harayana and western Uttar Pradesh or very high assured rainfall like the coastal plains.
Water abundant low productivity region: Areas of low irrigation development and low productivity of agriculture, that have high rainfall and abundant surface and ground water (middle and lower Gangetic Plains, eastern Madhya Pradesh and north-eastern region).
Water scarce low productivity region: Areas with moderate agricultural productivity and low surface and ground water availability (the peninsular India and eastern Rajasthan and Gujarat).
Ecologically fragile regions: The Himalayan slopes and desert areas of Rajasthan. Except the Ganga – Brahmaputra – Meghna systems, which contribute to more than 60
percent of India’s water resources, several of the small rivers dry up during summer months. Depleting forest cover, heavy silt concentration in rivers and reservoirs cause high flood peaks. Nearly 40 million hectares are flood prone, though not all vulnerable areas are flooded every year. On the other hand about one-third of the country is affected by recurring droughts, earlier 150 districts had been identified as drought prone. As many as 71 districts in 9 states continue to suffer severe drought even after considerable irrigation development… drought has also aggravated regional imbalances in economic development (Government of India 1999).
The National Commission on Integrated Water Resources Development Plan (NCIWRDP) worked out the basin-wise catchment area, its geographical coverage in different states and also the availability of water resources, basin-wise. However, the NCIWRDP recognised the limitations in arriving at 1,953 km3/per year as the country water resource availability. In view of different estimates made by different commissions and committees from time to time and the disparities observed in the statistics, NCIWRDP suggested that the CWC should take up further refinement of the method of assessment of water resources and collection of ‘reliable’ data pertaining to flows and utilization (GOI 1999). The following table 1.2.2 shows the extent of catchment areas of different river basins and the corresponding water resource estimations.

20
Table 1.2.2: River basins in India: catchment area, coverage and water availability.
Water resource,(km3/per year) River Basin Catchment area, km2
States covered in the basin As per CWC
1993 As per
NCIWRDP 1999 1 2 3 4 5
Indus 321,289 J&K, Punjab, Himachal Pradesh, Rajasthan and Chandigarh
73.31 73.31
Ganga-Brahmaputra-Meghna Basin:
Ganga Sub-basin 862,769 Uttar Pradesh, Himachal Pradesh, Haryana, Rajasthan, Madhya Pradesh, Bihar, West Bengal and Delhi UT
525.02 525.02
Brahmaputra sub-basin 197,316 Arunachal, Assam, Meghalaya, Nagaland, Sikkim and West Bengal
#537.24 *629.05
Meghna (Barak) sub-basin 41,157 Assam, Meghalaya, Nagaland, Manipur, Mizoram and Tripura
48.36 48.36
Subernarekha 29,196 Bihar, West Bengal and Orissa 12.37 12.37 Brahmani-Baitarani 51,822 M.P., Bihar and Orissa 28.48 28.48 Mahanadi 141,589 M.P., Maharashtra, Bihar and Orissa 66.88 66.88 Godavari 312,812 Maharashtra, A.P., M.P., Orissa and
Pondicherry 110.54 110.54
Krishna 258,948 Maharashtra, A.P. and Karnataka ##78.12 **69.81 Pennar 55,213 A.P and Karnataka 6.32 6.32 Cauvery 87,900 Tamilnadu, Karnataka, Kerala and
Pondicherry 21.36 21.36
Tapi 65,145 M.P., Maharashtra and Gujarat 14.88 14.88 Narmada 98,796 M.P., Maharashtra and Gujarat 45.64 45.64 Mahi 34,842 Rajasthan, Gujarat and M.P. 11.02 11.02 Sabarmati 21,674 Rajasthan and Gujarat 3.81 3.81 West flowing rivers of Kutch, Saurashtra & Luni
334,390 Rajasthan, Gujarat and Daman and Diu 15.1 15.1
West flowing rivers south of Tapi
113,057 Karnataka, Kerala, Goa, Tamilnadu, Maharashtra, Gujarat, Daman and Diu and Nagar Haveli
200.94 200.94
East flowing rivers between Mahanadi and Godavari
49,570 A.P. and Orissa 17.08 17.08
East flowing rivers between Godavari and Krishna
12,289 Andhra Pradesh 1.81 1.81
East flowing rivers between Krishna and Pennar
24,649 Andhra Pradesh 3.63 3.63
East flowing rivers between Pennar and Cauvery
64,751 A.P., Karnataka and Tamilnadu 9.98 9.98
East flowing rivers south of Cauvery
35,026 Tamilnadu and Pondicherry UT. 6.48 6.48
Area of North Ladakh not draining into Indus
28,478 Jammu and Kashmir 0 0
Rivers draining into Bangladesh 10,031 Mizoram and Tripura 8.57 8.57 Rivers draining into Myanmar 26,271 Manipur, Mizoram and Nagaland 22.43 22.43 Drainage areas of Andaman, Nicobar and Lakshadweep Islands
8,280 Andaman, Nicobar and Lakshadweep 0 0
# Average flow up to Jogighopa as estimated by Brahmaputra Board. * Includes additional contribution of 91.81 km3 being flow of 9 tributaries joining Brahmaputra downsteam of Jogighopa site. # # Estimate of CWC based on run-off data at Vijaywada site. ** Based on mean flow of the yield series accepted by KWDT Award. Source: Government of India, Report of the NCIWRDP (1999), New Delhi, Pg.25, 32.

21
India’s ground water resources are also vast and dispersed. The ground water resources complement the surface storages acting as regulating mechanisms for storing water in the wet season. It has been estimated by the NCIWRDP that as against annual availability of 1,953 km3 (inclusive of 432 km3/year of ground water), approximately 690 km3 of surface water and 396 km3 from ground water resources, totalling 1,086 km3 can be utilized. The estimates of the commission are on a higher side compared to those in other studies. Lal (2001) writes that India “will reach a state of water stress before 2025 when its availability falls below 1000 3 /yr”. According to Lal, the per capita availability of about 2,000 m3 i.e., 2x10³ liters of water per person per year currently estimated would drop down to 1,480 m3 in the ensuing decade.
ii) Soils and Crops
The net cultivated area in the country varies from 180 to 200 mha in different years. The latest available land use pattern figures (GOI 1998) for the year 1994-95 show that 68.39 mha and 11.24 mha of land out of the total reporting area of 284.32 mha was covered under forests and permanent pastures, respectively. The gross cropped area had increased from 131.89 mha in 1950-51 to 188.15 mha in 1994-95. The cropping intensity, which was at 111.07 mha in 1950-51 increased to 131.70 mha, with gross irrigated areas of 22.56 mha and 70.64 mha for the respective years. It is to be noted here that the increase in the gross cropped area was mainly on account of expansion of irrigation. The net irrigated area, however, was 53 mha in 1994-95.
The soils in India are classified into eight groups and their distribution among the six important groups is as follows: Table 1.2.3. Distribution of soils. Soils Area (mha) States Features Alluvial 142.5 Northern areas extending from
Rajasthan to West Bengal. Generally suitable for irrigation.
Black 60.3 Madhya Pradesh, Maharashtra, Karnataka, Andhra Pradesh, Tamilnadu and Orissa. Also found in West Bengal, Bihar, Uttar Pradesh and Rajasthan.
Have high water retaining capacity. Some of them tend to become alkaline and saline after introduction of irrigation.
Red 49.8 Tamilnadu, Karnataka, Andhra Pradesh, Madhya Pradesh, Bihar, Orissa.
Low in moisture, retaining capacity and good permeability. React well to irrigation.
Desert 14.6 Western Rajasthan Sandy and poor in fertility. Laterites 12.1 In heavy rainfall areas of Kerala,
Madhya Pradesh, Andhra Pradesh, Assam, Bihar and Orissa.
Have relatively low organic matter content, low primary minerals and an accumulation of sesquioxides.
Forest Soils 28.1 Madhya Pradesh, Andhra Pradesh, Bihar, Maharashtra .
Deposition of organic matter.
The dominant food crop grown in India is rice. It is grown in areas below sea level to
altitudes above 1,979 m. It is cultivated in irrigated as well as in rainfed irrigated conditions and also in shallow or deep water. Rice is grown mostly in Kharif and Rabi seasons. Higher yields are reported generally in the rabi season than in the kharif. An area of 22.84 percent of the gross cropped area was covered under rice during 1994-95. The second important food crop grown is Wheat. The cool winters and warm summers are conducive for a good wheat crop production.

22
The Indo-Gangetic plains – Punjab, Harayana, Jammu and Kashmir, Rajasthan and Uttar Pradesh are the areas where wheat is grown extensively. It is also grown in Bihar, West Bengal, Assam and Orissa and the north-eastern hill states. Rainfed wheat is mostly grown in Madhya Pradesh, Gujarat and Maharashtra. About 13.7 percent of the gross cropped area in the country was under wheat cultivation during 1994-95. Maize crop follows next, and its cultivation is taken up in both irrigated and rainfed conditions. It is grown mainly in Uttar Pradesh, Bihar, Madhya Pradesh, Rajasthan, Punjab and Gujarat. Maize requires deep, well drained and fertile soils. The percentage share of maize crop in 1994-95 in the gross cropped area was 3.26.
There are several other food crops grown in the country like Sorghum, Bajra, Ragi, Barley and other cereals and millets. India occupies the first place both in area and production of groundnut (Arachis hypogeae L.) in the world. About 4.24 percent of the gross cropped area in the country is covered by the groundnut crop with concentration in the states of Gujarat, Andhra Pradesh, Tamilnadu, Karnataka and Orissa. The crop grows best in sandy loams, loamy soils and in black soils with drainage throughout tropics and sub-tropics. Sugarcane (Saccharum officinarum) mostly grown in the irrigated areas of Maharashtra, Uttar Pradesh, Tamilnadu and Andhra Pradesh covered 2.2 percent of the gross cropped area in the country during 1994-95. There are other crops like pulses, condiments and spices, potatoes, onions, oilseeds, cotton, jute, mesta, tobacco and vegetables grown in several parts of the country, each according to the suitability of soils and climatic conditions. The all India production and yields of some important crops is as follows:
Table 1.2.4. Production and yields of crop. (1995-96). Crop Area
( mha
Production (in million tons)
% total production (Kgs/hec)
% coverage under irrigation
Rice 42.84 76.98 1797 49.8 Wheat 25.01 62.1 2483 85.2 Coarse Cereals 30.88 29.03 940 10.4 Maize 5.98 9.56 1595 20.5 Oilseeds 25.96 22.11 851 25 Groundnut 7.52 7.58 1007 19.9 Cotton 9.04 12.86 242 34.2 Sugarcane 4.5 281.1 67787 87.9 Source: Compiled from GOI, Directorate of Economics & Statistics, (1998):Agricultural statistics at a glance, Ministry of Agriculture, New Delhi.
iii) Irrigation development and food grains production
Development of irrigation received top priority in India soon after independence in 1947 (GOI 1972). The productive policy underlying irrigation development in the British period underwent a change and took a ‘protective’ approach after independence. Out of a total Rs. 446 crores outlay in the First Five-year Plan period Rs. 380 crores was spent on major and medium* irrigation while
* For administrative purposes government classifies irrigation projects having cultivable command area (CCA) of more than 10,000 ha as ‘major’ and those with CCA less than 2,000 ha as ‘minor’. All the other projects with CCA in between are classified as ‘medium’.

23
Rs. 66 crores was spent on minor irrigation. In the Second Five-year Plan period this trend continued with an expenditure of Rs. 380 crores, Rs. 144 crores respectively in the outlay of Rs. 524 crores. From protective criterion the policy moved to ‘benefit criterion’ during the Third Five-year plan where cost benefit assessment was required for new projects. The allocation of minor irrigation doubled. During the Second Five-year Plan and Third Five-year plan periods and the following three Annual Plans, irrigation programs were implemented in other states. The Annual period of 1966-1969 showed a clear shift towards minor irrigation. Out of Rs. 760 crores outlay, Rs. 434 crores were spent on major and medium irrigation and Rs. 326 crores on minor irrigation. The difference in the Third Five-year Plan approach was the emphasis on completion of the then existing irrigation schemes up to cultivators’ fields and tackling drainage and water logging, etc. The annual plan period 1966-1969 showed a clear-cut shift to minor irrigation, which continued during the Fourth Five-year Plan period. The Fifth Five-year Plan saw the establishment of Command Area Development (CAD) authorities and witnessed the implementation of the 20-point program set by the then Prime Minister, where top priority was given to the development of ‘irrigation potential’ and a pro-poor emphasis on marginal and small farm households (Kallur 1988).
The coming to power of the Janata Party in 1978 terminated the Fifth Five-year Plan, one year earlier than its completion, and instead a ‘Rolling Plan’ was introduced. The Government spent Rs. 1,214 crores on major and medium irrigation and Rs. 237 crores on minor irrigation. In 1980, the Congress-I regained power at the center and the ‘Rolling Plan’ came to an abrupt end in 1980. In comparison with the preceding plans greater expenditure was incurred on the development of irrigation in the Sixth Five-year Plan. An amount of Rs. 9,318 crores was spent on irrigation with Rs. 7,516 crores on major and medium irrigation and Rs. 1,802 cores on minor irrigation. New project starts were restricted considerably and greater emphasis was laid on existing projects, as there were as many as 182 major and 312 medium ongoing projects at the end of the Seventh Five-year Plan period requiring an estimated amount of Rs. 39,044 crores at the 1990-91 price level for their completion. Till the end of the Eighth Five-year Plan (March 1977) the country had spent Rs. 1,378,088.1 billion at constant prices and Rs. 500,851.3 billion at current prices levels on M & M (major and minor) irrigation projects alone (Thakkar 1999).
This pattern was continued during 1990-91 and 1991-92 Annual Plans and the Eighth Five-year Plan (1992-97). Rehabilitation and modernization of old irrigation schemes gained momentum. User participation in irrigation management received full attention along with other reforms.

24
The NCIWRDP report points the following magnitude and composition of investments through plan periods in irrigation and flood control sectors (GOI 1999).
Table 1.2.5.Public Sector investments in irrigation. (Rupees in crore at current price level).
Minor irrigation CAD Plan Major/ medium irrigation
Public sector
Institutional finance
Total finance
Flood control
Total
First (1951-56)
376.24 (7,803.42)
65.62 (1,360.99)
Negligible 65.62 (1,360.99)
- 13.21 (273.98)
455.07 (9,438.39)
Second (1956-61)
380 (6,013.98)
142.23 (2,250.97)
19.35 (306.24)
161.58 (2,557.21)
- 48.06 (760.61)
589.64 (9,331.80)
Third (1961-66)
576 (6,674.84)
327.73 (3,797.82)
115.37 (1,336.94)
443.10 (5,134.76)
- 82.09 (551.28)
1,101.19 (12,760.88)
Annual (1966-69)
429.81 (3,943.90)
326.19 (2,993.10)
234.74 (2,153.96)
560.93 (5,147.06)
- 41.96 (585.02)
1,032.70 (9,475.98)
Fourth (1969-74)
1242.30 (7,976.41)
512.28 (3,289.18)
661.06 (4,243.45)
11,73.34 (7,532.64)
- 162.04 (1,040.40)
2,577.48 (16,549.18)
Fifth (1974-78)
2516.18 (12,519.42)
630.83 (3,138.74)
778.76 (3,874.67)
1,409.58 (7,013.41)
- 298.61 (1,485.75)
4,224.36 (21,018.59)
Annual (1978-80)
2078.58 (7,949.67)
501.50 (1,918.02)
480.40 (1,837.32)
981.90 (1,388.16)
362.96 (1,388.16)
329.96 (1,261.95)
3,753.40 (14,355.15)
Sixth (1980-85)
7,368.83 (19,625.50)
1,979.26 (5,271.39)
1,437.56 (3,826.67)
3,416.82 (5,100.06)
743.05 (1,978.97)
786.85 (2,095.63)
12,315.55 (32,800.16)
Seventh (1985-90)
11,107.29 (21,207.15)
3,118.35 (5,953.87)
3,060.95 (5,844.27)
6,179.30 (11,798.14)
1,447.50 (2,762.85)
941.58 (1,797.76)
19675.67 (37,566.77)
Annual (1990-92)
5,459.15 (8,125.60)
1,680.48 (2,501.29)
1,349.59 (2,008.78)
30,30.07 (45,10.07)
619.45 (922.01)
460.64 (685.63)
9,569.31 (14,243.32)
Eighth (1992-97)
21,071.87 (31,057.63)
6,408.36 (9,445.22)
5,331.00 (7,857.31)
11,739.36 (17,302.52)
2,145.92 (3,162.85)
1,961.68 (2,493.35)
36,648.83 (5,4016.36)
Total upto the end of 8th plan at current prices
52,606.25 (132,389.93)
15,692.83 (39,492.89)
13,468.77 (33,895.77)
29,161.60 (73,388.66)
5,418.88 (13,385.66)
4,856.67 (12,222.39)
91,943.40 (23,1386.59)
Ninth Plan (1997-2002) (anticipated at current prices)
43,034.96
9,314.84
-
-
3,012.79
1,078.52
56,441.11*
* Public Sector outlays only Source: GOI Report of NCIWRDP (1999), Ministry of Water Resources, New Delhi.

25
The report (GOI 1999) also presents the extent of the irrigation potential created and utilized through major, medium and minor irrigation projects in India.
Table 1.2.6. Irrigation and utilization.
Plan Major/Medium irrigation Minor irrigation Total irrigation Gross irrigated area as per land
use statistics * Pot * * Utl. Pot Utl. Pot Utl. Pre-Plan 9.70 9.70 12.90 12.90 22.60 22.60 22.56
First (1951-56)
12.20 10.98 14.06 14.06 26.26 25.04 25.64
Second (1956-61)
14.33 13.05 14.75 @(8.28)
14.75 (8.28)
29.08 27.80 27.98
Third (1961-66)
16.57 15.17 17.00 17.00 33.57 32.17 30.90
Annual (1966-69)
18.10 16.75 19.00 (12.50)
19.00 (12.50)
37.10 35.75 35.48
Fourth (1969-74)
20.70 18.69 23.50 (16.44)
23.50 (16.44)
44.20 42.19 40.28
Fifth (1974-78)
24.72 21.16 27.30 (19.80)
27.30 (19.80)
52.02 48.46 46.08
Annual (1978-80)
26.61 22.64 30.00 (22.00)
30.00 (22.00)
56.61 52.64 49.21
Sixth (1980-85)
27.70 23.57 37.52 (27.82)
35.25 (26.24)
65.22 58.82 54.53
Seventh (1985-90)
29.92 25.47 46.61 (35.62)
43.12 (33.15)
76.53 68.59 61.85
Annual (1990-92)
30.74 26.32 50.35 (38.89)
46.54 (36.25)
81.09 72.86 65.68
Eighth (1992-97) (anticipated
32.96 28.44 56.60 (44.35)
52.32 (41.50)
89.56 80.76 70.64
Ninth Plan (1997-2002) (Proposed)
42.77
36.15
63.84
57.24
106.61
93.39
-
* Pot : Potential created * * Utl: Utilisation achieved @ Component of ground water Source: GOI, Report of NCIWRDP, (1999), Ministry of Water Resources. Two marked developments in M & M irrigation projects occurred in the mid-1960s. First, was the heavy investments in irrigation projects, and second was the onset of a new agricultural strategy. The acceleration of irrigation projects also coincided with the change in evaluation criteria of M & M projects from rate of return method to Benefit-cost ratio method. Some saw this as dilution of criteria while others opined that dam building activity got accelerated with changed criteria (Thakkar 1999).

26
1.3. POVERTY ALLEVIATION INITIATIVES IN INDIA – AN OVERVIEW
The topic of ‘public interventions for poverty reduction’ is being extensively researched in India. Drawing from the early community development experiences of the pilot projects in Etawah (Uttar Pradesh) and Nilokheri and Faridabad (Haryana) , a Community Development Program was launched in 1952 during the very First Five-year Plan period and later by 1963 was extended through the National Extension Service (NES) to all over the country. In tune with the objective of overall growth, the planners designed several programs during successive Five-year Plan periods. The interests of stepping up food production in the country saw the beginning of an Intensive Agricultural District Development Program (IADP), which was modified as Intensive Agriculture Area Program (IAAP) and extended to cover more districts in course of time. Agricultural universities were established and the scientists were asked to work with farmers to bring about the green revolution, subsequently. However, the rising growth rate could not ensure poverty reduction. The Fourth Plan sought to seek growth with social justice to ease the mounting tensions in the rural areas as economic gains did not percolate down to the poor strata. Schemes for the development of small and marginal farmers were worked out and administered through Small Farmers’ Development Agency (SFDA) and (MFAL), respectively. Both the schemes were merged in 1974, and were brought under the single authority of the district collector. More schemes like the Drought Prone Area Program (DPAP), Desert Development Program (DDP) were also clubbed with these programs under the District Rural Development Agencies (DRDA) created to function under the control of the collector. The tirade against alleviation of poverty continued under the Fifth Five-year Plan period. Among the schemes initiated during 1974-79 were, the National Scheme for Training Rural Youth for Self Employment (TRYSEM) and the Development of Women and Children in Rural Areas (DWCRA). The Sixth Plan (1980-85) clearly witnessed that planning had failed to mitigate the economic conditions of the poorest. It was found that small and marginal farmers, who constituted over 70 percent of landholders, held barely 24 percent of land The top 10 percent held about 51 percent of the assets while the lower 40percent possessed only 2.1 percent (Tinsikar 1985). In spite of the land reforms started in 1950s, regional imbalances in the country remained glaring, and hence, to correct the malady, the Integrated Rural Development Program (IRDP) was initiated in 1980 along with income-generating schemes such as the National Rural Employment Program (NREP) and the Rural Landless Employment Guarantee Program (RLEGP). The Seventh Plan set out a very ambitious 15-year perspective, to wipe out poverty and illiteracy in the country by 2000.
Efforts to provide wage employment as a short-term strategy for poverty alleviation has been a major component of development planning in the country. The Jawahar Rozgar Yojana (JRY) introduced in 1989 was aimed at providing wage employment to the unemployed and under-employed rural poor. This was restructured as the Jawahar Gram Samridhi Yojana (JGSY) in 1999 on a cost sharing ratio of 75:25 between center and states. The program is implemented by the Gram Panchayats and works, which result in creation of durable, productive, community assets being taken up. The secondary, objective however, is generation of wage employment for the rural poor. During the same year the Swarnajayathi Gram Swarozgar Yojana was launched amalgamating the IRDP, DWCRA, TRYSEM, MES (Million Wells Scheme) etc., into a single self-employment program. The objective of the scheme is to promote micro enterprises and help

27
the rural poor self-help groups (SHG). This scheme covers all aspects of self-employment like organization of rural poor into SHG and their capacity building, training, planning of activity clusters, infrastructure development, financial assistance through banks and subsidy and marketing support. Like JGSY, another scheme Sampoorna Grameen Rozgar Yojana (SGRY) was introduced in 2001 to provide rural employment and also food security along with creation of durable community, social and economic assets.
The other anti-poverty programs that are currently being implemented are:
Sl. Name of the program Focus 1. Employment Assurance Scheme (EAS) Starting with 1778 identified backward panchayat samithis of 257
districts in 1993, extended to 5448 panchayat samithis in 1997-98 in the country, and restructured in 1999-2000 to make it a single wage employment program.
2. National Social Assistance Program (NSAP) The program started in 1995 has three components: National Old Age Pension Scheme (NOAPS), National Family Benefit Scheme (NFBS) and National Maternity Benefit Scheme (NMBS). The scheme is to provide social assistance benefit to poor households effected by old age, death of primary bread earner, and maternity care.
3. Pradhan Mantri Gramodaya Yojana (PMGY) PMGY introduced in 2000 focuses on village level development in five crucial areas – health, primary education, drinking water, housing and rural roads with the overall objective of improving the quality of life of people.
4. Indira Awas Yojana (IAY) For construction of houses to be given to the poor, free of cost. 5. Samagra Awas Yojana (SAY) Launched in 1999-2000 it is a comprehensive housing scheme on
a pilot project basis in one block in each of the 25 districts in 24 states and one in each union territory. The aim is to ensure integrated provision of shelter, sanitation and drinking water.
6. Food for Work Program (FWP) Started in 2001, the program is extended. The aim is to augment food security through wage employment in the drought-affected rural areas.
7. Annapurna The scheme came into effect from 2001. Addressed for the food security of senior citizens who are eligible and are not getting national old age pension.
8. Krishi Shramik Samajik Suraksha Yojana From 2001, the scheme provides social security to agricultural laborers on hire and who are in the age group of 18-60 years.
9. Siksha Sahyog Yojana The scheme is meant to provide educational allowance of Rs.100/- per month to the children of parents below BPL.
The IRDP program was aimed at making the beneficiary households economically viable through self-employment so that the households cross the poverty line. There are several micro and macro-level impact studies—often throwing up contrasting findings (Dreze 1990). Four major review studies are important in this context, as they covered the entire country (Dev 1995). They were (Subbarao 1985) on the regional variations in impact of anti-poverty programs in the country and an appraisal study (Bandopadhyay 1988) on direct interventions through poverty alleviation programs. Both the studies extensively reviewed the literature on IRDP. Another study (Rath 1985), which after review of several evaluation studies, concluded that wage employment programs will be more beneficial rather than the asset-creating and self-employment programs. Self-employment schemes, however, were preferred by Dantwala (1985). Dreze recommended a serious program of employment generation with legal backing.

28
In the federal context, poverty alleviation in India is a joint endeavour of the central and state governments. While most of the schemes are centrally sponsored and financed either fully or upto 75 percent by the center, implementation is the responsibility of the states. All the programs envisaged so far can be clubbed into four groups namely:
i. target group oriented programs like IRDP, NREP etc., ii. area development programs like DPAP, DDP etc and command area
development (CAD) in the context of major and medium irrigation projects etc., iii. infrastructure development programs like MNP and, iv. public distribution.
The first group of programs were direct programs targeting the BPL families. The others
were in the nature of general development programs aimed at ‘percolation’ of benefits to the poor. It was always expected that other sectors like infrastructure development and services will provide the necessary coordination with the poverty alleviation programs. But these expectations were never realized. Those states where not only employment opportunities were created, but also infrastructure facilities were available, fared better. However, only those households closer to the poverty line and which presumably had some assets to start with could cross the poverty line. Some dents were made where public distribution system effectively operated for poverty reduction. In those states where investments were made in the earlier employment generation schemes, IRDP and JRY, the results were better at poverty reduction. This was achieved in spite of the poor record in program implementation.
Anti-poverty programs in India are under reform. As they have been attempted recently it is too early to assess their benefits. From the previous discussions on poverty and public interventions becoming the focus of irrigated agriculture in India, it can be seen that though land reforms provided the initial impetus, scope for further redistribution of land is not available in several states. Population growth and fragmentation of land has already made land resource scarce. Added to this are divisions and devolutions of land assets benami transactions, land grabbing encouraged by extremist organizations (case of AP) etc. In states where implementation of land reforms remained tardy, attention has to be given to this aspect by the governments in the interests of equity and poverty alleviation. However, states like West Bengal on the other hand, show the need for reforms in tenancy laws and land consolidation.
It is now well recognized that the ‘trickle down’ or ‘spread effect’ of growth cannot by itself reduce poverty. It is not the rate of growth which matters but the composition of growth, which determines the pace of, ‘spread effect’. The pace in turn is effected by the availability of infrastructure as a precondition, and also the absorption capacity of growth opportunities by the poor. Income generation interventions and creation of employment opportunities also call for creation of a certain level of infrastructural facilities and access to assets in a wider connotation. Though IRDP made an impact in some states, evidence shows that only the poor closer to the poverty line got benefited and poorer and poorest among the poor could not reap any benefit. Design of more poverty alleviation programs is needed for its ability to address the relative poor population. Though literature shows that the poverty in rainfed areas is more when compared to areas of irrigated areas, poverty still persists in irrigated areas. We argue that the poverty in long

29
established irrigated areas showed less intensity and spread compared to new irrigated areas. The plight of the marginal farmers in irrigated areas small and marginal farmer, and also agricultural laborers in rainfed areas, has not bettered in spite of several interventions that the government attempted from time to time. Attention on agricultural development with a clear agricultural policy and a deliberate policy of income and occupational diversification is called for.
Researchers suggest direct economic transfers to the poor by duel pricing as reflected in the public distribution system for poverty alleviation. Subsidies and distribution of renewable resources also are very important. Distribution of the renewable natural resource – water – plays a major part in poverty reduction in irrigated agriculture.
There are no special pro-poor programs or policies in irrigated agriculture. The allocation of irrigation among different sizes of farm holdings in the northern states of Punjab, Harayana and Uttar Pradesh is guided by the practice of warabandi (osrabandi in Uttar Pradesh) where available water is allocated in direct proportion to the area of holding and by turn and time. Thus, it is neutral to land holding size. In the South Indian states also, the out come is same though warabandi is not practiced. Explicit promotion of the interests of landless labourers in irrigation allocations is not present in any public irrigation system. They are supposed to get benefited indirectly through anticipated rise in demand for their services.

30
1.4. IMPACT OF IRRIGATION ON POVERTY: REVIEW OF EVIDENCE
The research on irrigation in India started with writings on ‘technical’ aspects in a ‘mono-disciplinary’ style and remained so till the early seventies (and they continue today also). In the early seventies two trends were witnessed in the literature. On one hand it was exposing the poor performance of irrigation projects based on practical experience of the authors, and on the other hand there was hardly any literature on concrete project experiences on which such opinions could be based. Then came the contributions of Robert Wade and Robert Chambers on several aspects of project performance and water management based on field experiences, which broadened the knowledge and understanding in irrigation management. Several micro and macro level studies conducted by eminent economists brought out the importance of irrigation in the process of agricultural development. (Vaidyanathan et al. 1994; Rath and Mitra 1989; Dhawan 1988; Gadgil 1948). Literature, which followed was rich and diverse. Around this time when irrigation management literature was developing, social scientists were also stimulated “to concentrate on interaction between the change in society and newly introduced irrigation” (Jurriens, R and Kornalis de Jong 1989). In this scenario some researchers worked on social processes like conflict management, state influence and collective action etc., and others on economic processes like income generation, production and consumption and their spatial and temporal distribution. But there was practically not much of literature generated on poverty and irrigation in India. Always, irrigation has been viewed as a crucial input for increasing agricultural production and there by food grains self-sufficiency in the country. Large investments were made in India for the development of new irrigation projects and also for the improvement of existing ones. Significant reduction in poverty in the country is attributed to the availability of irrigation which enhanced agricultural production and uptake of modern farm technologies namely, high yielding seeds, fertilizers and pesticides as a sequel (Ray; Rao and Subba Rao 1988). Irrigation development further, provided additional employment opportunities and also boosted up the wage rates for agricultural laborers (Dhawan 1991; Ray 1992; Vaidyanathan 1994; Reddy 1995).
Thus, increased crop production and productivity and additional labor absorption and increased wage rates because of irrigated agriculture, in turn impact the poor positively with increased food availability at cheaper prices and increased incomes. Also, the income from the increased agricultural production is believed to find investment in diversified cash crops and industry, generating more income and employment. There is abundant literature on the impacts of irrigation in India. At the instance of the Government of India and several state governments a number of impact assessment/evaluation studies were conducted in various command areas of large and medium irrigation projects. Several academic institutions and individuals also engaged themselves in studies on irrigation impact and development. The reports of various commissions and committees appointed by central and state governments from time to time form yet another source of literature on the subject. International funding agencies like World Bank and DIFD etc., undertook appraisal and evaluation studies separately, and advisory bodies like the Planning Commission and Central Water Commission conducted studies at different points of time.

31
Fan and Hazell (2000), tested the hypothesis that increased public investment in many less-favored areas may have the potential to generate competitive if not greater agricultural growth on the margin, compared to investments in many high-potential areas. They tested to see if these investments could have a greater impact on the poverty and environmental problems of the less-favored areas in which they are targeted. Using district-level data for India from 1970-95, they found that for every investment, the highest marginal impact on agricultural production and poverty alleviation occurs in rainfed lands followed by irrigated areas.
An additional Rs. 1 million of expenditure would raise 7 poor people above the poverty line while the same amount of investment on roads would uplift 165 people above the poverty line. Public irrigation also has the third largest impact on productivity growth; an additional Rs. 1 billion would add 0.56 percent to the growth rate. Public irrigation plays a catalytic role in stimulating additional private investment in irrigation, but most of its impact on poverty is through the increased productivity it fosters (Fan et al, 1999). They conclude that additional government spending on irrigation and rural electrification will have little or no effect on either poverty or growth at this point in time. They suggest that only enough should be invested to maintain current levels of irrigation and power. While government spending on rural development (such as IRDP and RES) is an effective way of helping the poor in the short term, it now has little impact on the growth of agricultural productivity.
Most of the literature on irrigation impacts in India can be grouped into five broad segments: i) In-depth research work based on practical experiences initially and later on empirical evidence collected from household surveys both at micro and meso level. ii) Analytical studies which are generally at macro-level based on secondary data obtained from the NSSO, National Council of Agricultural and Economic Research (NCAER) agricultural census, fertilizer census etc. iii) Reports of various commissions and committees of government and also reports of various funding agencies. These reports are highly analytical and draw data from several sources to arrive at policy recommendations. iv) Consultancy reports and sponsored assignments of government on command area development (CAD) projects of irrigation projects. While evaluating the CAD performance they also shed light on the impact of irrigation on production, income and other parameters like household assets, education, consumption expenditure of households and; v) the last set comprises generalistic newspaper articles and stories of human interest. Majority of such writings provide information both on positive and negative impacts of irrigation.
The impacts of irrigation are grouped and discussed here under the following headings: i) yield, output and income impact ii) stabilization of agricultural production and drought proofing iii) other impacts. The present review is limited to canal irrigation only. We have not dealt in detail other aspects like health, education and other socio-economic parameters or ground water resource, except for some references for comparison and overall comprehension.
Output and Income impacts
Rise in the yields of crops under irrigated conditions has been asserted by several studies. When applied in combination with required fertilizer, pesticides and HYV (hybrid variety) seeds the output was found to be manifold. It was estimated (Dhawan 1986) that the land productivity is 2

32
to 3 times in canal irrigated land and 3 to 5 times in well irrigated farm lands compared to rainfed agriculture. The study showed that in Gandak (Bihar) and Sarada Sahayak (Uttar Pradesh) irrigated commands there was a production increase of 137 percent and 148 percent, respectively. Based on the study of trends in four states it was found that the coefficient of variation in crop areas was 1.9 in irrigated lands and 2.9 in un-irrigated lands, while that of the yield was 4.3 in irrigated farms and 9.3 in un-irrigated farms. According to NCIWRDP (G0I 1999), the national average yields in 1991-92 for all food grains under rainfed and irrigated conditions were 1.0 and 2.33 tons/ha respectively.
Dhawan (2000) dismissed the criticism that canal farmers in India had benefited little from canal waters and benefits from canal irrigation were not commensurate with canal costs. Drawing evidence from his earlier book (Dhawan 1988), he asserted that national overall irrigated yield was a good proxy of irrigated yield for the entire canal network in India. The article elaborated on several incidental benefits of canal irrigation which were akin to primary benefits, and which should be treated as such for monetary evaluation, while discussing cost-benefit analysis of irrigation projects. The incidental benefits were: i. increased income and output as a result of irrigation, which enhanced income and trade and
processing activities, respectively. ii. irrigation improved the ground water resources, which became an important element in
agricultural production. iii. irrigation reduced the instability, which was persisting in farm economy. iv. irrigation waters also served several other purposes namely, drinking water, hydel power
generation etc. v. employment benefits of irrigation were clearly noted during construction phase as well as
subsequently in farm activities in irrigated agriculture.
Dhawan (1988), in his elaborate work on irrigation in India’s agricultural development, provides some methodological contributions for measurement of output and stability of irrigated agriculture. He used the official data available from different sources and analyzed the pattern at different points of time and for different states. Inter-state differences thus provide a comparative framework for obtaining insights into the role of irrigation, in the absence and impracticability of having generalized an all India analysis. He cautions that though a broad conceptualization of contributory role (pure irrigation effect) is possible, it cannot be measured satisfactorily in actual practice.
One of the impacts of irrigation is on the intensity of cropping – single crop, double crop or year round cropping (in percentage terms 100%, 200% and 300%, respectively). For appraising cropping intensity the author suggests that regional variations have to be reckoned with and identification of crops by season becomes necessary. He also estimates that for the country as a whole, “one percentage point rise in irrigation availability may be accompanied by only half a percentage point rise in intensity of cropping”. Positive yield impacts of irrigation are commonly observed when irrigated yields are compared with un-irrigated yields. When in some cases any contrary trend is observed it is necessary to examine whether soil and climatic conditions are similar between the areas compared and whether the yield pertains to different crop seasons of the

33
year. The other impact of irrigation is in altering cropping pattern oriented to market. However, it is a misconception to assume irrigation by itself will change the crop pattern of food grains to non-food grains. The policies of government, technology, irrigation system design and several other factors come to play in deciding crop pattern by the farmer.
The next impact of irrigation is on area and output. Dhawan, in this context, highlights the total crop area effect of irrigation. The impact of irrigation can be clearly seen from the overall contribution of increased irrigated area in food grain production. The water-related statistics of CWC shows the following increases between 1950-51 and 1993-94.
Table 1.4.1. Irrigated agriculture and food grains production.
Particulars Unit 1950-
51 1993-94
Gross sown area under crops m ha 131.9 186.4 Gross sown area under food grains m ha 97.3 124.7 Gross irrigated area under all crops m ha 22.6 68.4 Gross irrigated area under food grains m ha 18.31 48.247 Gross un-irrigated area under food grains m ha 78.98 76.453 Food grain production tons 50.8 134.2 Food grains yield under irrigation tons/ha - 2.33 Increase in irrigated area between 1950-51 and 1993-94 m ha 26.63 Contribution of food grains from addl. Irrigation tons 69.7 Percentage contribution of irrigated area in food grain production % 52
Source: CWC, water-related statistics (1998) as quoted in GOI report of NCIWRDP (1999).
Benefits from irrigation result in a number of ways and on-farm income is of major importance. From the cost-benefit viewpoint of farmers, it is the surplus of their gross receipts over their costs of cultivation. When assessed at shadow prices it reflects the social cost-benefit. Dhawan (1988), calculated the following differential income impact of providing irrigation to a dry crop per hectare (statistics pertain to the end of seventies valued at 1970-71 price level): Indus basin – Rs. 1,723, Gangetic basin – Rs. 2,000, South India – Rs. 1,850, Deccan Plateau – Rs. 4,430.
Rane’s work (1981) in two villages near Delhi, one irrigated and the other un-irrigated, indicated that people under BPL category are significantly more in un-irrigated areas when compared to irrigated areas. Taking minimum nutritional levels required which are valued at 1980 prices and calculated at Rs. 1,600 per annum, the author used Lorenz curve and Gini-ratio techniques for analysis of the data collected by a survey. Taking the per capita income as basis he found there was need to classify population below the poverty into two categories - more backward (un-irrigated areas) and backward (irrigated areas) for pro-poor interventions. A quick summation of several of the recent CAD evaluation studies conducted in India showed marked difference between per hectare yields and incomes of households in irrigated and un-irrigated commands. The difference between irrigated and rainfed household farms’ productivity was striking. It may be noted here that table 1.4.2 shows the trend only and not the precise quantum in a certain year of reference. There was also the problem in choosing control villages; some studies took the villages within the irrigation project but not covered by CAD, some others outside. Some studies had the pre-irrigation data while others did not. However, the results help us in drawing inferences.
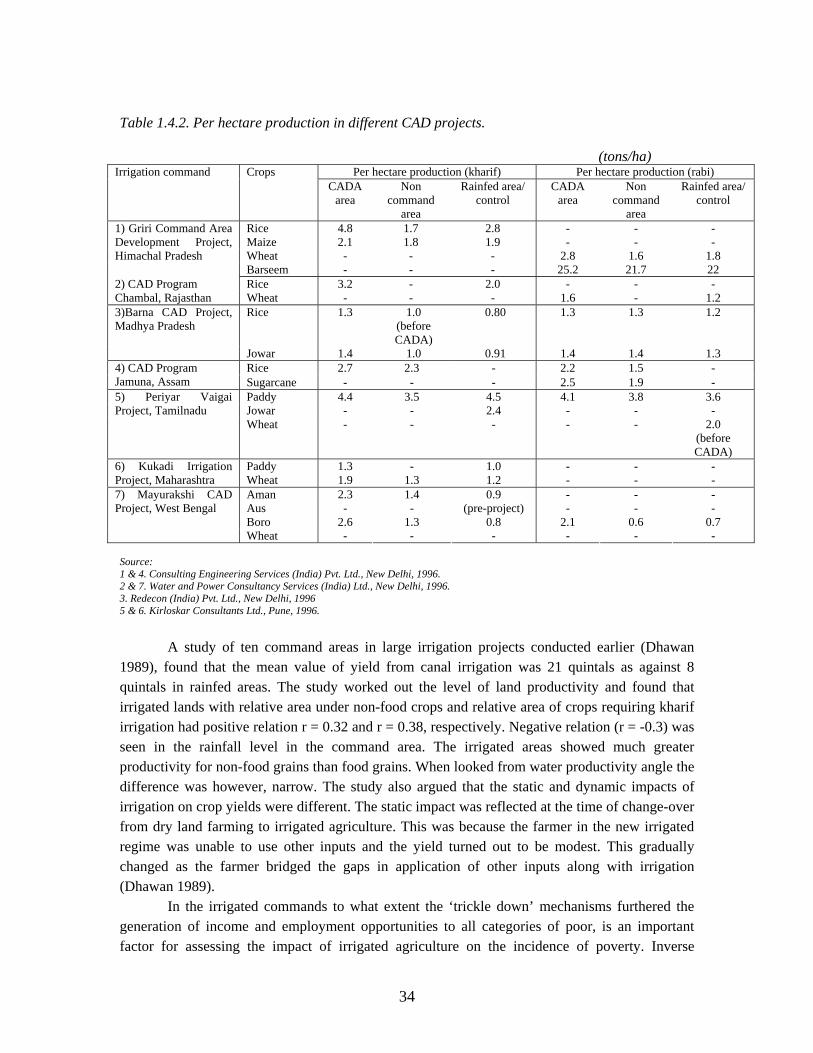
34
Table 1.4.2. Per hectare production in different CAD projects.
(tons/ha)
Crops Per hectare production (kharif) Per hectare production (rabi) Irrigation command CADA
area Non
command area
Rainfed area/ control
CADA area
Non command
area
Rainfed area/ control
Rice 4.8 1.7 2.8 - - - Maize 2.1 1.8 1.9 - - - Wheat - - - 2.8 1.6 1.8
1) Griri Command Area Development Project, Himachal Pradesh
Barseem - - - 25.2 21.7 22 Rice 3.2 - 2.0 - - - 2) CAD Program
Chambal, Rajasthan Wheat - - - 1.6 - 1.2 Rice 1.3 1.0
(before CADA)
0.80 1.3 1.3 1.2 3)Barna CAD Project, Madhya Pradesh
Jowar 1.4 1.0 0.91 1.4 1.4 1.3 Rice 2.7 2.3 - 2.2 1.5 - 4) CAD Program
Jamuna, Assam Sugarcane - - - 2.5 1.9 - Paddy 4.4 3.5 4.5 4.1 3.8 3.6 Jowar - - 2.4 - - -
5) Periyar Vaigai Project, Tamilnadu
Wheat - - - - - 2.0 (before CADA)
Paddy 1.3 - 1.0 - - - 6) Kukadi Irrigation Project, Maharashtra Wheat 1.9 1.3 1.2 - - -
Aman 2.3 1.4 0.9 - - - Aus - - (pre-project) - - - Boro 2.6 1.3 0.8 2.1 0.6 0.7
7) Mayurakshi CAD Project, West Bengal
Wheat - - - - - - Source: 1 & 4. Consulting Engineering Services (India) Pvt. Ltd., New Delhi, 1996. 2 & 7. Water and Power Consultancy Services (India) Ltd., New Delhi, 1996. 3. Redecon (India) Pvt. Ltd., New Delhi, 1996 5 & 6. Kirloskar Consultants Ltd., Pune, 1996.
A study of ten command areas in large irrigation projects conducted earlier (Dhawan 1989), found that the mean value of yield from canal irrigation was 21 quintals as against 8 quintals in rainfed areas. The study worked out the level of land productivity and found that irrigated lands with relative area under non-food crops and relative area of crops requiring kharif irrigation had positive relation r = 0.32 and r = 0.38, respectively. Negative relation (r = -0.3) was seen in the rainfall level in the command area. The irrigated areas showed much greater productivity for non-food grains than food grains. When looked from water productivity angle the difference was however, narrow. The study also argued that the static and dynamic impacts of irrigation on crop yields were different. The static impact was reflected at the time of change-over from dry land farming to irrigated agriculture. This was because the farmer in the new irrigated regime was unable to use other inputs and the yield turned out to be modest. This gradually changed as the farmer bridged the gaps in application of other inputs along with irrigation (Dhawan 1989).
In the irrigated commands to what extent the ‘trickle down’ mechanisms furthered the generation of income and employment opportunities to all categories of poor, is an important factor for assessing the impact of irrigated agriculture on the incidence of poverty. Inverse

35
correlation is often found between output and income on one hand and the rural poverty on the other (Fan et al. 1999). This was discussed at length in the earlier section on rural poverty from the researches of several economists in India.
Employment impact
Introduction of irrigation invariably brings forth improved absorption of labor in agriculture with higher wage rates. The increased demand for labor is caused in view of the intensive farm management requirements like number of waterings, weedings, application of fertilizers etc.’ increased cropped area, shift to more labor-intensive cash crops, increased work requirements, etc., (Kallur 1988). The manpower use per hectare was almost three times in irrigated agriculture as compared to non-irrigated agriculture (46.19 and 16.39, respectively). Further, the gross receipts per man-day of agricultural laborers was higher by 85.2 percent in the irrigated areas of Rajasthan canal project (Roy 1983). A review of literature on the social impact of canal irrigation (Kishore 2002) covered the studies of Satpathy (1984) in six villages of Orissa where canal irrigation was reported to have increased employment man-days especially more in marginal farm holdings, and the other study by A.S. Patel in Gujarat command areas. In the latter study it was found that one rupee of investment in terms of cost provided less employment to labor when irrigation was introduced than prior to irrigation, though the overall investment in labor per unit of land in irrigated regimes increased substantially. However, though the employment effect of irrigation in static framework may appear as substantive, over a period of time, the employment elasticity of output diminished from 0.62 (late sixties) to 0.35 in (mid seventies), (Dhawan 1988). Reviewing the impact of farm economy in the high rainfall area in Konkan, Dhawan (1988b), wrote that without the irrigation project, the output of each hectare of land stood at Rs. 4,800 for which 227 days of human labor was used. With the project both the numbers increased Rs.11,050 and 500 days, respectively. “Thus, labor use rise by 140 percent when the land productivity rises by 130 percent, giving an employment output elasticity of 1.08. But the value of this elasticity is below unity (0.72) for hired labor.” (Dhawan 1988b).
Two cases from India covered by CIRDAP in their study on the impact of small-scale irrigation on rural poor in Asia, was reported to have found increase of labor per acre, when compared to rainfed agriculture. It was about 188 percent for crops like tomato and chillie and 108 percent for food crops. Hired labor dominated with 52 percent in the labor requirement (Hasnip et.al. 2001).
From several micro studies abundant evidence of increased employment can be seen in irrigated agriculture. Studies in mid eighties showed that the increase in days worked on irrigation schemes was over 100 percent in comparison with rainfed situations in West Bengal (Damodar valley canals); more than 150 percent in Punjab (Ferozepur canal), 61 percent in Gujarat (Dantiwada), and over 100 percent in Andhra Pradesh (Kakatiya canal). Irrigation provides security against impoverishment. “By providing employment and incomes which are not just more in quantity, but more reliable and spaced over most of the year vulnerability is reduced” (Chambers 1985).
Trends in real wages and income of rural wage labor households is an important dimension for understanding the relationship of agricultural growth and poverty alleviation. They

36
are equally important for small and marginal farmers, because many of such farmers get considerable earnings from labor. At 1956-57 prices, the real wage rates for males increased from Rs. 1.02 in 1956-57 to Rs. 1.26 in 1964-65, Rs. 1.25 in 1977-78 and Rs. 1.66 in 1983. The real income of agricultural labor during this period increased at the rate of 3 percent per annum. However, the performance of other rural labor households was better with real income growing at the rate of 4.8 percent (Saraswat 1993). Bhalla (1995), argued that occupational diversification “builds a more effective floor to earnings than high average agricultural labor income in the greenest of green revolution areas in Harayana.”
Village voices (Epstein et al. 1998), is an interesting study of two villages in Karnataka – one with irrigation and the other without irrigation covering a time period from 1954 to 1997 at different intervals. The study focuses on rural development indicating culturally sensitive development strategies. The study shows that the irrigated village was on the way to becoming a model growth centre. Increased per capita acre productivity and extension of irrigated acreage had facilitated the land carrying capacity to accommodate increasing numbers. Villagers had a strong social identity and feeling of pride regarding their achievements. The village which had no irrigation facility became extroverted, developed social anomie and soon was likely to disappear and get absorbed as a suburb of the nearby expanding town. The growing regional economy however forced many people of un-irrigated villages to leave the villages and seek employment (professionals like doctors, teachers, lecturers etc.), while others commuted to work as mechanics, electricians and other jobs. Thus, development of canal irrigation triggered off different growth paths. Stabilization impacts Irrigation provides stabilization on three counts – crop yield, total farm output and farm income. This is viewed in terms of a certain extent of insulation against drought, though drought cannot be taken as the only cause of lower yields, output and incomes. Output depends on crop area and crop yield and their covariance, yet, output is not a guarantee to income stability for which price stabilization and price support policy is important. Given the complexity, “a priori expectation is that the impact of developing various types of irrigation on the output and crop area, when viewed in totality of the country as a whole, is bound to be considerable” (Dhawan 1985; Dhawan 1988). The study of Ray, Rao and Subba Rao (1988) showed that the standard deviation of annual aggregate crop yield and growth rates of outputs in irrigated conditions was less than half that of non-irrigated conditions. The study also showed a gain in output stability in studies conduceted in 9 out of 11 states.
Equity impact
The findings of several researchers showed that large landholders and rich farmers were greater beneficiaries of canal irrigation, accompanied by the nexus of powerful social groups and unscrupulous officials and members of public (Pant). Wade (1975), argued that concern with economic justification of irrigation projects tended to guide the thinking in terms of aggregate output overlooking the distribution aspect. He quoted van der velde’s research that land holdings

37
closer to canal outlets got better water service, and that holding location constant, big holdings receive more water per acre than small holdings. He further referred to the evidence from Reidinger’s research, which showed that holdings of larger and powerful landholders often were closest to the head reach of the water course. Jasveen (1985), pointed that large farmers in Punjab neglected the usage of canal water with the installation of tube wells, which deprived others using canal water due to non-maintenance of the entire length of water course. Thus, access to irrigation worsened forsmall farmers in the tail end. Implicit in the distribution system was the scale effect, such that the adverse consequences derived from the mode of water distribution were correspondingly greater for small-scale users. This scale bias reinforced inequalities among users. Though marginal farmers gained in absolute sense, large farmers gained proportionally much more from irrigation. The income of marginal and large farmers per hectare in a village study was found to be Rs. 2,799 and Rs. 3,498, respectively (Nadkarni 1984). Singh (1978), questioned the water subsidies of canal projects. Since irrigation facilities were not uniformly distributed among all the regions in the country, and were not equally accessible to all size groups of farmers within a region, it was argued that water subsidies would further widen the inter-regional disparities in income distribution. Water subsidies thus were untenable in view of efficiency or equity. Another equity issue comes out of non-availability of credit and inputs. In Mula command area in Maharashtra, a study (Khuspe T.S and G.K. Sawant 1978) found that 52.67 percent farmers under-utilized the canal irrigation due to non-availability of credit (78%) for purchasing farm inputs and high cost maintenance of field channels. Hooja (2000), in his study observed that the per capita income from agriculture is 5.5 times higher in big farms as compared to small size farms in irrigated areas, whereas it is only 2.5 times higher in case of rainfed villages in the Krishna Raj Sagar project area. Households from irrigated villages spent more on food and non-food items than the households in the rainfed areas. The percentage share of consumption expenditure on non-food items like education, health, clothing and travelling was relatively higher for cultivators of irrigated households. Irrigation not only brought higher prosperity but also higher inequity of incomes among cultivators. Both income and asset inequity was found to be higher in irrigated villages, but overall quality of life was also better in the irrigated villages. Irrigation management transfer to the farmers was considered as the best option to bring about equity in water distribution. However, there were several unfounded fears. Although a major concern among officials, there was no evidence to suggest that water distribution became more inequitable subsequent to transfer. In many cases equity of water distribution improved. In the early stages, the leaders seemed to have played an important role in ensuring equity. In the longer run, structures and processes put in place by the leaders are likely to provide voice to the weaker sections of the membership. The processes suggested that risk of water distribution becoming more inequitable appeared to be out of place particularly in large gravity systems, where all beneficiaries were aware of their rights. The transfer of smaller systems such as public tube wells, the access to which were at the mercy of the operator, had not necessarily resulted in equitable access. Many of these were taken over by a few individuals through fictitious organizations.

38
Selvarajan et al. (2001), in their study assessed the equity dimensions of India’s irrigation development. The focus of the study was to ascertain equity impact of irrigation development in India from 1970 through 1990 using agricultural census database covering major states and union territories. Using Theil’s Entropy Measure inter-farm size inequality in irrigation distribution in India was analyzed at all-India level as well as state level. Inequality at all-India Level was split into two constituent parts viz., - “Between States” inequality and “Within States” inequality for quantifying the sources of inequality for better irrigation policy decisions. Following the Rawisian approach, in which irrigation distribution policy is designed in favour of small farms, the expected Theil’s measure of inequality has come down substantially. Deviation of current canal irrigation distribution from Rawisian distribution indicates an index value of 0.78204 for 1990/91, which is 12 percent less than that of 1970/71 levels. Deviation of current canal irrigation distribution by proportion has declined from 0.25710 in 1970/71 to 0.17115 in 1990/91. During this period actual distribution has come closer to the normative distribution based on proportional distribution policy pursued, and this kind of a declining trend also remained consistent during the period 1971-1991.
Relative equity performance analysis of canal and non-canal sources of irrigation showed that the distribution of canal-irrigated area is superior in promoting equity in states like, Gujarat, Madhya Pradesh, Maharashtra, Orissa and Andhra Pradesh. Analysis of equity impact at state-level revealed that there is a wide variation in the level of inequality in current distribution of flow and lift irrigated areas across different farm-size classifications, both in absolute terms and in terms of household distribution of irrigation. Large farms captured disproportionately large share of irrigation benefits, as compared to small and marginal farms. Changing towards Rawisian distribution policy will significantly bring down the levels of inequality in the current irrigation distribution, in general and canal irrigation distribution, in particular. Levels of inequality in the distribution of most of the irrigation related attributes is less than the overall inequality in the current distribution of cultivated area. In the past, integrated approach was never adopted in the water sector by internalizing all the sources and uses of water while designing the policies. Consequently, source-wise analysis of irrigated area exhibits mixed inequality trends in the distribution of irrigation-related attributes. Mutual inter-dependent linkages among different users and sources of water require designing of policies for development management and utilization of water for the sector as a whole, encompassing all uses and sources. The study recommended the following: i) To improve equity in irrigation development and distribution, improved distribution across farm-size groups need to be targeted than in terms of balanced regional irrigation development in case of canal irrigation source. However, contrary will be the case in the context of tube well irrigation. ii) Along with the efforts to install PIM, simultaneous efforts to ensure physical and financial sustainability of the irrigation system is necessary. This would promote both equity and efficiency in the long run. iii) Reforms in the existing water laws and institutions are equally needed to correct the ‘incentive gap’ and promote ecological security, economic efficiency and social equity in every use of water.

39
In a study, (Narayanamoorthy 2001), to establish the relationship between incidence of poverty and development of irrigation in 14 major states of India, irrigation was taken as the explanatory variable. The study also tried to locate the changing role of irrigation as an explanatory factor over different points of time namely, 1972-73, 1977-78, 1983-84 and 1987-88. The objectives were to: 1) demonstrate the importance of irrigation as an impacting policy intervention on other variables which were used by earlier studies for analyzing the incidence of rural poverty; 2) capturing the changing scenario of state level rural poverty and to analyze the relationship between rural poverty and irrigation across states. The poverty line declared by the Planning Commission in different years, and other sources of data published by the government and commonly used in poverty studies were taken for the purpose of analysis. Irrigation was found to be highly influential on all the variables used in earlier studies. The paper argued that irrigation should be taken as the important variable in the analysis relating to rural poverty. The study also linked the irrigation-poverty nexus by segregating states above poverty line and below poverty line with their respective irrigation endowments. Irrigated area (ha) per thousand rural population (IAPTRP) was found to be significantly high for below poverty line states. The study also drew the inference that irrigation was the main factor in increasing real wage rate of agricultural laborers. Computed correlation values for irrigation, and non-irrigation variables regression analysis was made using only irrigation as a dependent variable. This study clearly showed irrigation as an important factor associated with the level of poverty in India.
Livelihoods impact
Anti-poverty effects are perceptible from the point of view of production and livelihoods. The production aspects were already dealt with earlier. From the livelihoods standpoint the question of entitlements was made increasingly important by Amartya Sen. Raising the question “who gains and who loses?” Chambers (1988) mentioned, “irrigation, increased irrigation, higher cropping intensities and associated change in cropping patterns all affect different groups in different ways. For small and marginal farmers, irrigation, means more productive work… on more days of year and more stable”. For landless poor irrigation in addition to providing employment, provided security against impoverishment and averted the dangers of having to dispose off assets, sale of land to buy food, meet debt repayment schedules, etc. It was reported that while incidence of poverty is as high as 69 percent in districts in India where there was less than 10 percent of irrigated crop area and is 26 percent in districts having more than 50 percent of such area and just 10 percent in the agro-climatic sub zones of Punjab and Harayana with 70 percent irrigated land.
Gender impact
A study in Harayana pointed out that changes in the pattern of production, because of irrigation, increased landed women’s participation in agricultural work due to greater intensity and need for scheduling in agriculture. Women belonging to scheduled castes got engaged in agricultural wage work but employment was extremely seasonal. Irrigation allowed the village to support increased population by bringing more land under cultivation, providing more jobs for Harijans, increasing

40
sedentariness and having greater appeal to immigrants. Irrigation also contributed to decreasing the time required to do various household tasks. Fodder production, fuel procurement, grain grinding and water carrying are examples. The landless were relatively little affected in this sphere. Livestock raising remained an important economic and social feature of the village. The change from extensive to intensive livestocking affected women’s labor since women play a central role in livestock management. Despite increases in cash economy and greater contact with urban areas, village women remained relatively isolated from economic activity and decision-making. Social and cultural constraints played the most significant role in determining the very subtle and indirect changes in women’s socio-economic spheres.
Exports impact
The exports of agricultural products contributed to Rs. 250.4 billion during 1996-97 accounting for 21 percent of total exports. In the post-liberalization period the quantum of exports is steadily increasing. Horticulture is occupying an important place while export of rice was to a tune of 5 MT (metric tons) in 1995-96. Kakkar argues that “the problem with these kinds of developments is that they hide the reality of water, irrigation, capital and employment scarcity in vast areas in India… would lead us to question the kind of irrigation options India has pursued till date” (Kakkar, 1999).
Adverse impact
There are several widely recognized adverse effects of large irrigation projects. Big dams and canals are criticized and are met with opposition on several counts like: i) displacement of people and the human misery associated with it and; ii) the negative health impacts on the population like the spread of malaria, filaria and many other water borne diseases. Poor are more likely to get affected due to these impacts, as rivers and canals are common recipients for sewerage and domestic affluence. Environmental impacts are another set of negative impacts of large irrigation systems. The consequences are not only the loss of habitat and loss of water through evaporation, seepage and percolation, but also heavy salinization and water logging, causing changes in soil structure and some times degradation. The environmental consequences of artificial impoundments are highlighted in various reports and articles which focused closer attention on the ecological impacts of dam construction.
There are different estimates made in regard to water logging. The Irrigation Commission (1972) estimated that 4.84 M ha of land is affected by water logging and salinization. The National Commission on Agriculture (1976) estimated that about 5.98 M ha of land was affected due to water logging in both irrigation commands as well as non-irrigated areas. Out of this 2.6 M ha was found to be affected by higher water table and the rest due to surface run-off stagnation. World Bank (1991), felt that about 3 M ha were water logged on irrigation lands but only part of the water logging was induced by irrigation. The working groups constituted by the Ministry of Water Resources (1991), estimated that about 2.46 M ha in irrigated commands were affected from water logging. Those areas were in the states of Punjab, Uttar Pradesh (UP), Harayana, Rajasthan and Maharashtra. The working group also estimated that 3.3 M ha of land suffered from salinity/alkalinity in irrigation commands.

41
To sum up, consequent to the negative impacts of irrigation, three types of economic loss result : i) annual/recurring losses due to reduction in crop yields on affected farms ii) one time loss due to huge investments made in creation of irrigation potential, which, if not fully utilized, leads to under-utilization of investments made in irrigation; iii) interest loss on irrigation. Further, the cost of reclamation of the affected lands is another economic loss.

42
1.5. PERFORMANCE OF IRRIGATION PROJECTS – AN OVERVIEW
The word ‘performance’ denotes a wide range of elements and boundaries. It is defined as a “system’s effectiveness in carrying out its internal activities – acquisition of inputs and transformation of inputs into intermediate and final outputs – and the effects of these activities on the system itself and on its external environment” (Small and Svendsen 1999). In the irrigation context, the water-related activities are generally grouped into three subsystem boundaries namely: acquisition, distribution and application. Small and Svendsen further elaborate that each subsystem has different functions – acquisition deals with physical and social elements associated with capture of water from its source, while distribution encompasses elements related to movement of water from source to the field. Application functions are in the domain of irrigators who actually apply water to the root zone of crops. Conceptually, the irrigation impacts discussed in the previous section represent a type of performance measure used for assessment. They pertain to the outcomes and effects of system outputs on a larger environment. Assessment of effects and outcomes is generally difficult and complex, especially, when dealing with subjects like water, due to the presence of a number of intervening variables.
Different performance criteria are used for different studies on irrigation in India. In this section a review of literature is made on the overall irrigation performance of canal irrigation systems within the subsystem boundaries of water delivery.
Big Dams
There are more than 10 irrigation systems in India with reservoirs serving around 500,000 hectares each and 50 reservoirs having the capacity to serve about 100,000 hectares each. Thus around 2/3 of the total irrigated area is serviced with irrigation from these reservoirs. The estimates of ultimate irrigation development potential (113.5 mha) were revised by GOI and upgraded to 139.9 million hectares with 58.46 million hectares through major and medium (M&M) irrigation, and 81.43 mha from minor irrigation (GOI 1999 c). However, these figures were questioned, as they were not based on any ‘river basin’ planning. The decisions on big dams were confined to engineers, bureaucrats and politicians. The people and other professionals of disciplines like agricultural sciences, social sciences etc., had little role to play in the decision- making related to big reservoirs. Further, the performance and experience of the irrigation projects never informed the decisions about dams in the past. No comprehensive post facto evaluations were available covering costs, benefits and impacts as envisaged in dam construction proposals. Also, studies were not made on how actual costs, benefits and impacts are distributed. Another fact was that there was no option assessment process with regard to the type of irrigation projects to be started (Thakkar 1999).
Historically, prior to independence, India’s irrigation projects were mainly diversion structures and were sanctioned on the basis of ‘financial return’ criterion, which showed a certain percentage return on the sum at charge in the tenth year after the completion of the project. This was calculated on the basis of capital investment, working expenses, water charges and betterment levy realized. The criterion changed to benefit cost (BC) ratio for sanctioning irrigation projects, after independence. The second Irrigation Commission, 1992, recommended

43
that at the time of considering a project for acceptance, the financial return also has to be carefully considered. A methodology consisting of opportunity cost, shadow pricing of inputs, outputs, foreign exchange etc., was recommended by Nitin Desai Committee in 1983 and, as a first step of implementation of the report, it was decided by GOI that the project reports should contain the calculations of internal rate of return (IRR) with discounted cash flow, and without adjusting for economic efficiency prices of inputs and outputs (Ganesan 1997). Thus, the BC ratio was replaced by IRR in 1983. In order to qualify, the projects were to yield a minimum of 9 percent and in projects with 75 percent dependability of water, drought-prone areas and hilly tracts, the IRR of 7 percent was allowed.
Review of literature dealing with the big dam controversy is out of place here, though some issues pertinent to planning of M&M water resources becomes relevant. For the purpose of discussion the recurring problems in the performance of M&M projects can be divided into – 1) those coming up in construction stage and; 2) those that spring up in the operation and maintenance phase. The problems in construction phase are: i) paucity of finances which results in cost and time over-runs; ii) faulty design; iii) rehabilitation of the project-affected people and; iv) environmental degradation. The problems that arise in O&M phase are: i) under-utilization of irrigation capacity (potential) created; ii) inequity in irrigation; iii) lack of dependability of irrigation; iv) indifferent quality; v) wastage of irrigation water; vi) water logging; soil salinity and alkalinity; vii) sustainability of irrigated farming and; viii) financial losses and pricing of water (Dhawan 1989; Mitra AK 1996; Thakkar 1999; Vaidyanathan 1999). These problems are all inter-related as some of the O&M problems are ramifications of those originated in the construction phase of the irrigation project. Another useful way to understand the performance of irrigation systems is to examine the constraints that plague the systems. They are physical constraints, institutional constraints and financial and economic constraints (World Bank 1998).
Right from the decision-making stage the projects were criticized for lack of transparency, resulting in under-estimation of costs and exaggeration of benefits. However, Anranga, Bedthi, Sardar Sarovar and Tehri projects as an exception were well- documented. “The experience of the last 50 years shows that in reality the standards of security and evaluation are lax, that project proposals without adequate hydrological data and preparatory investigation have been approved under political pressure. A study of the Public Accounts Committee of 32 projects showed cost escalation of 500% and beyond…. Even CWC and Central Board of Irrigation and Power pointed out… that the technical studies are left incomplete, the command area surveys are not completed and drainage and downstream issues are never addressed” (Thakkar 1999). An Appraisal Review Mission’s report of the World Bank on Chambal Command Area Development Project (MP), while estimating economic rate of return of 22 percent, cautioned that the rate of return was sensitive to growth rate of benefits and project costs. Delay of the project by one year would reduce benefits by 10 percent and 25 percent; increase in costs would result in decrease in rate of return to 18 percent (Sivamohan 1986).
Proliferation of projects and thin spread of resources were believed to be the cause of time and cost over-runs and the vicious cycle of resource crunch and further delays in the completion of irrigation projects. Thakkar quotes an analysis of 346 M&M irrigation projects which showed a minimum of 12 years lapse from the initiation of a project to the creation of irrigation potential. Further, the costs went up from Rs. 51,000 per hectare in 1978-79 to over

44
214,000 per hectare in 1995-96 (at 1995-96 constant prices – both representing 3-year moving averages). The Planning Commission also accepted increase in cost of creation of one hectare irrigation through M&M projects by 365 percent from the time of early plan period. The factors for the cost escalation and long gestation period are generally attributed to inflation in the prices of the inputs for construction, changed designs and scope of projects after they were approved, and procedural delays and other bottlenecks (Vaidyanathan 1999).
Competitive politics and the mindless chase for starting new projects, though in policy was discouraged after the Eighth Plan Period, continued, as politicians believed this to be a good ‘vote catching’ mechanism and also a source of generating party funds for fighting elections. Hasty preparation of plans and designs and complacence of the Technical Committee approving the projects, were common features, with projects starting without being approved. Publications are rare on common design deficiencies (which creep in distribution subsystem), and which were responsible for causing specific management problems. Some interesting design aspects were mentioned in a publication (ODI 1976) based on Reidinger (1980) and Van der velde (1980) and Wade (several papers). Because of the fact that irrigation systems in India were meant for protective irrigation, the designs were based on sharing shortage of water. It was felt that with the low design irrigation intensities, continuous flows and absence of proper control and regulation structures, the systems became hardly manageable giving rise to head-tail differences and related problems (Jurriens and Kornelis de Jong 1989). The NCIWRDP (1999) reiterated the following maladies for non-completion of projects according to time schedules:
1. Proliferation of schemes, insufficient plan outlays and consequent thin spreading of available
resources. 2. Non-prioritization of projects. 3. Inadequate planning and investigations and delays in planning implementation of distribution
systems. 4. Pre-emption of available resources by externally-aided schemes. 5. Increased provisions for rehabilitation and environmental costs due to greater awareness of
their importance. 6. Delays in resettlement and land acquisition, including transfer of forest land, and 7. Cost and time over- runs.
Whenever the performance of M&M projects are discussed, much has been said on both sides and the importance of M&M schemes constructed cannot be ignored for their contribution in wiping out food scarcity in India. The rehabilitation of projects affected people, and ecological challenges and environmental degradation are other issues widely discussed in India, of late.
Under-utilization of Irrigation Capacity
Coming to the operational side of the M&M projects in India, the persisting gap between the irrigation potential created and utilized, remained as a subject matter of performance evaluation of irrigation projects. Concern with this gap saw the creation of Command Area Development (CAD) authorities in the areas irrigated by M&M projects, in 1974. The other factors that

45
contributed to the formation of CAD authorities however, were the changing concept of irrigation and agriculture in the light of green revolution, assignment of responsibility for infrastructural development and distributive justice. The need for an institutional framework to undertake and integrate various activities and functions below the ‘outlet’ level of an irrigation distribution system was felt as absolutely wanting. So also, was the compelling need for equitable distribution of irrigation water to marginal, small, and tail-end farms (Sivamohan 1990). There is no uniformity about the definition of irrigation potential all over the country. Some states report net potential while others report annual potential. Further, while some states cover the areas served by the canal network, others report only when field channels are constructed. Areas are often reported when systems are partially completed, though water was not flowing because of physical constraints. The NCIWRD dealt with this aspect at length and recommended that the term irrigation potential created by a project at a given time during and after its construction be defined as “the aggregate gross area that can be irrigated annually by the quantity of water which could be made available through infrastructure completed upto last government outlet in water delivery system” (NCIWRD 1999). The Commission also recommended the adoption of a uniform reporting system and also periodical re-appraisal of projects. The disparity in the definition of irrigation potential utilized, and the reporting methodologies adopted by different states, is equally varying. A difference of 7 M ha of utilization exists between total figures of state irrigation departments and land use statistics (NCIWRD 99). Vaidyanathan (1999), also opined that the gap is larger when we compare land use statistics with Planning Commission estimates. Not withstanding the controversy, studies by research scholars suggest (Mitra 1996) that there exists a considerable extent of under-utilization and mis-utilization, which needs to be checked through improved technical efficiency in O&M, and improved distribution of water. However, it was also argued that the problem of poor utilization cannot be solved simply by improving the control capacity via improved physical structures (Wade and Chambers 1980). The Irrigation Commission (1972) emphasized, that the utilization was hampered by design and implementation deficiencies, including completion of reservoirs before the canal networks completed, lack of field channels, and many other such reasons which prompted the formation of CAD authorities.
The NCIWRD (1999) worked out the gap, and the figurers are reproduced in table 1.2.6 of this report. The evaluation studies sponsored by the Ministry of Water Resources for assessing the impact of CAD program show a positive impact, improving irrigation water utilization, increasing irrigation intensity and water-use efficiency, increasing agricultural production and productivity (GOI 2001). The NCIWRD (1999), in this context, pointed out a discrepancy in the statistics of irrigation potential created and utilized and called for a specific review to cull out the methodologies adopted and reconcile the data adopting uniform criteria regarding identification and annual reckoning of area of irrigation, and also suggested the use and interpretation of satellite imageries. Constraints The Indian Irrigation Sector Review (World Bank 1998) identified some major constraints in the performance of irrigation. Stressing the increased limitations for further expansion of irrigation in

46
the country, the report recommended a strategic need for improving the performance of existing irrigation. 1) Infrastructure and drainage in the flow irrigation projects was found in a state of disrepair and badly needed maintenance because of poor design, inferior quality of construction and more importantly, due to the cumulative effects of deferred maintenance. Silted canals and drains, eroded and collapsing structures were a common sight in these projects. The systems, thus dilapidated, led to wastage of water and unreliable and untimely deliveries and application losses. 2) The quality of service provided by the irrigation departments (ID) was very poor. The mammoth centralized structures were not having accountability to users being monopoly organizations. 3) The personnel in the ID are construction oriented civil engineers and lack skills in operations and maintenance. The shortage of skills was felt in corporate and financial management, basin planning, environmental management, and so on. Job rotations in the organizations hampered career growth, and lack of incentives for encouraging and inducting specialization. 4) Irrigation sector in the country is divided into minor irrigation dealing with groundwater, lift irrigation schemes, tanks and major and medium irrigation projects dealing with vast canal networks. They are administered by different government departments and ministries at state level. Important functions like water resources planning, monitoring and management, and environmental assessment are also dispersed, and departments concerned lack responsibility, accountability and coordination. 5) Likewise, the linkage between irrigation and agriculture is weak and organizational synergy is lacking. 6) Yet another big constraint was minimal involvement of farmers in irrigation management for a variety of reasons. Robert Chambers (1992), further identified several gaps in the management of canal irrigation systems. His research calls for open-learning on the part of the individual professionals, maintenance gap, and the “fixation below the outlet,” thereby lack of systems approach in the management; absence of night irrigation and lastly, lack of motivation among irrigation professionals and corruption resulting in ‘transfer trade’ where lucrative posts are traded by politicians. The book argues that the potential for better livelihoods for the poor from the improved performance of canal irrigation systems are immense. It calls for R&D on the ‘gap’ subjects including main system scheduling and delivery, communications, farmer joint management, containing and cutting down corruption and diagnostic analysis, and learning from the field and farmers (Chambers 1992). 7) Financial and economic constraints in the management of canal irrigation in India figure prominently. This was due to insufficient cost recovery from the farmers. Water charges are very low and are not linked to scarcity of water, productivity or costs involved in capturing water and delivering it. The World Bank report (1998) points out that “due to insufficient cost recovery, irrigation currently contributes one-third of the states’ revenue deficit.” The total uncovered costs on account of major and medium irrigation works increased more than five-fold from Rs. 280 crores in 1997-78 to Rs. 1,525 crores in 1986-87. In 1977-78 the implicit subsidies on these projects was one-third of the annual capital investment into this category; by 1986-87 it became 70 percent and “today it is much higher” (GOI 1992). 8) The differed maintenance of systems due to paucity of funds, however, was mainly due to insufficient O&M budgetary allocations by the state governments. Vaidyanathan Committee Report clearly shows that in many states O&M expenditure do not cover even staff salaries. 9) The World Bank (1998) report attributes subsidized water and its public provision as the reason for poor incentive for water-use efficiency.

47
Broken Legitimacy Henry Hart (1978), described the ‘broken legitimacy’ in irrigation management and performance and ‘anarchy syndrome’ among farmers due to various operational problems. In Pant’s words “on one hand the cultivators have lost their expectations that their canals would furnish them water to suit their requirements and indulge in breaking structures and illegal diversion of water. On the other hand, the irrigation field staff have lost confidence that cultivators will irrigate according to law and rules, so do not take interest in their assigned job and exercise their authority arbitrarily for their own vested interests” (Pant 1986). The inability of most of the M&M systems to perform as they were designed thus, gave rise to the search of alternate models for managing irrigation efficiently.
Unreliability and Wastage
Unreliability and wastage of irrigation water are two factors mutually intertwined. At the outset, farmers had no accurance or idea as to how much and when they would get water delivery from the system. “The combined evidence of water capture, sedimentation and transmission losses suggests that less water is deliverable or delivered than originally estimated or subsequently reported” (Chamber 1992). In some systems, water is available mostly when the farmers don’t require and in others, water is not available when it is needed most. Added to this are the perpetual problems related to head and tail-end flows in the canals, and the consequent misuse and deprivation, respectively. In a strict sense, supplies in the system are neither demand-based nor need-based. Supplies are rigid and inflexible which results in farmers’ inability to plan their cropping pattern.
No incentive is available to the farmer to save water in the canal systems. Further, it makes them waste and over-irrigate their fields, due to uncertainty of supply and also due to lack of knowledge of scientific management of water. There is also no group incentive for economizing water use (Joshi 2000) and the management of water is entirely with the irrigation agency. Wastage of water thus occurs due to several reasons – inadequate delivery systems, lack of proper leveling of land, lack of proper drainage, excessive seepage losses, negligent wastage of water during transmission, over-irrigation and so on.
Assumptions and Operating Procedures
Wade’s (1980) comparison between the operating procedures used in South India and those used not only in Taiwan, Japan, Spain but also north India, showed that a large potential for improvement was waiting to be tapped. Physical structures did not prevent a big increase in water control. There was a great potential for improving canal performance through better operating procedures without expensive rehabilitation of physical structures. The rate of improvement in effectiveness of canal systems could be considerably higher than what the existing engineering-oriented remedies would lead to. Large increases in water control can be brought about if engineers seriously, wish to, even within the limitations of the existing physical structures and administration.

48
Three assumptions dominated the literature on causes and remedies of poor canal performance – i) problems arose mainly below, rather than above the outlet, at farm and village level ii) that the problems were mainly technical in nature and iii) that, so far as problems identified as institutional, were all related to the institutions of farmers. Canal systems were designed and constructed assuming a level of utilization of control capacity, which did not exist in most systems of south and south-east Asia. The problem of poor utilization cannot be solved simply by improving the control capacity via improved physical structures. Improvement at the on-farm level depended, in case of large water supply systems, on the ability of the farmer to obtain water at the right time and in the quantity required. Thus, an important interaction existed between centralized water management and planning and on-farm water utilization. The structure of an irrigation system could place severe restrictions on the irrigators options to apply sound conventions or innovative water management practices. The evidence suggested that without large investments in physical structures, but with changes in the distribution of water on main systems, large increases in production could be achieved with equity benefits to deprived tail-enders as well. In India alone, the potential was probably for millions of tons of additional food grains. To achieve such a quantum jump, main system management was considered as the key. Main system management was overlooked due to 1) visibility 2) professional concerns and preferences 3) blaming the farmer 4) the belief that one man’s gain is the other man’s loss 5) the fact that water is politics and 6) little incentive to canal operator for better performance. To begin now to explore and realize the potential from improved main system management required two thrusts : 1) cognitive and 2) diagnostic. (Wade; R. Chambers 1980).

49
1.6. INSTITUTIONAL REFORMS IN IRRIGATION – AN OVERVIEW
Application of irrigation to the crops constitutes the other important subsystem function in irrigation management. Ever since the 1980s, several of the situational compulsions (discussed earlier) prompted the Government of India and the state governments to look for alternative approaches from bureaucratic administration of irrigation to farmers’ management. This was also propelled by the globally held policy views on wider issues like the role of governance and creating an enabling environment, de-bureaucratization, privatization, peoples’ participation, user management of resources and programs, emphasis on productivity, efficiency, equity, economy and environmental degradation.
Historically, farmer-managed irrigation systems were not unknown to India. Kautilya in the third century BC chalked out the principles of participatory management for governance of certain activities in irrigation. The third century AD witnessed the construction of ‘Gand Anicut’ across the river Cauvery by king Karikala Chola in Tamilnadu. Till the British rulers took over its management in 1799, irrigation under this anicut was in the hands of the local communities. History is replete with several instances of management of irrigation by farmers like – Vijayanagar Channels (11th to 16th century AD), kuls in Himalayas, ahar and pyne in Bihar, tanks in Tamilnadu, Andhra Pradesh and Karnataka and phads in Maharashtra. The British period saw the beginning of the construction of large irrigation systems for maximizing revenue collection and movement of army through the waterways. Centralised organization structures for irrigation administration thus became necessary. Independent India, thereafter, continued with the inherited legacy of irrigation administration. It was assumed that a mix of ‘correct technology’, efficient markets and capable agency would provide optimal performance. The central control by powerful bureaucracy was made available by the imperatives of physical system and its technology.
In India the initial approach of the participatory irrigation management (PIM) was to involve farmers in the management of irrigation applications judiciously and equitably at the farm level. With the formation of CADAs the main thrust given was to construct field channels and involve farmers in decisions regarding water allocation and utilization below the outlet level. By the early 90s the concept gradually moved to establishing partnerships between the government agencies and farmers, and of late to the threshold of irrigation management transfer (IMT). Some state governments already took initiative in legislating to this effect to a great measure. One could observe an evolutionary trend in this regard in Indian policy making. Several researchers and institutions in India had engaged in a prolonged debate on the participatory processes in this sector and donor agencies supported the research projects. In early 1990s, senior -level officials were exposed to the idea in collaboration with the then International Water Management Institute (now IWMI) at the Administrative Staff College of India, and the officials were taken on a study tour to countries like Phillipines and Malaysia where PIM was already being implemented. It was only in 1984, that the Ministry of Water Resources (MOWR) issued guidelines for the formation of Water Users Associations (WUAs) on a pilot basis and then to replicate them. During the Seventh Plan period the Planning Commission wanted the farmers to be encouraged for collective action not only for on farm application of water but also for other aspects in irrigated agriculture. However, as Raju and Melony (1994) have opined, PIM was not a major objective of the plan. A cautious approach in initiating PIM continued and in 1985 the government wanted to experiment

50
with PIM on one minor canal in each of the CAD projects. The 1987 National Water Policy referred to PIM and involvement of NGOs in a passing manner. The Eighth Plan strategy called for greater user participation and was asked to be encouraged both at system and at local levels. Action projects funded by external agencies and also government of India to try out PIM in different locations continued. It was only after the liberalization, when the processes of de-bureaucratisation and privatisation gained momentum, similar changes were also witnessed in the irrigation sector.
Several national conferences were held by the MOWR. The Working Group of Tenth Five-year Plan deliberated and recommended that at least 10 percent of the irrigated area to start with, should be covered by PIM, and should be increased to 50 percent by the end of the Tenth Plan period. The 1999 union budget for the first time spelt out budget allocations for PIM. A good documentary critique on PIM (Deepika et al. 1999) analysed the misconceptions attributed for the tardy progress of the PIM in India. Some of the attributes were:
i. PIM was not on the political agenda: It was commonly attributed that lack of political will
was responsible for PIM not to take off ground. The leadership that could develop out side the realm of politicians because of PIM was threatening to them. However, the subsequent legislation by the government of Andhra Pradesh proved it otherwise. Though PIM was declared as a national objective in 1987 National Water Policy document, it was not treated as a special national program. (Deepika et al 1999). PIM is treated as a component of CAD program and has no separate thrust, thereby losing its importance. Thus, ‘lack of political will’ explained the lethargy for implementation in many (Joshi 99) analytical writings.
ii. Systems improvement and resource constraints: As seen earlier, the performance of irrigation
projects was restricted by lack of maintenance and repairs, which was resultant of scarce financial resources. But this cannot stand as a reason to doubt farmer’s willingness to pay more water cess if management is given to them.
iii. Uneducated farmer: The feeling that farmers were uneducated lasted in government circles.
“Researches have stated that in irrigation engineering discourse the dominant image of the water user and his relation to the state is that of the ‘uneducated farmer.’ (Deepika e al 1999). The “dependency syndrome” perpetuated by the government agency was in fact responsible for farmers’ apathy for taking any new initiatives.
iv. Bureaucratic resistance: The resistance of irrigation bureaucracy had been a stumbling block
for the progress of PIM initiatives in the country. Wide recognition of the need to change and the need for infusion of multidisciplinary skills though prevalent in the irrigation sector, the administrative ethos was not conducive for irrigation professionals to diversify (Maloney & Raju 94). Many authors (Chambers 1988; Wade 1982; Singh 1991) were critical of the attitude of irrigation bureaucracy towards PIM.
51
The literature survey on PIM in India shows that the authors focussed their attention initially on questions like what is PIM, why, where and how. The focus gradually changed towards issues in operationalizing the concepts and dealing with factors hindering implementation. A few studies of the evaluation of PIM were also undertaken wherever PIM was introduced at different points of time.
Gilmartin-D and Madsen 1999, investigated the roots of the interface between the state and local community in irrigation in India to understand the notion of ‘public’ given by the Britishers during colonial rule. The paper pointed that the colonial state was hardly oblivious to the role of local community in the operation of irrigation works inspite of its construction of large irrigation works and centralised bureaucracy. On the contrary, many British administrators saw local organisations as central to the success of irrigation works. But they also saw local community within a distinctive framework of analysis that had critical implications for the future of irrigation. British ideas about the proper relationship between the local community and the state ultimately had as profound an impact on shaping and constraining the emergence of a ‘public’ voice in irrigation, as did the local variables that encouraged and constrained collective action and irrigator cooperation in ‘village republics’ independently of the state.
Two important arguments tendered in favour of PIM in the recent times were i) undependability and uncertainty of irrigation supplies bred dissatisfaction among client groups and led to a state of anarchy; ii) maintenance of irrigation systems was a recurring, costly and unmanageable problem for irrigation agencies. Singh (1991), argued that the scope of participation was not limited to only these factors but would extend to the strengthened relationship between the irrigation agency and water users – better understanding of the need to preserve structures, mobilization of collective effort for minor and major restoration of system defects, resolution of conflicts and better confidence among irrigators to justify increased investments in farm operations. Singh further postulated that farmers’ participation in irrigation can be said to have existed when water users took decisions that influenced access to water and its use according to the principles considered worthy by them.
Policy Perspectives
Initially, the concept was that the farmers who were viewed as beneficiaries were expected to participate with irrigation agencies in the discharge of the latter’s duties. The idiom gradually changed from participation to management in the early 90s. But, the then prevailing misconceptions of the process and rationale for developing farmers’ organisations for effective management were strongly conditioned by a set of unvoiced assumptions about the way such organisations work and about the nature of their relations to the state (Ambler 1994). Ambler called for the need to restructure the language of water users development in order to develop and sustain real water users associations (WUAs). He emphasised that farmers were not expected to participate in the government programs; in reality it was the other way round, farmers did not have patron-client relationships with them, but were in fact partners to the government, and lastly the commonly used expression “motivating farmers” needed change to “creating motivating conditions.”

52
The user-state relationships in countries implementing PIM programs were: 1) Government did everything (Malaysia, and India also) 2) State dominated, users helped at the lowest level (India) 3) User dominated, state facilitated (Mexico) 4) Everything did by farmers (Nepal). The handbook (Groenfeldt 1998) after classifying the typologies of user-state relationships provided the rationale of PIM in the light of problems in irrigation management already discussed in this report. The book asserted that the logic of PIM approach was that both governments and farmers had separate comparative advantages.
Several of the early studies on PIM in India reiterated that the delivery of adequate and reliable amount of water to the outlets was a pre-condition to any kind of community level action for the distribution of water, maintenance of distribution structures and resolution of conflicts below the outlet. The factors, which contributed to the success of farmers’ organisations in large irrigation projects in the past (Pant 1986) were i) right kind of leadership ii) adequate and predictable amount of water iii) greater interaction and more frequent contacts between officials and farmers iv) unanimity among members (i.e. low frequency of conflicts) v) incentives or rewards for water users organisations, at least in the initial stages, and vi) legitimacy of the authority of organisations in the eyes of government officials, agencies and financial institutions.
A study report on IMT in India (Brewer JD, et al. 1997) presented the study findings of a joint team of IIMI and IIM on 21 canal, left and tank irrigation projects on IMT and spread in the states of Tamil Nadu, Kerala, Maharashtra, Bihar and Gujarat. The report analysed the experiments carried out in different parts of the country in detail. The policy analysis for the six states studied informed the lessons learnt in the IMT context. The report identified that the policy formulation on IMT was not a priority item for the governments, and also the then existing legal frame never permitted much change to take place. The farmers were disillusioned as to whether they could get better irrigation supplies even when IMT was effected. Because of the existing conditions the leadership vacuum was strikingly perceptible. The report concluded that enthusiasm for user participation was not shared widely with the bureaucratic and policy circles. “While at higher levels, the officials may be keener to transfer management functions, lower level functionaries who risk losing control are not supportive. Even the existing policies have not received enough attention in implementation”. Some authors (Maloney and Raju 1994) were of the view that building farmers’ organisations for irrigation was not a mechanical process. The other points of debate in literature was whether the approach to create farmers’ organisations should be “top-down” or “bottom-up”, whether community organisers had to be used on a large scale (Maloney and Raju 1994), and the need of government officers themselves taking up the responsibility of forming associations. (ISPAN 1994, Groenfeldt 1998).
Researchers had also discussed at length on aspects like size and location of water user associations in the hydrological systems. It was felt that no single optimal size could be prescribed for the WUAs. Examples in literature ranged from 2 hectares to 80,000 hectares with membership from 10 to several thousand. The choice however, depended on land holding pattern, type of irrigation system, social institutions and leadership capabilities. Thus, the policy debate on size revolved around organising water users on water courses below the outlet, minor level or distributory level. States like Harayana still limit the WUAs to water course level; large number of states moved to organise WUAs at minor/distributory level. The reasons were many: i) farmers cooperation already existed below the outlet in some form or other and that alone was not

53
challenging enough to sustain an organisation structure; ii) decision-making opportunities arose and were facilitated with the cooperation of farmers if the associations were big enough. This in turn helped in emergence of leadership, gave greater opportunities for control and O&M improvements and water allocations (Ruth Meinzen Dick 2000). Based on several experiments and research on PIM so far conducted in the country, the national workshop held at the Administrative Staff College of India in 1992 recommended a size of 600 hectares as viable for the formation of WUAs (Sivamohan & Scott 1994).
The general consensus that emerged during various workshops held subsequently was that a minor canal was the ideal unit for the formation of WUA where a command of 300 hectares to 500 hectares or even 1000 hectares would be available (Hooja Retal 2002). The PIM working group (GOI 1996) was also of the opinion that minor level was highly suitable for farmers to take up O&M works.
The objectives envisaged for WUAs by the working group were: • Improvement of service deliveries through better operation and maintenance and optimum
utilization of water with crop needs. • achievement of equity in the distribution of water. • production improvement of per unit of water and per unit of land. • helping farmers in wider choices of crop sequence and timing of water supply. • optimal use of both ground water and natural precipitation. • promotion of ownership feeling and responsibility among farmers and facilitating collection
of water charges and economy in use of water and also to gradually branch out to other activities (than distribution of water alone).
• mobilization of local resources (cash and kind) for costs involved in the upkeep of the system and its management.
The working group on PIM further reiterated that ‘legal support’ for WUAs was
necessary to enable them to work efficiently (GOI 1996). The provisions required for the strengthening of WUAs included – WUA as representative organisation of irrigators when dealing with external agencies, rights to mobilize resources, ability to operate bank accounts as a legal entity, ownership rights of irrigation systems. All of these requirements in turn warranted amendments in state irrigation and drainage laws giving legal status to WUAs. The IIMI-IIM study (Bewer JD et al. 1997) examined the legal lacunae and proper framework for PIM in India and suggested issues and points to be covered by irrigation acts. It cautioned that legal amendments were necessary but not a sufficient condition for the success of PIM.
Debate on policy perspectives underwent a dramatic change with the initiation of reform
processes in the irrigation sector at state level. The state of Andhra Pradesh took the initiative and passed the Andhra Pradesh Farmers Management of Irrigation Systems (APFMIS) Act in 1997. It was hailed as first of its kind to bring in a paradigm shift in irrigation management. The Act contains broad provisions relating to the types of irrigation schemes, tiers of farmers’ organisations (FOs), election functions of FOs, resources and penalties for offences. The Act had brought in a major institutional change and is being emulated by other state governments. This is discussed in detail in our report on irrigation and institutional development.

54
A World Bank publication (Obitas; JR Peter et al. 1999) reviewed the development of the
major irrigation reforms initiated in Andhra Pradesh. After tracking the reform process from the beginning, it highlighted the key features which facilitated steps towards reform and considered both immediate and long-term actions needed to support the financial viability of the state irrigation sector. It affirmed that further progression of the reform program would ultimately create a ‘virtuous cycle’.
Participator Irrigation Management: Pilot Projects
The policy development on IMT in India was also a sequel to participatory experiments conducted in different irrigation systems on one hand, and the coalition building of individuals in government, aid-giving agencies and academic circles (Sivamohan and Scott 2002), on the other. Further, PIM, ever since the beginning of 1980s was seen as part of a world-wide trend of devolution in natural resource management (Raju et al. ed. 2002; Vermillion ed. 1996). Though several examples of successful traditional irrigation systems where farmers managed irrigation were available, it was believed for a long time in the government quarters that large systems were not amenable for farmers’ management. However, papers submitted at various seminars and workshops (which were latter edited and published) mirrored several instances where PIM helped in increasing area under irrigation, productivity, equity, water use efficiency and reduction in irrigation disputes (Singh ed. 1991; Raju and Maloney eds. 1994; Sivamohan and Scott eds. 1994; Joshi and Hooja eds. 2000).
The MOWR documented the profiles of water users associations (Pathak 1991) pointing out the need for promotion of PIM in India. Mohini Cooperative Society was one of the initial water users organisation started in 1979, which functioned successfully for over a decade. This was started with the initiative of irrigation officials as a vehicle to bridge the gap between irrigation potential created and utilized. While the reasons attributed for its successful functioning among others were strong and dedicated leadership and support from the irrigation officials, its failure came because of the disappearance of those attributes (Singh 2000). The case of farmers’ committees in Pochampad Project in Andhra Pradesh was extensively researched by KK Singh. In a paper (Singh and Kanwar 1988) after describing how farmers involvement was sought in Pochampad Project, the study identified six research issues: – i) assessment of the contribution of the peoples participation in better water utilisation ii) factors contributing to the institutionalisation and viability of farmers’ organizations for managing irrigation iii) linking irrigation committees with the community and government iv) incentives for institutionalising farmers’ irrigation organisations v) potential for joint management forums between farmers and government officials for irrigation management and vi) the role of government in creating and sustaining farmers’ committees. The study concluded that the task of PIM can be helped if experience gained is properly documented for future use.
Kolavalli (1995), found that though inequities continued to persist in many of the WUAs studied, water distribution on the whole was found to be more equitable than before. Irrigation transfers resulted in more reliable supplies and to an extent better maintenance, which in turn had benefited tail enders. The study asserted that WUAs would be effective in their functioning as

55
long as their members believed them to be beneficial. Four years’ experience of the Centre for Applied Systems Analysis in Development (CASAD) in organizing and operationalizing WUAs in the command of Minor 7 of Mula right bank canal in Ahmednagar district, Maharashtra was documented (Lele and Patil 1994) and published in a book form. The book vividly showed how farmers were motivated and how their skills were built. It also described the difficulties faced and how the negotiations were conducted with the government. It took into consideration the training needs of farmers as well as officers, and provided training modules and suggestions for capacity building.
The action research project of the Institute of Resource Development and Social Management (IRDAS) in Andhra Pradesh state in Pochampad Project area, demonstrated that PIM was possible in large irrigation systems provided farmers were organised and legal support given. The savings of water, spread in irrigated area, reduction in disputes were all clearly observed where IRDAS interventions were provided (IRDAS 1995). The action research was scaled up with increased area coverage and once again similar outcomes were found. The sponsors of the action research project in Pochampad namely, MOR, and the department of water utilisation in Andhra Pradesh, and later the Ford Foundation, were interested in answers to such questions as – a suitable methodology for organising farmers, manpower and skill levels required, functions that FO can perform, capacity building, and what can strengthen and ensure the long-term survival of farmers’ organisations. The action research project addressed itself to those questions.
The areas covered by PIM by the formation of WUAs and others managed by the irrigation department in Mula and Bima Commands were compared and contrasted (Brewer and Shakitvadivel) for performance of maintenance. The study found that the area covered by WUA had: i) better information on maintenance requirements ii) could undertake maintenance annually with ease iii) WUA had the flexibility in funding and was not bound by rigid departmental regulations and procedures and iv) the WUA had greater flexibility in implementation. The departmental maintenance also showed contrary features. Thus, maintenance was found to be much better in farmer- managed systems.
Organisation Models and Processes
The farmers’ organisations (FO) took different shapes suiting the local traditions and culture. Wherever cooperative movement was strong most of the water users organisations were modelled on ‘cooperative societies’. They were set up in major irrigation projects in Gujarat (Patil 1991) and Maharashtra (ISPAN 1994). While Andhra Pradesh state adopted loose associations as a model in the initial stages, Tamil Nadu had water users committees. The change agents employed were also different. In late 1970s government departments created outlet-based irrigation committees under the CAD program. Later on, the NGOs and some training institutions such as water and land management institutes took up the task of organising farmers. In Tamil Nadu, the agricultural engineering department and irrigation management training institute (both part of state government) set up multi-tier farmers’ organisations. A two-tier FO was organized likewise on Paliganj distributory in the zone command area in Bihar. This was organized with the assistance of WALMI and some other research institutions. In the small tanks, lift irrigation

56
schemes, research institutions, NGOs and government played a major role in establishing FOs. Many of these were donor-funded by donor agencies like EEC (Tamil Nadu), USAID (Maharashtra) and Agakhan Foundation and SWDF (Gujarat and Harayana). Irrigation departments and Agriculture departments funded micro-level projects which were managed by users (Singh 1997).
Impact of IMT Several of the experiments like those discussed earlier prompted the respective state governments towards taking a policy decision of transfer irrigation management to farmers. While the state of Andhra Pradesh started with a ‘big bang’ approach other states also initiated reforms and effected changes in laws. In Maharashtra where IMT is not yet extensively implemented, its impact in areas of the canals where it was implemented (follow-up study) was found to be very positive (Naik et al. eds. 2002). The objective of the study was not to test a methodology for quantitative impact assessment and to provide insights into the impacts. While in the earlier studies the perspectives of the government – increased agricultural production, equity etc., – were highlighted, the concerns of the farmers in this regard were neglected. Taking the ‘trade-off’ model in decision-making on alternatives, the study asserted that farmers preferred WUA management to the irrigation departmental management. The farmers clearly perceived that with IMT the maintenance and water distribution of irrigation systems, agricultural productivity, cost of irrigation incomes of farmers, all had increased. Parthasarathy (2001) studied IMT in Gujarat and Andhra Pradesh and felt that “the rapidity of implementation may also have a galvanizing effect on farmers and officials, allowing for a fresh approach to participation in irrigation management”. The study asserted that inequities persisted in the functioning of WUAs; stakes in improvement tended to be pro-poor in Andhra Pradesh because of the location of small farms at the tail end and the preference of small-farm holders to use canal water, which was cheaper. The farmers rarely used alternate (ground water) sources of irrigation. In Gujarat, though the concentration of small holding at the tail-ends of the systems was common, canal irrigation was farm-size neutral.
IMT being a recent phenomenon, detailed impact studies are not available in good numbers and a review of literature by Meinzen-Dick and others pointed out that research on outcomes, processes and issues has remained insufficient.

57
1.7. SUMMING UP
Though the contribution of agriculture to GDP has been declining over time, (a natural trend in development), about 60 percent of the Indian rural population is still employed in agriculture. During the first half of the post-independence period, when agriculture contributed to a major proportion of the GDP, the fluctuations in GDP were attributed to the monsoon vagaries. The increased stability during the later periods is attributed both to decline in the proportion of agriculture to the GDP and improvement in irrigation infrastructure, which stabilized agricultural production.
One can discern distinct trends in research on poverty-related issues over the years. The measurement of poverty, defining poverty lines and the related tools, engaged the attention of researchers for a considerable period of time. Various researches on the ‘Green Revolution’ experiences provide contrasting evidences about the validity of the ‘trickle down’ theory of growth. Though there has been a fall in the overall levels of poverty over time, the rate of decline has been slow. Presence of safety nets in the form of drought and flood-relief programs seems to have enhanced the impacts of other interventions on poverty alleviation. Researches on the impacts of economic reforms on poverty reveal that poverty exacerbated during the first years of reforms and no significant effects were experienced at the micro-levels. Incomplete and partial reforms seem to adversely affect poverty alleviation efforts.
The investments in irrigation peaked during 1980-90, while they almost doubled from their previous levels during the 1992-97 plan period. Institutional finance for irrigation showed a similar trend. While the potential of major irrigation has always been under-utilized, the utilization fell short of potential in the case of minor irrigation from 1980 onwards. Despite the improvement in irrigation infrastructure and the consequent creation of employment opportunities, it was observed that only households with assets and who were closer to the poverty line were able to cross the line. The composition of growth and the absorption capacity of growth opportunities by the poor are critical for poverty alleviation.
In general, poverty in irrigated areas is lower than in rainfed areas. It is less intense and less widely spread in long-established irrigated areas than in new ones. There have been no special pro-poor programs/policies in irrigated agriculture. The allocation of irrigation is neutral to land holding size.
While initial research on irrigation focused on the technical aspects and performance, subsequent researches took account of the social processes like conflict management and collective action. The major economic impacts of the irrigation interventions have been in the form of increased income generation, mainly through providing additional employment opportunities due to increased intensity of farm management requirements. The reduction in poverty experienced was mainly through increased agricultural production and adoption of modern farm technologies leading to reduced food prices, and generating income through employment. However, there is no conclusive evidence on the impacts of irrigation on poverty. Some studies show that investment in less favored areas, like rainfed areas, would have a greater impact on poverty and environment than in irrigated areas.

58
There is evidence to show that irrigation improved the yields and reduced the variation in crop area. It has also contributed to improving the ground water resources. There have also been changes in the cropping pattern to orient to market due to irrigation. Irrigation alone, however, does not seem to bring about any perceptible impact in income or poverty alleviation. Complementing this with other inputs is very crucial to appropriate the benefits from irrigation. Irrigation has undeniably contributed towards improving the carrying capacity of the areas.
Large irrigation projects have been largely criticized for their negative impacts especially, in terms of large-scale displacement of population, negative health impacts and environmental impacts in the form of loss of habitat, salinization and water logging leading to reduction in crop yields. The costs of reclamation of the affected areas added to the cost of the projects, which have been generally high especially with the investments being underutilized due to the utilization always falling short of the potential created.
The major issue of contention has, however, been equity in distribution of benefits. The scale bias in irrigation is presumed to have reinforced inequality among users. Though there is evidence that marginal farmers gained in an absolute sense, large farmers gained proportionally more. While the quality of life was found to be better in irrigated villages, the income and asset inequality was also found to be higher in these villages. The distribution of benefits seems more equitable in canal-irrigated areas. Irrigation Management Transfer (IMT) was seen as a mechanism to bring about equity in distribution. The success of these initiatives are yet to be tested systematically.
59
References Ahluwalia, M.S. (1978). Rural poverty and agricultural performance in India. Journal of
Development Studies, Vol.14. Ambler, J. (1994). The language of farmer Water Users’ Associations: Re-thinking irrigation
organization development in India. In Sivamohan MVK and C A Scott (Eds.), India: Irrigation Management Partnerships. Booklinks Corporation :Hyderabad.
Avinash, Kishore. (2002). Social impact of canal irrigation: Review of 30 years of research. IWMI-Tata water policy program. International Water Management Institute: Anand.
Balakrishna, S. (1985). Incidence of rural poverty in recent years. Behavioural science and economic development, Vol.3, No.1.
Bandopadhyay, D. (1988). Direct intervention programmes for poverty alleviation: An appraisal. Economic and Political Weekly, Vol. XXIII, No. 26.
Bardhan, P.K. (1970). On the minimum level of living and the rural poor. Indian Economic Review.
Bardhan, P.K. (1970a). The Green Revolution and Agricultural Labourers. Economic and Political Weekly, Special Number.
Bardhan, P.K. (1973). On incidence of poverty in rural India of the sixties. Economic and Political Weekly, (Annual Number).
Bhalla, S. (1995). Development, Poverty and Policy – the Harayana experience. Economic and Political Weekly, October 14-21.
Bhatty, I.Z. (1974). Inequality and poverty in rural India. Sankhya Series C, Vol.36. Brewer, J.D.; Naik.G., et.al. (1997) IMT in India: Policies, processes and performance. IIMI
:Colombo and IIM: Ahmedabad, 1997. Bussolo, M.; and Connor, D.O’. (2002). Technology and Poverty: Mapping the connections in
Technology and Poverty Reduction in Asia and the Pacific. Development Centre Seminars, OECD.
Chambers, R. (1985). Poverty and livelihoods: Whose reality counts? Institute of Development Studies: Brighton.
Chambers, R. (1988). Poverty in India: Concepts, Research and Reality (Discussion paper 241). Institute of Development Studies.
Chambers, R. (1992). Managing canal irrigation (reprint). Oxford & IBH Publications. Dandekar, V.M. (1981). On measurement of poverty. Economic and Political Weekly, Vol 16 No.
30. Dandekar, V.M. (1994). The Indian Economy 1947-92: Agriculture. Sage Publications: New
Delhi. Dandekar, V.M.; and Nilakantha, Rath. (1971). Poverty in India. Indian School of Political
Economy. Dantawala, M.L. (1973). Poverty in India – then and now 1870-1970. MacMillan: Delhi. Datt, G. (1999). Has poverty declined since economic reforms? Statistical data analysis.
Economic and Political Weekly. December 11. Datt, G.; Ravallion, M. (1996). Why have some Indian states done better than others at reducing
poverty. The World Bank, Policy Research Working Paper. Deaton, A.; Jean, Dreze. (2002). Poverty and Inequality in India – A re-examination. Economic
and Political Weekly, September 7. Dev. S. Mahendra. (1995). Alleviating Poverty: Maharashtra Employment Guarantee Scheme.
Economic and Political Weekly, October 14-21. Dhawan, B.D. (1986). Output impact according to main irrigation sources: Empirical evidence
from four selected states. Seminar on ‘Water Management’, INSA :New Delhi. Dhawan, B.D. (1988). Irrigation in India’s Agricultural development. Sage Publications: New
Delhi.

60
Dhawan, B.D. (1988b). Impact of Irrigation on Farm Economy in High Rainfall Areas: The Kal Project. Economic and Political Weekly, December 24-31.
Dhawan, B.D. (1989). Studies in Irrigation and Water Management. Common Wealth Publishers: New Delhi.
Dhawan, B.D. (2000). Economic impact of major water resources projects on farm economy of India. Agricultural Situation in India, December.
Dreze, Jean. (1990). Famine prevention in India in Jean Dreze and Amartya Sen (eds). The Political Economy of Hunger, Vol. 2. Clarendon Press: Oxford.
Dutt, R.C. as cited in Dantawala, ML. (1973). Poverty in India then and now; Mukherjee, M. National Income of India (1969). Trends and Structure. Statistical Publishing Society: Calcutta.
Dutta, B. (1978). On poverty in India. Indian Economic Review, Vol. 13. Epstein; Scarlett. T; Suryanarayana, AP; Thimmagowda, T. (1998). Village Voices: Forty years
of Rural Transformation in South India. Sage: New Delhi. Fan, Shenggen; P. Hazell; Sukhadeo Thorat. (1999). Linkages between government spending
growth and poverty in rural India. International Food Policy Research Institute. Fan, S; Hazell, P.; and. Thorat, S. (1999). Linkages between Government spending, growth and
poverty in Rural India. Research Report 110. IFPRI: Washington, D.C. Fan, S.; and Hazell, P. (2000). Returns to Public Investment: Evidence from India and China,
2020 focus 4, Brief No.5. IFPRI. Gadgil, D.R. (1948). Economic effects of irrigation: Report of a survey of the direct and indirect
benefits of Godavari and Pranava canals. Gokhle Institute of Politics and Economics: Poona. Ganesan. (1997). Economic Appraisal of Irrigation Projects in India. Bhagirath, Vol. XXXXIV,
January – March. Ganguly, B.N. (1977). Indian economic thought: Nineteenth century perspectives, Tata McGraw
Hill. Gilmartin, D.; Madsen. (1999). The irrigating public: the state and local management in colonial
irrigation in State, Society and Environment in South Asia. Curzon Press: UK. Gita, Sen. (1999). Endangering poverty alleviation: Challenges and Opportunities. Development
and Change, Vol 30. Government of India, Ministry of Water Resources. (1996). Report of the Working Group on
Participation Irrigation Management for formulation of Plan. Proposals for Ninth Five Year Plan, New Delhi.
Government of India. (1972). Report of the Irrigation Commission, Vol. 1. Ministry of Irrigation and Power: New Delhi..
Government of India, (1992). Committee on irrigation pricing report (Vaidyanathan Committee Report), New Delhi.
Government of India. (1995). Water and Related Statistics. Central Water Commission: New Delhi.
Government of India. (1998). Directorate of Economics & Statistics, Agricultural statistics at a glance. Ministry of Agriculture, :New Delhi.
Government of India, Planning Commission. (1999c). Ninth Five Year Plan,1997-200. Vol. 1 & 2, New Delhi.
Government of India. (2001). Report of the National Commission for Integrated Water Resources Development Plan. Ministry of Water Resources: New Delhi.
Government of India. (2001a). Report of the Working Group on Command Area Development Program (CADP) for 10th Five Year Plan (2002-2007). Planning Commission :New Delhi.
Government of India. (2002). National Human Development Report of 2002.Planning Commission: New Delhi.
Griffin, K.; Ghose, A.K. (1979). Growth and impoverishment in the rural areas of Asia. World Development. Vol.7, No.4 & 5.
Griffin, K. (1976). Land concentration and rural poverty, Macmillan Press.

61
Groenfeldf, D. (1998). Handbook on Participatory Irrigation Management. EDI, World Bank. Hanumanth Rao C.H.; Ray, S.K; Subba Rao, K. (1988). Unstable agriculture and droughts:
Implications for policy. Vikas: New Delhi. Hart, H. (1978). ‘Anarchy, paternalism or collective responsibility’ under the canals. Economic
and Political Weekly, December. Hashim, Ali. (1983). One season of integrated water management. ODA. Hasnip, N. et. al. (2001). Contribution of Irrigation to Sustaining Rural Livelihoods (KAR Project
R 7879 – Literature Review), DFID. Hooja, R,; Giangare; Raju, K V eds. (2002). WUAs: Users in Water Management, Rawat
Publications, :New Delhi. IRDAS. (1995). Action Research Project in Pochampad. Hyderabad (mimeo). ISPAN. (1994). Policy options: Studies of South India – Tamil Nadu, HP, Bihar, Gujarat,
Maharashtra. ISPAN:Washington DC. Jasveen, Jairath. (1985). Technical and institutional factors in utilization of irrigation: A case
study of public canals in Punjab. Economic and Political Weekly, Vol.20, No. 13. Joshi, L.K. (2000). Irrigation and its management in India: Need for a paradigm shift. In Joshi,
L.K.; Rakesh, Hooja. (Eds.). Participatory Irrigation Management, Vol. 1. Rawat Publications: New Delhi.
Jurriens, R.; and Kornalis, de Jong. (1989). Irrigation Water Management – A literature survey. Working Party “irrigation and development”. Wageningen Agricultural University.
Kallur, M.S. (1988). Irrigation and Economic Development. Chugh Publications: Allahabad. Khan, A.R; and Griffin, K. (1979). Poverty and Landless in Rural Asia. International Labour
Office: Geneva (mimeo). Khuspe, T.S.; and Sawant, G. K. (1998). Constraints in utilization of canal water, Agricultural
Situation in India, Vol. 32, No. 10. Kishore, A. (2002). Social impact of canal irrigation: Review of 30 years of research. IWMI –
Tata water policy program. International Water Management Institute: Anand. Kolavalli, S. (1995). Assessing Water Users Associations. Indian Institute of Management
(mimeo). Lal, M. (2001). Climatic change: Implications for India’s Water Resources. Journal of Indian
Water Resources Society, Vol 21, No.3. Li, H.; Squire, L.; and Zon, H.F. (1998) Explaining International and Inter temporal variations in
income inequality. The Economic Journal, 108, January. Lipton, M.; and Longhurst, R. (1989). New seeds and Poor people, John Hopkins Univ Press:
Baltimore. Lydall, H.F. (1968). The inequality of Indian incomes. The Economic Weekly, Special number. Maloney, C.; & Raju, K V. (1994). Managing irrigation together. New Delhi: Sage Publications. Maxwell, S. I.; Urey, et.al. (2001). Emerging issues in rural development. An issue paper,
Overseas Development Institute :London. No.10. Minhas, B.S. (1970). Rural poverty, land redistribution and development. Indian Economic
Review, Vol. V. Minhas, B.S. (1974). Planning and the poor, Chapter II. S. Chand and Company. Mishra, S.N.; Ramesh, Chand. (1995). Public and Private capital formation in agriculture.
Economic & Political Weekly (Review agriculture), Vol.XXX, No.12. Mitra. A.K. (1996). Irrigation Sector Reforms: Issues and Approaches. Economic and Political
Weekly, March 30. Mundle, S. (1983). Effect of agricultural production and prices on incidence of rural poverty: A
tentative analysis of interstate variations. Economic and Political Weekly, (Review of Agriculture – June).
Nadkarni, M.V. Irrigation and Rural Development a sceptical view. Economic and Political Weekly, Vol. 19 (26).

62
Naik, G.; Amarlal, H.; Kalro; Jeffrey D Brewer; Samad M ; and Shaktivadivel. (2002). Assessing the impact of irrigation management transfer. Oxford and IBH Publishing Co.: New Delhi
Narayanamoorthy, A. (2001). Irrigation and rural poverty nexus: A state-wise analysis. Indian Journal of Agricultural Economics, Vol. 36, No.1.
Ninan, K.N. (2000). Economic reforms in India: Impact on the poor and poverty reduction (IDS Working paper 102). Institute of Development Studies.
Obitas, K.; Peter, J. R; Pingle, G.; Quaddumi, H M; Perera, J. (1999). Transferring irrigation management to farmers in Andhra Pradesh, India, World Bank technical paper 449. World Bank: Washington DC.
ODI. (1976). Canal System in North West India and Pakistan. ODI:London. Ojha, P.D. (1970). A configuration of Indian poverty: Inequality and levels of living, Reserve
Bank of India Bulletin, January. Padmaja, Lal.; Chakravarty S.R.; and Bhattacharya, N. (1986). Poverty in Rural India: A
decomposition analysis. Indian Economic Review. Vol.21, No.2. Panda, M. (2000). Growth with Equity: Policy lessons from experience of India. Reprint – Indira
Gandhi Institute of Development Research:Mumbai. Pant, D.K.; and Kakali, Patra. (2001). Rural poverty in the early 1990s, Margin Vol.33, No 2&3. Pant, N. (1986). Farmers organizations in large irrigation projects. Economic & Political Weekly,
Vol XXI, No. 52. Pant, N. Utilization of canal water below outlet in Kosi Irrigation project: Administrative and
community level solutions. Economic and Political Weekly, Vol. 27, No. 39. Parthasarathy, R. (2001). Access to water and equity dimensions of Irrigation Management
Transfer: A comparison of Gujarat and Andhra Pradesh, IWMI: Colombo. Pathak, R. S. (1991). Farmers participation in irrigation water management. Ministry of Water
Resources: New Delhi Radhakrishna, R. (1993). Indian agricultural growth, employment and equity In Tapas
Mazumdar (ed.), Nature Man and Indian economy. Oxford University Press. Rajesh, Hooja. (2000). Water and Energy International. Approach for propagating WUAs for
PIM: Some personal reflections based on an Indian State. Raju, K.V; Ruth, Meinzen-Dick; and Ashok, Gulati. (2000). Policy trends in participatory
irrigation management in India In Joshi LK., Rakesh, Hooja (eds). Participatory irrigation management. Paradigm for the 21st century, Vol. 1, Rawat Publications: New Delhi.
Ranadive, K.R. (1965). The Equity of incomes in India, Institute of Economics and Statistics, Oxford University Bulletin.
Ranadive, K.R. (1971). Distribution of income: Trends since planning (mimeo). Rane, A.A. (1981). Poverty and irrigation productivity, Vol. XXII, No.2. Rao, V.K.R.V. (1938). An essay on India’s national income. George Alien and Unwin Ltd.,
London, See Dantawala ‘Poverty in India then and Now 1870-1970’ (1973), Macmillan India. Rao, V.M. (1996). Agricultural Development with a human face: Experiences and prospects.
Economic & Political Weekly. Rath, N. (1985). Garibi Hatao-Can IRDP do it. Economic and Political Weekly, Vol. XX, No.6. Ravallion, M.; Gaurav Dutt. (1996). India’s checkered history in fight against poverty: Are these
lessons for the future? Economic and Political Weekly, special numbers. Ravallion and Datt (1996). How important to India’s poor is the sectoral composition of
economic growth? World Bank Economic Review, 10(1). Ray, S.K.; Hanumantha, Rao, C. H.; and Subba Rao, K. (1988). Unstable agriculture and
droughts: implications for policy studies in economic development and planning. (Ed). TN Madan, Institute of Economic Growth: New Delhi.
Reidinger, R. B. (1980). Water Management by Administrative Procedures in an Indian Irrigation System, In Coward W.E., (ed). (1980). Irrigation and Agricultural Development, Cornell University: Ithaca.

63
Reserve Bank of India. (1963). Pattern of income distribution 1953-54, September. Robert Chambers. (1988). Poverty in India: Concepts, research and reality. Discussion Paper 241,
Institute of Development Studies. Roy, T.K. (1983). Impact of Rajasthan canal project on social, economic and environmental
conditions. National Council for Agricultural Research :New Delhi. Ruth,Meinzen-Dick. (2000). Towards new partnerships in Indian Irrigation. In Joshi, L.K.;
Rakesh,Hooja (eds.). Participatory Irrigation Management: Paradigm for 21st century, Rawat Publications: New Delhi.
Saraswat. (1993). Poverty among identified poor in the wheat belt of India (PhD thesis) quoted In Vidya Sagar, Public Intervention for Poverty: Alleviation in harsh agro-climatic environment.(1995). Economic and Political Weekly, October 14-21.
Sastry, S.A.R. (1980). A survey of Literature on poverty, income distribution and development. Artha Vijnana. Volume 22, No.1.
Satpathy, T. (1984). Irrigation and Economic Development. Ashish Publishers: New Delhi. Sawant, S.D.; and Achutan, C.V. (1995). Agricultural growth across crops and regions: Emerging
trends and patterns. Economic & Political Weekly (Review on agriculture), Vol.XXX No.12. Selvarajan. S, A.; Ravishankar, P.A ;Lakshmiprasanna. (2001). Irrigation development and equity
impacts in India, National Centre for Agricultural Economics and Policy Research (NCAP), Policy paper 14, New Delhi.
Shiva Kumar, A.K. (2002). Poverty and Human Development in India: Getting priorities right. UNDP, India reports. WIP://www.undp.org.in/report/PHDI.htm.
Singh, K. (1978). Pricing irrigation from public canals in India: A proposal. Agricultural Situation of India, Vol.32, No.10.
Singh, K.K (ed.). (1991). Farmers in the management of Irrigation Systems, New Delhi: Sterling. Singh, K.K .(1991). Farmers participation in irrigation management: Basic issues. Singh
K.K.(Ed.) Farmers in the management of irrigation systems. Sterling Publishers: New Delhi. Singh, K.K. (2000). Sustainability of Farmers Organizations. In Joshi, L.K.; Rakesh, Hooja
(eds.). Participatory Irrigation Management: Paradigm for 21st century, Vol. II. Rawat Publications: New Delhi.
Singh, K.K.; Kanwar J S.(1988) People’s participation in Command Area Development – experience and research issues in National Seminar on Water Management – The key to developing agriculture. Agricole Publishing Academy: New Delhi.
Sivamohan, MVK. (1986). Chambal Command Area Development authority: A study of administrative resources. In Sivamohan, MVK (ed.). Issues in Irrigated Agriculture and Command area Development. Ashish Publishing House: New Delhi.
Sivamohan, MVK. (1990). Management Process in Development (PhD thesis). Nagpur University: Nagpur (mimeo).
Sivamohan, MVK.; Scott, C A.(2002). Coalition building for participatory irrigation management under changing water resource trends: Reflections on the reforms in Andhra Pradesh, India (in print).
Subba Rao, K. (1985). Regional variations in impact of anti-poverty program – A review of evidence. Economic and Political Weekly, Vol. XX, No. 43.
Tendulkar, S.D.; and Jain, L.R. (1995). Economic reforms and poverty. Economic and Political Weekly, June 10.
Thakkar, H. (1999). Assessment of Irrigation in India (contributing paper for World Commission on Dams (mimeo) see http://www.dams.org/).
Thakur, D.S. (1985). A survey of Literature on Rural poverty in India. Margin. Vol 17, No.3. Tiwari, S.G. (1968). Some aspects of economic growth in India: 1950-51 to 1964-65. Paper
presented at Sixth Indian Conference on National Income, Bangalore, May. Tyagi, D.S. (1982). How valid are the estimates of trends in rural poverty. Economic & Political
Weekly, June.

64
Vaidyanathan, A.; Ashakrishna Kumar, A.; Rajagopal; and Varatharajan, D. (1994). Impact of irrigation on productivity of land. Journal of Indian School of Political Economy. Vol. 6 No.4, October – December.
Van der Velde, E.J.(1980). Local consequences of a Large Scale Irrigation System in India. In coward W.E., (ed.) (1980). Irrigation and Agricultural Development, Cornell University: Ithaca.
Vermillionj, D.(ed). (1996). Privatization and self-management of irrigation. International Irrigation Management Institute: Colombo.
Wade, R. (1982). The system of administrative and political corruption: Canal irrigation in South India. Journal of Development Studies, 18(3).
Wade, R. (1975). Administration and distribution of irrigation benefits. Economic & Political Weekly, Vol. 10, No. 41.
Wade, R.; Robert, Chambers. (1980). Managing the main system, canal irrigation’s blind spot. Economic and Political Weekly, Vol. 15, No. 39.
Wade, R. (1980). On substituting management for water in canal irrigation: A South Indian case, Economic Political Weekly.
World Bank. (2000). India Policies to reduce poverty and accelerate sustainable development (Report No. 19471-IN), World Bank.
Part—2 Institutional Arrangements for Irrigation Management
in India
2.1 Introduction
2.2 National-level Institutions for Irrigation Management
2.3 State-level Institutions for Irrigation Management
2.4 Local-level Formal and Informal Institutions for Water Supply
and Distribution
2.5 Irrigation Financing: Water Charges and Cost Recovery

65
PART 2
Institutional Arrangement for Irrigation Management in India
2.1. INTRODUCTION
Institutions are sets of common habits, routines, established practices, rules or laws that regulate the relations and interactions between individuals and groups. They are commonly described as the “rules of the game”. They can be recognized at micro-level in the form of day-to-day operational rules, and at macro or constitutional level in the form of allocating the responsibility of making and enforcing the existing day-to-day rules. “While substance of institutional reform relates more to the operational level of analysis, the process of institutional reform relates more to the governance and constitutional level,”(Gerrad 2000).
The dimensions of institutions are classified in several ways as centralized versus decentralized, authoritarian versus non-authoritarian, formal versus informal, incentives based versus penalties based and neutral versus biased towards specific solutions. Hence, it should be noted that institutions are multi-dimensional. The function of the institution and the institutional ideology accepted in the country decides its dimensional points. Institutions are of prime importance in natural resource management and poverty alleviation, as the institutions and resources are interlinked, influencing each other mutually. For analytical purposes, “institutions may be perceived as comprising a) institutional structures b) institutional processes and c) institutional functions. Institutional structures refer to organizations – both formal and informal. Institutional processes refer to policies, laws, rules and regulations and practices. Institutional functions refer to implementation of institutional processes. Both processes and functions may be perceived as software parts of institutions. “Structures are important because they develop the institutional processes, implement them and make them functional,” (Hussain, Biltonen 2002). An attempt is made here to delineate the institutions related to irrigation in India at different levels namely macro (national), meso (state) and operational or micro (project/filed levels). While the micro-level institutional functions are covered separately in the in-depth analysis of the research project, discussion on national and state-level irrigation institutions is included here.

66
2.2. NATIONAL-LEVEL INSTITUTIONS FOR IRRIGATION MANAGEMENT
Constitutional Provisions
The Indian constitution includes detailed provisions with regard to the relationship between the center and state governments. The distribution of powers between the union parliament and state legislatures is dealt in Articles 245 and 246. Article 245 empowers parliament to make laws for the whole or part of the country, and the legislature of the state to make laws for the whole or part of that state, in both cases, subject to the provisions of constitution. According to Article 246(1) parliament is given exclusive powers to make laws with respect to any matters enumerated in List 1 in the Seventh Schedule to the constitution. This list is known as “the Union List”. Likewise, Article 246(3) of constitution bestows powers on to state governments for making laws on matters listed in List II of the Seventh Schedule. This is known as “the State List”. The union or any state legislature also has, according to Article 246(2) of the constitution, concurrent powers to legislate on any of the matters listed in List III in the Seventh Schedule and this is known as “the Concurrent List”.
In the constitutional context of India and its quasi-federal character, the relationships centering around water though are not widely recognized and researched upon by professionals, of late, have however assumed vital importance. The discussions on federalism by far focus on centre-state financial and political relationships, balance of political power, issues of decentralization and local government and so on. Examination of relevant constitutional provisions like entry 17 in the state list, entry 56 in the union list and Article 262(2) show the direct link to the subject matter of water. Entry 17 in the state list, which specifies water as state matter reads “water that is to say, water supplies, irrigation and canals, drainage and embankments, water storage and water power subject to the provisions of entry 56 of List I”. Entry 56 on the other hand endows union parliament with legislative authority over “regulation and development of inter-state rivers and river valleys to the extent to which such regulation and development under the control of the union is declared by parliament by law to be expedient in the public interest.” Further Article 262(1) of the constitution deals with disputes relating to inter- state rivers. It states that parliament may by law provide for the adjudication of any dispute or complaint with respect to use, distribution or control of the waters of or in any inter-state river or river valley. Article 262 (2) states that parliament may by law provide that neither the supreme court nor any other court shall exercise jurisdiction in respect of any such dispute or compliant as is referred to clause (1), not withstanding anything in the constitution. Pursuant to Article 262 of the constitution parliament enacted Inter-state Water Disputes Act in 1956. Thus the constitution forms the foundation of institutional development related to irrigation in India. It has also been argued that water is not as much a state subject as it is believed to be. In the Indian federal system the center has not made much use of the potential for legislation and executive action given to it by constitution in respect of inter-state rivers and river valleys (Iyer 94). This observation was made in the light of competing demands for water, which are ever increasing among the states and the disputes between them defying solutions. The 17 major rivers in the country are shared by two or more states each, and the spatial and temporal variations of water resources are many. Added to this are the factors of steadily declining per capita availability of water and heavy reliance on irrigated agriculture.

67
The institutional arrangement that was evolved with the enactment of 1956 inter-state water disputes act is as follows: when the interests of a state are affected prejudicially or likely to be affected by the other, the state may request under the 1956 Act central government to refer the water dispute to a tribunal for adjudication. The reasons for inter-state disputes could arise because of:
1. any executive action taken or proposed to be taken by the other state, or 2. failure of the other state or any other water authority to exercise any of its powers with respect to the
use, distribution or control of such waters, or 3. failure of other state to implement the terms of any agreement relating to the use, distribution and
control of such waters. Ever since the enactment of 1956 Act, five disputes came up and the tribunals were constituted.
The rivers concerned are Krishna, Narmada, Godavari, Ravi and Beas. Some of them received final adjudicatory orders.
Though the decisions of the tribunals were often criticized for delays, certain legal norms were firmly established. The principle of reasonable and equitable utilization was the guiding rule for the tribunals in resolving riparian rights of the conflicting states. In the process a number of principles emerged (Salman 2002). Some of them were: i) the manner in which dependable flow can be calculated and the consequences of failure of one state to utilize its share during one water year, and ii) treatment of prescriptive rights and of excess or deficit flows. Thus, the creation of tribunals for conflict resolution was very useful; many constitutional experts feels that a more assertive role can be played by the centre in matters regarding water. The background paper on Article 262 (Bakshi 2002) and inter-state disputes relating to water for the National Commission for the working of constitution, exclusively dealt with various ‘legal provisions’ and ‘doctrines’ involved in sharing of water in between the states. Barring the legislative role, the center can however, influence the states by making policy announcements and allocation of budgetary resources. Since most of the state governments are severely cash-strapped, the center can and does influence the states through budgetary allocations. The Sarkaria Commission on center-state relations examined the issue of constitutional provisions in respect to water and could not find favor with the suggestion that water should be included in the union list alone. The National Commission for Integrated Water Resources Development (1999) was of the opinion that while constitutional changes are not required, it urged the union government to enact laws to deal more effectively with inter-state rivers and develop effective institutional consultative mechanisms through which the center and states could agree on a number of issues related to water.
Soon after independence there was a lot of emphasis on providing irrigation infrastructure. Over a period of time we find that the large irrigation projects are no longer preferred. Over the years poverty alleviation programs of various types have expanded in size and today absorb a large volume of resources. The plan provision for rural development is Rs.7,000 crores, for food subsidy Rs.13,000 crores and for kerosene and LPG the subsidy is about Rs.12,000 crores, making a total of Rs.32,000 crores. Against this, the provision for irrigation is only Rs.17,000 crores. The drop in the public investment in irrigation is largely due to the resource crunch faced by the governments – both center and state. However, there is considerable scope to improve the efficiency of existing irrigation infrastructure through better and more participative management practices, making use of the potential already created.

68
National Water Policy
The National Water Resources Council formed under the chairmanship of the Prime Minister formulated the First National Water Policy in 1987. It was revised and a new National Water Policy was adopted in 2002. It is an important milestone in as far as it makes explicit the role of the people in management of the water resources with emphasis on the poor and deprived sections of the society. We reproduce the key features of the National Water Policy that reflect the national thinking and influence the policy environment. • Focus on disadvantaged: Special efforts should be made to formulate projects either in or for the
benefit of areas inhabited by tribal or other specially disadvantaged groups such as schedule castes (SC) and schedule tribes (ST). In other areas too project planning should pay special attention to the needs of SC & ST and other weaker sections of the society.
• Participation in project planning: The involvement and participation of the beneficiaries and other stakeholders should be encouraged right from the project planning stage itself.
• Equity: Water allocation in an irrigation system should be done with due regard to equity and social
justice. Disparities in the availability of water between head reach and tail-end farms and between large and small farms should be obviated by adoption of a rotational water distribution system and supply of water on a volumetric basis subject to certain ceilings and rational pricing.
• Management: Management of the water resources for diverse uses should be done by adopting a
participatory approach, by involving not only the various government agencies but also the users and other stakeholders in an effective and decisive way in various aspects of planning, design, development and management of the water resources schemes.
• Water Users’ Associations: Formation of water users associations with authority and responsibility
should be encouraged to facilitate management, including maintenance of irrigation system in a time-bound manner.
In order to influence the state governments to adopt the key provisions of the National Water
Policy, a working group of National Council constituting the state irrigation/water-resources ministers was created. A draft policy was presented and adopted by the working group. While each state government is free to develop its independent approach to water resource development, it nevertheless to a large extent incorporates the plan priorities and direction set by the central government in the National Policy.
Some of the national-level organizations are discussed here to map out the structure at macro-level.

69
The Planning Commission
The Planning Commission was established by the Government of India in 1950 to promote a rapid rise in the standard of living of the people by efficient exploitation of the resources of the country, increasing production and offering opportunities to all for employment in the service of the community. The Planning Commission was entrusted with the responsibility of making assessment of all resources of the country, augmenting deficit resources, formulating plans for the most effective and balanced utilization of resources and determining priorities. Thus, on behalf of the government the Planning Commission provides the overall framework of planning and growth for the country as per government’s policies and priorities. These policies and priorities are in the form of five-year approach papers that layout the objectives, targets and strategies, resources and other measures, sectoral policies, governance and institutional framework for development.
The Tenth Five-year Plan Approach Paper (2002-07) identifies “water” as a critical input in raising agriculture output and removing poverty. While the paper laments that the public investment in irrigation has fallen significantly over successive plan periods, it exhorts that there is considerable scope for improving the efficiency of the existing irrigation infrastructure, through better and more participative management practices. The Approach Paper makes significant pronouncements regarding user charges that has bearing on the irrigation sector and other public services and utilities. It says, “A good deal of public sector investment is in the provision of public services. The pattern and condition of the provision of such infrastructure services has been done in such a way that the public has got used to not paying economic charges for these services. This includes key services such as power, water supply, irrigation and transport among others. It is primarily the absence of appropriate pricing of public services and the lack of will to collect the levied charges that has caused the large fiscal imbalance that afflicts the country”. The Paper takes on the fallacy of subsidizing the services in the name of the poor by saying. “The argument for not charging appropriate user charges has essentially been based on equity considerations. It is argued that the poor are not able to pay adequately for these essential public services. This argument ignores the fact that it is the better-off sections of the society that consume most such services and therefore benefit from these services. In fact, if the better-offs are made to pay, it would then become possible to provide essential services to reach the poor.” The Planning Commission wields informal influence by reflecting the latest thinking on various issues irrespective of whether anyone acknowledges and follows them in the short run. It influences the direction of national thinking and in determining policy environment in the medium and long term. However, the Planning Commission exhortations are gradually losing their significance ,and it is the independent ministries that determine the specific sectoral policy, thrust areas and specific scheme-wise resource allocations. Its influence over the states is even more dilute.
The Planning Commission which had set up a Committee on Plan Projects (COPP) in the fifties, “published first rate studies on the functioning of irrigation projects, focusing on the deviations from design, their causes and consequences. But COPP has long since been wound up and nothing has been put in its place,” (Vaidyanathan 1999). Vaidyanathan further argues for the revival of this practice, as objective examination of deviations from the original specifications would have informed us about

70
improved project planning required avoiding past mistakes. Lack of reliable irrigation statistics, and non-accessibility of available statistics impede project planning and transparency. Many researches held that faulty designs and planning were primarily responsible for the sordid state of present day irrigation performance.
The Ministry of Water Resources
The Ministry of Water Resources is the nodal agency for Water Resource administration in the country. It was earlier called the Ministry of Irrigation and Power, which was bifurcated and re-christened in 1985, and is responsible for laying down policy guidelines and programs for the development and regulation of the country’s water resources. It also provides technical guidance, research support, planning for command area development and coordination between states. The Ministry also monitors centrally sponsored schemes (CSS).
The Ministry headed by the secretary has various administrative, financial and technical wings. The administrative wing works under the joint secretary (admn) and financial wing is headed by the financial adviser. The technical wings are headed by joint secretary (policy and planning), commissioner (industries), commissioner (projects), commissioner (Bangladesh and Nepal) and joint secretary (administration) with the charge of also Central Ground Water Board (CGWB). The command area development, water management, minor irrigation divisions and the CGWB are directly under the administrative control of the Additional Secretary, who in turn is assisted by the Chief Engineer (CAD), Chief Engineer (WM) and Chief Engineer (M)) and Joint Secretary (admn) in the respective division. The overall activities of the Ministry are described in the Ministry’s Annual report (1989-90) as follows:
1. Providing overall policy, planning and guidance for the water resource sector as a whole. 2. Providing technical guidance, scrutiny, clearance and monitoring of the irrigation, flood control and
multi-purpose river projects (major and medium) of the states. 3. General infrastructural, technical and research support for sectoral development at state level.
4. Providing special central financial assistance or help obtaining finances from funding agencies like
World Bank and other agencies in special cases. 5. Detailing overall planning, policy formulation and rendering guidance with respect to minor irrigation
and command area development and administration and monitoring of CSS. 6. Formulation of national water development perspective and determination of water balance of
different basins/sub-basins for eventual inter-basin transfers.

71
7. Overall resource planning for ground water development, establishment of utilizable resources and making polices for exploitation, overseeing of support to state level activities in ground water development.
8. Coordination, mediation and facilitation in regard to the resolution of inter-state conflicts and disputes
in sharing of water, and in some cases overseeing implementation of inter-state projects. 9. Negotiating and talking to neighboring countries (Bangladesh, Nepal and Pakisthan) inter alia in
regard to river waters, water resource development projects, operation of treaties (Indus Treaty). 10. Operating the central network of flood forecasting and warning in the context of flood control in
inter-state rivers, providing central cases and preparing flood control master plans for the Ganga and the Brahmaputra.
The above listed functions give a broad picture of the center’s role and responsibilities in the water resources sector. The role in implementation is of a catalytic nature. The budget of the central government is supplemented by funds provided in the budgets of various state governments. Accelerated Irrigation Benefits Program (AIBP) was launched by the government of India in 1996-97, for accelerating implementation of ongoing irrigation/multipurpose projects, which are in advanced stage of construction, and could yield irrigation benefits, and which are beyond the resource capabilities of the state governments. Outlay for this program during 2001-02 was Rs. 2000 crores. The Accelerated Irrigation Benefit Program is an important instrument for providing resources to state governments in support of ongoing irrigation schemes.
Under the Ministry of Water Resources there are a number of specialist organizations looking into various aspects of the water resources – including ground water, flood control, hydrology, project construction and some major river project authorities and boards. A number of these organizations seem to have a cocooned existence. For instance, “the technical guidance and scrutiny of major and medium irrigation projects is done by the Central Water Commission. The general infrastructural and research support to sectoral development at the State level is provided by the Central Water Commission, the Central Water and Power Research Station, the Central Soil and Materials Research Station, the National Institute of Hydrology and the Central Board of Irrigation and Power. Consultancy services in regard to water resources projects are provided by Water and Power Consultancy Services (India) Limited, a public sector undertaking under this Ministry. The Central Water Commission also operates a flood forecasting system on inter-state rivers. The preparation of flood control master plans for the Ganga and the Brahmaputra systems has been the responsibility of the Ganga Flood Control Commission and Brahmaputra Board. In regard to ground water development, the Ministry functions through the Central Ground Water Board. Under the national perspectives for water resources development, the water balances of peninsular river basins and sub-basins are being prepared by the National Water Development Agency. There are also a number of Boards and Committees concerned with specific inter-state projects (the Sardar Sarovar Construction Advisory Committee, the Betwa River Board, the Bansagar Control Board, the Mahi Control Board and the Tungabhadra Board). Questions of inter-state coordination, water

72
allocation, cost allocation and related matters pertaining to certain projects on the Narmada are the responsibility of the Narmada Control Authority, a body set up under the Narmada Water Disputes Tribunal’s Award. Lastly, the construction, maintenance and operation of the Farakka Barrage Project has been the responsibility of a separate project organization under the Ministry,” (Kabra 1992). Central Water Commission
Employing more than 5,000 persons, the Central Water Commission (CWC) serves as an apex organization in the country in the field of water resources. Historically, when it was constituted in 1945 it was called “Central Waterways, Irrigation and Navigation Commission”. In 1951 it was merged with the “Central Electricity Commission” and came to be known as “Central Water and Power Commission (CW & PC). Consequent to the changes in the Ministry of Agriculture and Irrigation, the water wing of CW & PC assumed the name CWC in 1974 and functions as an ‘attached office’ to the ministry of water resources, GoI. The CWC is an important organization created by the Ministry.
The CWC is headed by a chairman, with the status of ex-officio secretary to the government of India. The work of the commission is divided among 3 Wings – designs and research wing, water planning and projects wing and river management wing. Allied functions are grouped under respective wings and each wing is placed under the charge of a full-time member with the status of ex-officio additional secretary to the GoI. The members are assisted by officers of the rank of chief engineer, director / superintending engineer, deputy director / executive engineer, assistant director / assistant executive engineer and other engineering and non-engineering officers and supporting staff in various field organizations and directorates. Of late, the CWC is re-organized and it has 13 regional offices each headed by a chief engineer. They are located at Shillong, Siliguri, Patna, Lucknow, Bhopal, Vadodara, Nagpur, Bhubaneshwar, Hyderabad, Bangalore, Coimbatore, Chandigarh and Delhi.
The CWC is entrusted with the general responsibilities of initiating, coordinating and furthering consultations with the state governments concerned, on schemes for the control, conservation and utilization of water resources throughout the country for the purpose of flood management, irrigation, navigation, drinking water supply and power generation. The Commission, if required, also undertakes construction and execution of any such schemes as required. The following are the broad functions of the CWC: • Make all necessary investigations and surveys and if so required, prepare schemes and designs for the
development of river valleys in respect of power generation, irrigation by gravity flow or lift, navigation, flood management, environmental management, rehabilitation and re-settlement of the project-affected families, soil conservation, anti-water logging measures, reclamation of alkaline and saline soils, drainage and other related facilities such as malaria control, recreation and fish culture and drinking water supply.
• Undertake construction work of any river valley development scheme on behalf of the GoI or state governments concerned.

73
• Advise and assist the state governments when so required (commissions, corporations or boards that may be set up) in the investigation, surveys and preparations of river valley and power development schemes for particular areas and regions.
• Advise GoI in matters of water resources development, rights and disputes between different states,
and any matter that may be referred to CWC in connection with river valley development. • Advise GoI and the state governments on the basin-wise development of the water resources.
• Advise GoI on issues of settlement of priorities for plant, materials and foreign exchange between
various river valley development schemes and monitoring of projects. • Collect, coordinate, analyze and publish the data relating to the waterways, tidal rivers, rainfall,
runoff and temperature, ground water resources, sitting of reservoirs, behavior of hydraulic structures, environmental aspects and to act as the Central Bureau of Information in respect of these matters, and collect, maintain and publish statistical data on water resources utilization, including quality of water.
• Initiate schemes and arrange for training of engineers in India and abroad and co-ordinate the training
activities in the state government institutions. • Standardize instruments, methods of observation and record, materials and construction design and
operation of irrigation projects. • Initiate studies on socio-agro-economic and ecological aspects of irrigation projects.
• Conduct and coordinate research on various aspects of river valley development schemes such as
flood management, irrigation, navigation, hydropower development and the concerned structural and design features.
• Promote modern data collection techniques such as remote sensing, satellite technology for water
resources development and river forecasting and development of computer software for the same. • Conduct studies on dam safety aspects for existing and future dams and standardize instruments for
the dam safety measures; • Initiate morphological studies, river behavior, bank erosion / coastal erosion problems.
• Conduct research, experiments and such activities to promote economic and optimum utilization of
water resources and • Promote and create mass awareness in the progress and achievements made by the country in water
resources development.

74
CWC members and officials are represented on several policy levels and advisory board committees constituted by the GoI and state governments from time to time. CWC officials are invariably represented on several river boards and committees examining inter-state water disputes.
National Water Development Agency
The National Water Development Agency was set up in 1980 to promote scientific development for optimum utilization of water resources in the country and for preparing feasibility reports for inter-basin transfer of water. The main objectives of the agency are to: • Promote scientific development for optimum utilization of water resources in the country.
• Carry out detailed surveys and investigations of the possible storage reservoir sites and
interconnecting links in order to establish the feasibility of the proposal of Peninsular Rivers Development and Himalayan Rivers Development Components of the National Perspective for Water Resources Development.
• Carry out detailed studies about the quantum of water in various Peninsular/Himalayan River
Systems, which can be transferred to other basins/states after meeting the reasonable needs of basin-states in the foreseeable future.
• Prepare feasibility reports of various components of the scheme relating to Peninsular Rivers
Development and Himalayan Rivers Development.
National Water Board
The GoI constituted the National Water Board in 1990 with the secretary, Ministry of Water Resources, GoI as its chairman, secretary of the concerned union ministry and chairman, CWC and chief secretaries of states/union territories, as members. The functions entrusted to the Board are:
• Reviewing the progress of implementation of the National Water Policy and reporting to the council.
• Recommending the setting up of appropriate organizations and institutions for the integrated development of water resources as envisaged under the National Water Policy.
• Assessing the achievements of different institutions/agencies working on the appropriate measures for further action.
• Recommending pattern of financing of the water development projects. • Suggesting guidelines for training of personnel required for the water sector. • Making suggestions for undertaking appropriate programs in pursuance of the directives in the
National Water Policy.
75
• Suggesting investment priorities in the water sector for achieving the objective of National Water Policy.
• Considering problems/matters associated with development and management of the nation’s water resources as and when brought before the Board, and recommend suitably to Ministry of Water Resources/National Water Resources Council.
“The Board held ten regular meetings and one special meeting so far,” mentions NCIWRD report (1999), and “it served as a useful forum for centre – state discussions at senior officers’ level and on a number of complex issues agreement could be reached at the level of officers”.
Water and Power Consultancy Services (India) Ltd
Water and Power Consultancy Services (India) Limited, New Delhi, provide an integrated package of consultancy services in the water resources sector. The main objectives of the company are to: • Establish, provide and perform engineering and related technical and consultancy services for
development of water resources, irrigation and drainage, electric power, flood control and water supply projects.
• Establish, provide, maintain and perform procurement, inspection, expediting, management of construction and related services in connection with the construction of water resources development projects including dams, barrages, weirs, tunnels, canals, hydro-power stations and thermal power stations and transmission and distribution systems.
• Carry on all kinds of business relating to:
a. the pre-investment surveys and investigations, planning, design, supervision of construction,
operation and maintenance of all kinds of works involved in the development and utilization of water resources, generation and utilization of electric power; and
b. topographic surveys, aerial photography, hydrological surveys, meteorological surveys, geological surveys, material surveys, underground resources investigations, soil surveys and land classification surveys.
• Issue tenders for works, services and equipment on behalf of customers and be responsible for
scrutinizing them and advising the customers suitably.
• Organize and supervise the erection and commissioning of generating plants, electric transmission and distribution systems.
Centrally Sponsored Programs
The rapid development of irrigation potential through the construction of major and medium irrigation projects in India after independence, though in the initial stages showed promising results, gradually fell into low performance. The indicators were low rates of utilization of irrigation potential created, un-
76
reliability of water supply by the irrigation systems and water logging and salinity. The GoI with the assistance of World Bank tried to improve the situation through two major interventions. They were the initiation of centrally sponsored programs – 1) Command Area Development (CAD) program in 1970s and 2) National Water Management Program (NWMP) in 1980s.The NWMP laid stress on full control of irrigation flows with a view to decrease water losses, improve reliability and prevent salinization. This was in nature of a technical and bureaucratic intervention – building of more control structures and lining of more canals along with attempts to introduce new communication systems. The CAD program on the other hand was aimed at improving field-level irrigation performance and the management at project-level through administrative innovations and institutions. In this context CAD as an institutional intervention needs further discussion. Command Area Development Program (CAD) The core components of works envisaged under the CAD program right from its inception are construction of field channels, field drains, land leveling/shaping and introduction of warabandi (rotational water supply) to improve the utilization of irrigation potential created. The centre provided elaborate guidelines on the structuring of organizations by the individual states for the implementation of the program. Several circulars have been issued by the CAD wing of the Ministry of Water Resources, GoI, on how to go about executing the works mentioned from time to time. However, different states followed different patterns and approaches in the organization structures and also for the field channel construction at field levels. Though CAD organizations were envisaged as multi-departmental structures for functioning under one roof, and promoting irrigated agriculture, the organizational structures vary from state to state.
In some states like Jammu and Kashmir and Meghalaya the CAD program works under the preview of the agriculture department. In the states of Andhra Pradesh, Arunachal Pradesh, Assam, Goa, Gujarat, Harayana, Karnataka, Kerala, Madhya Pradesh, Maharashtra, Manipur, Nagaland, Orissa, Punjab and Tripura, the CAD falls under the jurisdiction of the water resources/irrigation department. In Bihar and West Bengal, minor irrigation department looks after the program. In Himachal Pradesh, the responsibility of implementation is with the department of irrigation and public health. In some states like Rajasthan special CAD departments were created, and in Tamil Nadu, the program is implemented through agricultural engineering department. Except in Rajasthan, the multi departmental structures envisaged at project level for better coordination could not be sustained. Inter-departmental coordination committees in most of the states bring together the secretaries in charge of related departments to ensure inter-disciplinary approach at state-level. Several of the state governments do not have CAD authorities functioning at the project level and the concerned government departments administer the program. Providing distribution network through field channel at territory-level, varied from leaving it to farmers or doing it through departments. The experience of CAD and NWMP helped irrigation engineers to become more conscious of the need for a broader perspective in the planning and management of irrigation (Vaidyanathan 1999).
The following components and activities were incorporated in the program, some of them as it progressed and as the need for them was felt:
77
a. On Farm Development (OFD) - Development of field channels (FC) and field drains (FD) within the command of each outlet. - Land leveling and shaping on an outlet command basis. - Reclamation of water-logged areas. - Introduction of Warabandi and fair distribution of water to individual farmer, possibly through
promotion of farmer’s participation in irrigation management of irrigation water (PIM) and through improved communication system including wireless.
- Realignment of field boundaries, wherever necessary and possible, in combination with consolidation of land-holdings.
- Supply of all inputs and services, including credit. - Strengthening of extension services.
b. Selection and introduction of suitable cropping patterns, again through adaptive trials,
demonstration and training.
c. Development of ground water irrigation to supplement surface water irrigation through conjunctive use of ground and surface waters, by promoting cooperation with related line departments. Subsidy to small and marginal farmers was envisaged for ground water development and sprinkler-drip irrigation.
d. Development and maintenance of the main and intermediate drainage systems.
e. Modernization, maintenance and efficient operation of the irrigation system up to the outlet with
capacity of one cubic food per second (cusec) flow.
f. Increase the production and productivity of agriculture through cooperation amongst different disciplines and departments with adaptive trials, demonstration and training inputs.
g. Monitoring and evaluation for mid-term correction/improvement through organized cells and
through field visits by officials and consultants.

78
2.3. STATE-LEVEL INSTITUTIONS FOR IRRIGATION MANAGEMENT
Irrigation Laws
As irrigation is primarily under the states’ purview different states in India enacted different statutes and rules to regulate and administer irrigation. There are considerable variations in irrigation practices differing vastly from state to state and sometimes within a state itself. These variations were evolved over a century of history. Several factors like rainfall, soil characteristics, topographic features, agricultural practices of the people etc., of the locality and region influenced their evolution and development. Jacob and Singh (1972) compiled the historical development of various state laws in different regions of the country for the use of the Irrigation Commission 1972.
In the northern states of Uttar Pradesh, Punjab and Harayana irrigation canals draw water from snowmelt perennial rivers and run through flat lands of uniform characteristics. The North Indian Canal and Drainage Act 1873 as amended from time to time by different states is applicable to these states. The Rajasthan Irrigation and Drainage Act 1954 and Jammu and Kashmir Canal Drainage Act 1963 are similar to North India Canal and Drainage Act. In these areas water is comparatively cheap and plentiful. To a great extent these conditions were responsible for the emergence and successful implementation of warabandi. These acts empower state governments to use surface water from the rivers, streams and lakes for irrigation. They vest powers with irrigation agencies to regulate supplies of water, construction of water courses, field channels etc., along with powers to levy water charges on the users.
In the western parts of the country irrigation is governed by the Bombay Irrigation Act 1879. Maharashtra is covered by the Madhya Pradesh Irrigation Act 1931 and Hyderabad Irrigation Act 1357 F in Vidarbha and Marathwada regions, respectively. The Madhya Pradesh Irrigation Act unlike other acts bars the accrual of prescriptive rights of easement against the state. However, the Indian Easements Act 1882 through section 2 bars prescriptive rights of easement against the government. Irrigation management under these Acts is to an extent “demand-based,” fluctuating accordingly with storage levels in reservoirs, low rainfall conditions and variations of monsoon from year to year. Farmers apply for permission from irrigation agencies before every crop season for the crop they intend to grow.
In the eastern states of Bihar and West Bengal the irrigation systems operate under the Bengal Irrigation Act 1876 with some variations. Under this Act farmers have to apply for water every fasal (crop season). Even denial of irrigation supplies for the defaulters of irrigation cess was incorporated in the Act. In West Bengal, water rates are either on the basis of area and crops as per the contracts, or uniform water rate in the command area irrespective of crops raised. Under the former method it is immaterial whether the areas were actually irrigated or not but the contracted water cess has to be paid.
The method of localization for wet and dry crops discussed earlier is practiced in the irrigation systems and is provided in the enactments by governments in south India. With the linguistic reorganization of states in India, the states of Tamil Nadu, Andhra Pradesh, Karnataka and Kerala came under the provisions of different irrigation acts applicable for the areas merged. Thus, there are several acts in existence for governing irrigation. Further, for irrigation related activities several other acts were enacted by states as per the need. The multiplicity of legal statutes and their interpretation complicate irrigation administration in India. The Irrigation Commission called for consolidation of these acts into

79
one model act, so that each state can develop its own law within the overall framework. Several research studies also reflected the need for consolidation of irrigation statutes.
In Madhya Pradesh, the following two statutes provide for irrigation development and management in the state. 1) The MP Irrigation Act, 1931; 2) The MP Sinchai Prabandhan Me Krishko Ki Bhagidari Adhiniyam, 1999.
The MP Irrigation Act, 1931 contains provisions for the following, which are relevant to water resource development and planning: rights in water, the supply of water from canals and charges therefore, supply of water to a village tank, construction of submergence tanks, levy and collection of water charges, irrigation agreement and irrigation panchyatas, rights to cut grass, to graze cattle, to fish, to cultivate land, or to do other acts on land or in water under the charge of the irrigation department, construction and maintenance of private irrigation works, power to make rules, define offences and impose penalties. The MP Sinchai Prabandhan Me Krishko Ki Bhagidari Adhiniyam, 1999, deals with a new law transferring irrigation management to farmers. Rights on Water • The MP Irrigation Act declares the right of the government in the water of any river, natural stream or
natural drainage channel, natural lake, or other natural collection of water (Section 26). • Section 28 bars the accrual of rights in water to the detriment of an existing canal. No right can be
acquired against the government under section 15 or section 16 of the Indian Easements Act, 1882, in the water of any river, natural stream or natural drainage channel, lake or other natural collection of water, any of whose water supply an existing canal or one under construction.
• The right of the government overrides not only past and present rights of other persons, but also
future rights. No right shall be acquired against the government under section 15 and 16 of the Indian Easement Act, 1882, in the water of any river, natural stream or natural drainage channel, lake or other natural collection of water, any of whose waters may supply a proposed canal.
• Even when government supplies water from its canals, the Act bars the accrual of perspective rights
of easement or otherwise to such supply. Water will be supplied only with accordance with the provisions of the Act, which provides for periodical supply agreements or grants under specified terms and conditions.
• The Act declares the right of government even over the water discharged as waste after its use for the
purpose for it was supplied. • In summary, the rights of government over water resources are supreme, and its use by any person is
entirely subject to the regulations imposed by law. • Under the provisions of the Act, the government may supply water to village tanks, construct-
submerging tanks, on the request of landholders.

80
• Water rates are charged for this supply as much as supply for irrigation, industry etc. The supply is at
the discretion of the executive engineer. The Act empowers the government to frame rules for this purpose.
• In addition to a water rate, government may also charge an irrigation cess not only on the area
commanded from a canal system but also from submerging tanks, ex-Malgujari tanks, regulators, pick up weirs, Bhandaras and grants-in-aid works.
• If water supply from a private irrigation work increases as a result of the construction of a state canal
nearby, the increase in irrigated area due to such proximity may also be subjected to a water rate. • Cultivated lands on which water has been used in an unauthorized manner shall also be subject to
payment of water rates. Wastage of water is liable to attract the payment of bulk rates, as determined by the executive engineer.
Irrigation Agreements and Irrigation Panchayats
• The Irrigation Act provides for the conclusion of irrigation agreements between the government and the holders of land, either for short-term or long-term. The agreements would include conditions as to the payment of water charges by the landholders and freedom from liability of government for loss occurring to the landholders due to failure or shortage in the supply of water from excess supply.
• Section 62 mandates the establishment of irrigation panchayats for every village or chak or a group of
villages. The Act prescribes the membership of the panchyat, a representative body of the landholders, and their duties and powers. The members of the panchayat have been declared by the Act to be public servants for the purposes of the Indian Penal Code.
• Rights to cut grass, to graze cattle, to fish, to cultivate land, or to do other acts on land or in water
under the charge of the irrigation department. • An important provision in the Irrigation Act relates to certain activities on land and in water under the
charge of the irrigation department, the sums due from which are to be collected by that department.
These are: - Cutting grass and wood - Grazing cattle - Fishing - Cultivating land in tank beds - Fishing in tanks and canals - Plucking all kinds of fruits and any other produce.

81
The irrigation department has the authority, generally, to grant leases for the right to the above. In respect of tanks and tank beds adjoining government forests, the power to grant leases for fishing, other water right and tank beds cultivation only lies with the irrigation department. The disposal of forest produce such as fruits, honey, lac, gum, harra wood, tendu leaves, bamboo, etc., is left with the forest department. Executive orders issued by the government provide for the following:
- Leasing out tank bed cultivation. - Leasing out fishing rights other than those in the possession of the fisheries department.
Construction and maintenance of private irrigation works
• This Act empowers the state government to make a grant or loan of money to any individual towards the cost of construction or improvement of a private irrigation work.
• Any permanent holder designing to construct any dam or any other work of similar nature in any
river, natural stream, natural drainage channel, lake or other natural collection of water as part of a private irrigation work or a grant-in-aid irrigation, may apply in writing to the state government through the Collector.
• Where such grant-in-aid irrigation work has been constructed or improved, the government has the
power to enforce maintenance of the works in accordance with rules prescribed under the Act, on the person who acquires such grant and loan, or his representative – in interest.
• The Act also provides for acquisition of land for constructing or improving irrigation works if the
applicant so desires, and has applied for it. These facilities are available even for those who undertake construction or improvement of irrigation works without the aid of grant or loan from government. In such cases, the provisions of the Land Acquisition Act, 1894 applies.
Power to make rules, define offences and impose penalties
This Act confers on the state government exclusive power to frame rules for the implementation of the Act. Even in the case of irrigation panchayats, the government reserves the power to make rules for their functioning.
In summary, the MP Irrigation Act provides for the following rights as well as powers of the government, to be exercised by the irrigation department.
• Rights over all water resources. • Power to control construction, maintenance, and operation of private irrigation works. • Monopoly powers to supply water and charge rates for irrigation, or industry through agreements. • Power to supply water to village tanks on government–determined terms and conditions.

82
• Power to constitute and control, through rules determined for the purpose, irrigation Panchayats. • Powers to confer and regulate rights to cut grass, to graze cattle, to fish, to cultivate land, or to do
other acts on land or in water under the charge of the irrigation department. Andhra Pradesh Irrigation Acts There is no statutory Irrigation Act for the Andhra region. Some directions from the government and revenue board’s standing orders covered some aspects of irrigation discipline. Some of the important legal acts pertinent to irrigation in AP are: the AP Telangana Irrigation Act 1357 (fasli), and Andhra Pradesh (Andhra area) Irrigation Cess Act. The AP Irrigation (Construction and Maintenance of Water courses) Act 1965 deals with construction of watercourses upto a block of 10 hectares. The AP Irrigation Utilization and Command Area Development Act 1984 was aimed at implementing various programs under CAD effectively. It provides for regulation, maintenance and repairs of irrigation systems, water management for optimum use of water, prevention of land erosion and water logging, improvement of soil fertility and regulation of cropping pattern and for pro-poor maintenance and upkeep of irrigation systems in the state, for ensuring benefits to the cultivators under the command areas.
This act also provides for levy of penalties (by outlet committees), in addition to the water charges collected by the revenue department. Thus the CAD act was a forerunner to the concept of participatory irrigation management in the state. PIM Acts The Andhra Pradesh Farmers’ Management of Irrigation Systems Act (APFMIS) 1997 and M P Sinchai Prabhandhan Me Krishko Ki Bhagidari Adhiniam (hereafter called MP Act of PIM) are by far the most important acts in the irrigation sector reforms. The state of Andhra Pradesh was the first to promulgate this act followed by MP. Both the acts have the following features: • Gives water rights in an irrigation system to the farmers, through farmers, through the farmers’
organizations (FOs).
• Ensures functional and administrative autonomy to the FOs. • Provides the modalities for the creation of FOs in all irrigation projects of the state representing all
the water users. At the field level these are called Water Users’ Associations (WUAs) covering a group of minors/ or small distributories. A group of WUAs along a distributory or distributories are federated into a distributory committee (DC). The DCs under a major irrigation project are brought together as a project committee (PC).
• Makes irrigation department (ID) staff accountable to the WUAs, DCs, and PCs as a competent
authority, requiring ID staff to implement the decisions of the FOs. • Encourages FOs to resolve conflicts themselves.

83
• Enables proper and adequate maintenance and improvement of the irrigation systems by the FOs based on resources raised by them or from the grants given by the government, as a percentage of water charges collected from the water users.
• Allows access to information on scheme operations.
• Permits preparation of the operational plan and the maintenance plan by the WUAs/DCs/PCs.
• Gives freedom of cropping pattern to farmers within the availability of water, and
• Provides procedures and guidelines on accounting, social auditing, water budgeting, election
procedures and other matters of administration. The farmers’ organizations as per the Acts have a right to take action on any of the offences specified in the Acts.
Department of Water Resources / Department of Irrigation
The department of water resources / irrigation is the nodal agency for developing the irrigation potential of the state and monitoring and maintaining the irrigation systems in the state.
In Andhra Pradesh the major irrigation projects are each headed by a chief engineer, each. Thus, NSLC and Krishna Delta area have a chief engineer each supervising all functions related to irrigation. They are assisted by a number of superintendent engineers and executive engineers as per departmental norms. In Madhya Pradesh, the executive engineer (EE) is the chief officer at the level of an irrigation system, unless the system is really large, in which case a superintendent engineer may oversee the system. The EE is a field-level posting and will have his office within the system’s command area.
The systems are divided into sub-divisions headed by sub-division officers (SDO) or the assistant engineers / assistant executive engineers. The SDOs are responsible for release of water, operations and maintenance of the canal system, making payments etc., in their sub-division. The SDO has the powers of a deputy collector to enforce the collection of revenue, in Madhya Pradesh. In Andhra Pradesh, revenue collection is done by the revenue department, separately.
Under the SDO are a number of sub-engineers, who are in some ways the hands and feet of the irrigation department and they are the ones who are actually responsible for all the regulations, canal repair and maintenance works, etc.
Along side the sub-engineers are the amins or revenue collection officers. They are the part of the revenue wing in the office of the SDO. Amins make the collection demands on the farmers based on the area-irrigated, crop variety and mode of irrigation-flow or lift. They also collect the revenue in Madhya Pradesh. Revenue can also be deposited directly by the farmers in the office of the SDO in Andhra Pradesh. The department has a host of other class-four employees like the guards, timekeepers, dak-runners (work-charged staff), etc. and department laborers for carrying out canal repairs. The structure of the irrigation department in AP and the structure of the water resources department in MP are given in figures 2.5.1 and 2.5.2, respectively.

84
Other Institutions affecting Irrigation
District Administration
Districts are administrative units in the states. They are headed by district collectors (DC). They are normally from the Indian Administrative Service cadre. All the state government departments, including the irrigation department, function under the administrative control of the DC. District collectors are responsible for: a) administration and revenue collection through sub-divisional magistrates, b) law and order through the police set up and c) development functions through the district development administration.
DC is a key agent of the state government in the district. DC assisted by the different departments is responsible for enforcing any contract on behalf of the government. Under the MP Participatory Irrigation Management (PIM) Act, Collectors are required to demarcate the area of operation of Farmers’ Organizations (FO). They are also responsible for holding elections and such statutory functions. The process of removal of elected representatives has to be conducted under the supervision of the DC or a representative. The irrigation charges collected by the department of water resources are effected by the interest shown by the DCs, as the land revenue and police department function under them.
Judiciary The Judiciary is a significant factor in ensuring enforcement of any law of the land. Any action under the law can be challenged in the courts. It is the final arbitrator in all cases. Hence, it is important to understand the judicial system in the country/state.
The Indian judicial system has three basic tiers: there are courts at the district level, at the state level and at the national level. Judgements of district-level courts may be appealed in the state-level court and judgements of the state courts may be appealed in the national-level court.
At the district level, a sessions court is one that tries criminal cases, a district court tries civil cases. At the district level one also finds several specialized courts. These include the rent tribunal, consumer court, labor court, revenue court and executive court. The court of the district judge is the highest court in the district to try civil cases. The district judge is empowered to try civil cases and to hear appeals from the lower courts. Under the district judge are the courts of the senior sub-judges, the sub-judges, the munsifs and the small cause courts. The highest district court to try criminal cases is that of the district and the sessions judge. The district judge acts as the sessions judge in a district. The criminal cases are heard by the magistrates. There are three classes of magistrates – the first class, the second class and the third-class magistrates.
The judicial system, especially at the level of districts, has become a virtual hostage to a huge backlog of cases. The procedure of prosecution is such that it is very easy to get adjournments and postponements resulting in the cases never ever being finalized. There are umpteen instances where the cases run the entire generation of defendants. Courts are considered only as a last resort or more often as an alternative to be used for harassment of the opposite party. Under the conditions, the authority of the

85
courts as an institution for imposing penalties to the offenders or for seeking justice by the aggrieved has been largely eroded. Lower courts almost cease to matter as an institution of relevance to the common man. Command Area Development Program Command Area Development (CAD) was introduced as a centrally sponsored program in 1974 mainly for improving irrigation utilization in the command areas of major and medium irrigation projects.
The Madhya Pradesh government has created nine Command Area Development Authorities (CADAs) for the implementation of Command Area Development (CAD) program. The main objective of the CAD Program is to increase agricultural production in irrigated areas by:
a) Bridging the potential created and its utilization. b) Efficient management of irrigation, water, soil and various inputs. c) Scientific crop planning provision for expansion of marketing facilities. d) Farmers' participation in the program right from the beginning.
In 2001-02, in MP there were six command area authorities in 17 districts covering a command
area of 13 irrigation projects. The total command area under the scheme is 1.082 mha. The program is supported with the funds provided by the central government.
The NSLC in Andhra Pradesh was covered under the Command Area Development (CAD) program, which was an intervention to improve the system and ensure availability of water to all the reaches and to all the farmers. To facilitate the implementation of CAD concept an Act called “Andhra Pradesh Irrigation Utilization and Command Area Development Act” (No. 15 of 1984) was enacted in the state. The preamble of the Act states that it is made “to provide for an accelerated increase in agriculture and allied production in the state of AP through a programme of comprehensive and systematic development on scientific and modern lines of command areas, comprising measures for optimum use of lands and water, prevention of land erosion and water logging, improvement of soil fertility and regulation of cropping pattern and for proper maintenance of upkeep of irrigation systems in the state for ensuring maximum benefits to the cultivators under the command area”. A “Pipe Committee” with duly elected members is to be formed, to enforce warabandi (rotational supply of water) by turn, so that every landholding under sluice gets irrigation. To facilitate the flow of irrigation water to all fields, the government of AP, envisaged construction of field channels i.e., water courses beyond the outlet up to the commanding point of each survey number or 5 hectares, whichever is less. This direction was further modified to provide the water course or field channel with related structures beyond the 5 hectare limit, and up to each individual holding within the outlet command, at project cost in all ongoing projects. The NSLC being an ongoing project at this point of time had the benefit of providing a conveyance system up to the holding of each individual farmer, irrespective of the size of the holding.
The process of formation of field channels to convey water to each individual farmer did not fully ensure supply of irrigation to all the farmers. To enable all farmers in the command area to get water within the existing limitations of supplies and structural facilities available, the government decided to “introduce integrated water management above and below the outlet. The organized system of rotation in

86
the main system has to be finalized in full consultation with the command area development authorities and with participation of farmers’ to enable the tail-enders also to take advantage of this arrangement”. The above efforts were made to systematize the distribution of water in the system, so that all farmers, are equally served. In spite of all these administrative efforts, supplies of irrigation to the tail-reaches remained evasive and the concept of pro-poor remained as a myth.
A review made by GoI in 1995 states that “one of the major causes for this inefficient management of water resources is that there is little or no involvement of farmers in management of irrigation system. As a result, the water to the farmers is often unreliable, at variance with their needs, inequitable, unsustainable and insufficient”. In the Krishna Delta System, the situation is different because of two reasons. The first one is that there is no dearth of water in this project since it is at the end of the river system, and availability of water is in surplus. Secondly, the system being in existence for the 150 years and the general terrain being flat, a certain stability in water availability to all reaches of the command was achieved and water-sharing mechanisms were stabilized, except for the fact that tail-end farmers get water supplies a bit late. This has resulted in delayed transplantation operations by farmers for the rice crop in the lower reaches, and the lower yields are recorded by 8 to 10 percent as compared to the head- reach areas. Village Panchayats After the 72nd amendment to the constitution, it is mandatory for the state governments to have Panchayati Raj Institutions (PRI) or the local self-government in the rural areas. MP like the other states has a three-tier structure for local governance - Village Panchayats at the village level, Janpad Panchayat at the block level (mandal-level in AP) and Zilla Panchayat at the district level. The village panchayat has ward members and is headed by Gram Pradhan / Sarpanch. All these representatives are elected directly. Members to Janpad/Mandal and Zilla Panchayat are also elected directly. However, in the case of Janpad/Mandal and Zilla Panchayats the members elected to these respective bodies elect the Chairpersons. All these bodies have reservations for women and schedule caste/schedule tribe representation. Thus, different constituencies are reserved by rotation.
The pachayats are gradually gaining importance with the government increasedly focusing on them for implementation of all development activities. Gram Pradhans / Sarpanchs are beginning to have a reporting relationship with the lower-level state government employees providing services in the village, i.e., village school teachers, health workers, etc.
These bodies have yet to become important instruments of democracy where the concerns of the majority poor and underprivileged are heard. In spite of the reservations for schedule castes and tribes, in many cases, higher caste people have captured the positions in the Panchayats - formally or through surrogates - and hence, continue to dominate both social and economic relationships. There are also positive effects of the PRI System. The election processes have made the village polity more aware of their voting prowess. The social change process expected to take place with grassroots self-governance system is at best very gradual.
It is important to establish some kind linkages of Farmers’ Organizations (FOs) with the PRIs. As the PRIs gain importance they will invariably interfere in FO domains and may lead to scuttling each other's efforts. Friction arose in some places in AP in between these local bodies especially in matters

87
related to usufruct rights, fishing in tanks/canals etc. Tensions also surfaced in between FOs of canal and tank-irrigated areas in some places in the Krishna delta. On the other hand these institutions could have a mutually supportive relationship, wherein PRIs may provide some of their flexible resources to support the initiatives of the FOs. In AP, in some of the villages, the gram panchayats housed FOs in their office premises. Informal Institutions Informal institutions in the rural areas have a major implication on the water distribution and maintenance of the irrigation systems from the perspective of the rural poor. These institutions are discussed in brief below. Social hierarchy - Castes
In India, social and economic deprivation often go together. With some exceptions, the lower caste people are the "poor" in the rural areas. An understanding of the social hierarchy is important to design pro-poor interventions.
India has a long history of occupation-based caste system. Whatever may be the origin and rationality of the caste structure, it had become very exploitative. In the rural areas, the higher caste people have most of the assets in the form of land etc., and the lower castes, especially the schedule castes, have very little to none but have to provide menial labor and carry out other dirty tasks mostly for the higher caste people. The higher castes have dominated the social relationships and they continue to look down upon the lower castes with disdain. These conditions have changed to a large extent in the urban areas, and in many states including AP, in the rural areas too. However, these customs are still quite strong in rural MP and more specifically in the project sites visited as part of the field study. In AP, the social equations predominantly changed with the relative economic development of the caste groups.
Any attempt by the lower caste people to ameliorate their condition invariably brings retribution in some form or the other, from the higher caste people. There are social customs that prevent the lower caste people from feeling equal with the higher caste people. In water distribution, the lower caste people are unable to access water towards the end of the distribution chain, by which time the water may also not be available. System of Attached laborers The attached labor system is called harwahi in local parlance in Madhya Pradesh. The landless people mostly get employed as harwahas of the big land owners. The harwahas get paid at the rate of one quintal of wheat per month. However, they have to get their own food and be present at the house of the employers at all hours, if there is a need. The harwahas are also bound to their employers through loan for which they are not charged any interest. The harwahas can be bound to their employers for years. A similar system was prevalent in AP sometime back, but is abandoned with the advent of enactment of the act abolishing the practice of bonded labor.
88
Land Tenancy Sharecropping is a common feature in the states where the land holdings are very skewed. It is a lifeline for a large number of the landless poor. The normal condition of sharecropping is to share half the inputs and also the produce between the landowner and sharecropper. In some cases the land is given on outright lease for a year for an annual rent that varies according to the quality and productivity of land. It varies between Rs. 1000 to Rs. 2000 per acre of land per year, i.e. kharif and rabi crops in MP and in AP.
Rural Informal Credit System Formal credit institutions are not present in good numbers in MP. In the isolated pockets where they are present, they mobilize more deposits than lending in the area. Even if they do, it is to some large farmer. The poor are almost completely out of the ambit of the formal banking system. The situation in Andhra Pradesh is far better. Several agricultural cooperatives and rural banks provide credit, even though the farmers also take credit from money lenders.
In MP the normal credit source in the villages is a large farmer who would prefer to give loans without interest to someone who would thereafter become bonded labor to him.. Otherwise, the prevalent rate of interest for loans is three to five percent per month amounting to 36 to 60 percent per annum, depending on the urgency of the loan. Corruption – Almost an Institution in Itself
It often comes as a surprise to outsiders the level of acceptance of corruption as a normal practice by the village folk. Villagers are very casual about corruption and pay extra to get a legitimate copy of their land record or to lodge an FIR in the police station or to enter the grain market (mandi parishad) to sell produce, etc. These practices are accepted and are not scoffed at. Corrupt is one who does not deliver in spite of accepting gifts. Nevertheless, one does come across instances where the concerned officer would resist corruption and demands for making extra legal payments.
Most often, corruption is due to lack of information or knowledge about procedures. The poor and the lower caste people are largely illiterate and end up bearing the major brunt of corruption. The rich also reconcile to this practice as a ‘way of life’. Moreover, the poor invariably do not have any caste kinship in the bureaucracy to use such relationships to get things done in their favour. Being members of a lower caste they are reconciled to accept things as given.
System of Localization in Andhra Pradesh
Irrigation systems are commonly designed for supplying the full water requirements of crops to be grown in the systems, and as a contiguous one-piece command area. The first design principle maximizes the yield of the crop per unit area and the second minimizes the construction costs per hectare, because, the total canal length and the number of structures required are minimized. However, the design characteristics of protective irrigation systems differ from this normal criterion since it aims at low

89
irrigation intensities and high duties. By planning irrigation for part of the irrigable area, and by limiting irrigation on a particular piece of land to one crop per year, the water is spread over a large area. By designing a large area to be irrigated per unit discharge, supplementary irrigation is implied. The intention is to avoid crop failure on as large an area as possible, rather than to irrigate for maximum yield per unit area.
Thus, the concept of localization is practiced delineating areas for wet or irrigated dry (ID) crops, which is generally in the ratio 1:2. This sort of demarcation has created inequities, particularly in major projects. The “Commission for Irrigation Utilization (1982) AP” examined this aspect critically. Its report says: • “Localization for different types of irrigation which should normally be based on agro-climatic
factors, soil types and the cropping pattern prevalent at the time of project formulation generally becomes an arbitrary exercise. The decisions on intensity of irrigation to extend the canal to more villages, talukas or districts results in large commandable areas at the top-end of the canals being left out of localization, resulting in large-scale indiscipline by farmers located at the head reaches and within easy reach of water. Thus, if the intensity is decided at 50%, this results in 50% farmers in the village getting 100% water needed for full development of the crop and the remaining 50% being totally deprived, causing an ever growing social and economic imbalance in the village, besides inhibiting efficient use of water by the beneficiary farmers.”
• “Protective irrigation through the process of localization and the stated objective to maximize the overall production in the command area of the irrigation system contradicts the individual production and income maximization strategies of farmers. The reason is that the maximization of output per unit of land is a more obvious strategy for individual farmers than the maximization of the (subsistence) crop output per unit of water. Rice is the important cash crop that happens to consume a lot of water. There are strong economic incentives for farmers to grow this crop. Farmers therefore do not adhere to protective cropping patterns. There is a strong tendency towards concentration of irrigation water on rice lands resulting in unequal water distribution and unequal spread of the economic benefits of irrigation.”
Protective systems are designed completely to be supply-oriented and water supply into the
system is not determined by actual and fluctuating demands in the field. Fine tuning supply to demand, which is needed to maximize yield is not the aim. The supply orientation has led to minimum control of water regulating devices for controlling water levels between the intake of the system (weir or dam) and the outlet command areas at the farmers level. The systems are designed for continuous flow and/or ‘automatic distribution’ (that is distribution with no or very little necessity for adjusting outlets over the season). In this way, the management intensity (number of personnel per acre or unit length of canal), and costs are planned to be kept low.
The principle of “localization” in AP was introduced in 1949, first under the Kurnool-Cuddapah canal in Rayalaseema area. It was adopted subsequently by major and medium irrigation projects constructed in the state. While no specific Act as such was formulated for the adoption of localization, it

90
is governed by different rules issued by the government from time to time. The Commission for Irrigation Utilization (1982) observed that there is no rationale behind some of the rules issued.
Localization involves part of the command area in kharif season and another part in rabi season and becomes a “regimental magisterial form of governance”. Having access to irrigation in the process of localization, some farmers within the culturable command area were deprived of any share in the water and this has resulted in them deliberately diverting water to their lands. This tendency to divert water from an irrigation system to lands not legally notified or localized for irrigation under that source, in normal parlance, is called “unauthorized irrigation” (Mollinga 1998), and is considered to be one of the main reasons for shortage of water in the lower reaches of the system. Wherever such unauthorized draws of irrigation is practiced, certain enhanced water cess is to be levied as a deterrent measure for such illegal tapping.
Irrigation Management Transfer in Andhra Pradesh
Though different CAD Acts/Government orders promulgated in different states contain provisions for promoting farmers’ organizations (outlet committees / pipe committees etc.), there were too many infirmities, and no pipe committee formed under those provisions was found functioning. The envisaged partnership of farmers in operations and maintenance of the irrigation systems under CAD could not be achieved. As part of the irrigation sector reforms, the government of Andhra Pradesh was first to address the problems and enacted a separate legislation called the “Andhra Pradesh Farmers Management of Irrigation Systems Act (APFMIS) in 1997. An understanding of the context and processes of passing the Act is necessary to understand the processes of institutional development. The APFMIS Act gives the farmers and their organization an important role and brings them to the centrestage in operation, maintenance and management of all irrigation systems hitherto managed by the government, which include canal systems and tanks.
As common with major and medium projects of other states, large investments, low returns, dilapidated conditions, lack of finances and inadequate maintenance and anarchy in water use characterized the projects in AP also. The ‘gap area’* in the state was estimated to be around half a million hectares. As a prelude to irrigation reforms during April 1996 a series of public consultations were organized in the command areas of major projects. The first consultations were in the nature of eliciting farmers’ view points and the subsequent consultations were used for structured discussions with the stakeholders. The government of AP also by then learnt lessons from the Sriramsagar Project, where pilot projects were undertaken by the Institute of Resource Development and Management (IRDAS), an NGO, deployed by the central government and other funding organizations. Scaling up of the experiments was discussed in government quarters and with farmers. The government also circulated a ‘white paper’ on irrigation and had thorough discussions with opposition political parties. Thus, the preparatory work undertaken by the government was quite elaborate before passing the APFMIS Act.
The government of Madhya Pradesh also followed by passing a similar act called “Madhya Pradesh Sinchai Prabhadhan Me Krishkon Ka Bhagidari Adhiniyam,” in 1999. The provisions of these acts are similar but have some minor variations. These acts are considered as the vehicles of irrigation * ‘Gap area’ is the difference between potential created and utilized.

91
sectoral reform that is currently under way, underlying the aspects of institutional change. The operational points pertinent to the provisions of the acts will be dealt with in the subsequent analysis of the main research project. Here, the provisions and procedures envisaged in the acts are described.

92
A. Andhra Pradesh Farmers’ Management of Irrigation Systems (APFMIS) Act
Structure of Farmers’ Organization (Section 5, 6, 7 & 8) The primary level farmers’ organization is the Water Users’ Association (WUA). The structure of the farmers’ organization depends on the size of the irrigation system. In the case of minor irrigation system it will be a single-tier organization, in medium irrigation projects it will have two-tiers and major projects will have a three-tier.
The WUA will form the basic structure of the organization. A group of WUAs, on a distributory or distributories will be federated to form a Distributory Committee (DC) which will be the second tier. These distributory committees will be federated to form the Project Committee (PC), i.e. the third tier.
All the presidents of the WUAs, in the area of operation of DC will form its general body. The general body will elect a president and four members to form the managing committee of the DC. The presidents of the DC in the project will form general body of the project committee. This body will elect the president and the members for the managing committee. The tenure of each of these bodies is five years. Water Users Association (Section 3/4) The operational area of a WUA is delineated on a hydraulic basis, which has to be administratively viable. The delineation done provisionally is published in the villages concerned and after considering the feedback from the villagers, the boundaries of a WUA are finalized and notified. All the irrigators as per the village revenue records are members of the WUA with voting rights. Other water users are also members of the WUA without voting right.
The area of a WUA is sub-divided into smaller units or territories, each called the Territorial Constituency (TC). The managing committee of a WUA will consist of a president and members elected from each of the TCs. The number of TCs varies from 4 to 10 (only even numbers). The individuals with voting right in each TC area will elect their representative on the managing committee of the WUA. In addition, all the members will elect a president for the WUA.
Within the physical boundary of a WUA there are two categories of members who exist: all landholders and tenants as per revenue records are members with voting right, all other water users are members without voting rights. The Managing committee consists of the President and 4 to 10 members elected from each of the territory. The General body consists of all members in a WUA area, which includes both the voting members and non-voting members.
Rights of Farmers’ Organization (Section 17,18 & 19 and Rule 5)
To enable the farmers’ organization, achieve the envisaged objectives, the Act confers certain rights. They are: • The major objective of a FO is to distribute water equitably among all its members. To realize this
objective the Act has enabled the following rights:

93
- Obtain information in time about water availability, opening/closing of main canal, periods of supply and quantity of supply from the concerned, and
- Receive water at the specified point as per agreed quota for distribution among the water users on terms of equity and social justice;
• Continuous flow of funds is an essential prerequisite for the sustainability of the FOs and to ensure this, the Act has provided for the following regular sources of income:
- Levy separate service charge or additional fees for maintenance of the system to meet management
costs and any other expenses as approved by the general body; - Utilize the bunds and other common land area along the system planting timer, fuel or fruit trees or
grass for augmenting the income of the organization; - Hire charges from land, building etc., belonging to the WUA; - Share in the water tax, as fixed by government; - Any contributions made by members or others; - Special grants provided by government for any specific purposes and borrowing for any specific
purpose; - Sale of proceeds from any of the products from its areas like fish, grass, fruits etc.
• Obtaining optimum productivity per unit of water is a challenge for the FOs. To facilitate this,
agricultural extension activities and the right to grow any crop within the allocated water have been provided in the Act. The activities include:
- Obtain the latest information for optimizing agriculture productivity and organize to procure inputs such as seeds, fertilizers and pesticides for use of its members;
- Freedom to grow any crop other than those expressly prohibited by a law and adjust crop areas within the total water allocated;
- Participate in planning and designing of micro-system. Suggest improvements/modifications in the layout of field channels and land development in the command;
- Plan and promote use of the groundwater and all other activities to optimize irrigation utilization. Responsibility of Farmers’ Organization (Section 17, 18 & 19, Rule 6) • To ensure efficient utilization of water the FOs are responsible for the maintenance of the system,
water distribution, crop planning, preventing wastage of water etc. They have to attend to the following:
- Carry out timely maintenance and repairs to the distributory system, including drains and other
properties; - Ensure measurement of water flows at head and obtain allocated quantity of water;

94
- Prepare the schedules of water deliveries to different reaches in the system and communicate to the concerned with the approval of the general body;
- Organize supply of water to all members in the command area as per the schedules communicated;
- Preparation of crop plan to match water deliveries with crop requirements. Ensure use of water economically and judiciously and avoid misuse and wastage of water;
- Inspect water utilization by the farmers in the command; assess irrigated crop areas and crop yields;
- Take action for the misuse and wastage of water and tampering the irrigation network (as per the provision of the Act) by way of fines and collect the amounts;
- Educate farmers on adopting modern methods of field irrigation such as borders, furrows, graded bunds for improving water use, and educate farmers by organizing training on water management and related items;
- Assist in obtaining agricultural inputs for agricultural operation where feasible and needed; - Improve the system for efficient and economical use of available/allocated water; - Ensure transparency and accountability by involving the general body in its programs by
regularly conducting the meetings; - Organize social auditing and settle all the disputes among the members.
Recall of Elected Members
• If an elected member or president acts contrary to the interest of the farmers’ organization the general body may take action to “recall” him as per section 10 of the Act and rules framed.
- Recall provides right to remove an elected member and can be applied only after at least one year
of functioning; - A notice signed by one-third members is required to be given and a general body meeting has to
be convened within 7 days to approve recall motion by a simple majority and, - Notification will be issued recalling the elected member by the district or state authority
concerned. Functions of Managing Committee (Section 4(6), 6(5), 8 (5&3) and Rule 16) The elected body of the WUA/DC consisting of the president and other members form the Managing Committee (MC) of FO. This body (MC) takes care of day-to-day working and has the following functions: i. Preparation and implementation: of operational plan for each season in its area of operation; kharif
and rabi plans for various crops to be grown; budget and allocate resources for various activities; annual and long-term plans for repairs, maintenance, rehabilitation for development of the irrigation and drainage systems and to accord administrative sanction for taking up works as per availability of resources, on priority;
ii. Ensuring equitable distribution of water among various water users; evolving and implementing
systems for regulation, control, monitoring and reporting of water use and land use; iii. Settlement of disputes amongst the members; providing developmental services to the members
related to irrigation and agriculture and taking up training program for the members;

95
iv. Assisting the revenue, irrigation and agriculture departments in the preparation and maintenance of basic records and maintaining and operating a reserve fund;
v. Scrutinize the audit reports and rectify defects and report to the general body, and establish a
management information system and submit periodical report, as may be prescribed by the government.
Constitution/Functions of Sub-committee (Section 11 and Rule 18) This Act provides for the formation of a sub-committee, whose the various tasks may be carried out effectively. The general body of a Farmers’ Organization may constitute sub-committees under section 11 of the Act, to carry out specific functions. The convenor of a sub-committee shall be a member of the managing committee other than the chairman/president. In addition, there will be four members. In the case of a project committee the four members of the sub-committee will be selected from presidents of WUAs in that project. In the case of a distributory committee, the four members of the sub-committee shall be selected from the territorial constituencies of the WUAs in its jurisdiction. In a WUA, the members shall be drawn out from members with voting rights. It is proposed to have four sub-committees to deal with: finance and resources, works, water management, and monitoring-evaluation and training. Functions of the sub- committees are: i) Finance and resource sub-committee: mobilize and collect resources; ensure collection of dues from
members as levied under section (20) of the Act; recommend to the managing committee the use and deployment of resources and maintain records relating to financial matters.
ii) Works sub-committee: recommend estimates of works for administrative approval; supervise works
and ensure quality control and approve payments for the works. iii) Water management sub-committee: carry out decisions of the managing committee and general body
on the water regulation, schedule of water release, organize patrolling of the canal, channels and regulate the use of water, check the irrigation and drainage system regularly, record the water deliveries, report to the managing committee any violations in the use of water, and maintain records of landowners and water users.
iv) Monitoring-Evaluation and training sub-committee: identify training needs and organize training to
the Water Users; educate in optimum use of water and monitor-specific items like area irrigated, productivity, disputes settlement and resources building.
The sub-committees will meet as frequently as necessary and function under the general
superintendence control and direction of the managing committee of the organization. The members of the managing committee in charge of the sub-committees will preside over the meetings and maintain a record of discussions and decisions.

96
Resources (Section 22 and Rule 25) The funds of the farmers’ organization shall comprise the following, namely: i) grants received from the government as a share of the water tax collected in the area of operation of
the farmers’ organization;
ii) such other funds as may be granted by the state and central government for the development of the area of the operation;
iii) resources raised from any financing agency for undertaking any economic development activities in
its area of operation; iv) income from the properties and assets attached to the irrigation system within its area of operation;
v) fees collected by farmers’ organization for the services rendered in better management of the
irrigation system and vi) amounts received from any other sources.
Social financial Audit of Farmers’ Organization (Section 17, 18 & 19 and Rule 20 & 26) It is essential to bring about transparency and accountability in the functioning of the FO; for this purpose, regular social and financial audit is to be organized. The audit so conducted will be made known to all the beneficiaries under the farmers’ organization, by way of displaying a list containing the benefits accrued with reference to funds spent, on the notice board of the office of each of the farmers’ organization.
Formation of Farmers’ Organization (FO) The APFIMS Act aims “to provide for farmers participation in the management of irrigation system and for matters concerned therewith or incidental thereto”3. The creation of WUAs as per the provisions of the Act and the initial support provided by the government for building up the capacities of the WUAs are discussed below:
The operational area of a WUA under canal irrigation system is delineated on hydraulic basis, each to be served by a distinct segment of the system with a control structure or mechanism at its head for the supply of allocated quantity of water4. In case of tanks, the entire command area under each tank is formed into a single WUA.
The area of operation of a WUA is divided depending upon its size into 4-10 “territorial constituencies” (TCs), also on a hydrological basis with the objective of providing representation to all farmers in the WUA, as follows:
3 The APFMIS Act of 1997 and Rules, department of I&CAD, Government of AP 4 Rule 3 (iii) issued in G.O. No. 45 dated 30.04.1997.

97
Territorial Constituencies (TCs)
Major and Medium Irrigation Projects Up to 1,000 ha. 4 TCs From 1,001 to 1,500 ha. 6 TCs From 1,501 to 2,000 ha. 8 TCs More than 2,000 ha. 10 TCs
Minor Irrigation Projects Up to 200 ha. (500 Ac.) 4 TCs From 201 to 400 ha. (1,000 Ac.) 6 TCs From 401 to 600 ha. (1,500 Ac.) 8 TCs From 601 to 2,000 ha. (5,000 Ac.) 10 TCs
Organization Structure The organizational structure is determined according to the size of the system.
• - Single-tier system in minor schemes : WUA • - Two-tier system in medium schemes : WUA & Distributory committee (DC) • -Three-tier system in major schemes : WUA, DC & Project committee (PC)
The president and TC members constitute the managing committee (MC) of the WUA. The MC is responsible for carrying out the day-to-day functions, as specified under the Act. The presidents of all the WUAs within a DC area constitute the DC’s general body and from this the MC is elected. In major projects, all the presidents of the DCs in the project area constitute the general body or the project committee. The PC will also have a MC comprising chairman and up to nine members, responsible for functions at this level. Presidents of all PCs are finally to be federated into an Apex Committee at the state level. This committee will represent farmers in state-level decisions on policies and priorities in the irrigation sector. Membership The water in a irrigation system is used by the community not only for raising crops but also for other purposes like washing clothes, drinking, cleaning of animals, rearing fish, brick-making etc., and each of the users are stakeholders in the system. Many of these economic activities are directly or indirectly related to water, and the question that arises is who should have a say in the management of the irrigation system when conflicting interests arise. For example, fishermen would like to reduce the water levels to enable them to harvest fish, which may be detrimental to the landholders who need the water to be stored for irrigation.
The irrigation projects in AP, either canal systems or tanks5, are essentially managed and operated by the irrigation department whose main focus is supplying water for irrigation to raise crops. This overriding purpose or function of the system is given priority in the formation of the managing committee for the WUA.
5 All tanks with a command area of 40 ha and more are with the irrigation department,and WUAs are formed for these tanks only.

98
The Act provides for two types of membership, one with voting rights and the other without voting rights6. • Members with voting rights: These are the members who have been registered as owners or tenants
in the record of rights. In respect where both the owner and the tenant are landholders of the same land, the rights are given to the tenant.
• Other water users: All other water users are categorized as members with no voting right. These
include any individual or body corporate or a society using water for domestic, power, non-domestic, commercial, industrial or any other purpose from a government or the corporation source of irrigation. This would include cultivators who have not been recorded in the revenue records.
Election Process The government of AP decided to conduct elections to form WUAs under all the irrigation sources, which are managed by the department of irrigation and notified for 10,292 WUAs covering 89 canal irrigation systems, which included, 16 major irrigation projects, 73 medium irrigation projects and 8,315 tanks (which are categorized as minor irrigation sources). The canal irrigation systems cover around 75 percent of the total irrigated area in the state, with only 20 percent of the WUAs. This is mainly because the irrigated areas are contiguous while tanks which account for 80 percent of the WUAs are scattered all over the state, each with a small area.
The election process was set in motion by appointing the Commissioner, Command Area Development (CAD) of the irrigation department, AP as the chief election officer of the state and the district collectors as the election officer in-charge of the district and 17th June 1997 was notified for election.
The process of election at the district level was organized in two stages. Stage one consisted of issuing a special notification for a WUA in the prescribed form, indicating the dates for filing nominations, withdrawals, date of election and counting. This was followed by publication of the final list of candidates contesting and allotment of symbols. The second stage was related to polling arrangements, publication of final list of polling stations, conducting voting, followed by counting and declaration of results. Each candidate contesting the election was required to deposit a sum of Rs. 200/- along with the nomination form. If a candidate does not poll, one-eighth of all the votes polled in that constituency and his deposit would be forfeited to the government. In the case of others, the deposit would be refunded. Of the notified 10,292 WUAs, elections were completed for 9,885 and in the balance 407, the elections could not be held either due to stay orders from the court or government or due to technical reasons like deficiencies in voters list, lack of nominations, death of candidates etc.7
6Section 3 (4) of the APFMIS Act specifies the membership. 7 This position continues to be the same even after 4 years, since final decisions have not been issued

99
Support by the Government
To encourage the farmers to come together, the government declared a payment of Rs. 50,000 as a special incentive grant to a WUA where all the members of the managing committee are elected unanimously. For the WUAs where there has been a contest, the government decided to give an advance of Rs. 30,000 for meeting the immediate expenses, to be adjusted in the maintenance or any other grant to be provided to it later. Of the total WUAs formed, 53 percent were elected unanimously. In all, a sum of Rs.40.42 lakhs was made available to the elected WUAs either an incentive grant or advance.
The tenure of the WUA is for a period of three years as originally prescribed under section 4 (5) of the APFMIS Act. A convention of the presidents of all the WUAs was organized by the state government of AP during the middle of the second year of the tenure of the WUAs8 to assess the working of these organizations and the facilities required for strengthening the WUAs. During this convention many of the presidents expressed that the 3-year term of the WUA is too short. As per their experience, the first year is more or less gone in understanding the various problems in different reaches and during the second year the necessary measures are initiated both for improving the system and in regulating water distribution. Many felt that the field activity needed to be observed and corrective steps have to be initiated based on experience and by that time the term of the WUAs will be practically coming to a close. An unanimous demand was made to increase the term of the WUA from 3 years to 5 years, so that the organization can accomplish meaningful results and the process of self-management can become an accepted norm in management of irrigation systems. This was agreed to by the Chief Minister of AP who participated in the deliberations. This acceptance as an amendment to the legislation and brought about in November 19989 and the tenure was raised to 5 years. The tenure of the WUAs elected in June 1997 would end by the middle of 2002.
The distribution network in most of the irrigation systems had been in a bad condition because of poor maintenance. The normal grant is Rs. 40 per acre. From this, 85 percent was to meet the salaries of the field staff leaving very little for maintenance.
During the years 1989-99 and 1999-2000, this procedure changed and an amount of Rs.100 per acre was made available for maintenance. These funds are made available to the WUAs at the field level, and distributory committee at the next level. The maintenance works are identified and works executed by the WUAs only. This pattern of maintenance brought about three changes. One, the WUA and farmers have a direct say in what to do and where to do the work. Since the WUA themselves executed the work, the overall quality of work is much better and lastly, there is economy in the expenditure, and money is used more productively. Above all, a sense of ownership of the irrigation system developed among the farmers and WUAs.
With this maintenance irrigation water could flow to tail-end areas. The net result was that the overall net irrigated area increased by about a million acres.
One of the important supportive facilities for the WUA made by the government of AP was to provide financial assistance for improving the system. For taking up a minimum rehabilitation of the
8 A state level convention of all WUA was organized in November 1998, at Hyderabad, in which all the presidents of WUA in the state attended. 9 Bill No. 32 of 1998, dated 24.11.1998, was introduced in the AP State Legislative Assembly and approved.

100
system, considerable finances were made available in the first 3 years to all the WUAs10. It was also stipulated by the government of AP, that the list of maintenance works proposed to be taken up will be given wide local publicity and that the WUA itself should execute the work without the medium of contractors11. Capacity Building Building up of proper environment for effective functioning of the farmers’ organization is a long drawn process since many of the deep-rooted procedures, norms, privileges, etc., need to be modified or changed. Irrigation management at the field level has concentrated the authority and money in a few hands with vested interests. Thus, the WUAs need to break it, which is possible only through building up their capacities. This has been one of the major thrust areas, to enable the WUA to attend to not only water management but also proper maintenance of the system, resolve disputes and ensure the sustainability of the WUAs.
In fact, farmers in general, need to be exposed to their new roles of leadership and decision making. They need to be made aware of their rights and responsibilities and the need for transparency in the functioning of the president and the managing committee.
A series of training programs have been organized both for the presidents of WUAs and irrigation and other concerned agencies within the district/project area. For each course, reading material in simple local language is developed and distributed in large numbers. In addition to the formal training programs, conventions and sadassus at district, regional and state level involving the farmers, officials and policy makers has been a novel feature in the capacity- building of the WUAs. These gatherings served as forums for discussing the issues and working out feasible rectifying measures and many GOs have been issued as amendments to the Act.
Transparency Various guidelines issued by the government of AP, aim to ensure transparency in all the works, effective utilization of the funds available and minimize any possible leakages in the utilization of funds. In spite of these, some of the presidents of the WUAs have misutilized and misappropriated the funds for personal benefits. The Commissioner-CAD has the necessary powers to remove any member or president of the WUA for misconduct and misappropriation of funds as per APFMIS Act, under section 41-A (vi). As of end September 2001, nineteen presidents have been removed by the Commissioner-CAD. In addition, three WUA presidents, one in each of the districts of Anantapur, Krishna and Mahabubnagar have been recalled by a member of the WUA as per section of 10 of the APFMIS Act12.
10 The funds come under the APERP project supported by the World Bank. The amounts made available are: during 1998-99 Rs.118.82 crores, 1999-2000 Rs.169.57 crores, 2000-2001 Rs.51.55 crores and 2001-2002 Rs.149.80 crores (Source: Commissioner, CAD office). 11 Details & Guidelines were issued in G.O. No. 994 of Irrigation & CAD department dated 12.08.1997 and re-iterated in order No.538 of I & CAD department dated 26.12.1997. These were again indicated in G.O. No.64 dated 02.05.1998 12 The information is gathered from the office of the Commissioner-CAD, Hyderabad.

101
B. Madhya Pradesh Sinchai Prabandhan Me Krishako Ki Bhagidari Adhiniyam, 1999
MP was the second state in the country to enact the progressive Participation Irrigation Management Act (MP Sichai Prabandhan Me Krishako Ki Bhagidari Adhiniyam, (No 23 of 1999)). The Madya Pradesh State Legislature Assembly enacted this act modeled on the APFIMS to foster participation of farmers in the management of the irrigation systems of which they are beneficiaries. Also called the MP Participatory Irrigation Management Act (PIM Act) it came into effect from September 1999. It is applicable to the entire State. The Act is in line with the National Water Policy that seeks to ensure participation of the beneficiary community in the management of water systems. Salient features of the Act are discussed below.
Objectives of the Farmers' Organizations13
The objectives of the Farmers' Organizations (FO) as in the Act is to promote and secure distribution of water among its users, adequate maintenance of the irrigation system, efficient and economical utilization of water to optimize agriculture production, protect the environment and achieve ecological balance by involving the farmers, and inculcating a sense of ownership of the irrigation system.
Farmers' Organizations structure14
Under the Act a three-tier structure consisting of Water Users' Association (WUA), the Distributory Committee (DC) and Project Committee (PC) has been created at the (major) system level. An Apex Committee with the Minister in Charge of the Water Resources Department as Chairperson has been created at the State level. Other members of the Apex Committee are Presidents of the PC, two members from NGOs and three officials (not below the rank of Chief Engineer) from the Water Resources and Agriculture Department. The FOs formed under the Act have to take over the irrigation management over a period of time. The farmer organization structure is discussed in greater detail when elaborating the system level formal institutions.
Source of Funds15
The FOs can receive funds from grants and commissions from the State Government as a share of the tax collected in the area of operation. It can receive funds from other agencies including the central government, or as service charges from its members, or from the assets in its control, or any other source.
13 Source: MP Sichai Prabandhan Me Krishako Ki Bhagidari Adhiniyam – Chapter III # 16. 14 Source: MP Sichai Prabandhan Me Krishako Ki Bhagidari Adhiniyam – Chapter II # 3,5,7,9 15 Source: MP Sichai Prabandhan Me Krishako Ki Bhagidari Adhiniyam – Chapter IV # 22
102
Funds received by WUAs Since the formation of WUAs, in April 2000, the 1,470 WUAs received Rs.75 million at Rs.50 per hectare. in June 2000. In March 2001, the WUAs were given another installment of Rs.30 million at Rs. 20 per hectare. In addition, all the 1,470 WUAs in the state were given Rs.5000 each, for administrative and other expenses.
In the financial year 2001-2002, the WUAs were given Rs.90 million at Rs.60 per hectare for major projects, Rs.50 per hectare for medium projects and Rs.40 per hectare for minor projects. All the 1,470 WUAs were given Rs.5000 each, for administrative and other overheads (Source: Vibhagiya Prashasanik Prativedan).
Offences, penalties and appeals16
On a complaint by the Farmer's Organization, the Act has provision for penalties/fines (Rs.500-1,000) and even imprisonment (up to two years) for various offences. These offences could relate to damaging, altering, obstructing, enlarging the canal or interfering with the water flow, interfering in the authorized use of water, using water in an unauthorized manner, wasting water, etc. The Farmer's Organization can levy and collect the fines for the offences and no one can be penalized more than once for the same offence.
Any dispute or difference arising from the constitution, management, powers or functions of a farmer's organization arising between members shall be determined by the Management Committee (MC) of the WUA. If between the MC and member, it would be referred to the MC of the DC. Similarly, if between WUA and DC it will be referred to the MC of the PC and so on. If aggrieved with the decision, it can be appealed to the higher level of the FO. Every appeal has to be disposed within 15 days from the date of filing.
Farmers' Organizations
According to the PIM Act a three-tier structure consisting of the Water Users' Association (WUA), the Distributory Committee (DC) and Project Committee (PC) has been created at the system level. Each of these is discussed in detail below.
Water Users’ Associations17
The command area under each of the irrigation system is delineated on hydraulic basis18 as a water users' area. This is further divided into four to ten territorial constituencies. Water User Associations (WUAs) are formed for each water users' area. 16 Source: MP Sichai Prabandhan Me Krishako Ki Bhagidari Adhiniyam – Chapter-V #23,24,25 17 Ref: MP Sichai Prabandhan Me Krishako Ki Bhagidari Adhiniyam – Chapter II # 3,4. 18 “Hydraulic basis” means the basis of identifying a viable irrigated area served by one or more hydraulic structures such as head works, distributories, minors, pipe outlets and the like

103
The WUA consists of all the water users who are land holders in the delineated area, and three ex-officio members viz. one of Amin cadre, one sub-engineer from the Water Resources Department to act as a coordinator between the department and the WUA, and the third from the Agriculture department to act as an advisor.
The Managing Committee (MC) for each WUA consists of the President and one member from each of the territorial constituencies (TC) of the water users' area. The members of the WUA elect the President and the territorial committee members by direct secret ballot. If the MC does not have a woman member, one woman who is resident of the area is co-opted by the MC. Unless recalled, the tenure of the President and members of the MC is for five years. The MC exercises all powers of the WUA.
Functions of the WUAs:19
Following are the functions of the WUA.
• Prepare and implement warabandi schedule (rotational distribution of water) as approved by the DC/PC. Regulate the use of water among the various pipe outlets according to the warabandi schedule and promote economy of water.
• Prepare a plan for maintenance of the irrigation system at the end of each crop season and carry out
the maintenance of distributory systems, minors and field channels in its jurisdiction. • Maintain register of landholders as published by the revenue department. Prepare and maintain an
inventory of the irrigation system. • Resolve disputes, if any, between members.
• Raise resources and carry out other organizational maintenance functions like maintaining records,
accounts, audit, hold meetings, etc. Distributory Committees20 Distributory Committees (DC) are the second tier of the farmers' organization. Government delineates an area consisting of one or more WUAs as area of operation of a DC. All the Presidents of the WUAs and two nominated members—the Assistant Engineer of the Water Resources Department, who would coordinate with the Department and an advisor from the Agriculture Department—are members of the DC and constitute the General Body.
19 Ref: MP Sichai Prabandhan Me Krishako Ki Bhagidari Adhiniyam – Chapter III # 17 20 Ref: MP Sichai Prabandhan Me Krishako Ki Bhagidari Adhiniyam – Chapter II # 5, 6.

104
The General Body elects through secret ballot the Managing Committee consisting of a President and MC members (not more than five). If there is no woman in the MC then the MC co-opts a woman who is a resident of the area. The MC has a term of five years and exercises all powers on behalf of the DC. Constituents The DCs consist of all the Presidents of the WUAs in its command area and two nominated members; - the Assistant Engineer of the Water Resources Department and another person from the Agriculture Department are members of the DC and constitute the General Body. The General Body elects the Managing Committee consisting of a President and MC members through secret ballot. If there is no woman in the MC then the MC co-opts a woman who is a resident of the area. The MC has a term of five years and exercises all powers on behalf of the DC.
Resources & functions
The DCs are responsible for the maintenance of the distributories. The state government has allocated some funds as grants to the DCs. In some cases we see that the WUAs have pooled their funds for the repair of the distributory. In the Halali Project, the WUAs gave part of their funds to the DC for repair of the distributory since it was in a very bad shape and unless repaired the minors were starved of water. Judicious use of funds is one clear advantage we see after the formation of WUAs. In the earlier department-controlled system such transfers of funds across different allocations would not have been so easy and natural.
In spite of the advantage of having a DC as we see above, DCs are yet to find some ongoing and regular agenda to work. Their roles have not yet emerged sharply. WUAs interact with the farmers directly and have a clear-cut agenda of responding to their problems, whereas, DCs' interactions are limited to the WUAs and can at best coordinate between them.
Project Committees21
Entire command area of an irrigation project is the operational area of the Project Committee (PC). PCs consist of all the DC Presidents and two nominated members—Executive Engineer of the Water Resources Department for coordination, and Deputy Director from the Agriculture Department as an advisor. The PC Management Committee consisting of a President and members (maximum nine) are elected for five years through secret ballot and would co-opt a woman member who is resident of the area if none gets elected.
Project Committees have not been constituted till now. As and when they are constituted they will have an important function of achieving overall development, efficient and distributive use of water. In the Harsi Project we found that the WUA and DC Presidents looked forward to the formation of the Project Committees very expectantly. They think that the real transfer of the irrigation systems as per the PIM Act will happen only after the constitution of the PCs. 21 Ref: MP Sichai Prabandhan Me Krishako Ki Bhagidari Adhiniyam – Chapter II # 7,9.

105
Functions of DC and PC22
The functions of the Distributory Committee and Project Committee are similar except that their jurisdictions are different—distributory and project, respectively. The main functions of these committees are as follows:
• Prepare an operational plan based on its entitlement area, soil, cropping pattern, etc. at the beginning
of each irrigation season.
• Prepare a plan for the maintenance of both the distributories/canals in its area of operation and execute the works.
• Regulate water use among the WUAs/DCs.
• Resolve disputes, raise resources and carry out other organizational maintenance functions like
maintaining records, accounts, audit, hold meetings, etc.
22 Ref: MP Sichai Prabandhan Me Krishako Ki Bhagidari Adhiniyam – Chapter III # 18, 19

106
2.4. LOCAL-LEVEL FORMAL AND INFORMAL INSTITUTIONS FOR WATER SUPPLY AND DISTRIBUTION
Water Rights
Ever increasing water scarcity and competing demands on water on one side and burgeoning population and inefficiencies in water distribution on the other, have brought the issue of water rights to a sharp focus in India. The traditional laws relating to water resources and their use is being questioned. Several researchers argued that a different system of water rights has to be brought in place to remedy the ills plaguing the rational utilization of water. “These writers have, however, seldom fleshed out their proposals in any detail. Only Singh and following him Saleth devote some attention,” writes Rekhi (1992). He further writes that “Saleth has not taken the opportunity to work out the details of the implications of his postulates and have not thus really gone beyond in suggesting the principle of hegemonical state control of water resources”. Change in the legal system is necessary but, it has to be based on historical developments, values and calls for a whole hog change of laws uniformly in all the states. This has become very difficult in the current socio-political context of India.
In India, usefruct right is the only right that is available in water in its natural state. All the irrigation acts reiterate the nature of the state’s rights in natural water. However, the state cannot arbitrarily exercise its power, though its right to regulate irrigation in natural waters is paramount and sovereign in character. All the laws came into existence by institutionalizing water rights in order to regulate and mitigate conflicts in its use. Informal and customary water rights evolved and developed in the country suiting the time and space. They have remained dynamic and changed according to the changing conditions. These rules and rights thus developed performed well even in a heterogeneous society as in India with a local power structure and unequal access to means of production.
The alien rule and later on the ‘welfare state’ usurped several of the rights in water resources which communities enjoyed and to a great extent changed the power relations. Rajagopal and Janakarajan (1992), detailed the traditional and customary water rights enjoyed by the farmers in Tamil Nadu; their disappearance and the recent attempts to revive them under the Tamil Nadu Farmers’ Management of Irrigation Systems Act, 2000. Customary water rights were not given but we regained and acquired and were recognized by the Hindu laws and English laws. The traditional farmers’ institutions and their functioning traced by the authors were somewhat similar to all the south Indian systems where, the acquisition and management of water was undertaken by the local communities. Neerkathi system was common in Karnataka, AP and other states for distribution of irrigation. Repairs and maintenance of the systems was well-known. Starting from the 19th century, the government through various government orders centralized the power in the hands of the irrigation bureaucracy. The case law from several court cases however show that courts by and large held customary rights valid making it difficult for the government to make comprehensive legislation on water. However, several special acts relating to irrigation were passed. Attempts to pass a comprehensive bill on water could not materialize even after independence (Rajagopal and Janakarajan). Starting with the AP legislation of handing over some rights to farmers in the management of irrigation systems, several state governments followed suit. Many of these recent legislations legalize water as the property of landowners only, excluding landless people who hitherto enjoyed customary rights in water.

107
During the Sixth Plan period the construction of field channels and completion of the construction of infrastructure below the outlets was given focused attention, and the works were executed by project authorities at top speed. All these efforts were to have made irrigation water available to each farmer’s field. But, for water to actually run into the field there are two pre-conditions to be fulfilled. The water must first be available in sufficient and assured quantity at the outlet points, and the farmers should avail only their legitimate share of water so that the tail enders also get their due. The realization that construction of field channels alone was not sufficient to ensure delivery of water to all eligible farmers led to the conclusion that a system of water rotation was necessary along with the development of outlet commands to provide for equity and regularity in the supply of water. While looking for a suitable model of operation, attention turned to ‘warabandi’ as practiced in north Indian canal systems, and ‘shejpali’ in Maharashtra and Gujarat and other comparable systems in operation under large tanks in the southern states of India.
However, among all the available rotational systems at the farm level, warabandi found wider appeal among the policy makers and the irrigation bureaucracy. The government of India in its plan documents insisted on speedy implementation of warabandi by the state governments. The Irrigation Manual holds that in order to limit supplies to individual fields to that which is required for optimum growth of crop and to enforce discipline and minimize unnecessary flows, warabandi should be introduced and implemented in all the irrigated areas (GoI 1985). Chambers writes that “…at high levels of government, warabandi had a life of its own as an article of faith, a standard solution, a universal panacea to be introduced and enforced,” (Chambers 1988). Today, none of the farm rotational systems operate satisfactorily as they are basically intended as institutional rationing devices formally administered by the irrigation bureaucracy. Experience showed that the rotational operations below the outlet were realized as a function of the operations of the irrigation system above the outlet level, and both have to be integrated (Hashim Ali 1983). Further, it is increasingly felt that farmers’ organizations alone can effectively implement warabandi program (GoI 1991). While warabandi was appreciated as an ideal model for water use efficiency, equity in distribution and utility for higher productivity (Malhotra 1982), it is highly criticized for the lack of human approach rendering it unrealistic in practical situations (Chambers 1988).
Warabandi System
Warabandi is an old method of rotational water supply practiced in northern and northwestern irrigation systems. The states of Punjab, Haryana and Rajasthan have adopted this system successfully. Farmers in these parts of the country accept this as a system of equitable distribution of water. Warabandi or ‘osrabandi’ was evolved in the historical context of finding ways to avoid conflicts when individuals who could not get water started asserting their rights. It was first reported in the areas of the upper Ganga canal system, one of the oldest in the country, when farmers started to quarrel over water sharing (Singh 1980). The Northern India Canal and Drainage Act 1873, provides beneficiaries the right of distribution of water. In cases where the beneficiaries were unable to arrive at an agreement among themselves they could apply to the executive engineer of the irrigation department to enforce warabandi under the Act (Agarwal 1980). Thus, essentially this system is in the nature of a bureaucratic intervention at the farm level.

108
Reidinger (1974), while discussing the rationing of the canal water of Bhakra at three levels
described how warabandi-rationing at the lowest level (farm level) was implemented. Malhotra vividly described the warabandi system (1982). Some of the technical problems have been rectified since then and the warabandi is now operated with several adjustments in time duration for water flows and also uses semi-auto control devices.
Before describing how warabandi is practiced it is necessary to explain how the required amount of water is made available through the main system to the outlet points down to the tail-end. The system of running canals is very flexible and is based on the principle of supply rather than demand. In other words, the supplies are made available as equitably as possible, irrespective of the fact whether it meets the demand of any particular farm holding. Efforts are made to estimate the farmer’s demands well in advance as to the quantity of water likely to be made available to the farmers’ as well as the dates of release by schedule of the running of canals. The schedule of operations is drawn generally in the first week of October every year, when the position of water levels in reservoirs is ascertained by the irrigation department with the help of data received from the meteorological department and from estimations of snow melting. While strict precautions are taken to adhere to the schedule prepared, the unforeseen shortfall in supplies if any is taken care of in distribution in such a manner that the impact is distributed evenly among all the individual farmlands.
To distribute available water in various distributaries and minors the system is divided into three or four subgroups. Different canals are grouped in such a manner that the full supply discharge of canals in one group approximately equals the full supply discharge in other groups. Each subgroup of canals at the authorized full discharge are run in a rotation of eight days at a time. The advantage perceived in running the canals at full supply discharge lies in the possibility that all outlets in a minor up to its tail-end will be drawing their full supplies without any gate at the head of the outlet. The regulation is attempted up to the head of the minor only, and outlets are not provided gates. In the design of the system gauging arrangements were in-built. To indicate that water has reached all fields the gauge at the tail cluster should show one-foot stage. The outlet types used in the distributary system are ‘semi module’, i.e., earthen, adjustable, proportionate module or open-flume type. Though the adjustments of outlets cannot be easily made, the skilled irrigation staff can always adjust them to ensure authorized shares. Cross-regulators are provided at every off-take point in the main canal, branch canals, distributaries and minors for distributing water by rotating the canals. Wireless systems are installed to expedite communications. Thus, the system can be said to have semi-automatic controls.
The rotation plan in the main system is closely linked to the rotation of supplies below the outlet level. In the warabandi system, the turns of water allocation to the holdings within the outlet command are divided for supplies in a period of seven days, though the minor subsystem minor continuously run for eight days. The idea is to allow a day’s time for water to reach the tail-end outlets at full-supply levels. Turns of irrigation allocation to the individual holdings are decided from head reach to the tail end. During the 168 hours in a week water is allocated to the farm holdings of the entire culture command of the outlet, and in conformity to their respective sizes. The turns of water allocation to the fields generally start from Monday at 6 A.M. of a week to Monday 6 A.M. in the next week. This implies the necessity of night irrigation and vigilant watch of the field channel by the farmer availing the turn. However, from

109
year to year, the warabandi schedule is reshuffled by 12 hours to ensure that any one farmer is not put to the inconvenience of night irrigation year after year.
The warabandi system as described here though seemingly excellent, is not devoid of problems. The system allows for allocation of water proportionate to the size of holding, based on supplies and irrespective of where the holding is located. It is estimated that about 40 percent of the water is lost due to seepage while in transit to the tail-end fields. Warabandi does not take this into account in its operation. Chambers points out to the lack of micro-level empirical evidence of any successful implementation of warabandi. His research shows that four pre-conditions are essential for implementation of warabandi and concludes that the rarity with which these four conditions could be met confirms the fact that very little warabandi could occur. The four pre-conditions mentioned by Chambers are: i. identified land ownership for water allocation, timings and turns; ii. existence of field channels to individual farm fields; iii. stable water scarcity and irrigation turns taken at night and; iv. constant flow at the outlet at predetermined flows.
Warabandi was looked at as an administrative exercise to achieve physical targets. It is still considered to be so. Singh warned that though the objectives of getting additional area under irrigation and supplying a fixed quantity of water at planned time intervals was fine, the danger lies in forgetting the significance of warabandi as a human system having potential in bringing social discipline, group cooperation and social accountability (Singh 1980). However, the ‘blue print’ approach which is commonly amenable for bureaucratic action found wider acceptability with the government agencies at that time. The cardinal principle underlying warabandi is equity. The available water whatever its quantum is to be allocated to the farmers in equal proportion to their CCA, and not just some of the farmers, to meet their total demand (Malhotra et al. 1984). While doing so, the engineering and administrative solutions have to be blended with social engineering in achieving equitable distribution of water. Hence, the policy of the government was to encourage formation of water users’ associations at the outlet level to implement warabandi.
Shejpali System
The system of shejpali – another method of rotational water supply below the outlet of the irrigation system is extensively practiced in the Maharashtra state and parts of Gujarat. This system is considered as a demand-based water supply by the practitioners. This system must have had its origin in the institutional need to promote agricultural production in the newly irrigated regimes after large irrigation projects were constructed in the traditionally rainfed agricultural areas. The idea was to induce farmers to apply for irrigation and help utilization of the newly created resource.
In this system farmers are notified by the irrigation department to make applications for water stating their requirements in terms of crops they intend to raise in the ensuing crop season. The irrigation officials collate the requirements, match them with the work out availability of water in the reservoir for the crop season, and sanction the allocations. In this process, the entire demand of the individual farmer may or may not be granted by the irrigation department. While granting allocations, the irrigation officials
110
also keep in mind the planned extent of areas for commercial and food crops in the irrigation command, in all the three crop seasons viz., kharif, rabi and summer.
The supplies to the farmer’s fields in accordance with sanctions made is effected from tail end to
the head reaches of the distribution network of a minor. In the project areas where shejpali is practiced, gated outlets normally exist so that the discharge can be varied to meet the fluctuating requirements in the area covered by a field channel from an individual outlet. The farmers draw water to their fields according to the sanctioned schedule. One interesting feature of shejpali is that for irrigating the individual fields time is not a constraining factor. The successive farmer in turn irrigates his land when his former completely irrigates his land during his turn. Thus, the system of shejpali differs from warabandi on the following:
a) The demand for irrigation is actually assessed from the farmers instead of basing it merely on
assumptions; b) Sanctioned allocations are supposed to be given starting from the tail-end to the head reach, and; c) Time duration is not fixed for completion of irrigation in individual farm lands when the turn comes.
The third feature in the system more often creates problems in its implementation. Sometimes, the
farmers tend to become lazy in drawing water in an optimal time, while on other occasions they accrue losses by engaging labor before hand anticipating their turn at a specific time. The system can be operated successfully in situations where there is no scarcity of water in the system and cent percent irrigation requirements can be met out of the reservoir. Any slight shortage caused due to any reason whatsoever, made the farmers at the head of the outlet to usurp the rights of those at the tail-end. As this system is practiced from tail-end to head-reaches, it makes the farmers at the head reaches cause breaches in the watercourses causing disruption to the supplies. Further, the operation of the system being outlet-wise, it gives tremendous power to the field staff, which in turn may lead to increased corruption.
Thokwari and Chakwari Systems
These are two forms of warabandi practiced in Uttar Pradesh. ‘Thok’ means a group and in thokwari system a group of farmers get irrigation to their agricultural lands according to a predetermined time schedule. The group may not be homogeneous in terms of caste composition or land holding size. Further, their land may not be contiguous and quite often may intertwine with the lands of other thoks. Thokdars (or thok heads) are chosen by the groups based on the farmer’s acceptance and overall confidence commanded in the individual groups. Generally, persons known for their impartiality and integrity are chosen as thokdars. This system suffers from several defects. The water has to run up and down several time through the main channel resulting in wastage. The system is also susceptible to corrupt practices by the thokdar if he is dishonest, as the list specifying the time of irrigation for each member in the group is available and operated by the thokdar alone (Singh 1980).
The word chak means an outlet command. The chakwari system in Uttar Pradesh was introduced in the areas where land consolidation is completed. Thus, it is of a relatively recent origin. However, in

111
most of the cases thokwari and chakwari systems co-exist. The operation of chakwari is similar to that of thokwari as the individual members in the chak can irrigate one-fourth of their individual lands in the chak. Vant System This is an extensively practiced traditional water supply method in irrigation systems, including the tanks in south India. This system has been practiced over generations. The word ‘vant’ connotes both ‘share’ and ‘turn’. The turns for irrigation of each farmer’s holding is decided and the full share of water proportionate to the full extent of holding is ensured in this system. Generally, the areas covered are those cultivating paddy or sugar cane crops; most of these irrigation systems are water abundant in nature. In the times of scarcity, the shortage is shared among farmers with a perfect understanding, by reducing the area to be irrigated. Under some tank irrigation systems when the water could not reach tail ends, the owners of these lands are compensated by the farmers who utilize the water. In yet some other systems, water is distributed only when it is sufficiently available in the tank.
This is not a rigid system like warabandi where the turn and time are fixed, or like the shejpali where the farmers have to apply to the irrigation department in advance for irrigation during each season. It is flexible. Farmers can adjust turns among themselves by bipartite or tripartite agreements. Thus, specific fields and crops under water stress are provided with irrigation first if they are in the vicinity of their turns.
This system calls for the backing of a tradition as is observed for example in the old irrigation systems of the Vijayanagar Channels (Sivamohan 1991) in south India, where one finds minimal number of water disputes compared to the adjacent Tungabhadra new irrigation canals network. In the vant system irrigation proceeds in a sequence, from one field to the other. This system has in it both the concepts of ‘turn’ and ‘share’. However, this is not explicit in the present management, wherever it is practiced. When the system becomes water-deficient several problems come to the surface.
112
2.5. IRRIGATION FINANCING: WATER CHARGES AND COST RECOVERY
With the objective of increasing food grains production the government, for several years, followed the policy of providing large subsidies to all inputs including irrigation. Though one of the essential requirements for according approval for the construction of an irrigation project was its financial viability, this was virtually overlooked in the interests of providing ‘protective irrigation’. As a result, the aspect of revenue generation of irrigation projects was completely neglected and the losses continued to accumulate over the years. In 1977-78, gross revenue from irrigation accounted for about a fifth of the estimated total cost (including full capital charges) of providing the irrigation. By 1993-94 the recovery rate further deteriorated. Losses on irrigation were are also responsible for the mounting fiscal deficits of the state. A study conducted by the CWC in 1992 showed that between 1974-75 and 1986-87 the average gross receipts from irrigation projects in 16 major states was Rs.12,184 lakhs which was around 52 percent of the total average working expenses of Rs. 23,375 lakhs, for maintaining irrigation infrastructure over the period (IRMED 2001). This study under-pinned the need for a critical review of water rates for meeting minimum requirements of covering annual O&M expenses, and a specified percentage of interest on capital invested from gross receipts of the irrigation projects. The 1987 National Water Policy, the national conference of states’ ministers’ of irrigation and water resources also endorsed this view.
In 1992, the Planning Commission appointed a 17-member committee (GoI 1992) headed by Vaidyanathan to examine afresh the question of water rate revision. Endorsing the commonly held view that the revision should cover O&M costs and modest capital charge in the short run, the committee held the view that eventually it should cover recurring and capital costs fully. The committee further asserted that the fixation of rates should not be based on those expenditures incurred by the government (which are always on the high side due to inefficient management and ‘leakages’). They suggested that the cost revision should be based on season-specific area rates instead of the current practice of crop-specific area rates. This is expected to lead to volumetric pricing in the future (Vaidyanathan 1998). The Vaidyanathan committee on water pricing opined that given the poor state of government finance, the possibility of extending the benefits of irrigation to new and wider areas will be severely constrained if those who are benefiting from public investment in irrigation do not bear the cost of services they receive. So, the irrigation charges should be Rs. 50/hectare (basic levy) and working costs along one percent interest on capital expenditure (Khuspe and Sawant 1998).
The prevailing fiscal conditions of the states would soon compel them to take steps to reduce irrigation losses and subsidies and will prepare the ground for imminent reforms. The World Bank (1999), felt that “inadequate financial flows (cost recovery) and lack of direct linkages between revenue and expenditure and between client and service agency are the root of all these problems”. Hence, it was suggested that a substantial increase of water be charged to cover O&M. The Water Users Associations (WUAs) that are created to collect the water charges (working along with the irrigation agency) have to maintain records and utilize the share in the collections as stipulated for O&M activities. The other recommendations for implementation were – i) improving collection rates ii) generating additional resources through commercial rates for bulk supplies to other users like municipalities, fisheries, industries, power plants etc., iii) introducing volumetric pricing in the place of existing area-based charging system, iv) improving cost-effectiveness of O&M, v) undertaking client-driven service
113
improvements and vi) establishing systems for price regulation, capacity building and transparent billing and cost monitoring.
The World Bank emphasized that the setting for water charges should be removed from the ‘political arena’ and an independent Water Tariff Board be established. Water pricing is also gaining importance among the states as an effective measure of public policy for the effective use of water and sustainability.
The IRMED (2001), in their study on impact of increasing irrigation charges on production costs found that: i) The cost of cultivation, by and large, varied inversely with the size of the farm; larger farms had
lower costs and smaller farms had higher costs. Apart from the economics of scale that operated, the small farmers in order to increase the output used proportionately larger doses of inputs. This could be further substantiated by the observation that per hectare yield of small farms was higher.
ii) Farmers from all categories were able to earn profit from irrigated agriculture for most of the selected crops.
iii) The quality of irrigation provided from surface irrigation is far from satisfactory in most cases. iv) Increases in irrigation rates would not adversely affect the profit of even farmers having smaller
holding sizes. The study while recommending the extent of increase in irrigation rates that are feasible in different states, stressed the need for developing standard annual O&M expenses of the projects to facilitate periodic review. Further, the study emphasized that assured water supply to the farmers by the agency in time was vital as a precondition, for increases in water rates.

114
Figure 2.5.1. Structure of the irrigation department – Andhra Pradesh. Structure of the Irrigation Department – Andhra Pradesh
Minister Major & Medium Irrigation
Minister Minor Irrigation
Principal Secretary Irrigation and Command Area Department
Secretary Command
Secretary Irrigation
Secretary Projects
Deputy/Joint Secretary & Secretarial Staff
Stat
e L
evel
Commissioner Commissionerate of Tenders
Commissioner CADA
Chief Engineer
Director General WALAMTARI
Director Ground
Water Board
CE Major
CE Medium
CE Minor
CE Investigation
CE Designs
CE Mechanical
CE Projects
Hea
d of
Dep
artm
ent l
evel
Superintending Engineer (SE)
Executive Engineer
Executive Engineer
Executive Engineer
D.E.E D.E.E D.E.E D.E.E
AE AE AE AE
Work inspectors & lascars
Dis
tric
t or
Fiel
d L
evel

115
Figure 2.5.2 Structure of the department of water resources – Madhya Pradesh. Structure of Department of Water Resources – Madhya Pradesh
Minister for Water Resources
State Minister for Water Resources
Principal Secretary
Secretary & Engineer in Chief
Chief Engineers –12 (7 According to river basin, 2 for very laprojects and 3 for special tasks) Deputy Secretary 7
Superintendent Engineers - 56 Under Secretary 4
Executive Engineers - 264
Assistant Engineers - 1564
Sub Engineers
Amins
Project Committee
Distributory Committee
WUAs
Daily labourers
System level Structure

116
References:
Agarwal, J P. (1980). Evolution & Practice of Osrabandi in Uttar Pradesh – All India workshop on Warabandi. Administrative Staff College of India (mimeo). Bakshi, P. M. (2002). Article 262 and inter-state disputes relating to water (A background paper for National Commission for the Review of Working of Constitution) – Internet. Gerrad, C. D. (2000). Ten Institutionalist Perspectives on Agriculture and Rural Development:A Conceptual Frame Work for Policy Makers, Managers, and Analysts. XXIV International Conference of Agricultural Economists, Berlin. Government of India. (1985). The Water Management Manual. Ministry of Water Resources: New Delhi. Government of India. (1998). Compendium of Important Circular of the CAD Programme. Ministry of Water Resources, p-20. Government of Andhra Pradesh. (1978). Order no. 66 CAD (1) department, dated 23 September 1978. Government of Andhra Pradesh. (1981). Order no. 33 CAD (1) department, dated 29 April 1981. Government of Andhra Pradesh. (1984). Act no. 15. Government of Andhra Pradesh, Bureau of Economics and Statistics. (2001). Statistical Abstract. Hussain, I.; and Eric, Biltonen (Eds.) (2002). Managing Water for the Poor. International Water Management Institute: Colombo. Institute for Resource Management and Economic Development. (2001). Study on Impact of increasing irrigation charges on cost of production and market prices of important crops. IRMED: New Delhi. Iyer, R R. (1994). Indian Federalism and Water Resources, Water Resources Development, Vol 10, No.2. Jacob, A ;and Singh, S N. (1972). Law relating to Irrigation. The Indian Law Institute: New Delhi. Kabra, K N. (1992). Legal, procedural and institutional aspects of Water Management. Seminar on Irrigation Water Management. Water Management Forum: New Delhi. Khuspe, T S.; and Sawant, G K. (1998). Agricultural situation in India: Constraints in utilization of canal irrigation water. Economic and Political Weekly, 32(10). Malhotra, S. P. (1982). The Warabandi system and its infrastructure. Central Board of Irrigation and Power: New Delhi. Mollinga, P. (1998). On the Water Front, Wageningen: The Netherlands Rajagopal, A.; and Janakarajan, S. Water Rights and Participatory Irrigation Management in India: The case of Surface Water Sector in Tamil Nadu state. Madras: Institute of Development Studies. www.water-2001.de/datenbank.

117
Reidinger, R. B. (1974). Institutional Rationing of Canal Water in Northern India: Conflict between traditional patterns and modern needs. Economic Development and Cultural Changes, 23 (1). Salam, S. M. A. (2002). Inter-state Water Disputes in India: An analysis of the settlement process. Water Policy (2002), 223-237. Singh, K. K. (1980). Warabandi in canal commands: Concept and Practice. In Singh K.K. (Ed.). Warabandi for irrigated agriculture in India. Central Board of Irrigation and Power: New Delhi. Sivamohan, MVK. (1991). Vijaynagar Channels: A traditional irrigation system in transition. In Singh, K.K.(ed.). Farmers in Management of Irrigation Systems. Sterling (book in print): New Delhi. Vaidyanathan, A. (1998). Political economy of water pricing: Some lessons from India. (Paper presented at a conference on Political Economy of Water Pricing held by the World Bank, Washington, D C. Vaidyanathan, A. (1999). Water Resource Management: Institutions and Irrigation Development in India. Oxford: New Delhi. Vibagiya Prashakiya Prativedan 2001-02, Madhya Pradesh Word Publication, pg-31.

Part—3 Poverty in Irrigation Systems – An Analysis for Strategic Interventions
3.1 Introduction
3.2 Study Settings and Data
3.3 Poverty in Irrigated Agriculture: Spatial Dimensions
a. Socio Economic Features of Selected
b. Poverty in selected Systems: Linkages and Spatial Dimensions
3.4. Determinants of Poverty in Irrigated Agriculture
3.5 Irrigation System Performance and Associated Impacts on Poverty
3.6 Analysis of Water Management Institutions: Implications
for the Poor
3.7 Summary and Conclusions
118
PART 3
Country Study- An Analysis for Strategic Interventions
3.1. INTRODUCTION As explained in part one of the report, the overall goal of the study is to promote and catalyze equitable economic growth in rural areas through pro-poor irrigation interventions. The immediate objective is to determine what could realistically be done to improve the returns to poor farm households in the low-productivity irrigated areas. The study focused on selected representative irrigation systems in Andhra Pradesh and Madhya Pradesh with a large number of people living under persistent poverty. The emphasis is on identifying and assessing a set of appropriate economic, financial, institutional and technical interventions at field and system levels, and changes in overall policy and institutional framework as far as they affect the poor’s access to water resources and their productivity levels. The study is based on primary data collected at the system and household levels, supplemented with secondary data wherever necessary.
This part of the report provides details on selected study areas, data, analysis, results, findings and conclusions of the study. This part is divided into 7 sections. Section 1 presents details on study settings, data collection procedures, and characteristics of selected systems and sample households. Section 2 and 3 provide analyses of poverty, including spatial dimensions of poverty, characteristics of the poor and key determinants of poverty in irrigated areas. Section 4 assesses the performance of selected irrigation systems and associated impacts on poverty. Section 5 identifies key constraints to enhancing crop productivity in the studied systems. Productivity and poverty impacts of recent institutional interventions are assessed in section 6. Based on the above, section 7 presents a detailed analysis of constraints and opportunities for reducing poverty in irrigated agriculture. The eighth or last section provides a summary of the key study findings, main conclusions and recommendations.

119
3.2. STUDY SETTINGS AND DATA
The research in India covers a total of four major irrigation23 systems, two located in Madhya Pradesh and two in Andhra Pradesh. This section provides an overview of the resources in the two states.
Andhra Pradesh
Andhra Pradesh with a population of about 72 million (Census, 2001) and a geographical area of 27.68 million hectares, is the fifth largest state in the country. It is located in the tropical region between 130 N to 200 N and 770 E to 850 E. It is bounded by the states of Orissa and Madhya Pradesh in the North, Maharashtra and Karnataka in the West, Tamilnadu in the South and Bay of Bengal in the east with a coastline of 974 Kms. About 73 percent of the population live in rural areas. The labor force constitutes about 45 percent of the total population, and about 65 percent of it are engaged in agriculture. One of the more robust “stylized facts” about poverty in India is that agricultural laborers are highly represented among the poor (Lanjouw 2000). Andhra Pradesh proves to be no exception. The state comprises three regions namely: a) the erstwhile Nizam’s territory called Telengana (with 39% of the state population and 42% of the geographical area), b) Coastal Andhra (with 43% population and 34% area), and c) Rayalaseema (with 18% population, and 24% area). Of the state’s geographical area, 47 percent (12.9 mha) is under cultivation and the net area sown is about 11.04 mha (4.88 mha irrigated). The dominant pattern of land ownership in Andhra Pradesh is small private farms with an average of 1.56 hectares per holding. Irrigated holdings have an average size of 0.88 hectares. About 30 percent of the state economy is contributed by agriculture.
The State has vast water resources with three major rainfed rivers – Godavari, Krishna and Penna, and 37 other medium and minor basins draining the entire state. The total surface water available from these sources is 2,746 thousand million cubic feet (TMC). Ground water availability is 1,000 TMC. The ultimate potential that can be developed from all the surfaces is estimated to cover 9.5 mha (7.3 mha from surface water and 2.2 mha from ground water). By 1999-2000, the total irrigation potential created from all sources is estimated at 6.4 mha.
The Krishna river, the second largest next to the Godavari river in South India, traverses through Mahaboobnagar, Nalgonda, Kurnool, Guntur and Krishna districts in Andhra Pradesh. It has 19 tributaries, important among them being Tungabhadra, Bhima and Musi. The river originates in the Sahyadri range of the Western Ghats in Maharashtra and flows through Maharashtra, Karnataka and Andhra Pradesh for a length of 1,400 km before joining the Bay of Bengal.
AP has 10 major irrigation projects (out of 16) completed in the state. Three of these projects are quite old (over a 100 years), around nine have been developed in the past 4 to 5 decades and the rest are in various stages of development. For this study, one project which is old and another project, which was constructed after the beginning of post-independence planned era in 1950, have been identified. The first one is the Krishna Delta project, which is about 150-years-old and the second is the Nagarjunasagar
23 In India, irrigation projects having cultivable command area (CCA) of more than ten thousand hectares are classified as major, less than two thousand hectares as minor and those ranging from 2,000 to 10,000 hectares as medium.

120
project – Left Command Area (NSLC), which is around 35-years-old. The first one (Krishna delta) is a diversion system with a barrage across the river. The second one Nagarjunasagar Project (NSP), has a reservoir with storage capacity of 7,058 McM or 200 TMC. It is constructed on the river Krishna. The NSP Dam has two main canals, one on the right flank and the other on the right side of the dam and covers a total command of 0.895 mha.
Both the projects are on the Krishna river, which has a catchment area (basin) of 258,948 Sq.km extending in three (3) states as shown in table 3.2.1.
Table 3.2.1. River flows - Krishna Basin.24
River flows Basin area
States
Length (km)
% Sq. Km %
Maharashtra 306 22 76252 29 Karnataka 482 34 69425 27 Andhra Pradesh 612 44 113271 44 Total 1400 100 258948 100
The total dependable water availability in the basin is assessed and this quantity is allocated to different states by a tribunal as follows (table 3.2.2).
Table 3.2.2. Allocation of waters in Krishna Basin.25
Allocated Water States McM or TMC %
Maharashtra 16000 565 27.4 Karnataka 19700 695 33.8 Andhra Pradesh 22660 800 38.8 Total 58360 2060
* McM – Million cubic meters, TMC- Thousand million cubic feet. The allocated quantity of water in the state of AP is apportioned among the various irrigation projects in the basin. The Krishna delta project has an allocation of 5,162 McM or 181 TMC and the NSLC has 3,765 McM or 132 TMC.
A major part of the state (around 75%) is covered with red soil with varying soil depth and clay content (Alfisols), mostly spread out in the entire state. These are generally undulating with low-fertility status. The black soil (Vertisols) occupies around 25 percent of the total area, mostly located in the northern part of the state and to some extent in the central portion. These areas are generally flat with medium to low-fertility status. The alluvial soils are mostly located in the delta areas of the major river, before their confluence into the sea, and extend over 10 percent of the state’s area. The balance 5 percent is occupied by sandy soil, laterites, and other mixed soils.
The last five years have seen the state of Andhra Pradesh making rapid strides in its economic reforms. The irrigation sector has been positively influenced by institutional reforms largely focusing on:
24 Irrigation Commission (1972), Govt. of India, Volume –III, part 2, p-187/188. 25 Krishna Water Dispute Tribunal Report ,1973.

121
i) introduction of a suitable policy and legal framework; ii) formation of water users' associations across all types of irrigation systems in the state; iii) implementation of large-scale training programs for farmers and staff of the irrigation department; iv) bringing in significant financial reforms to influence quality performance of users’ organizations. Today, the state is leading in its irrigation reforms in India (Raju 2000). Major steps are focused on institutional reforms towards irrigation management turnover all over the state. In this connection, the state has formed 10,292 water users associations and 174 distributory committees.
Madhya Pradesh
Madhya Pradesh (MP) is located in the central region of India between 18° and 22° north latitude and 74° to 82° east longitude. Madhya Pradesh accounts for 7.8 percent of India’s population and 13.5 percent of the country’s geographical area. Madhya Pradesh is among the poorest states in the country with a per capita income of Rs. 4025 against the country average of Rs. 553026. The state has a literacy rate of around 45 percent 27. MP has a geographical area of 44.5 million hectares out of which the gross sown area is 25 million hectares, while the net sown area is 19.8 million hectares. Only 5.2 million hectares is sown more than once a year.28 The state consists largely of a plateau with a mean average elevation of 1,600 ft above sea -level. Madhya Pradesh has three principal varieties of black soil and mixed red soil29.
Medium black soil: Medium black soil covers about 20 districts in the south-western and parts of central Madhya Pradesh. Medium black soils are rich in humus and are conducive to growing wheat, cotton, groundnut and soyabean. Mixed red and black soil: Mixed red and black soil covers most parts of Bundelkhand region of north central Madhya Pradesh. It is light textured and is devoid of lime and free of carbonates. It supports a large variety of crops but needs irrigation. Deep black soil: Deep black soil covers a major part of the Narmada valley, especially the districts of Hoshangabad and Narsinghpur. It has a very high humus content and is very good for cotton, wheat and gram.
Madhya Pradesh has a gross cultivated area of 25 million hectares, out of which the gross irrigated area is 6.2 million hectares. Thus, the area irrigated is just over 24 percent. Out of the net cropped area of 19.8 million hectares, the area under food crop is 17.5 million hectares, thus over 70 percent of the cultivated area is under food grains. This indicates the prevaling trend of agricultural practice in the state. The principal food crops are wheat and rice, gram and pulses. Mustard, cotton and sugarcane are other significant crops grown in the irrigated areas of the state. The state has eight major irrigation projects. Table 3.2.3 shows the details of the various sources of irrigation in AP and MP. 26 Source: MP Human Development Report, 1998. 27 Source: Census of India Madhya Pradesh, 1991. 28 Source: Agriculture Statistics, Directorate of Economics and Statistics (DES), Government of India. 29 Source: Population Atlas of India, 1991

122
Table 3.2.3 Sources of irrigation – AP & MP.
Sources of irrigation (in ‘000 ha) Name of the State Canals Tanks Tube wells Other wells Other sources Total Andhra Pradesh 1595 723 828 944 188 4278 Madhya Pradesh 1795 205 875 2394 760 6029 Table 3.2.4 gives the productivity of principal crops in AP and MP in comparison with the national average. Rice and maize productivity is higher in AP, while wheat and gram productivity is higher in MP. Table 3.2.4. Productivity of principal crops (productivity per ha in kgs).
Name of the crops Andhra Pradesh Madhya Pradesh India Rice 2650 831 1900 Wheat 670 1625 2470 Maize 3258 1318 1721 Gram 486 933 812 Soyabean - 1149 1126
Source: Statistical abstract of government of Andhra Pradesh 2000, and department of Agricultural Statistics. In the Ninth Five-year Plan period (1997-2000), it was planned to invest a sum of Rs. 6,030.30 crores. A budget provision of Rs. 2,092.89 crores was made for major, medium and minor irrigation projects for the year 2001-2002.
The cost for the development of a canal system has increased form around Rs.10,000 per hectare in the early Sixties to around Rs. 50,000 by year 200030. The investments in MP for irrigation are not readily available. Table 3.2.5. Plan-wise outlays in AP – irrigation schemes (rupees in crores)
Plan Canal system (major and medium irrigation projects)
Tanks (minor irrigation Projects) Total
I - Plan (1951 - 56) 37.47 3.52 40.99 II - Plan (1956 - 61) 57.43 4.38 61.81 III - Plan (1961 - 66) 91.52 18.60 110.12 3 Annual Plans (1966 - 69) 60.87 10.81 71.68 IV - Plan (1969 - 74) 118.71 18.15 136.86 V - Plan (1974 - 78) 269.11 38.82 307.93 2 Annual Plans (1978 - 80) 257.69 23.79 281.48 VI - Plan (1980 - 85) 729.59 50.73 780.32 VII – Plan (1985 - 90) 1306.40 131.40 1437.80 2 Annual Plans (1990 - 92) 616.67 121.16 737.83 VIII - Plan (1992 - 97) 2754.35 431.56 3185.91 1997 – 1998 662.77 121.57 784.34 1992 – 1999 642.26 194.45 836.71 1999 – 2000 962.99 170.61 1133.60 Source: I&CAD Department, Government of Andhra Pradesh, March 2001.
30 Interview with senior irrigation officials.

123
Figure 3.2.1: Irrigated area under major, medium and minor irrigation in Andhra Pradesh (annual average).
0102030405060708090
Year
Net AreaIrrigatedMinor
Canals (Major& Medium)
Characteristics of Selected Systems Selected Systems in Andhra Pradesh The research study in India covers a total of four major irrigation31 systems, two located in Andhra Pradesh, namely, the Nagarjuna Sagar Left Canal (NSLC) and the Krishna Delta (KD), and two in Madhya Pradesh namely, Halali and Harsi. The four systems are diverse in nature and put together, to a great measure, are representative of the irrigation systems in India. Characteristics of these systems are presented below.
The NSLC, located on the river Krishna is served by a reservoir with a live storage of 200 TMC. The reservoir has a main canal on the right side with a command area of 453 thousand hectares, and another main canal on the left side with a command area of 357 thousand hectares. The latter one is called the Nagarjuna Sagar Left Canal (NSLC) project. The map of the NSLC project is given in Annexure 1.
The NSLC is a contour canal and runs over a length of 298 Kms. The entire command area is divided into around 31 blocks, each served by a main distributary which takes off from the main canal based on local minor ridges. The extent of a block varies from 5,000 ha to 38,000 hectares.
The Krishna Delta Project is located in the lower reaches of River Krishna, around 100 Kms upstream of the confluence of the river with the sea. The river water is diverted into the irrigation system by a barrage built across the river. A series of main canals emanate both on the left flank and the right flank. The command area on the left flank is 295 thousand hectares and on the right side it is around 231 thousand hectares. The map of the KDS project is given in figure 3.2.2.
31 In India, irrigation projects having cultivable command area (CCA) of more than ten thousand ha. are classified as major, less than two thousand hectares as minor, and those ranging from 2,000 to 10,000 hectares as medium.

124
To appreciate the causes for deprivation of irrigation water under major irrigation systems with a very widespread and intensive distribution network in Andhra Pradesh, it is necessary to look into three specific issues relating to the project formulation and development. They are:
i) The planning gap in designing of the system for providing irrigation, ii) Delineation of areas for irrigation and for specified type of irrigation, and iii) The operational procedures adopted for water regulation.
Planning Gap
The difference in the available water in the project and what is actually required to serve the entire command, determines the planning gap. The “Commission of Irrigation Utilization” of the government of AP in its report in 1982, examined the process of planning in detail and said that the planning gap occurs “due to adoption of over-optimistic and unrealistic duties, inadequate water allowance, under-estimation of seepage and other losses, over-estimation of dependable yields, etc.”. In the case of the Nagarjunasagar Left Command Area, the Commission estimated the planning gap as 38 percent, the water allocated for the project being 3,735 McM, while the requirement for the planned crops stands at 5,550 McM.
Delineation of the Areas for Irrigation
In the command under the NSLC, while delineating lands for the purpose of irrigation, certain areas were deleted, like areas near to the village up to about 400 meters, as anti-malarial zone and high spots. Some lands were left out as future inclusions. However, in practice, once irrigation water started flowing, local farmers made their own channels to draw water into all these excluded areas. Even though, technically, their lands are not included in the command, they take water and this is called unauthorized irrigation. The net outcome of this practice is that the flows are reduced and designed flows never reach the lower half of the system.
Operational Procedures
There are no specific operational procedures, except at the macro-level, where each year before the start of the season a notification is issued by the government indicating the date of release of water into the main canal. The concerned chief engineer, after assessing the storage in the project and the inflows, submits a proposal suggesting the date for release of water and then the government issues the orders. At the meso and micro-levels, operational practices are on an ad hoc pattern, and obviously many extraneous factors come into play in this. The above three factors are very relevant in the NSLC area.
In the Krishna Delta irrigation system, since it is at the end of the river system, the ground situation is quite different; essentially it is a “water-surplus system” and the entire area is covered with the rice crop in the first season (kharif). The only problem faced has been that the transplantation period gets delayed

125
by 6 to 8 weeks, as one proceeds to the tail-end areas of the main distributories. In other words, this delayed planting has its effect on the crop yields and generally yields are lower by 300 to 500 kgs per acre, as compared to head-reach areas.
Demographic and Socio-economics of the Systems
The command area of the NSLC covers portions of three adjacent districts i.e., eastern part of the Nalgonda district, south, southeastern part of Khammam, and north, northeastern part of Krishna.
The Krishna delta area extends in the central and south, southeastern parts of Krishna district and eastern part of Guntur district. A small extent in the northern part of Prakasam also gets irrigation under the delta.
The overall demographic pattern in these commands is given in table 3.2.6.
Table 3. 2.6. General features of the command areas.
System Sl.
Features
Unit NSLC Krishna Delta
1. Population Rural Urban
Million % %
3.2 84 16
5.1 68 32
2. Density Sq.km 250 416
3. Male-female Ratio 1 : 0.96 1 : 0.97 4. Literacy
Male Female
% %
50.25 33.66
63.00 40.53
5. Landholding Pattern Landless Marginal- (<1.0 ha) Small- (1.0 to 2.0 ha) Above 2 ha.
% % % %
20 41 19 20
21 53 15 11
Source: Compiled from the database / statistical abstract of AP 2000, Government of Andhra Pradesh. In the command area of the NSLC the red soil is the predominant type of soil and occupy around 72 percent of the project area. Black soil is in the extent of 28 percent, mostly concentrated in the lower reaches of the central and eastern part of the command. However, the Krishna delta is predominantly alluvial, around 95 percent, with few patches of black soil spread out in the upper reaches of the command.
The soil in the three reaches of the sample minors is mainly red soil (Alfisols), with a small batch of black soil in the lower reaches of the tail-end minor. In the Krishna area the soil in sample minors is all alluvial.
Cropping Patterns and Productivity
Under irrigation sources the main crop during kharif season is rice. In the rabi season also, rice again forms the predominant crop with oil seeds (groundnut), and pulses (green gram and black gram). In the sample villages the same cropping pattern is observed.

126
Average productivity of rice in the NSLC has been 2,748 kgs/ha. While in the Krishna delta it is 5550 kgs/ha. Salient features of the selected systems are presented in table 3.2.7. Table 3.2.7. Salient features of the selected irrigation systems.
Sl Details Units Andhra Pradesh Madhya Pradesh 1. Name of the irrigation system Nagarjuna Sagar Left
Canal – NSLC Krishna Delta System – KDS
Halali Harsi
2. Nature of the Project Reservoir Delta - - 3. Year of construction 1955 1852 1973 1925 4. Year of commissioning 1967-68 - 1978 1935 5. Length of main canals Km 298 20-92 3.24 70 6. Command area (designed) ha. 397,000 526,000 37,500 68,000 7. Command area (actual) ha. 397,000 526,000 37,000 68,000 8. Irrigated area ha 246,000 508,000 23,500 41,500 9. Average Rainfall Mm 750 900 1050 850
10. Rural Population 3,200,000 5,100,000 970,000 1,410,000 11. %ofpopulationin agricultural
sector % 78 72 80 70
12. Average farm size ha 3.03 1.31 2.9 2.1 13. Soils Sandy Loams with
patches of clayey loams Alluvial with patches of clayey loams
Clayey loams
Clayey Gravel
14. Major crops cultivated Paddy, groundnut Paddy, pulses, vegetables
Wheat, soyabean, pulses
Wheat, paddy, gram
15. Cropping intensity % 80-90 160 135 85 16. Irrigation development % 62.9 96.6 62.7 61
Control Sites Reddla Repaka is one of the selected sample villages, which belongs to the Valigonda Mandal of Nalgonda district, and gives representation to the non-command area of the Nagarjuna Sagar Left Canal (NSLC). The selected non-command area village is about 80 kms away from the state headquarters, and is situated on the Medak to Chityal state highway.
The geographical area of this village is about 8.8 square kilometres. According to the latest Census of India, 2001, the population of this village is around 16,600, and are living in 310 households. Of these, about 60 percent of households are agricultural and the rest are dependent on non-agricultural activities for their livelihoods. The population, according to the caste groups prevalent, has indicated that shepherd, toddy tappers, and muslims are the major castes depending on agriculture for their survival. Among others, harijans are largely dependent on non-agricultural activities for their livelihood.
A large extent of the crop cultivation in this village is brought under rainfed conditions. As per the latest minor irrigation statistics, the village has a minor irrigation tank and about 150 bore wells in order to provide an assured water supply for crop cultivation,which mostly belongs to the toddy tapper community farmers.

127
The availability of groundwater in this village is at 200 feet depth. During a dry spell majority of the bore wells dry up, groundwater level falls down further and the discharges come down from 3 to 11/2 inches.
Paddy is extensively cultivated under bore wells, mostly during first crop season. Castor, cotton and jowar crops are cultivated under rainfed conditions. Following are the key features of the control site:
• Larger extent of crop-cultivated areas is under rainfed conditions. • Availability of water resources are inadequate (one irrigation tank, and 150 agricultural bore wells) • Groundwater table level is below 200 feet depth. • The only surface water resource i.e., irrigation tank, is kept out of use in the past 10 years due to lack
of inflows into the tank bed. • Migration is a common feature in this village. During off-season period, agricultural households
migrate to the nearby command area villages (Krishna Delta) and non-agricultural households migrate to the urban area (Hyderabad) in search of livelihood.
• For all the agricultural business activities, the farmers belonging to this village are forced to visit the mandal headquarters which is about 6 kms from the village.
• Agricultural extension services are poor. • Daily wages paid to the men and women both for agricultural and non-agricultural activities are much
below the prescribed minimum wages in the act. Gopavarapugudem is a non-command area village for the Krishna Delta system. The total population of the village is 1,650, of which 75 percent are farmers and the balance 25 percent are non-farmers. The literacy rate is 63 percent, majority (38%) of them educated up to primary level. 19 percent and 8 percent have studied up to matric and above matric, respectively.
Majority (55%) of the landholdings are less than 1 acre, 37 percent are between 1 to 5 acres and the rest 8 percent are between 5 to 12.5 acres. About 77 percent of the farmers cultivate their own farms and the remaining 33 percent in addition to cultivating their own farms have leased in land at a fixed rent of Rs. 3000/- per acre per annum.
Trends in landlessness increased during last ten years. About 35 percent of farmers become non-farmers due to dependency on rainfed cultivation, high cost agricultural inputs and poor economic returns from crop cultivation. The non-farming activities taken up by these farmers are vegetable selling, dairy development activity and agricultural labor work in orchards. The average wage rates for males and females are Rs. 50/- and 30/- per day, respectively in both agriculture and non-agriculture. Around 50 percent of the area is under orchards. The other crops are paddy (18%), vegetables (12%), groundnut (8%), red gram (7%), and guinea grass (5%). The major problem expressed by the farmers is delay in rainfall. Poverty analysis through PRAs suggests that 68 percent are poor, of which 40 percent are always poor, 28 percent are sometimes poor. Poverty is associated with inadequate water availability, poor crop returns and landlessness.
A WUA is constituted in the village. Further probing revealed that the village actually falls in the tail-end of the command area. But it has not been receiving any water for the past 20 years. The WUA has received maintenance grant and spent it for improvement of the physical system. However, there is still no water supply in the main canal system, which has made the WUA dysfunctional for all practical purposes.

128
It is perceived that an increase in the quantity of water (through construction of a Lift Irrigation Scheme) would reduce poverty, as agriculture households would have assured water and non-agriculture households can seek employment in agricultural operations and also initiate secondary economic activities.
Selected Systems in Madhya Pradesh
One of the selected systems is in the Gwalior district called the Harsi Irrigation System. The map in Annexure 3 shows the location of the Harsi dam in Gwalior district. Table 3.2.8 gives the details of agriculture and irrigation in the Gwalior district.
Table 3.2.8. Area irrigated – Harsi system (hectares).
District Gross sown area Net sown
area Gross irrigated area
Net irrigated area
Gwalior 290470 268792 137530 120163
District Net irrigated Area
Sources of irrigation (ha)
Canal Tube wells Dug wells Other sources
Total
Gwalior 120163 64642 3952 43355 8214 120163 Table 3.2.9 shows the cropping pattern in the Harsi Irrigation System.
Table 3.2.9. Cropping pattern – Harsi system.
Crops Area sown
(hectares) % of Total sown area
Rice 13632 4.69 Jowar 16482 5.67 Wheat 99731 34.33 Gram 30050 10.35 Sugarcane 3148 1.08 Pulses 21704 7.47 others 5917 2.04 Total food crops 190664 65.64 Mustard 79332 27.31 Fodder 5762 1.98 Other non food crops 14712 5.06 Total non food crops 99806 34.36 Total sown area 290470 100.00
Area sown and area irrigated in the Harsi Command
In the Harsi system, the gross command area is 68,000 hectares. out of which the irrigated command area is 53,000 hectares. The net sown area is 44,000-hectares. The broad cropping pattern in the command area

129
is shown in table 3.2.10 (the area under different crops are approximate. The area under irrigation is the actual figures from the department of irrigation).
Table. 3.2.10. Area under irrigation – Harsi command (ha).
Crops Area sown Area irrigated (from canal) Kharif Rice 20,000 15,900 Jowar 10,000 Nil Pulses 5,000 Nil Others 3,000 430 Fodder 1,000 Nil Rabi Wheat 30,000 26610 Gram 7500 850 Sugarcane 2200 2200 Mustard 2000 Others 500 Nil
The other system selected for the study is the Halali Irrigation System in the Vidisha district. The map in Annexure 4 shows the location of the Halali Dam in the Vidisha district. Most of the command area (close to 90%) falls in the Vidisha district. The remaining area falls in the Raisen district. Table 3.2.11. gives the details of agriculture and irrigation in the Vidisha district.
Table 3.2.11. Area irrigated – Halali system (ha).
District Gross sown area Net sown
area Gross irrigated area
Net Irrigated area
Vidisha 581133 523812 86562 86562
Sources Of irrigation (ha) District Net irrigated area Canals Tube
wells Dug wells Other
sources Total
Vidisha 86562 29324 8545 15329 33364 86562 Table 3.2.12 shows the cropping pattern in the Halali Irrigation System.
Table 3.2.12. Cropping Pattern – Halali system.
Crops Area sown (hectares)
% of total sown area
Rice 1129 0.19 Jowar 28429 4.89 Maize 7071 1.22 Wheat 328176 56.47Gram 137247 23.62 Other pulses 64760 11.14 Sugarcane 314 0.05 others 84307 14.51 Total food crops 482819 83.08 Total non food crops 98314 16.92 Total Sown area 581133 100

130
In the Halali command, the gross command area is 37,000 hectares, out of which the irrigated command area is 26,000 hectares. The net sown area is 26,000 hectares. (The area under different crops are approximate. The area under irrigation is the actual figures from the department of irrigation).
Sample Selection
A total of 938 households were sampled within the command areas of the four irrigation systems selected. In each irrigation system a head, middle and tail-end canal branch was chosen, along which 3 minimum villages were selected. Again, villages were selected according to their location on the canal branch, distinguishing villages in the head, middle and tail reaches. Selection of villages in the four irrigation systems is shown in table 3.2.13. Table 3.2.13. Selection criteria of villages selected for study. Head-end village Middle-end village Tail-end village Head-branch canal Head branch, head village Head-branch, middle
village Head branch, tail village
Middle-branch canal Middle branch, head village
Middle branch, middle village
Middle branch, tail village
Tail-branch canal Tail branch, head village Tail branch, middle village Tail branch, tail village
However, in Madhya Pradesh more number of villages were selected as the population size was not adequate (minimum 30 households on a circular random basis) in some of the villages selected. For control sites two villages each adjacent to the two irrigated commands were taken up for the study.
The study areas in MP and AP come under a similar agro-climatic zone (semi-arid) of the country and with rivers fed by rain water. The irrigation projects selected were constructed at different points of time starting from early 19th century to early 21st century. The command areas of the irrigation projects vary from 526 thousand hectares to 37 thousand hectares each, in their extent. The soil and other physical and cultural factors vary within each command and as a whole are representative of a greater part of the country. Other major considerations that prompted our selection of these states are the existence of the PIM programs, receptivity of government decision makers and irrigation departments.
Care was taken to involve the concerned government departments in selecting the projects and villages for the study. While the primary data at household level emanated from the household- level surveys, PRA exercises and in depth interviews, and secondary data was collected from official documents and published material. For selecting the sample of households the first step followed was collection of all households as published in the electoral rolls arranged in a serial order, and the total number in each village was divided by 30 and then households were selected through random sampling. For example, if the number of households in a village are 263, this is divided by 30. Thus, every ninth household was selected for interview. The questionnaire was pre-tested, administered to the head of the respective household. The survey data was coded and transferred to excel sheets to facilitate computer analysis. The detailed sample selection in AP and MP is as follows:

131
Sample Selection in AP
Under the Nagarjuna Sagar Left Command (NSLC) command area, three distributaries were taken, first in the 1/3 length of the main canal (Block 6), the second in the middle length (Block 19), and the third one in the tail-end reach (Block 21/9). In the Krishna Delta System (KDS) also, a similar approach in the selection of distributaries was adopted on one of the long canals on the right flank (Bandar Canal). There are 66 distributaries in the NSLC command area and there are 13 distributaries in the KDS area.
The selection of the villages and households along with the identified distributaries / blocks was done as follows: i) Each of the distributary was divided once again into three equal zones—head, middle and the tail
reaches.
ii) The head zone, in the first sample distributary, the middle zone in the second sample distributary and the tail zone in the third sample distributory constituted the study areas.
iii) In each zone, a long minor on the irrigation system was identified and villages falling within the
area were marked. Among these villages, one in the head reach of the minor, one in the middle and one in the tail reach were selected for the study. Thus, three villages located on each of the sample distributary at head, middle and tail reaches – in all 9 villages in the command area – were identified for the study. Further, one village each, outside both the irrigation systems selected, were also surveyed for ‘control’ purpose.

132
Table 3.2.14. Household sampling in irrigation systems in Andhra Pradesh.
Distributary system Villages Name of the project
Canal system/reach Name of
major Location Sl. Village name
Sample households
total A. COMMAND AREA
HH 1. Utlapally 33 HM 2. Kalvapally 33
Head(H) Mulkalkalva
HT 3. Yadgarpally 34 MH 4. Bhanapuram 34 MM 5. Kamalapuram 33
Middle(M) Mangapuram
MT 6. Naraspuram 33 TH 7. Kanchikacherala 34 TM 8. Moguluru 33
Nagarjuna Sagar Left Canal (NSLC)
Tail (T) Mullapadu
TT 9. Bathinapadu 33 HH 10. Prodduturu 26 HM 11. Konatanpadu 27
Head (H) Podduturu
HT 12. Kolavennu 27 MH 13. Kosuru 26 MM 14. V.Rudravanam 27
Middle (M) Bheemandi
MT 15. Ghantasala 27 TH 16. Kollapalem 26 TM 17. Paddarayudu Tota 27
Krishna Delta System (KDS)
Tail (T) Manager Codu
TT 18. Polavarm 27 Total Command Area 540 B. NON-COMMAND AREA NSLC 19. Redla Repaka 30 KDS 20. Gopavarapugudem 30 Total Non-Command Area 60 GRAND TOTAL 600

133
Konthanapadu Branch Channel
Chilkalapudi Branch Channel
Pantacodu Branch Channel
HH
MHTH
MH
MM
MM
TH
TM TT
Bandar Canal
Figure 3.2.2. Schematic map showing the selected major and minor distributaries in the Krishna Delta System (KDS).
Krishna River

134
Sample Selection in MP The sample selection was done in accordance with the methodology decided at the partner’s meeting in Hyderabad. At the meeting, it was decided that a total of eight villages and 240 households for household survey will be selected in each system. Two villages each, from head, middle, and tail respectively, will be selected. Two villages from outside the area were to be selected as control sites. There were some modifications made to incorporate local conditions. These are as follows: • Instead of two villages, three villages each were selected from head, middle, and tail. This was done
to ensure a larger diversity in the sample. • One additional village was selected from the tail area to give a better representation to tail-end
problems. • Whenever a small village (less than 100 households) was selected, another adjacent village was
selected, for better representation of the area.
The total number of households selected remained around 240 in each system. The following section gives the details of the sample selection in each of the two systems. Total sample size for both systems was 492 households. Halali System In the Halali system the main canal divides into the LBC and the RBC. Another branch canal, Sahodara, also comes out from the LBC a little further downstream. The entire stretch was divided into three zones – head, middle, and tail. The division was done in the following manner. Head: Stretch of the main canal and LBC, RBC, and SBC till these divide into distributaries. Middle: Upper reaches of D1, D4 on SBC; D2, D3 on LBC; and D1, D2, and D3 on RBC. Tail: Lower reaches of all the distributaries.
Three villages each were selected from each of the three zones. From the tail zone, an additional village was selected to understand the tail-end problems better. However, in each of the three zones, an additional village was selected at the time of doing the survey as one of the selected village in each of the zones turned out to be a very small village.
The system is a funnel-shaped system. There are more villages in the tail than in the head. In view of the particular system characteristics, it was decided to take more tail villages, so that a better sample as well as understanding of the problems of the tail area is reached.
Harsi System
The main canal is a contour canal and all distributaries branch off from it (on the left side, if we face the dam). The main canal was divided into three stretches – head, middle, and tail. In terms of distributaries, the division into stretches is as shown below: Head: D1 to D3, only upper to middle portions of D3 Middle: D4 to D10 Tail: D11 to D17

135
The only exception to the above division was made for the tail villages of D3A. These were included in the middle reach. This was done as D3A is a very long distributory, 35 kms long and water availability at the tail is more like the conditions prevailing in the middle reaches.
It was decided to select three villages each from head, middle, and tail. Twenty households were to be selected from each of these three villages, thus yielding a total sample size of 180 for the system. An additional village was selected from the tail reaches to give a higher representation to tail end and understand better the conditions prevalent there. The villages were selected at random from the list of villages. In head reaches, an additional village Lohri was selected. Table 3.2.15. Sample size for selected systems in MP.
Halali Harsi Total No. of
villages Sample size No. of
villages Sample size No. of
villages Sample size
Head 4 60 4 64 8 124 Middle 4 69 3 65 7 134 Tail 5 88 4 76 9 164 Control 2 32 2 38 4 70 Total 492
Table 3.2.16. Household sampling in irrigation systems in Madhya Pradesh. System Village Sample Households Location
Halali 1 Khejda Sultan 21 190 Head 2 Sayar 12 180 Head 3 Billori 17 120 Head 4 GhatKhedi 11 75 Head 5 ChirKheda 26 255 Middle 6 Kararia 21 210 Middle 7 Kotra 14 140 Middle 8 Nama Khedi 8 75 Middle 9 Neem Kheda 22 155 Tail
10 Paloh 19 105 Tail 11 Gajar 10 55 Tail 12 Haru Khedi 19 105 Tail 13 KheruaHaat 20 200 Tail 14 Salaiya (control) 20 235 Control 15 Suakhedi (control) 12 45 Control
Total 252 Harsi
1 Jaura 23 190 Head 2 Kathod 11 60 Head 3 Lodhi 10 54 Head 4 Chireta 20 112 Head 5 Jhadoli 23 260 Middle 6 Ekhara 20 120 Middle 7 Kishorgadh 22 145 Middle 8 Khediparasar 17 91 Tail
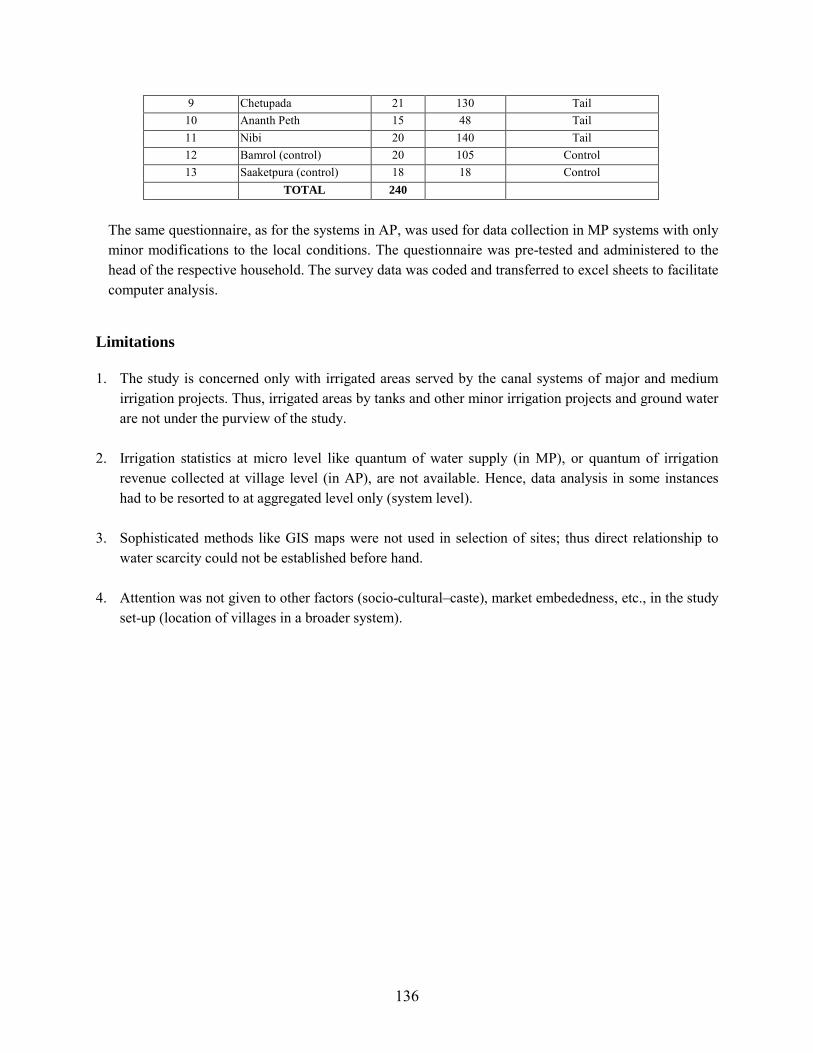
136
9 Chetupada 21 130 Tail 10 Ananth Peth 15 48 Tail 11 Nibi 20 140 Tail 12 Bamrol (control) 20 105 Control 13 Saaketpura (control) 18 18 Control
TOTAL 240
The same questionnaire, as for the systems in AP, was used for data collection in MP systems with only minor modifications to the local conditions. The questionnaire was pre-tested and administered to the head of the respective household. The survey data was coded and transferred to excel sheets to facilitate computer analysis.
Limitations
1. The study is concerned only with irrigated areas served by the canal systems of major and medium irrigation projects. Thus, irrigated areas by tanks and other minor irrigation projects and ground water are not under the purview of the study.
2. Irrigation statistics at micro level like quantum of water supply (in MP), or quantum of irrigation
revenue collected at village level (in AP), are not available. Hence, data analysis in some instances had to be resorted to at aggregated level only (system level).
3. Sophisticated methods like GIS maps were not used in selection of sites; thus direct relationship to
water scarcity could not be established before hand. 4. Attention was not given to other factors (socio-cultural–caste), market embededness, etc., in the study
set-up (location of villages in a broader system).
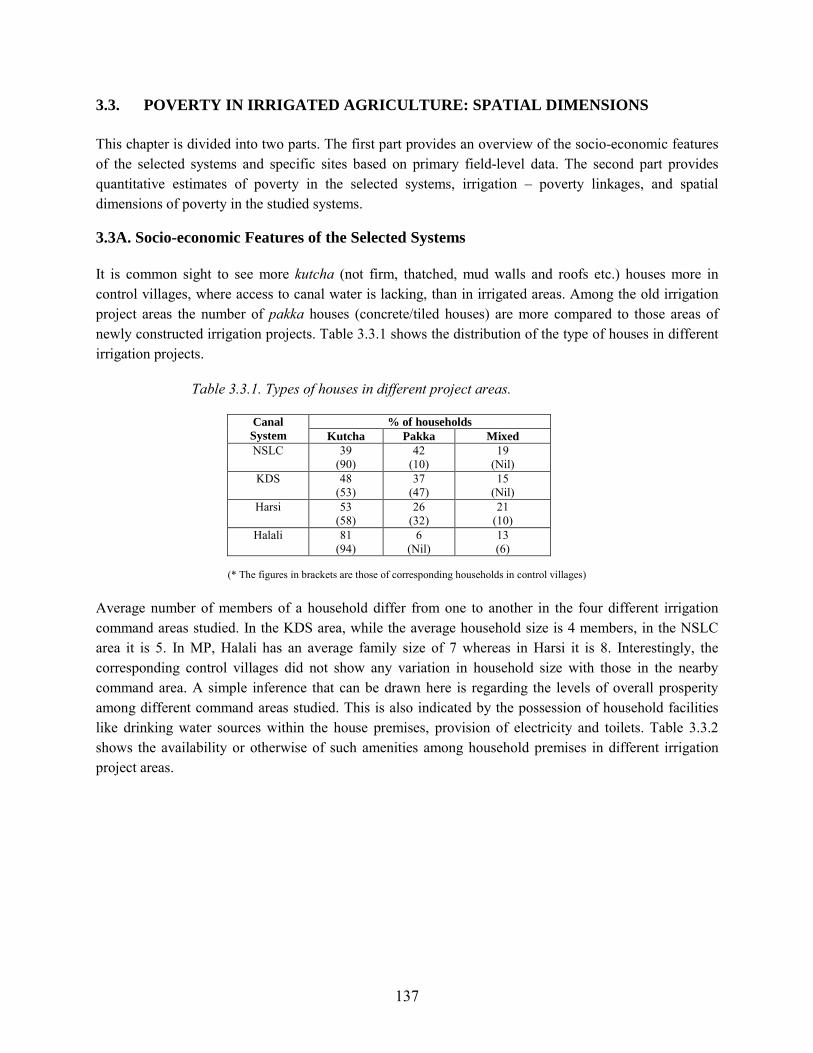
137
3.3. POVERTY IN IRRIGATED AGRICULTURE: SPATIAL DIMENSIONS
This chapter is divided into two parts. The first part provides an overview of the socio-economic features of the selected systems and specific sites based on primary field-level data. The second part provides quantitative estimates of poverty in the selected systems, irrigation – poverty linkages, and spatial dimensions of poverty in the studied systems.
3.3A. Socio-economic Features of the Selected Systems
It is common sight to see more kutcha (not firm, thatched, mud walls and roofs etc.) houses more in control villages, where access to canal water is lacking, than in irrigated areas. Among the old irrigation project areas the number of pakka houses (concrete/tiled houses) are more compared to those areas of newly constructed irrigation projects. Table 3.3.1 shows the distribution of the type of houses in different irrigation projects.
Table 3.3.1. Types of houses in different project areas.
% of households Canal System Kutcha Pakka Mixed NSLC 39
(90) 42
(10) 19
(Nil) KDS 48
(53) 37
(47) 15
(Nil) Harsi 53
(58) 26
(32) 21
(10) Halali 81
(94) 6
(Nil) 13 (6)
(* The figures in brackets are those of corresponding households in control villages)
Average number of members of a household differ from one to another in the four different irrigation command areas studied. In the KDS area, while the average household size is 4 members, in the NSLC area it is 5. In MP, Halali has an average family size of 7 whereas in Harsi it is 8. Interestingly, the corresponding control villages did not show any variation in household size with those in the nearby command area. A simple inference that can be drawn here is regarding the levels of overall prosperity among different command areas studied. This is also indicated by the possession of household facilities like drinking water sources within the house premises, provision of electricity and toilets. Table 3.3.2 shows the availability or otherwise of such amenities among household premises in different irrigation project areas.

138
Table 3.3.2. Facilities in housing premises in project areas.
% of houses having facilities Canal System Drinking water Electricity Telephone Toilets
NSLC 22 (7)
75 (43)
14 (0)
24 (10)
KDS 31 (53)
91 (93)
8 (10)
35 (50)
Harsi 10 (0)
82 (55)
1 (0)
5 (0)
Halali 16 (0)
72 (75)
5 (0)
5 (3)
(* The figures in brackets are those of corresponding households in control villages)
In the following pages, four sets of tables are presented for the irrigated command studies to portray the socio-economic features of the study areas. The tables present a comparison of net landholdings, annual expenditure of household income from agriculture, non-agricultural activities and other variables among the households at head, middle and tail reaches. These irrigated areas are also compared with the control villages where there is no canal irrigation. Halali Command Area
In the Halali irrigation command in MP, it can be observed table 3.3.3 that the average landholding size of the head and middle-reach households is about 2.18 hectares. whereas at tail ends it is 3.82 hectares. The table also shows that the income from the crops at head reach is less compared to the tail end. The reasons for this could be higher irrigation intensities and water logging at head reaches, unlike controlled water supply at tail ends, and also comparatively larger landholding sizes and hence higher incomes from crops. Further, the non-farm income is also high for the tail-end households. The average household expenditure of the tail-end households is also higher because of larger landholding sizes. In Halali command, the head of the household received four to five years of education on an average. The number of household members is 8 compared to the national average of 5.3. It is interesting to note that institutional credit available is more to the head-reach farmers compared to middle and tail-reach households. Since the total annual income is higher in the tail-end households and the family size is same in all the three categories of households in different reaches, the per capita income of the tail-end households is higher.
The standard deviation and the co-efficient of variation for households in all the four categories presented in the tables explain the percentage variation among the sample size. This gives an idea as to how the variables are behaving in the head reach, middle and tail-end households. The data from the control villages do not throw up any significant difference from the households in irrigated command – especially in net land holding, annual expenditure, education of the respondent (family head) and family size. As expected, the crop income as well as the non-crop income in control villages is less compared to those in irrigated areas. The same trend is reflected in the per capita income of the households. However, the availability of credit, both institutional and non-institutional, is greater in control villages. This is due to the fact of less income and more expenditure among these households.

139
Table 3.3.3. Halali System – Madhya Pradesh.
Harsi System Unlike the Halali command area, the average landholding size of the farm households in Harsi command table 3.3.4 is larger in middle reaches, with correspondingly higher annual expenditure. However, the tail and head-reach households receive more income from sources other than crops. Non-institutional borrowing is more in all the reaches compared to the institutional credit in head and middle reaches, whereas the tail-end households seem to avail more institutional credit. The sample from the control villages shows that the land holding size of the households is more and yet, the annual income from crops as well as other sources is comparatively less. The value of durables in the households clearly shows an upward trend in irrigated areas compared to the control villages, with the highest values in head, middle and tail, in that order. In both Halali and Harsi commands, the head reach households enjoy more valuable durables. Table 3.3.4. Harsi System – Madhya Pradesh.
Head Middle Tail Control Mean Standard
Deviation Coefficient Variation
Mean Stand Dev
Co. Var
Mean Stand Dev
Co. Var
Mean Stand Dev
Co. Var
Net Land Holding
1.98 1.76 88.8 2.22 2.14 96.3 2.05 1.72 83.9 3.11 3.31 106.4
Annual Expenditure
27352 20833 76.1 28458 21315 74.9 26365 14311 54.3 22510 17185 76.3
Respondent Education
4.01 4.44 110.7 4.27 3.87 90.6 4.24 4.04 95.2 4.39 4.05 92.2
Family Size 7.59 3.69 48.6 8.63 4.29 49.7 7.86 3.36 42.7 6.81 3.50 51.3 Income from crop
19470 21267 109.2 22607 23487 138.9 19313 20537 106.3 13581 16085 118.4
Head Middle Tail Control Mean Standard
Deviation Coefficient Variation
Mean Stand Dev
Co. Var
Mean Stand Dev
Co. Var
Mean Stand Dev
Co. Var
Net Land Holding 2.17 3.41 157.1 2.18 2.44 111.9 3.82 7.91 207.1 2.61 2.60 99.6
Annual Expenditure 23842.9 20942.5 87.8 25717.9 18640.7 72.4 27032.1 23930.9 88.5 24179 14211 58.8
Respondent Education 3.70 3.88 104.8 4.18 4.44 106.2 5.24 5.41 103.2 3.81 4.45 116.8
Family Size 7.36 3.732 51.1 7.46 3.77 50.5 7.77 5.46 70.2 7.56 3.04 40.2
Income from crop 15159.1 24431 161.1 16597.9 21337.9 128.5 24138.9 46950.2 194.5 11759.5 11098.9 94.4
Non crop income 9877.87 5228.87 52.9 11508 8771.05 76.2 12742.8 13825.1 108.5 9860.94 6252 63.4
Value of durables 61800.9 208088 336.7 122017 458245 315.5 69514.4 150830 216.9 168418 601982 78.3
Credit from Institutions 36262.3 263570 1384.3 10969.8 54469.9 496.5 15423.3 55761.2 361.5 27018.8 78184 289.4
Credit from non-institutions
5124.59 10630.8 207.4 34562.3 24094.6 69.7 11356.7 28824.8 253.8 18515.6 70498.2 380.7
Per capita income 3601.67 3110.01 86.3 4427.33 5476.52 123.7 4820.93 5300.42 109.9 3052.32 1247.11 40.8

140
Non-crop income
16990 17297 87.2 16950 15575 91.9 16284 10001 61.4 9215 5272 57.2
Value of durables
139434
461016 330.6 65970 118034 178.9 83062 329487 396.7 14907 28819 193.3
Credit from Institutions
13237 51872 391.8 7953 11682 146.9 17615 61982 351.8 4494 12290 273.5
Credit from noninstitutions
42453 220517 519.4 15707 48888 311.2 20853 46244 221.7 10973 15264 139.1
Per capita income
4599 2824 61.4 4927 3542 71.9 4931 2966 60.1 3678 3015 81.9
Nagarjuna Sagar Left Command The net average landholdings of households in NSLC in AP are less table 3.3.5 compared to the landholding sizes in MP irrigation commands. But the average annual expenditure is higher. This is mainly due to the inputs and farming costs. The education levels of the heads of households show a downward trend with about 3 years of education, on an average. Interestingly, all of the respondents from the control village are found to be illiterate. The average number of members in the households is 4. The income from agricultural crops is higher compared to the irrigated commands in MP. The average household crop income is higher at head and tail ends compared to middle reaches. The per capita income correspondingly shows higher values at head reach and tail ends. The value of durables in the households is almost the same in the middle reaches but a gradual decline is shown from head to tail ends, and more strikingly, in the control village. Borrowings of different households also show a similar trend. Table 3.3.5. Nagarjuna Sagar Left Command – Andhra Pradesh.
Head Middle Tail Control Mean Standard
Deviation Coefficient Variation
Mean Stand Dev
Co. Var
Mean Stand Dev
Co. Var
Mean Stand Dev
Co. Var
Net Land Holding
1.14 2.75 241.2 0.75 1.41 188.0 0.97 1.91 196.9 0.56 1.05 187.5
Annual Expenditure
41723.4 63044.2 151.1 33812.9 32190.5 95.2 37157.1 34124.5 91.8 18966.8 18370.6 96.8
Respondent Education
3.80 4.41 116 3.47 4.31 124.2 3 4.09 136.3 Nil Nil -
Family Size 4.3 1.61 37.4 4.74 1.57 33.1 4.85 2.21 45.5 4.33 1.44 25.6 Income from crop
51866.9 161375 311.1 25158.6 43822.1 174.1 29896.1 72851.5 243.6 2092.79 4882.57 233.3
Non-crop income
19249.6 161375 838.3 18696 24031.4 128.5 13296.1 14425.7 108.5 18487.7 25036.5 135.4
Value of durables
32955.5 81936 248.6 7902.68 25379.9 321.1 13147.9 53275.7 405.2 1552 3594.31 231.5
Credit from Institutions
6215.84 15191.2 244.4 6646.46 14200.7 213.6 12770 39620.9 310.2 2700 10462.2 387.4
Credit from non-institutions
8202.97 15267 18.6 7474.75 11635.9 155.6 8010 10723.8 133.8 2800 5054.19 180.5
Per capita income
9214.48 12536 136.0 5637.1 4143.63 73.5 5845.41 9732.04 166.5 2701.89 5879.25 217.7

141
Krishna Delta System The Krishna Delta is the oldest of all the irrigated areas studied. The average landholding size (table 3.3.6) in head and middle reaches is less than a hectare but the monetary value of the land is highest. In KDS the tail ends have more average land holding size (a little over a hectare) and the annual expenditure per house is higher. Likewise, the tail ends show higher annual expenditure followed by middle and head reach households. Because of the higher non-crop income in head reaches the per capita income is also higher. The average family size is lowest among all the systems studied, but the education level of the heads of the households show a poor trend. Except in the head reaches the dominant sources of borrowings are from institutional sources.
Thus the four systems studied form a gradational continuum in all the indicators, starting highest from KDS followed by the NSLC, Harsi and Halali. Table 3.3.6. Krishna Delta System – Andhra Pradesh.
Head Middle Tail Control Mean Standard
Deviation Coefficient Variation
Mean Stand Dev
Co. Var
Mean Stand Dev
Co. Var
Mean Stand Dev
Co. Var
Net Land Holding
0.62 0.899 145 0.42 0.779 185.47 0.49 1.25 255.1 0.61 0.78 127.86
Annual Expenditure
33200.3 24740.3 74.51 27466.7 12631.5 45.98 32086.9 29237.1 91.11 28359.5 12429.5 43.82
Respondent Education
3.65 4.72 129.31 3.8 3.9 102.63 3.88 4.44 114.43 3.63 4.55 125.34
Family Size 4.33 1.78 41.1 4.07 1.14 28 4.16 1.52 36.53 4.53 1.61 35.54 Income from crop
41775.6 76949.1 184.19 26742.9 64157.4 239.9 31447.8 78346.2 249.13 16723.2 21395.3 127.93
Non-crop income
22152.7 36424.4 164.42 14891.1 12413.9 83.36 17693.7 12928.3 73.06 14578.8 12955 88.86
Value of durables
8594.19 14836.6 172.62 4973.3 19073.6 383.51 5668.15 9326.08 164.53 2348.67 2275.86 96.89
Credit from Institutions
3769.23 7241.52 192.12 1512.5 4149.1 274.32 2283.95 8075.01 353.55 5333.33 9774.47 183.27
Credit from non-institutions
6141.03 11794.5 192.06 5962.98 8084.62 135.58 5074.07 8092.86 159.49 6766.67 8580.99 126.81
Per capita income
11441.9 19266.6 168.38 6978.27 6470.54
92.72 8367.15 11096.9 132.62 4939.46 2790.37 56.57
Employment Pattern Agricultural farming and labor constitute major employment for the rural population. The irrigated areas in MP seem to provide employment for non-agricultural, unskilled and skilled laborers and also for service employment and trade; the irrigated commands show preponderance of employment in farming and agricultural labor. The control villages in AP however, show greater dependence on farming activities for employment.

142
Table 3.3.7. Employment pattern in the four irrigation systems.
% of respondents reporting different types of employment Canal system
Farming on own land
Agri. labor
Non-Agri. unskilled labor
Non-Agri. skilled labor
Service/ employment
Business/ trade
NSLC 50 (63)
65 (80)
2 (0)
43 (0)
15 (33)
35 (0)
KDS 49 (80)
69 (70)
4 (0)
23 (10)
12 (17)
8 (0)
Harsi 88 (97)
71 (84)
0 (0)
0 (0)
3 (3)
1 (0)
Halali 84 (81)
82 (84)
0 (0)
5 (0)
5 (13)
1 (6)

143
3.3B. POVERTY IN SELECTED SYSTEMS: LINKAGES AND SPATIAL DIMENSIONS
This part focuses on the first two research hypotheses and elaborates on how poverty and irrigation are linked in the four systems selected. After defining poverty, we first analyze who the poor are and to what extent poverty and irrigation are related. Then, we further analyze how irrigation affects household income and how the location of households in the system affects poverty levels. Finally, we look at the distribution of benefits from irrigation, and the extent to which small, marginal and poor households receive benefits from irrigation. Definition of Poverty In our study poverty has been defined as income poverty, poor households being those households that earn less than Rs. 3,155 per capita per year (the officially defined poverty line in AP), or less than Rs. 3,736 per capita per year (the official figure for MP). Different indicators of poverty have been used to measure income poverty (table 3.3.8). The head count index simply represents the number of households below the poverty line as a percentage of total households. The poverty gap is an indicator of the depth of poverty and measures the difference between household income and the poverty line; if households are just below the poverty line, this indicator will be rather small. Finally, the squared poverty gap gives extra weight to the poorest households. This indicator is thus a measure of the severity of poverty, a large squared poverty gap indicating that some households are very poor. Table 3.3.8. Income poverty indicators for the four systems. NSLC KDS Halali Harsi Command Control Command Control Command Control Command Control Headcount (%) 33 63 16 23 73 75 62 71 Poverty gap 0.11 0.23 0.04 0.07 0.44 0.25 0.30 0.22 Squared PG 0.05 0.11 0.01 0.03 0.34 0.21 0.23 0.09 The first impression is that poverty is much greater in MP than in AP. This is in accordance with the official poverty figures, which are much higher for MP. While in AP, only 11 percent of the population is below the poverty line, in MP 37 percent of the population is below the poverty line. Poverty is higher in non-irrigated villages than it is in the command area of the selected irrigation systems. This is in accordance with our hypothesis that access to irrigation reduces poverty. Within the two states, poverty is markedly lower in KDS than in NSLC, and more in the Harsi irrigation system as compared with Halali. The reason for this will be an important focus for our analysis, but one explanation could be the period over which irrigation water has been available to households over time: KDS and Harsi were both established before NSLC and Halali, which seems to have triggered a broader development of the regional economy too.
In general, the poverty figures for the four systems are rather high, (table 3.3.9) especially, when compared to the official data of AP and MP.

144
Table 3.3.9. Official poverty figures for Andhra Pradesh and Madhya Pradesh (%).
AP MP 1983-1984 1993-1994 1999-2000 1986-1987 1993-1994 1999-2000 Rural 26.53 15.92 11.05 36.6 N.A 37.06 Urban 36.30 38.33 26.63 37.2 N.A. 38.44
Source: Planning Commission, GOI(2002) – National Human Development Report. The explanation for these differences lies in the definition of poverty. The Indian government uses expenditure instead of income data. The rationale behind this is that households often understate their income. Expenditure data on the other hand have the disadvantage of underestimating poverty, as households often overstate the amount of money spent. To be able to compare the poverty figures of systems studied with the official figures for AP and MP, we have also calculated poverty figures using expenditure data (table 3.3.10). The consumption of own farm production has been valued at market prices. Credit and debts have not been taken into account. Table 3.3.10. Expenditure poverty indicators for the four systems. NSLC KDS Halali Harsi Command Control Command Control Command Control Command Control Headcount 0.10 0.27 0.04 0 0.30 0.26 0.18 0.68 Poverty gap 0.03 0.05 0.008 0 0.22 0.21 0.20 0.22 Squared PG 0.01 0.01 0.003 0 0.09 0.08 0.08 0.09 These numbers are obviously much more in accordance with the state poverty figures of the two states. While the figures for NSLC are largely in accordance with the state poverty figures (although the head reach is doing better), in KDS, the poverty figures are much lower. The figures for the control village of KDS are particularly low: the reason for this is that in this village large expenditures were made for marriages and other investments (Rs. 20,000 – Rs. 30,000). This also reveals the weakness of using expenditure data; if data cannot be corrected for credit taken and longer term investment, expenditure poverty will give a distorted picture of actual poverty levels.
Although the use of income data to measure poverty levels clearly has its disadvantages, we will use income poverty as in the definition of the study this indicator was emphasized. The rationale behind this is that although income poverty might overestimate actual poverty levels, expenditure data will give an underestimate. In the end, the difference between income and expenditure poverty is mainly an issue of measurement; whether households spent less than Rs. 3,155 per capita or whether they earn less than Rs. 3,155 per capita a year, in both cases the calories or goods they can purchase is not sufficient to sustain their livelihood. This is what poverty is all about, and although measured in different ways, the approaches of income or expenditure poverty are not fundamentally different.

145
Table 3.3.11. Who are the poor in NSLC and KDS?
NSLC KDS Poor Non-poor Poor Non-poor Indicator
Land less Land holding Land less
Land holding
Land less
Land holding
Landless
Land holding
% of total households 18% 12% 31% 39% 12% 3% 49% 36% Average income per capita per year (Rs.)
2202 1779 7892 10878 2514 1994 7011 14457
Years of education 2.66 3.79 2.94 4.10 2.97 5.56 3.11 4.79 Family size 4.85 5.08 3.92 4.97 4.87 5.89 3.79 4.29
Although landless households are more strongly represented among the poor than landholding households, surprisingly, among the poor, the poorest are those with land. As in both NSLC and KDS’ ‘non-farm income is an important source of income. These results can be understood as follows: whereas landless households can spend all their time on off-farm employment, households with land can only spent some of their time. If conditions for agricultural production are poor, total income will consequently be lower. Family size of poor households is generally larger than that of non-poor households, and although some differences in education exist (in KDS the less educated seem to be better-off) the main difference is that between landless and landed households: on an average 1-2 years.
For Madhya Pradesh the picture is different. Not only are most of the poor landless, among the poor, landless households are the poorest too. One reason for this could be that there are many fewer opportunities for off-farm employment in MP than in AP. Thus, the households that are landless have very few options apart from working as agricultural wage labor. Interestingly, in Harsi, which is double-cropped, the average per capita income of the landless poor is 35 percent more than that in the Halali, and also, the income gap between the landless poor and the landed non-poor is much less than in Halali as can be seen in table 3.3.12 below.
Table 3.3.12. Who are the poor in Halali and Harsi? .
Halali Harsi Poor Non-oor Poor Non-poor Indicator Land
less Land holding
Land less
Land holding
Land less
Land holding
Landless Land holding
% of total household 24% 48% 3% 26% 10% 45% 3% 42% Average income per capita per year (Rs)
2,082 2,623 5,362 7,720 2,749 3,302 3,352 6,023
Years of education 3.1 3.9 2.6 6.0 2.7 3.7 3.8 3.9 Family size 6.6 7.6 3.4 8.0 5.2 7.9 6.5 7.9
The next question is what is the differences between poor and non-poor households’ landholding? Do poor households on average own less land than non-poor households? Do they have less access to water (canal or groundwater)? Are there any differences with regard to farming skills? If so, this will help us define what issues to focus on in the analysis of the linkages between poverty and irrigation.

146
Table 3.3.13 Poor vs non-poor land holding households in NSLC and KDS.
NSLC KDS Indicator Poor Non-poor Poor Non-poor
Net Produced Value per cultivated area (ha) 2,177 12,357 4,662 13,848 Net Produced Value per household area (ha) 1,308 15,443 9,328 23,536 Average land holding (ha) 1.32 2.18 0.63 1.38 Average area cultivated (ha) 0.78 2.70 1.48 2.31 Years of farming experience 14.9 18.7 10.6 13.4 Income farm/total income (%) 44 90 90 90 % households that received water for Kharif crop 32 66 100 80 % households that received water for Rabi crop 11 15 33 17 % households with access to groundwater 11 12 0 16
Poverty in NSLC seems much to do with access to water: whereas, 66 percent of the non-poor
households received water during the kharif season, of the poor households only 30 percent received water. Consequently, the cultivated area of poor households is less than one-quarter of the area cultivated by non-poor households and the net present value produced is lower as well. Water scarcity and probably the scarcity of other inputs, has resulted in a situation where poor households in NSLC cultivate even less then the plot of land they own: on average only 60% of the land owned is cultivated, whereas non-poor households cultivate 125 percent of their land (double-cropping). The relatively high value per cultivated area for poor households in NSLC can be explained by the type of crops grown: many households grow non-cereal crops like chillies, grams and cotton, on small plots of land.
In KDS, the story is different. Both poor and non-poor households receive water during kharif (poor households even more than non-poor households) and the income from farm income is similar for both categories. The productivity of poor households is much lower than that of non-poor households, non-poor households producing three times more output than the poor. Why is this the case the analysis does not show, even though water availability for both types of households is the same. Access to groundwater could be a factor, although, with good water availability during kharif, water scarcity does not seem to be the major constraint. The relative low number of poor households might play a role too: of the 11 poor households, 3 did not produce and 1 had negative production because of failed crops.
Besides landholding, education and access to water, other factors play a role in determining poverty levels as well. Especially between villages in the NSLC irrigation system, the difference in poverty levels between villages was large. Although some of these differences could be explained by the location of the village in the irrigation system and other factors relating to land and water use, some of the differences were not so easily understood. In KDS, the variation between villages was less evident, but even here some villages were more poor than the other villages involved. The main factor explaining the different poverty levels was the importance of other income sources: of the two non-typical villages in KDS, in one village mandal headquarters was located and the other village constituted a relatively rich handicraft town. In NSLC, the village with exceptionally high poverty levels turned out to be a tribal village where palmistry was still an important source of income, while in the other non-typical village mandal headquarters was located and a relatively large number of people depended on trade and transportation for their livelihood.
In both Harsi and Halali, lack of access to water seems to be an important reason for poverty. In the Halali system, the difference in average household income between the poor and non-poor households

147
is over 7 times, while in the Harsi system it is over 4.8 times. The reason why the difference is more in Halali is probably because it is mainly a single-cropped area, while in Harsi it is a double-cropped area, generating more opportunities for wage labor.
Table 3.3.14. Poor vs non-poor landholding households in Halali
Halali Poor Non-poor Average household income (in Rs.) 8,595 60,555 Average landholding size (in ha) 0.83 6.16 Years of farming experience 12.5 17.6 Income farm/total income (%) 38 86 Household receiving water in Kharif (%) Not Applicable Not Applicable Household receiving water in Rabi( %) 45 72 % households with access to groundwater Not Applicable Not Applicable
In terms of access to irrigation, there was a considerable difference among the poor and the non-poor. In Halali system for instance in the rabi season, while 45 percent of the poor households received irrigation, 72 percent of the non-poor households received irrigation. In Harsi, which is a double-cropped area, the difference between the poor and the non-poor households in terms of access to irrigation ranges from 20 percent to 50 percent in rabi, and between 35 percent and 60 percent, in kharif. Access to irrigation is one of the most significant causes along with land holding for poverty.
Table 3.3.15. Poor vs Non-poor landholding households in Harsi.
Harsi Poor Non poor
Average household income 10,533 50,782 Average landholding size (in Ha) 1.22 2.76 Income farm/total income (%) 59 88 Household receiving water in Kharif (%) 35 60 Household receiving water in Rabi (%) 20 50 % households with access to groundwater 38 33
In terms of land holding, the difference between the poor households and the non-poor
households is significant. Especially in Halali where while an average poor household owns 1.3 hectares of land an average non-poor household owns 6.4 hectares. In Harsi too the landholding of the average non-poor household is almost double that of the poor households. A large proportion of the poor household are either landless or have small land holding. In Halali, the data collected from the sample households suggests that while 33 percent of the poor households are landless, 44 percent are small marginal farmers. In Harsi, 10 percent of the poor households are landless and 55 percent are small marginal farmers.
In addition to land holding and access to irrigation, a critical factor that affects poverty in MP is caste. With some exceptions, the lower caste people are the "poor" in the rural areas. These conditions have changed to a large extent in the urban areas, and in some states, in the rural areas too. However, these customs are still quite strong in rural MP and, more specifically, in the project sites visited as part of

148
the field study. In both the systems it was found that the poor households mostly belong to Scheduled Castes/ Tribes (SC/ST) and other castes that are considered low on the social hierarchy. They are either landless or have small landholdings. There are some exceptions, however.
The proportion of SC/ST in poor households is higher than the other castes. Of the households surveyed in Halali, 60 percent of the poor households belong to either SC or ST. The proportion of upper caste poor household is 22 percent. In Harsi, 49 percent poor households belong to either SC or ST communities. The proportion of upper caste poor households is 16 percent.
To understand the correlation between caste and poverty and landholding and poverty, a correlation coefficient was calculated using Karl Pearson’s formula and its significance tested. The summary is presented in the table below:
Table 3.3.16. Correlation between different variables and poverty per capita (Halali).
Land Caste Correlation coefficient (r) 0.677 0.281 True population coefficient (ρ) +0.58< ρ <+0.75 +0.18< ρ <0.41 Statistical significance Yes Yes
Table 3.3.17. Correlation between different variables and poverty per capita (Harsi).
Land Caste Correlation coefficient (r) 0.664 0.401 True population coefficient (ρ) +0.58< ρ <+0.74 +0.28< ρ <+0.52 Statistical significance Yes Yes
Table 3.3.17 clearly brings out a significant correlation between poverty and landholding and poverty and caste in both the systems, although the coefficient values remain higher for landholding than for caste. Ground water Irrigation Access to irrigation water does not only depend on the functioning of the irrigation system, it depends on the availability of groundwater as well. Whereas in the Halali command area households have no access to groundwater irrigation, in the other three systems (supplemental) ground water irrigation is being used to a certain extent. In NSLC, groundwater availability is mainly confined to the head and middle reach of the command area, with on an average 15-20 percent of the households in the middle reach having access to groundwater irrigation. In KDS, groundwater irrigation is confined to the head and middle branch as well, with on an average 5-15 percent of the sampled households located on the head and middle branch having access to groundwater. In the command area of Harsi a much higher percentage of households has access to groundwater: 36 percent of households in the head reach, 14 percent of households in the middle reach and 32 percent of households in the tail use groundwater for (supplementary) irrigation. However, in most cases, the aquifers are shallow and the discharge is low. Although the focus of the study was not on groundwater, PRA data suggest that an average tube well irrigates only 3-4 hectares of land while an average dug well irrigates 2 hectares. This is the reason why despite having access to ground water, the actual irrigation with groundwater is not so significant.

149
Location of Villages in the Irrigation System The general assumption of the first research hypothesis is that head end villages receive more irrigation water than tail-end villages and thus, tail-end villages are expected to be poorer than head end villages. Defining head, middle and tail end villages by their geographical location in the irrigation scheme, head-end villages are those village located at the head end of the different branch canals and tail-end villages are those which are located in the tail ends of the different irrigation canals. Besides, the different irrigation branches have been picked based on their location in the overall irrigation system as well (a head branch, middle and tail-end branch). The assumption behind this is that as head-end canals receive more water at an earlier point in time, villages located in the head branches of the irrigation system are expected to be better-off than villages located in tail end branches.
Table 3.3.18. Distribution of poverty in NSLC and KDS.
. Head branch Middle branch Tail branch NSLC Head Count Ratio 0.21 0.34 0.40 Poverty gap 0.06 0.11 0.19 Squared poverty gap 0.03 0.05 0.13 KDS Head Count Ratio 0.19 0.14 0.14 Poverty gap 0.05 0.03 0.02 Squared poverty gap 0.02 0.01 0.01
Table 3.3.19. Distribution of poverty in Halali and Harsi.
Head branch Middle branch Tail branch Halali Head Count Ratio 0.73 0.68 0.77 Poverty gap 0.45 0.35 0.71 Squared poverty gap 0.33 0.25 0.64 Harsi Head Count Ratio 0.62 0.46 0.65 Poverty gap 0.38 0.27 0.35 Squared poverty gap 0.37 0.18 0.26
Villages located in parts of the system with sufficient access to water were less poor than villages located in the tail end of the system, a conclusion which seemed to show the first research hypothesis (‘Command areas of specific canal reaches receiving less irrigation water per ha have lower productivity and a higher incidence of poverty’) to be true. Although the specific location of villages did not seem to matter much (in the head, middle of tail reach of the specific branch canal), especially in the case of water scarcity the location of the branch canal in the total irrigation system proved important. For water scarce NSLC, poverty is higher in the tail as compared to the head branch. For KDS, the results are different, but as water is not scarce in KDS this does not change our conclusions with regard to the first research hypothesis. In fact, the higher poverty levels in the head branch of KDS are explained by the fact that less off-farm employment opportunities are available; as the percentage of landless households in the head branch of KDS is relatively high, lack of off-farm employment opportunities affects poverty more then water availability in this branch.

150
In MP, the first research hypothesis could be confirmed as well; poverty in the tail-end reaches being much higher then in the middle reaches because of lack of water availability. Higher figures in the head reach could be explained by different factors, among which is the over-use of water, resulting in lower productivity of certain crops. Agricultural Production and Irrigation Performance Although crop choice and cropping patterns in the two states differed, the general trend in the two states was the same: when water is securely available, farmers will plant water-intensive, high-value crops. Differences in crop choice and cropping patterns were directly reflected in farm income, although high -value crops usually demand high-value inputs too. Actually, especially in MP, small farmers seemed less able to use the available water in an optimal way, as lack of access to credit and other services put a constraint on crop choice from the point of input costs.
Table 3.3.20. Agricultural production and farm income in NSLC.
NSLC Head Middle Tail Main crop (%) Paddy (100%) Paddy (70%) Cotton (35%) Cropping intensity 1.47 0.66 0.94 Productivity (Kg/ha) 4,340 6,492 3,172 Average net crop income (Rs./ha) 11,826 17,373 4,894 Agricultural wages Rs./day 50 45 40
Average crop income of landholding households actually gives a better picture of irrigation benefits than the net value produced per hectare; especially in the middle branch, farmers have started growing chillies on small plots of land, as the water available for paddy and other crops is not sufficient.
Table 3.3.21. Agricultural production and farm income in KDS.
KDS Head Middle Tail Main crop (%) Paddy (45%) Paddy (55%) Paddy (80%) Cropping intensity 1.07 1.31 1.43 Productivity (Kg/ha) 5,161 5,645 4,129 Average net crop income (Rs./ha) 17,131 17,616 6,957 Agricultural wages Rs./day 65 70 65
Table 3.3.22. Agricultural production and farm income in Halali.
Halali Head Middle Tail Main crop (%) HYV wheat
(70%) HYV wheat (65%)
Local wheat (45%)
Cropping intensity 1.64 1.61 1.41 Productivity (kgs. /ha/wheat) 1,008 900 740 Average net farm income (Rs. /ha/year) 3,400 2,800 1,750 Agricultural wages Rs. /day 35 30 30

151
Table 3.3.23. Agricultural production and farm income in Harsi.
Harsi Head Middle Tail Main crop (%) Paddy (90%) Paddy (60%) Sorghum, Maize (80%) Cropping intensity 1.78 1.56 1.56 Productivity (kgs/ha/paddy) 1,400 1,600 1,200 Average net farm income (Rs. /ha/year) 4,600 5,300 3,300 Agricultural wages Rs. /day 70 65 90
From our analysis of the irrigation performance with regard to rural poverty in the four irrigation systems in Madhya Pradesh and Andhra Pradesh, we can conclude that access to irrigation reduces poverty in a significant way. Overall, poverty in irrigated areas is lower than in rainfed areas. The main impact irrigation has on household income is through increased agricultural productivity, higher cropping intensity and the production of high-value crops.
Distribution of benefits from irrigation
In both Andhra Pradesh and Madhya Pradesh, the second research hypothesis: ‘under existing conditions, small, marginal and poor farmers receive less benefits from irrigation than large and non-poor farmers,’ was more difficult to prove. However, in the water scarce irrigation systems a relationship between landholding size and access to irrigation seemed to exist.
Table 3.3.24. Distribution of landholding size over the irrigation system.
% of respondents Category
NSLC KDS Halali Harsi Landless 51 60 27 12 Marginal farmers (0-1 ha) 23 22 20 26 Small farmers (1-2 ha) 10 7 22 24 Large farmers (2 ha and above) 16 11 31 38
Size of landholding basically increases when moving from head to tail, together with the percentage of landlessness, which, especially in the tail-end of water scarce systems, is relatively high. Although this might indicate that small holders have actually received less benefits from irrigation and have been forced to leave their lands, in the short term the differences in income cannot be explained by landholding size alone. Clearly, marginal landholders in water-abundant systems are better-off than marginal landholders in water-scarce systems: the benefits that can be derived from a small plot of land with secure access to water are clearly higher than the benefits from lands with no water security. Table 3.3.25. Socio-economic indicators for marginal, small, large farmers in NSLC. NSLC Marginal farmers Small farmers Large farmers Poverty levels (HCI (PG/ SGP)) 32% (0.14/ 0.08) 26% (0.10/ 0.05) 17 % (0.08/ 0.05)Net value produced per household area (rs/ha) 12,792 13,178 10,738Net value produced per cultivated area (rs/ha) 13,334 11,911 12,724Output per unit of Labor (Rs./days) 321.1 428.8 684.9Family labor/total labor (%) 14.6 17.3 12.9Income from farm prod/total income (%) 0.5 0.9 1.0

152
In NSLC, poverty and landholding size are related, the larger the landholding size, the lower the
poverty levels. The direction of this relation is another question however, as is the extent to which small landholding have less access to the benefits of irrigation.
From the productivity figures however, an important result follows from the difference between household and cultivated area for the different landholding sizes: Whereas marginal households have a higher productivity per cultivated area, large landowners have a higher productivity per household area. This, in fact, reflects the cropping intensity of agricultural productivity; large landowners apparently having more often a successful second crop than small and marginal landowners. Although, theoretically, this could be related to the availability of other agricultural inputs too, the most important factor for double-cropping is access to water. Thus, large farmers seem to have better access to irrigation water than small and marginal farmers, regardless of their location in the irrigation system. Irrigation benefits in NSLC thus, seem related to landholding size, large landowners having higher productivity per household area and because of more intensive cropping rates.
The labor productivity of small and marginal farmers is lower than that of large farmers (< 2 ha) as well, but this can be explained by the higher percentage of family labor employed. Small farmers do have some other sources of income, but its less than marginal farmers (0-1 ha) who only get 50 percent of their income from farming. The higher value produced per cultivated area is related to crop choice too: some of the small and marginal landowners to grow high-value, non-cereal crops like chillies, that have a high value per hectare, but are in effect grown only on very small plots of land. Table 3.3.26. Socio-economic indicators for marginal, small, large farmers in KDS. KDS Marginal farmers Small farmers Large
farmers Poverty levels (HCI (PG/SPG)) 13% (0.05/0.03) 12% (2 HH only) 0Net value produced per household area (Rs./ha) 11738 12375 14099Net value produced per cultivated area (Rs./ha) 18374 22264 24319Output per unit of Labour (Rs./days) 451.0 476.7 551.3Family labor/total labor (%) 17.0 19.4 17.0Income from farm prod/total income (%) 0.8 1.0 1.1
For the Krishna Delta, the picture that emerges is different: here, for all categories, net value produced per household area is larger than the value produced per cultivated area; all types of households on average produce more than one crop. Interestingly, marginal farmers are most productive, even with a lower output per unit of labor. Again, small farmers use relatively more labor, and even marginal farmers gain most of their income from agriculture. The fact that large farmers receive more then 100 percent of their income from agriculture reflects a measurement error, households probably having underestimated the total income gained.

153
Table 3.3.27. Socio-economic indicators for poor and non-poor farmers in Halali and Harsi.
Halali Harsi Indicator
Poor Non- poor Poor Non-
poor Average landholding size (in ha) 0.83 6.16 1.22 2.76 Average household income (in Rs.) 5,547 41,957 7,872 30,507 Farm income as a percentage of household income 33.0 77.0 39.0 59.0 Labor income as a percentage of household income 50.6 11.8 31.3 6.9 Other sources of income as a percentage of household income 11.4 2.2 9.7 5.6
Other benefits recorded in Madhya Pradesh as related to the benefits from irrigation were that neither in the Halali nor Harsi system, significant outward migration has been reported. Comparison of investment in health and education for the command area as compared with the control area also give a picture of the benefits from irrigation: table 3.3.28 below shows that command areas have higher expenditure in both these vital social areas. Table 3.3.28. Average household expenditure on medicines and education in Halali and Harsi.
Halali Harsi System Control System Control Medical 1673 1272 2094 2695 Education 1703 1290 1878 579 Total 3376 2562 3972 3274
Conclusions Although small landowners are generally poorer than larger landowners, this does not necessarily link their poverty to less access to the benefits of irrigation. However, in NSLC, landholding does seem to influence the access of farm households to irrigation water, as double-cropping is mainly confined to the larger landholdings. Looking at the distribution of landholdings over the irrigation system, the size of landholding basically increases when moving from head to tail, together with the percentage of landlessness, which, especially in the tail end of water-scarce systems, is relatively high. Although this might be an indication of small holders having been forced to leave their lands as they did not receive sufficient irrigation water to make farming on these small plots economically feasible, in the short term, differences in income cannot be explained by landholding size alone. Clearly, marginal landholders in water-abundant systems are better-off than marginal landholders in water-scarce systems: the benefits that can be derived from a small plot of land with secure access to water are clearly higher then the benefits with no water security. Whether irrigation benefits are more linked to the size of landholding or the location of the village in the irrigation system, cannot be concluded from this analysis; what is known is only that in water-scarce systems location and land size do have an effect.
Poverty is less intense and less widely spread in long established irrigated areas than in new ones. Halali is a relatively smaller system and only around 22-years-old. As a result, the difference in water availability between the head and the middle branch is minimal, and the differences in poverty levels between these branches are small. The Harsi system is bigger, older (75 years) and more degraded. In this

154
system, the head reaches get excess water (but unreliable), while the tail reaches hardly receives any water. In Andhra Pradesh, the age of the irrigation system also seems to play a role in the broader socio-economic development of the region. Non-agricultural income opportunities were, for example, much better in the Krishna Delta Irrigation System, established 150 years ago, than in the Nagarjuna Sagar and in both Madhya Pradesh and Andhra Pradesh wages were higher in the established irrigation system than in the more recently established systems. The long-term effects of irrigation system performance on poverty levels might thus be broader than the effects through agricultural productivity alone. Although these effects have not been explicitly analyzed, their importance in explaining poverty has been felt.
An important factor that affects both poor and marginal farmers unequally in all the four irrigation systems is the unreliability of irrigation water supply. Not only do study results indicate that larger farmers sometimes have access to alternative sources of irrigation, which small and marginal farmers do not, small landholdings without secure water are simply not economically feasible and without a reliable supply of water, marginal farmers often lose out and have to sell their land. Besides, secure access to water, allows farmers to grow higher value, water intensive crops (rice) and to have two crops a year. Households can thus derive a larger part of their income from agriculture, which proved an important indicator in explaining the variance in poverty levels that arose.

155
3.4. DETERMINANTS OF POVERTY IN IRRIGATED AGRICULTURE
For the four systems studied, estimates of poverty were presented in the previous chapter. In this chapter, we analyze key determinants of poverty, and test the significance of various factors influencing poverty, including irrigation. Andhra Pradesh We model poverty as a function of demographic variables, crop productivity/income, non-crop and non-farm income, landholdings, and availability/access to water. The specified models are estimated using Logit regression specification, with the dependent variable being a dichotomous variable of whether a household is poor or non-poor. The explanatory variables used are family size, education of household head, gross value of product per hectare, non-crop and no-farm income, value of household assets, and size of landholdings. Dummy variables are used to capture differential impact of availability and access to water on poverty. Locational differences within irrigation systems are estimated using locational dummies. The estimated coefficients indicate the significance of variables affecting the probability of households being poor. Negative sign on estimated coefficient of a variable indicates that that variable contributes to poverty alleviation. A number of Logit models are estimated. The first model, in addition to testing the significance of other than irrigation variables, tests whether differences in poverty across irrigated and non-irrigated areas are significant, and whether there are differences in poverty across irrigation systems.
( )( )
nonpoorppoorplog = β0 + β1 FSIZE + β2 EDU + β3 AOWN + β4 GVPPHA + β5 INNCRP
+ β6 VALA + β7 DS + β8 DI + e ............................................................. (1)
where: Poverty Poor = 1; Non-poor = 0 (According to national poverty line) FSIZE Family size EDU Number of years at school AOWN Area own (ha) GVPPHA GVP per hectare (,000 Rs.) INNCRP Non-crop income (,000 Rs.) VALA Value of assets (,000 Rs.) DS Dummy for System (NSLC = 1; KDS = 0) DI Dummy for irrigation (Irrigated = 1; Non-irrigated = 0) e Error term
The results of the analysis are presented in table 3.4.1. Coefficients of all the specified variables carry expected signs and are significant (except for education variable). Coefficient of family size has a positive sign and is significant, indicating that the greater the number of family members, the higher is the probability of that household remaining poor, compared to a household with smaller number of family members. Coefficient of education variable, though negative, is not significant. Coefficients for landholding size, crop productivity, non-crop income and non-land assets, all carry a negative sign and are significant, indicating that these variables have a significant influence on household poverty. The higher the value of these variables, the lower is the incidence of poverty. Negative marginal effect on the

156
probability of a household being poor is highest for gross value of production variable. Negative significant coefficient on area dummy indicates that there are significant differences in incidence of poverty in irrigation systems and adjoining rainfed areas. Poverty incidence is significantly less in irrigation systems than in rainfed areas, suggesting that irrigation has a significant impact on poverty alleviation. Positive significant coefficient for system dummy indicate that there are differences in incidence of poverty across KDS and NSLC, with poverty significantly higher in water-short NSLC system than in water-adequate KDS system. Table 3.4.1. Effect of irrigation on poverty in two systems (irrigated compared with non-irrigated in both
systems). Variable Coefficient Marginal Effect on
probability of (Y=1) b/St.Er.
Constant -0.7947 -0.1535 -1.991 FSIZE 0.2723 0.0561 4.529 EDU -0.0005 -0.0001 -0.364 AOWN -0.1035 -0.0199 -1.170 GVPPHA -0.0293 -0.0057 -4.673 INNCRP -0.0223 -0.0043 -5.014 VALA -0.0042 -0.0008 -1.277 DS 0.8452 0.1633 4.138 DI -1.1356 -0.2194 -3.675 Dependent Variable = poverty (1 = poor and 0 = non-poor) Number of observations = 600 Log likelihood ratio = -319.16 Base categories = KDS system, Rainfed Next, we test whether differences in poverty incidence across head, middle and tail reaches of the irrigation systems and rainfed areas are significant. The specified model with head, middle and tail-dummies (with rainfed area as a base category) is specified as follows:
( )( )
nonpoorppoorplog = β0 + β1 FSIZE + β2 EDU + β3 AOWN + β4 GVPPHA + β5 INNCRP
+ β6 VALA + β7 DS + β8 DLH + β9 DLM + β10 DLT + e .................... (2)
where all variables are defined as above and
DS Dummy for System (NSLC = 1; KDS = 0) DLH Dummy for location Head (DLH = 1; 0 otherwise) DLM Dummy for location Middle (DLM = 1; 0 otherwise) DLT Dummy for location Tail (DLT = 1; 0 otherwise) e Error term
The results of the estimated equation 2 are presented in table 3.4.2. Signs and significance of all other than locational dummies are similar as for equation 1. Coefficients of the three dummy variables are negative and significant. These indicate that poverty incidence at head, middle and tail reaches is significantly less as compared to that in rainfed areas. Although, negative marginal effect on probability

157
of a household being poor varies across head, middle and tail reaches, the results suggest that irrigation has a significant impact on poverty when compared with rainfed areas. Table 3.4.2. Effect of irrigation on poverty in two systems (head, middle and tail of both systems
compared with non-irrigated). Variable Coefficient Marginal Effect on
probability of (Y=1) b/St.Er.
Constant -0.7908 -0.1520 -1.975 FSIZE 0.2699 0.0519 4.455 EDU -0.0006 -0.0001 -0.461 AOWN -0.1111 -0.0214 -1.241 GVPPHA -0.0286 -0.0055 -4.545 INNCRP -0.0228 -0.0044 -5.076 VALA -0.0040 -0.0008 -1.251 DS 0.8688 0.1669 4.231 DLH -1.1697 -0.2248 -3.418 DLM -1.4142 -0.2718 -3.050 DLT -0.8842 -0.1699 -2.624 Dependent Variable = poverty (1 = poor and 0 = non-poor) Number of observations = 600 Log likelihood ratio = -316.92 Base categories = KDS system, Rainfed Further, we test whether differences in poverty incidence across head, middle and tail reaches within a system are significant. This has an important implication for equity in water distribution. The specified model with head and middle dummies (with tail as a base category) is specified as follows:
( )( )
nonpoorppoorplog = β0 + β1 FSIZE + β2 EDU + β3 AOWN + β4 GVPPHA + β5 INNCRP
+ β6 VALA + β7 β7 DS + β8 DLH + β9 DLM + e .................................... (3)
where all variables are defined as above and
DLH Dummy for location Head (DLH = 1; 0 otherwise) DLM Dummy for location Middle (DLM = 1; 0 otherwise) e Error term
The results of estimated equation 3 are presented in table 3.4.3. Signs and significance of all other than locational dummies are similar as for equation 1 and 2 above. Coefficients of head and middle location dummies carry negative signs, indicating less incidence of poverty at head and middle location compared to tail locations. Significant negative coefficient of middle location dummy indicates that a negative marginal effect on the probability of a household being poor at middle location is significant. However, coefficient of head location dummy indicates that this effect is not significant for households at head location when compared to tail location. The results imply that poverty incidence is significantly less at middle reaches where productivity is high. While poverty is higher at tail reaches, difference in poverty across head and tail reaches is not significant. Contrary to common perceptions, poverty is not necessarily lower at locations closer to the source of water (i.e. head reaches).

158
Table 3.4.3. Effect of irrigation on poverty in two systems (head and middle of both systems compared with tail).
Variable Coefficient Marginal Effect on
probability of (Y=1) b/St.Er.
Constant -1.6436 -0.2954 -4.766 FSIZE 0.2981 0.0536 4.564 EDU -0.0008 -0.0002 -0.608 AOWN -0.1604 -0.0288 -1.232 GVPPHA -0.0289 -0.0052 -3.927 INNCRP -0.0223 -0.0040 -5.042 VALA -0.0117 -0.0021 -1.951 DS 0.6996 0.1257 8.178 DLH -0.2337 -0.0419 -0.929 DLM -0.5022 -0.0903 -1.990 Dependent Variable = poverty (1 = poor and 0 = non-poor) Number of observations = 540 Log likelihood ratio = -279.91 Base categories = KDS system, Tail We gain further insights by estimating equations for each system separately. Specified equations and estimation results are presented in the Appendix-1 of this chapter (tables A1-A6). Results from disaggregated analysis further indicate that though poverty incidence is lower in irrigated areas compared to rainfed areas in both systems, the difference is significant and stronger in NSLC than in the KDS system. Similarly, differences in poverty incidence across reaches (head, middle and tail) and rainfed areas are significant and more pronounced for NSLC than for KDS. Comparison of poverty across reaches in individual systems indicates that poverty in NSLC is significantly low at both head and middle locations compared to tail location. In KDS, while poverty is significantly lower at middle location, poverty differences across head and tail locations are not significant.

159
Madhya Pradesh As for Andhra Pradesh, we estimated the same equation separately for Madhya Pradesh. The results of the analysis are presented in table 3.4.4. Coefficients of all the specified variables carry expected signs and are significant (except for education variable). Coefficient of family size has a positive sign and is significant, indicating that the greater the number of family members, the higher is the probability of that household remaining poor compared to a household with smaller number of family members. Coefficients for landholding size, crop productivity, non-crop income and non-land assts, all carry a negative sign and are significant, indicating that these variables have significant influence on household poverty. The higher the value of these variables, the lower is the incidence of poverty. Negative marginal effect on the probability of a household being poor is highest for a non-crop income variable. Negative significant coefficient on area dummy indicates that there are significant differences in incidence of poverty in irrigation systems and adjoining rainfed areas. Poverty incidence is significantly less in irrigation systems than in rainfed areas, suggesting that irrigation has a significant impact on poverty alleviation. Positive significant coefficient for system dummy indicates that there are differences in incidence of poverty across Halali and the Harsi systems, with poverty significantly higher in Halali than in the Harsi system.
( )( )
nonpoorppoorplog = β0 + β1 FSIZE + β2 EDU + β3 AOWN + β4 GVPPHA + β5 INNCRP
+ β6 VALA + β7 DS + β8 DI + e ............................................................. (4)
where: Poverty Poor = 1; Non-poor = 0 (According to national poverty line) FSIZE Family size EDU Number of years at school AOWN Area own (ha) GVPPHA GVP per hectare (‘,00 Rs.) INNCRP Non-crop income (,000 Rs.) VALA Value of assets (,000 Rs.) DS Dummy for System (Halali = 1; Harsi = 0) DI Dummy for irrigation (Irrigated = 1; Non-irrigated = 0) e Error term
Table 3.4.4. Effect of irrigation on poverty in two systems (irrigated compared with non-irrigated in both
systems). Variable Coefficient Marginal Effect on
probability of (Y=1) b/St.Er.
Constant 3.2214 0.7533 4.3700 FSIZE 0.8821 0.2063 8.6460 EDU -0.0227 -0.0053 -0.6400 AOWN -1.5526 -0.3630 -9.8410 GVPPHA -0.0828 -0.0194 -3.7380 INNCRP -0.2152 -0.0503 -7.9470 VALA -0.0069 -0.0016 -3.4390 DS 0.5878 0.1375 1.6740 DI -2.5933 -0.6064 -4.0930 Dependent Variable = poverty (1 = poor and 0 = non-poor) Number of observations = 492 Log likelihood ratio = -135.58 Base categories = Harsi system, Rainfed

160
Next, we test whether differences in poverty incidence across head, middle and tail reaches of the irrigation systems and rainfed areas are significant. The specified model with head, middle and tail dummies (with rainfed area as a base category) is specified as follows:
( )( )
nonpoorppoorplog = β0 + β1 FSIZE + β2 EDU + β3 AOWN + β4 GVPPHA + β5 INNCRP
+ β6 VALA + β7 DS + β8 DLH + β9 DLM + β10 DLT + e .................... (5)
where all variables are defined as above and
DS Dummy for System (Halali= 1; Harsi = 0) DLH Dummy for location Head (DLH = 1; 0 otherwise) DLM Dummy for location Middle (DLM = 1; 0 otherwise) DLT Dummy for location Tail (DLT = 1; 0 otherwise) e Error term
The results of estimated equation 5 are presented in table 3.4.5. Signs and significance of all other than locational dummies are similar as for equation 4. Coefficients of three dummy variables are negative and significant. These indicate that poverty incidence at head, middle and tail reaches is significantly less as compared to that in rainfed areas. Although, a negative marginal effect on the probability of a household being poor varies across head, middle and tail reaches, the results suggest that irrigation has a significant impact on poverty when compared with rainfed areas. Table 3.4.5. Effect of irrigation on poverty in two systems (head, middle and tail of both systems
compared with non-irrigated). Variable Coefficient Marginal Effect on
probability of (Y=1) b/St.Er.
Constant 3.2172 0.7568 4.3490 FSIZE 0.8915 0.2097 8.6510 EDU -0.0239 -0.0056 -0.6690 AOWN -1.5520 -0.3651 -9.7280 GVPPHA -0.0898 -0.0211 -3.8260 INNCRP -0.2140 -0.0503 -7.8910 VALA -0.0068 -0.0016 -3.4210 DS 0.6197 0.1458 1.7450 DLH -2.1954 -0.5165 -3.2270 DLM -2.7250 -0.6411 -3.9210 DLT -2.7437 -0.6454 -4.1560 Dependent Variable = poverty (1 = poor and 0 = non-poor) Number of observations = 492 Log likelihood ratio = -134.51 Base categories = Harsi system, Rainfed Further, we test whether differences in poverty incidence across head, middle and tail reaches within a system are significant. This has an important implication for equity in water distribution. The specified model with head and middle dummies (with tail as a base category) is specified as follows:

161
( )( )
nonpoorppoorplog = β0 + β1 FSIZE + β2 EDU + β3 AOWN + β4 GVPPHA + β5 INNCRP
+ β6 VALA + β7 β7 DS + β8 DLH + β9 DLM + e .................................... (6)
where all variables are defined as above and
DS Dummy for System (Halali = 1; Harsi = 0) DLH Dummy for location Head (DLH = 1; 0 otherwise) DLM Dummy for location Middle (DLM = 1; 0 otherwise) e Error term
The results of estimated equation 6 are presented in table 3.4.6. Signs and significance of all, other than locational dummies are similar as for equation 4 and 5 above. Coefficient of head dummy is positive and coefficient of middle dummy is negative, however, both are insignificant. The results indicate that there are no significant differences in poverty across head and middle locations when compared with tail locations. Similar results are obtained from analysis of each system, separately(Appendix- 2). Table 3.4.6. Effect of irrigation on poverty in two systems (head and middle of both systems compared
with tail). Variable Coefficient Marginal Effect on
probability of (Y=1) b/St.Er.
Constant 0.5942 0.1182 0.9370 FSIZE 0.8934 0.1777 7.5230 EDU -0.0213 -0.0042 -0.5740 AOWN -1.6091 -0.3201 -9.1820 GVPPHA -0.0849 -0.0169 -3.3950 INNCRP -0.2197 -0.0437 -7.8890 VALA -0.0069 -0.0014 -3.1430 DS 0.5495 0.1093 1.4170 DLH 0.4988 0.0992 1.1740 DLM -0.0042 -0.0008 -0.0100 Dependent Variable = poverty (1 = poor and 0 = non-poor) Number of observations = 422 Log likelihood ratio = -199.98 Base categories = Halali, Tail

162
APPENDIX – 1 Estimated Equations for Systems in Andhra Pradesh
( )( )
nonpoorppoorplog = β0 + β1 FSIZE + β2 EDU + β3 AOWN + β4 GVPPHA + β5 INNCRP
+ β6 VALA + β7 DI + e .........................................................................(1)
where: Poverty Poor = 1; Non-poor = 0 (According to national poverty line) FSIZE Family size EDU Number of years at school AOWN Area own (ha) GVPPHA GVP per hectare (,000 Rs.) INNCRP Non-crop income (,000 Rs.) VALA Value of assets (,000 Rs.) DI Dummy for irrigation (Irrigated = 1; Non-irrigated = 0) e Error term
Table A1.1. Effect of irrigation on poverty in NSLC (irrigated compared with non-irrigated). Variable Coefficient Marginal Effect on
probability of (Y=1) b/St.Er.
Constant 1.2940 0.3014 2.215 FSIZE 0.2179 0.0508 2.988 EDU -0.0011 -0.0003 -0.750 AOWN -0.0791 -0.0184 -0.798 GVPPHA -0.0430 -0.0100 -4.478 INNCRP -0.0229 -0.0053 -3.743 VALA -0.0052 -0.0012 -1.478 DI -2.0895 -0.4868 -4.146 Dependent Variable = poverty (1 = poor and 0 = non-poor) Number of observations = 330 Log likelihood ratio = -191.89 Base category = Rainfed
( )( )
nonpoorppoorplog = β0 + β1 FSIZE + β2 EDU + β3 AOWN + β4 GVPPHA + β5 INNCRP
+ β6 VALA + β7 DLH + β8 DLM + β9 DLT + e ....................................... (2) where:
Poverty Poor = 1; Non-poor = 0 (According to national poverty line) FSIZE Family size EDU Number of years at school AOWN Area own (ha) GVPPHA GVP per hectare (,000 Rs.) INNCRP Non-crop income (,000 Rs.) VALA Value of assets (,000 Rs.) DLH Dummy for location Head (DLH = 1; 0 otherwise) DLM Dummy for location Middle (DLM = 1; 0 otherwise) DLT Dummy for location Tail (DLT = 1; 0 otherwise) e Error term

163
Table A1.2. Effect of irrigation on poverty in NSLC (head, middle and tail compared with non-irrigated). Variable Coefficient Marginal Effect on
probability of (Y=1) b/St.Er.
Constant 1.3715 0.3187 2.332 FSIZE 0.2005 0.0466 2.694 EDU -0.0012 -0.0001 -0.854 AOWN -0.0907 -0.0211 -0.891 GVPPHA -0.0432 -0.0054 -4.499 INNCRP -0.0231 -0.0010 -3.725 VALA -0.0043 -0.0021 -1.275 DLH -2.3925 -0.5561 -4.450 DLM -2.2209 -0.5162 -4.067 DLT -1.6785 -0.3902 -3.162 Dependent Variable = poverty (1 = poor and 0 = non-poor) Number of observations = 330 Log likelihood ratio = -189.13 Base categories = Rainfed
( )( )
nonpoorppoorplog = β0 + β1 FSIZE + β2 EDU + β3 AOWN + β4 GVPPHA + β5 INNCRP
+ β6 VALA + β7 DLH + β8 DLM + e ................................................... (3)
where:
Poverty Poor = 1; Non-poor = 0 (According to national poverty line) FSIZE Family size EDU Number of years at school AOWN Area own (ha) GVPPHA GVP per hectare (,000 Rs.) INNCRP Non-crop income (,000 Rs.) VALA Value of assets (,000 Rs.) DLH Dummy for location Head (DLH = 1; 0 otherwise) DLM Dummy for location Middle (DLM = 1; 0 otherwise) e Error term
Table A1.3. Effect of irrigation on poverty in NSLC (head and middle compared with tail). Variable Coefficient Marginal Effect on
probability of (Y=1) b/St.Er.
Constant 0.0749 0.0175 0.196 FSIZE 0.1577 0.0369 2.199 EDU -0.0009 -0.0002 -0.624 AOWN -0.0284 -0.0066 -0.314 GVPPHA -0.0378 -0.0089 -4.111 INNCRP -0.0199 -0.0047 -3.429 VALA -0.0036 -0.0008 -1.091 DLH -1.0368 -0.2424 -3.418 DLM -0.8288 -0.1938 -2.759 Dependent Variable = poverty (1 = poor and 0 = non-poor) Number of observations = 330 Log likelihood ratio = -194.71 Base categories = Tail

164
( )
( )
nonpoorppoorplog = β0 + β1 FSIZE + β2 EDU + β3 AOWN + β4 GVPPHA + β5 INNCRP
+ β6 VALA + β7 DI + e ......................................................................... (4) where:
Poverty Poor = 1; Non-poor = 0 (According to national poverty line) FSIZE Family size EDU Number of years at school AOWN Area own (ha) GVPPHA GVP per hectare (,000 Rs.) INNCRP Non-crop income (,000 Rs.) VALA Value of assets (,000 Rs.) DI Dummy for irrigation (Irrigated = 1; Non-irrigated = 0) e Error term
Table A1.4. Effect of irrigation on poverty in KDS (irrigated compared with non-irrigated). Variable Coefficient Marginal Effect on
probability of (Y=1) b/St.Er.
Constant -2.6488 -0.3098 -3.439 FSIZE 0.4722 0.0552 3.596 EDU -0.0467 -0.0055 1.324 AOWN -0.4797 -0.0561 -1.647 GVPPHA -0.0209 -0.0024 -2.753 INNCRP -0.0228 -0.0027 -3.158 VALA -0.0105 -0.0012 0.872 DI -0.2877 -0.0336 -0.572 Dependent Variable = poverty (1 = poor and 0 = non-poor) Number of observations = 270 Log likelihood ratio = -117.88 Base categories = Rainfed
( )( )
nonpoorppoorplog = β0 + β1 FSIZE + β2 EDU + β3 AOWN + β4 GVPPHA + β5 INNCRP
+ β6 VALA + β7 DLH + β8 DLM + β9 DLT + e ....................................... (5) where:
Poverty Poor = 1; Non-poor = 0 (According to national poverty line) FSIZE Family size EDU Number of years at school AOWN Area own (ha) GVPPHA GVP per hectare (,000 Rs.) INNCRP Non-crop income (,000 Rs.) VALA Value of assets (,000 Rs.) DLH Dummy for location Head (DLH = 1; 0 otherwise) DLM Dummy for location Middle (DLM = 1; 0 otherwise) DLT Dummy for location Tail (DLT = 1; 0 otherwise) e Error term

165
Table A1.5. Effect of irrigation on poverty in KDS (head, middle and tail compared with non-irrigated). Variable Coefficient Marginal Effect on
probability of (Y=1) b/St.Er.
Constant -2.6062 -0.2895 -3.315 FSIZE 0.4651 0.0516 3.452 EDU 0.0546 0.0061 1.586 AOWN -0.5669 -0.0629 -1.937 GVPPHA -0.0204 -0.0023 -2.706 INNCRP -0.0231 -0.0026 -3.249 VALA 0.0101 0.0011 0.763 DLH 0.0973 0.0108 0.176 DLM -0.8468 -0.0941 -1.420 DLT -0.2440 -0.0271 -0.439 Dependent Variable = poverty (1 = poor and 0 = non-poor) Number of observations = 270 Log likelihood ratio = -115.71 Base categories = Rainfed
( )( )
nonpoorppoorplog = β0 + β1 FSIZE + β2 EDU + β3 AOWN + β4 GVPPHA + β5 INNCRP
+ β6 VALA + β7 DLH + β8 DLM + e ................................................... (6)
where: Poverty Poor = 1; Non-poor = 0 (According to national poverty line) FSIZE Family size EDU Number of years at school AOWN Area own (ha) GVPPHA GVP per hectare (,000 Rs.) INNCRP Non-crop income (,000 Rs.) VALA Value of assets (,000 Rs.) DLH Dummy for location Head (DLH = 1; 0 otherwise) DLM Dummy for location Middle (DLM = 1; 0 otherwise) e Error term
Table A1.6. Effect of irrigation on poverty in KDS (head and middle compared with tail). Variable Coefficient Marginal Effect on
probability of (Y=1) b/St.Er.
Constant -2.8038 -0.3119 -4.276 FSIZE 0.4664 0.0519 3.457 EDU 0.0552 0.0061 1.615 AOWN -0.5477 -0.0609 -1.886 GVPPHA -0.0202 -0.0022 -2.669 INNCRP -0.0227 -0.0025 -3.229 VALA 0.0095 0.0011 0.710 DLH 0.2749 0.0306 0.718 DLM -0.6654 -0.0740 -1.533 Dependent Variable = poverty (1 = poor and 0 = non-poor) Number of observations = 270 Log likelihood ratio = -115.81 Base categories = Tail

166
APPENDIX – 2 Estimated Equations for Individual Systems in Madhya Pradesh Halali System
( )
( )
nonpoorppoorplog = β0 + β1 FSIZE + β2 EDU + β3 AOWN + β4 GVPPHA + β5 INNCRP
+ β6 VALA + β7 DI + e ......................................................................... (1) where:
Poverty Poor = 1; Non-poor = 0 (According to national poverty line) FSIZE Family size EDU Number of years at school AOWN Area own (ha) GVPPHA GVP per hectare (,000 Rs.) INNCRP Non-crop income (,000 Rs.) VALA Value of assets (,000 Rs.) DI Dummy for irrigation (Irrigated = 1; Non-irrigated = 0) e Error term
Table A2.1. Effect of irrigation on poverty in Halali (irrigated compared with non-irrigated). Variable Coefficient Marginal Effect on
probability of (Y=1) b/St.Er.
Constant 5.4799 1.3031 3.5590 FSIZE 1.5122 0.3596 5.3110 EDU 0.0301 0.0072 0.4850 AOWN -2.5386 -0.6037 -6.2990 GVPPHA -0.1545 -0.0367 -2.5370 INNCRP -0.4140 -0.0984 -5.0270 VALA -0.0059 -0.0014 -1.5780 DI -3.9214 -0.9325 -3.0340 Dependent Variable = poverty (1 = poor and 0 = non-poor) Number of observations = 252 Log likelihood ratio = -44.62 Base category = Rainfed
( )
( )
nonpoorppoorplog = β0 + β1 FSIZE + β2 EDU + β3 AOWN + β4 GVPPHA + β5 INNCRP
+ β6 VALA + β7 DLH + β8 DLM + β9 DLT + e ....................................... (2) where:
Poverty Poor = 1; Non-poor = 0 (According to national poverty line) FSIZE Family size EDU Number of years at school AOWN Area own (ha) GVPPHA GVP per hectare (,000 Rs.) INNCRP Non-crop income (,000 Rs.) VALA Value of assets (,000 Rs.) DLH Dummy for location Head (DLH = 1; 0 otherwise) DLM Dummy for location Middle (DLM = 1; 0 otherwise) DLT Dummy for location Tail (DLT = 1; 0 otherwise) e Error term

167
Table A2.2. Effect of irrigation on poverty in Halali (head, middle and tail compared with non-irrigated). Variable Coefficient Marginal Effect on
probability of (Y=1) b/St.Er.
Constant 5.5492 1.3193 3.5770 FSIZE 1.5287 0.3634 5.2560 EDU 0.0304 0.0072 0.4900 AOWN -2.5691 -0.6108 -6.2050 GVPPHA -0.1616 -0.0384 -2.5780 INNCRP -0.4209 -0.1001 -5.0170 VALA -0.0055 -0.0013 -1.4560 DLH -4.0393 -0.9603 -2.9200 DLM -3.6240 -0.8616 -2.6600 DLT -4.0305 -0.9582 -3.0090 Dependent Variable = poverty (1 = poor and 0 = non-poor) Number of observations = 252 Log likelihood ratio = -44.40 Base categories = Rainfed Head and Middle compared to Tail - Halali
( )( )
nonpoorppoorplog = β0 + β1 FSIZE + β2 EDU + β3 AOWN + β4 GVPPHA + β5 INNCRP
+ β6 VALA + β7 DLH + β8 DLM + e ................................................... (3)
where: Poverty Poor = 1; Non-poor = 0 (According to national poverty line) FSIZE Family size EDU Number of years at school AOWN Area own (ha) GVPPHA GVP per hectare (,000 Rs.) INNCRP Non-crop income (,000 Rs.) VALA Value of assets (,000 Rs.) DLH Dummy for location Head (DLH = 1; 0 otherwise) DLM Dummy for location Middle (DLM = 1; 0 otherwise) e Error term
Table A2.3. Effect of irrigation on poverty in Halali (head and middle compared with tail). Variable Coefficient Marginal Effect on
probability of (Y=1) b/St.Er.
Constant 1.6348 0.2754 1.5490 FSIZE 1.5997 0.2695 3.4950 EDU 0.0207 0.0035 0.3190 AOWN -2.7292 -0.4598 -4.1450 GVPPHA -0.1572 -0.0265 -2.0850 INNCRP -0.4481 -0.0755 -3.8730 VALA -0.0059 -0.0010 -1.2180 DLH -0.0415 -0.0070 -0.0560 DLM 0.3901 0.0657 0.5270 Dependent Variable = poverty (1 = poor and 0 = non-poor) Number of observations = 220 Log likelihood ratio = -38.90 Base categories = Tail

168
Irrigated compared to rainfed - Harsi
( )( )
nonpoorppoorplog = β0 + β1 FSIZE + β2 EDU + β3 AOWN + β4 GVPPHA + β5 INNCRP
+ β6 VALA + β7 DI + e ......................................................................... (4) where:
Poverty Poor = 1; Non-poor = 0 (According to national poverty line) FSIZE Family size EDU Number of years at school AOWN Area own (ha) GVPPHA GVP per hectare (,000 Rs.) INNCRP Non-crop income (,000 Rs.) VALA Value of assets (,000 Rs.) DI Dummy for irrigation (Irrigated = 1; Non-irrigated = 0) e Error term
Table A2.4. Effect of irrigation on poverty in Harsi (irrigated compared with non-irrigated). Variable Coefficient Marginal Effect on
probability of (Y=1) b/St.Er.
Constant 2.7834 0.6061 3.2130 FSIZE 0.7201 0.1568 6.5080 EDU -0.0385 -0.0084 -0.8210 AOWN -1.2061 -0.2626 -6.0110 GVPPHA -0.0758 -0.0165 -3.1120 INNCRP -0.1754 -0.0382 -6.3110 VALA -0.0097 -0.0021 -2.9830 DI -1.9439 -0.4232 -2.6240 Dependent Variable = poverty (1 = poor and 0 = non-poor) Number of observations = 240 Log likelihood ratio = -83.29 Base categories = Rainfed

169
Harsi System
( )( )
nonpoorppoorplog = β0 + β1 FSIZE + β2 EDU + β3 AOWN + β4 GVPPHA + β5 INNCRP
+ β6 VALA + β7 DLH + β8 DLM + β9 DLT + e ....................................... (5) where:
Poverty Poor = 1; Non-poor = 0 (According to national poverty line) FSIZE Family size EDU Number of years at school AOWN Area own (ha) GVPPHA GVP per hectare (,000 Rs.)
INNCRP Non-crop income (,000 Rs.) VALA Value of assets (,000 Rs.) DLH Dummy for location Head (DLH = 1; 0 otherwise) DLM Dummy for location Middle (DLM = 1; 0 otherwise) DLT Dummy for location Tail (DLT = 1; 0 otherwise) e Error term
Table A2.5. Effect of irrigation on poverty in KDS (head, middle and tail compared with non-irrigated). Variable Coefficient Marginal Effect on
probability of (Y=1) b/St.Er.
Constant 2.8593 0.6183 3.2320 FSIZE 0.7610 0.1646 6.5550 EDU -0.0448 -0.0097 -0.9310 AOWN -1.2224 -0.2643 -5.9140 GVPPHA -0.0968 -0.0209 -3.4620 INNCRP -0.1770 -0.0383 -6.3860 VALA -0.0103 -0.0022 -3.0490 DLH -1.1525 -0.2492 -1.4070 DLM -2.1510 -0.4651 -2.5390 DLT -2.2713 -0.4911 -2.8560 Dependent Variable = poverty (1 = poor and 0 = non-poor) Number of observations = 240 Log likelihood ratio = -80.82 Base categories = Rainfed

170
( )( )
nonpoorppoorplog = β0 + β1 FSIZE + β2 EDU + β3 AOWN + β4 GVPPHA + β5 INNCRP
+ β6 VALA + β7 DLH + β8 DLM + e ................................................... (6)
where: Poverty Poor = 1; Non-poor = 0 (According to national poverty line) FSIZE Family size EDU Number of years at school AOWN Area own (ha) GVPPHA GVP per hectare (,000 Rs.) INNCRP Non-crop income (,000 Rs.) VALA Value of assets (,000 Rs.) DLH Dummy for location Head (DLH = 1; 0 otherwise) DLM Dummy for location Middle (DLM = 1; 0 otherwise) e Error term
Table A2.6. Effect of irrigation on poverty in Harsi (head and middle compared with tail). Variable Coefficient Marginal Effect on
probability of (Y=1) b/St.Er.
Constant 0.6288 0.1192 0.8400 FSIZE 0.7255 0.1375 5.9310 EDU -0.0297 -0.0056 -0.5930 AOWN -1.2352 -0.2341 -5.1290 GVPPHA -0.0911 -0.0173 -3.2030 INNCRP -0.1731 -0.0328 -6.2110 VALA -0.0089 -0.0017 -2.7480 DLH 1.0389 0.1969 1.8650 DLM 0.0971 0.0184 0.1780 Dependent Variable = poverty (1 = poor and 0 = non-poor) Number of observations = 202 Log likelihood ratio = -72.48 Base categories = Tail
171
3.5. IRRIGATION SYSTEM PERFORMANCE AND ASSOCIATED IMPACTS ON POVERTY
In this section an attempt is made to provide an account of the level of irrigation performance of the systems studied, in order to understand the reasons for their poor performance and thereby their impacts on the poor. Irrigation system is a nested system (Small and S Vendsen 1992) within irrigated agriculture, which in turn, is an integral part of the wider agricultural economic system. Thus viewed from the systems viewpoint, the impacts of subsystems and the holistic system can be seen in terms of economic, social, hydrological and environmental standpoints. They can be quantified by using standard economic and environmental approaches to facilitate assessment of the level of each system performance per se, and in comparison with other irrigation systems studied. This being a very complex task (holistic modeling approach) literature on irrigation performance dealt in general with two simple system performance assessment approaches – which are based on endogenous and exogenous criteria, respectively — to the irrigation systems.
International Water Management Institute (IWMI), has made significant research in evaluating system performance in several agro-climatic zones globally. Nine indicators were developed by IWMI to facilitate analysis of performance across irrigation systems. Among them the first set of four indicators, namely, – production per unit cropped area, production per unit command, production per unit irrigation supply and production per unit water consumed – concern with output to unit land and water, which provide the basis for comparison of irrigated agriculture. The next set of five indicators are meant to characterize the individual system with respect to water supplies and economics and finances (Molden et al. 1998). In this, the hydrological indicators are ratios of relative water supply (RWS), relative irrigation supply (RIS) and water delivery capacity. The financial indicator is financial self-sufficiency (revenue from irrigation / total O&M cost) and the economic indicator is the standard gross value of production / cost of irrigation infrastructure – a percentage of gross returns on investment.
Thus, all these indicators are aimed at serving specific purposes as they relate to processes generated and operate outside the system. They allow identifying different attributes that led to better performance of irrigated agriculture (over a period of time) and facilitated cross-comparison of different irrigation systems. The analysis would be useful to policy makers and managers making long-term strategic decisions and for researchers in developing strategic options. However, performance is mostly assessed through several processes originating within the system, with the objective of improving the management of a particular irrigation system. The indicators in this context are related to management targets like timing, duration and flow rate of water, area irrigated and cropping patterns. The main purpose of such an analysis is to aid the manager to improve the water delivery performance and irrigation management (Murry-Rust and Snellen 1993).
In this study, several performance indicators are taken to understand their implications to poverty in irrigated agriculture. Regrouping the IWMI indicators mentioned above along with others, all the indicators are arranged under three broad headings – 1) productivity, equity and water supply 2) economic/financial, environmental and infrastructure sustainability and 3) institutional/organizational and management effectiveness. Thus, these indicators are inter-dependent representing output, process or impact. However, all the indicators could not be worked out for all the four irrigation systems studied alike, because of data lags or non-availability of authentic information. While for the projects in AP we could work out reach-wise analysis, for MP only system-level analysis could be made. Likewise, the data

172
on WUA level water cess collection is not available in AP, whereas such details are available in MP. In totality, the analysis will inform the performance and poverty linkages and provide pointers for strategic interventions.
The analysis is done in two parts. The first part looks at each of the three sets of indicators in terms of the overall performance of the four systems in a comparative perspective. The second part deals with the two systems in AP viz., NSLC and KDC, by a three-way disaggregation of each system on the basis of the reach of each system.
Productivity, Equity and Water Supply Indicators
The Four Systems
About 13 indicators, as listed in table 3.5.1, are identified as the ones that would show the performance of each irrigation system in terms of its productivity, equity and water supply to crops. Irrigation intensity shows the extent of actual area covered under irrigation in relation to the command area designed. Both the systems in AP show a very high performance in this regard, but KDS with 92 percent achievement is much better than NSLC with 82 percent. On the contrary, both the systems in MP show only two-third of reach compared to what is designed for, although the older system Harsi is marginally better at 68 percent compared to 63 percent of Halali. Cropping intensity of more that 100 percent indicates the extent of double-cropping. Many of the modern irrigation systems are designed explicitly for single crop and more so for irrigated dry crops, so as to spread the benefits of irrigation to a larger area and more farmers. Therefore, double-cropping doesn’t automatically suggest better performance. Nonetheless, in the four systems under study, double-cropping could be taken as indicating better performance. The results show that while the older system in AP, KDS, has considerable double-cropping, the older system in MP viz., Harsi shows much less than the relatively recent Halali. The low performance of Harsi is to be seen in terms of poor system maintenance. In terms of land productivity in the command area in AP, KDS shows a higher output (5,357 Kg) per hectare than that of NSLC (4,291 Kg per ha). But in MP, the productivity level reported is much higher to be realistic. True, the output for MP normally is in terms of wheat, whereas for AP it is assumed to be rice. Still, output level is 50 to 100 percent more than rice but not beyond that. Table 3.5.1. Productivity, equity and water supply indicators (aggregate) for four irrigation systems. Indicators Unit NSLC KDS Halali Harsi Irrigation Intensity Ratio 1:0.82 1:0.92 1:0.63 1:0.68 Cropping intensity Ratio 1:0.89 1:1.27 1:1.12 1:0.68 Output per unit command area (GVP) Rs/ha 25749 31283 15846 11341 Total production in command area Rs.millions 774.23 467.66 412.00 499.00 Output per unit of diverted irrigation water Kg/m3 0.419 0.508 Output per unit of consumed water Kg/m3 0.512 0.521 Output per unit of labor Rs/days 122.60 128.55 432.00 212.00 Head-Tail equity ratio in output Ratio 1:1.90 1:1.29 - - Relative water supply (RWS) Ratio 1:1.70 1:1.52 1:0.84 1:1.75 Relative irrigation supply (RIS) Ratio 1:1.22 1:1.02 1:1.78 1:2.64 Water delivery performance Ratio 1:0.7 1:0.83 1:0.56 1:0.38 Overall system efficiency Ratio 1:0.81 1:0.97 1:1.2 1:0.57 Head -Tail Equity Ratio 1:3.00 1:2.68 Skewed Skewed
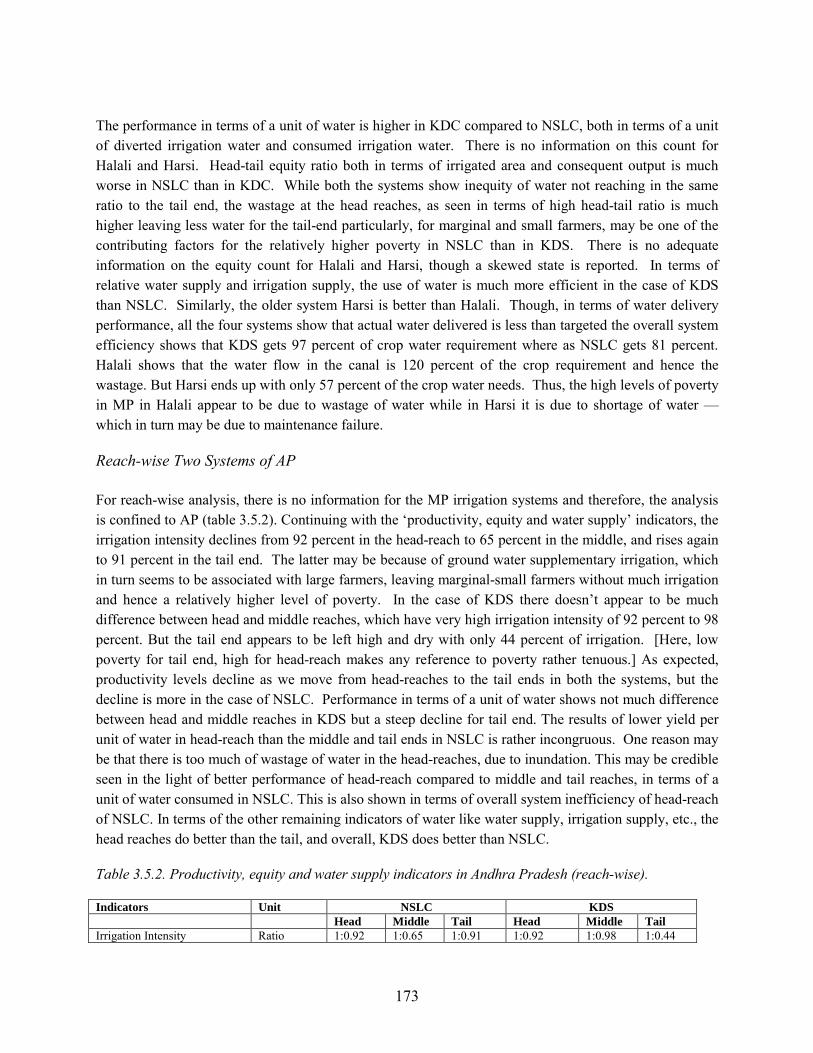
173
The performance in terms of a unit of water is higher in KDC compared to NSLC, both in terms of a unit of diverted irrigation water and consumed irrigation water. There is no information on this count for Halali and Harsi. Head-tail equity ratio both in terms of irrigated area and consequent output is much worse in NSLC than in KDC. While both the systems show inequity of water not reaching in the same ratio to the tail end, the wastage at the head reaches, as seen in terms of high head-tail ratio is much higher leaving less water for the tail-end particularly, for marginal and small farmers, may be one of the contributing factors for the relatively higher poverty in NSLC than in KDS. There is no adequate information on the equity count for Halali and Harsi, though a skewed state is reported. In terms of relative water supply and irrigation supply, the use of water is much more efficient in the case of KDS than NSLC. Similarly, the older system Harsi is better than Halali. Though, in terms of water delivery performance, all the four systems show that actual water delivered is less than targeted the overall system efficiency shows that KDS gets 97 percent of crop water requirement where as NSLC gets 81 percent. Halali shows that the water flow in the canal is 120 percent of the crop requirement and hence the wastage. But Harsi ends up with only 57 percent of the crop water needs. Thus, the high levels of poverty in MP in Halali appear to be due to wastage of water while in Harsi it is due to shortage of water — which in turn may be due to maintenance failure. Reach-wise Two Systems of AP For reach-wise analysis, there is no information for the MP irrigation systems and therefore, the analysis is confined to AP (table 3.5.2). Continuing with the ‘productivity, equity and water supply’ indicators, the irrigation intensity declines from 92 percent in the head-reach to 65 percent in the middle, and rises again to 91 percent in the tail end. The latter may be because of ground water supplementary irrigation, which in turn seems to be associated with large farmers, leaving marginal-small farmers without much irrigation and hence a relatively higher level of poverty. In the case of KDS there doesn’t appear to be much difference between head and middle reaches, which have very high irrigation intensity of 92 percent to 98 percent. But the tail end appears to be left high and dry with only 44 percent of irrigation. [Here, low poverty for tail end, high for head-reach makes any reference to poverty rather tenuous.] As expected, productivity levels decline as we move from head-reaches to the tail ends in both the systems, but the decline is more in the case of NSLC. Performance in terms of a unit of water shows not much difference between head and middle reaches in KDS but a steep decline for tail end. The results of lower yield per unit of water in head-reach than the middle and tail ends in NSLC is rather incongruous. One reason may be that there is too much of wastage of water in the head-reaches, due to inundation. This may be credible seen in the light of better performance of head-reach compared to middle and tail reaches, in terms of a unit of water consumed in NSLC. This is also shown in terms of overall system inefficiency of head-reach of NSLC. In terms of the other remaining indicators of water like water supply, irrigation supply, etc., the head reaches do better than the tail, and overall, KDS does better than NSLC. Table 3.5.2. Productivity, equity and water supply indicators in Andhra Pradesh (reach-wise).
Indicators Unit NSLC KDS Head Middle Tail Head Middle Tail Irrigation Intensity Ratio 1:0.92 1:0.65 1:0.91 1:0.92 1:0.98 1:0.44
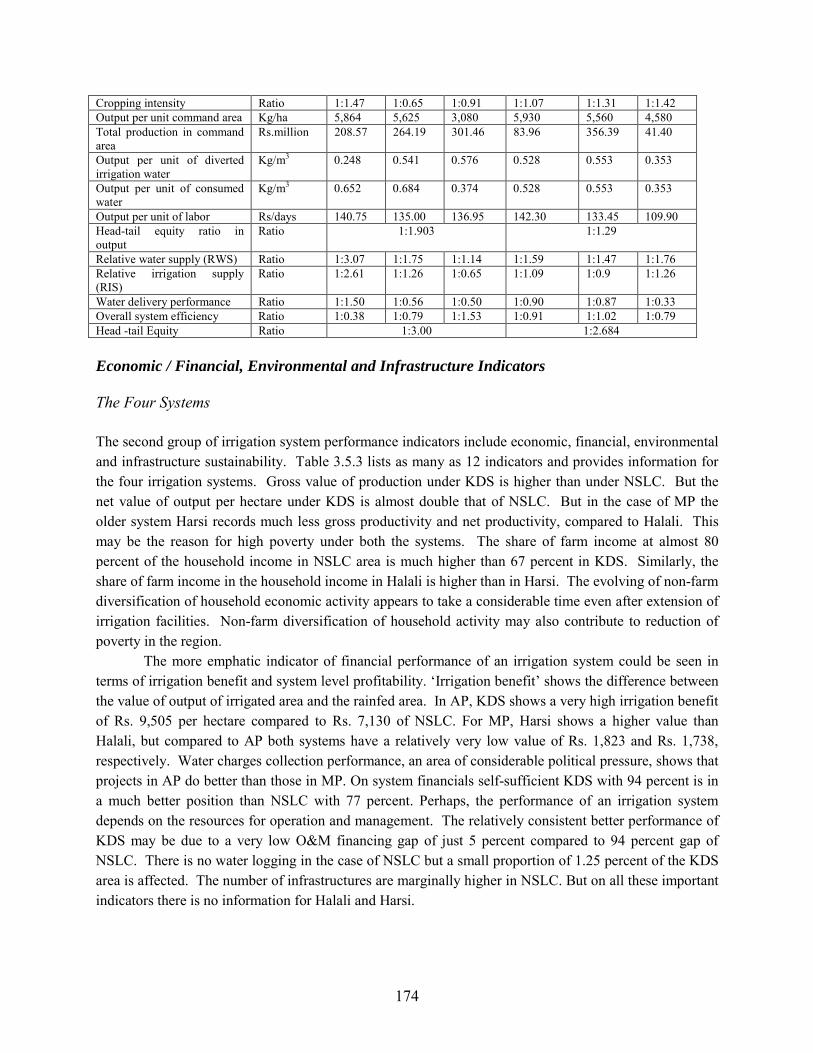
174
Cropping intensity Ratio 1:1.47 1:0.65 1:0.91 1:1.07 1:1.31 1:1.42 Output per unit command area Kg/ha 5,864 5,625 3,080 5,930 5,560 4,580 Total production in command area
Rs.million 208.57 264.19 301.46 83.96 356.39 41.40
Output per unit of diverted irrigation water
Kg/m3 0.248 0.541 0.576 0.528 0.553 0.353
Output per unit of consumed water
Kg/m3 0.652 0.684 0.374 0.528 0.553 0.353
Output per unit of labor Rs/days 140.75 135.00 136.95 142.30 133.45 109.90 Head-tail equity ratio in output
Ratio 1:1.903 1:1.29
Relative water supply (RWS) Ratio 1:3.07 1:1.75 1:1.14 1:1.59 1:1.47 1:1.76 Relative irrigation supply (RIS)
Ratio 1:2.61 1:1.26 1:0.65 1:1.09 1:0.9 1:1.26
Water delivery performance Ratio 1:1.50 1:0.56 1:0.50 1:0.90 1:0.87 1:0.33 Overall system efficiency Ratio 1:0.38 1:0.79 1:1.53 1:0.91 1:1.02 1:0.79 Head -tail Equity Ratio 1:3.00 1:2.684 Economic / Financial, Environmental and Infrastructure Indicators The Four Systems The second group of irrigation system performance indicators include economic, financial, environmental and infrastructure sustainability. Table 3.5.3 lists as many as 12 indicators and provides information for the four irrigation systems. Gross value of production under KDS is higher than under NSLC. But the net value of output per hectare under KDS is almost double that of NSLC. But in the case of MP the older system Harsi records much less gross productivity and net productivity, compared to Halali. This may be the reason for high poverty under both the systems. The share of farm income at almost 80 percent of the household income in NSLC area is much higher than 67 percent in KDS. Similarly, the share of farm income in the household income in Halali is higher than in Harsi. The evolving of non-farm diversification of household economic activity appears to take a considerable time even after extension of irrigation facilities. Non-farm diversification of household activity may also contribute to reduction of poverty in the region.
The more emphatic indicator of financial performance of an irrigation system could be seen in terms of irrigation benefit and system level profitability. ‘Irrigation benefit’ shows the difference between the value of output of irrigated area and the rainfed area. In AP, KDS shows a very high irrigation benefit of Rs. 9,505 per hectare compared to Rs. 7,130 of NSLC. For MP, Harsi shows a higher value than Halali, but compared to AP both systems have a relatively very low value of Rs. 1,823 and Rs. 1,738, respectively. Water charges collection performance, an area of considerable political pressure, shows that projects in AP do better than those in MP. On system financials self-sufficient KDS with 94 percent is in a much better position than NSLC with 77 percent. Perhaps, the performance of an irrigation system depends on the resources for operation and management. The relatively consistent better performance of KDS may be due to a very low O&M financing gap of just 5 percent compared to 94 percent gap of NSLC. There is no water logging in the case of NSLC but a small proportion of 1.25 percent of the KDS area is affected. The number of infrastructures are marginally higher in NSLC. But on all these important indicators there is no information for Halali and Harsi.

175
Table 3.5.3. Economic/financial, environmental and infrastructure sustainability indicators (aggregate)
for four irrigation systems.
Indicators Unit NSLC KDS Halali Harsi Gross value production Rs./ha 25,749 31,283 15,846 11,340 Net value of production per unit area Rs./ha 8,474 16,725 6,538 6,068 Net value of farm production as percent of total household income
% 79.18 66.97 63.00 54.00
Irrigation benefit per unit area Rs./ha 7,130 9,505 1,738 1,823 System level profitability Ratio 1:7.53 1:10.04 1:1.6 1:2.5 Water charges collection performance % 40-50 30-82 33 21 System financial self-sufficiency Ratio 1:0.77 1:0.94 O&M financing gap Ratio 1:0.94 1:0.05 Percent of command affected by water logging & salinity
% 0 1.25 NA NA
Groundwater depth & % change in depth Mts %
19.81-25.91 -30.79
13.61-18.79 -38.09
6-8 15-20
No. of infrastructures Nos. 406 388 - - No. of control structures per 1000 ha Nos. 12 31 7 2
Reach-wise Two Systems of AP Turning to reach-wise performance in terms of economic and financial indicators, no information is available for MP systems and the analysis is confined to AP. Table 3.5.4 gives reach-wise data for NSLC and KDS for the ‘economic-financial’ indicators. Although productivity in terms of gross value of output per hectare shows that NSLC performance is as good or even better compared to KDS, the emphatic superiority of performance of KDS is seen in terms of net value of output per hectare. This indicates that the costs of cultivation in NSLC are higher than in KDS, which may add to the poverty of marginal-small farmers. In both the systems, however, the net value of output per hectare come down as we move from head-reach to tail end. The contribution of non-farm income to total household income is much less in NSLC than in KDS. Almost half of the household income in the head-reaches of KDS is from non-farm sources. The irrigation benefit, indicating the additional benefit due to switch-over from rainfed to irrigated agriculture, is much higher in KDS, and the usual sliding down in the benefits from head to tail-reach movement is also observed. But the only aberration noticed is in NSLC where there is a jump in the irrigation benefit in the middle-reach and a slide-down again with the tail end. System profitability is higher in NSLC for each of the three reaches, compared to KDS. This appears somewhat counter-intuitive, given the fact that KDS is a well-established diversion system in contrast to the huge storage system of NSLC. The infrastructure on control structures do not show any consistent trend with the reaches in KDS, but in NSLC the control structures decline with head to tail-reach. The ground water levels are in the decline, with the highest decline being in the tail reaches of both the systems, which indicates growing supplementary ground water irrigation in the tail ends. particularly by the large farms. This development has left small-marginal farmers more vulnerable to irrigation failure. On the collection of water charges, financial self sufficiency and O-&M finance gap, only aggregate information is available and on all these counts, as noted earlier, KDS performs better.

176
Table 3.5.4. Economic/financial, environmental and infrastructure sustainability indicators – in Andhra Pradesh (reach-wise)
Indicators Unit NSLC KDS Head Middle Tail Head Middle Tail Gross value production Rs/ha 35185 33750 18480 30969 33867 24780 Net value of production per unit area Rs/ha 15861 13750 5980 19330 17610 13230 Net value of farm production as percent of total household income
% 76.74 86.99 79.08 53.16 83.54 70.46
Irrigation benefit per unit area Rs/ha 4,517 12,406 4,636 12,110 10,390 6,010 System-level profitability Ratio 1:14.96 1:13.11 1:4.90 1:12.80 1:10.98 1:6.35 Water charges collection performance
% 40-50 30-82
System financial self- sufficiency Ratio 1:0.77 1:0.94 O&M financing gap Ratio 1:0.94 1:0.05 Percent of command affected by water logging & salinity
% 0 1.25 2.5 - - -
Ground water depth & % change in depth
Mts %
15-21 -39.99
22-25 -13.34
21-30 -42.86
12-15 -25.02
15-19 -29.99
13-21 -59.06
No. of infrastructures Nos. 99 157 150 149 188 51 No. of control structures per 1000 ha Nos. 25 13 8 59 21 47 Institutional, Organizational and Management Indicators The Four systems and Reach-wise systems in AP Table 3.5.5 gives information on some of the indicators relating to O&M and PIM for the four systems. The number of irrigation employers per thousand hectares is the highest (27) in Harsi and lowest in Halali (2). In NSLC and KDS, these numbers are 5 and 8, respectively. But Halali has a top-heavy 14 O&M employees per 1,000 hectares, and even 9 for Harsi is on the highside compared to 4 and 3 for NSLC and KDC, respectively. The PIM in Halali and Harsi appears to be stabilized, whereas NSLC and KDC show a considerable number, particularly, at the secondary and tertiary level Water Users’ Associations.
Table 3.5.5. Institutional/organizational/management effectiveness indicators (aggregate) for four
irrigation systems.
Indicators Unit NSLC KDS Halali Harsi No. of irrigation agency employees per 1000 ha Nos. 5 8 2 27 No. of irrigation agency employees per 1000 ha for O&M
Nos. 4 3 14 9
Users participation Primary Secondary – DCs Teritary - WUAs
Nos. Nos. Nos.
Nil 2 18
Nil 2 6
Nil
Nil
Gender performance indicator Minimum Minimum V.poor V.poor
Table 3.5.6 shows that WUAs at the secondary and tertiary levels are fairly well spread out across all the reaches of these two systems, although the number is higher in the case of NSLC. The impact of these associations on the irrigation access to marginal-small farmers is still to be established.

177
Table 3.5.6. Institutional/organizational/management effectiveness indicators in Andhra Pradesh (reach-wise).
Indicators Unit NSLC KDS Head Middle Tail Head Middle Tail No. of irrigation agency employees per 1000 ha
Nos. 5 8
No. of irrigation agency employees per 1000 ha for O&M
Nos. 4 3
Users participation Primary Secondary – DCs Teritary - WUAs
Nos. Nos. Nos.
Nil 1 6
Nil 1 7
Nil 1 5
Nil 1 1
Nil 1 2
Nil 1 3
Gender performance indicator Minimum Minimum
Two of the hypotheses set for this research are tested under this section. One of the hypothesis
states that the greater the degree of O&M cost recovery, the better the performance. The other states effective implementation of PIM/IMT leads to improved irrigation system performance, which in turn reduces poverty. Since both these are related directly to the management of irrigation systems, they are examined together against irrigation system performance.
The water charges collection performance shows that for the systems in MP, the collection is one-third and less, while that in AP it is over 50 percent. This has reflections on the system’s financial self-sufficiency. Halali and Harsi are low at 10 percent and 7 percent, financial self-sufficiency, respectively. This has widened the O&M financing gap significantly, with as much as over 80 percent in both the systems in MP. In AP, this gap is around 50 percent.
It is to be noted here that in both the states (for that matter in the country as a whole), there is no direct link between irrigation system performance and collection of water charges. In MP, the water charges are collected by the irrigation department and deposited in the state exchequer. The O&M budget is sanctioned at the state level every year, irrespective of the amount recovered. The O&M budget is approved by the state, which has little to do with the amount received from irrigators. In AP, the assessment and collection of water charges is the function of the revenue department. The village clerks and revenue officials assess and collect the water charges. Like in MP the budget sanctions are made annually by the government. With the formation of WUAs in AP the work of assessment of water cess is brought under joint ajmaish (joint supervision) of both the department and WUAs. However, water charges are still being collected by the revenue department and up till the last season the WUAs in AP were neither given this responsibility nor the WUAs relished the idea. The social sensitivities involved in collection and enforcement of water charges by WUAs directly, deter them from taking up this function directly.
The ten-year pattern of collection of water charges by the AP government at state level is presented in (table 3.5.7). Collection details at WUA level are not yet available in AP. As pointed, only from the last season (after the research survey work) it is learnt that the record of collection of water charges is maintained at WUA level. In MP however, this data is available as the government started maintaining records at WUA level soon after the implementation of IMT.

178
Table 3.5.7. Water charges and collection in AP (Rs. million).
Year Demand Collection Collection (%) 1991 – 1992 1458.33 452.41 31.0 1992 – 1993 1364.16 639.08 46.8 1993 – 1994 2097.30 624.20 29.8 1994 – 1995 1880.40 600.40 31.9 1995 – 1996 1734.10 441.70 25.5 1996 – 1997 2451.41 697.99 28.5 1997 – 1998 2912.43 700.70 24.1 1998 – 1999 3370.43 931.63 27.6 1999 – 2000 3607.02 1057.34 29.3 2000 – 2001 2994.61 1185.97 39.6 2001 – 2002 2924.16 586.71 20.1
Source: Draft Water Vision - Volume 2, Mission Support Unit, Water Conservation Mission, GoAP.
The other issue, which is of critical importance, is that at present there is no relationship between the O&M requirement and the water charges levied in both the states. For example, the annual O&M expenditure in Halali and Harsi systems currently are Rs.29 million and Rs.31 million, respectively. Most of this however goes into salaries and overheads. Even if 100 percent of the water charges are collected, it will amount to only about 25 percent of the O&M costs. Moreover, currently only Rs. 50 per hectare is actually spent on the O&M work in the canals. If a more reasonable amount (Rs. 500/ha/year) is spent on O&M, which is as per the engineers’ minimum amount needed, given the current state of the canals, the current revenue from water charges as a proportion to the O&M requirement becomes even more insignificant. In AP, irrigation prices commission as an institutional arrangement has been constituted to review the irrigation charge periodically. Water charges just before the introduction of irrigation management transfer in 1997 were revised upward by a three-fold increase. It is hoped that gradually the charges would meet the required O&M expenditure.
Earlier failures in water management are attributed to water pricing policy by the states in the country. The considerations to keep them low are more due to political reasons rather than the criterion of farmers’ non-affordability. Though it cannot be implemented immediately the water charges could be recovered from the WUAs eventually on a volumetric basis (GoAP 2003).
It is seen that in both MP and AP the systems, which are more efficient in terms of reach (proportion of area irrigated to total area) and timely delivery of water, had better cost recovery rates and also good administration system. Although this could prove the research hypothesis to be true, the causal relationship in fact seems to be reverse, better system performance inducing farmers to pay: since water charges are the same irrespective of the amount of water a farmer gets, farmers who get little water are reluctant to pay the water charges. To improve the performance of the irrigation system involved, initial investment in system operation and maintenance might need to be made to induce farmers to contribute to the costs. Although the issue resembles the discussion of the chicken and the egg, addressing the critical threshold level for cost recovery and system performance will be vital to address system performance issues in a structural way.
The introduction of PIM in both the states (although AP has completed five years) is relatively new, and as such, it is perhaps too early to assess its impact on the irrigation system performance. However, the data gathered from the field does indicate that introduction of PIM did have a positive

179
impact on the irrigation system performance. Data from both the states suggests that after the introduction of PIM water flows faster to the lower reaches and covers an increased area. In AP the initial three years with World Bank funds saw maintenance and repairs undertaken by WUAs, which had a positive impact on water flowing to the lower reaches, further23The time usually taken for a tail ender in KDS to receive water used to be around two to three months for transplantation after the head-end farmers received irrigation. Now, the water is available within one to one and a half months for transplantation after the head-reach farmers.
During 2001-2002 nearly 90 percent of the transplantation was completed in the month of July and the rest was completed in the first week of August. In the year under reference there was no change in the cropping pattern but the perception of WUA office bearers and also farmers was that the improved drainage and timely irrigation helped improve the production as follows (table 3.5.8).
Table 3.5.8. Crop productivity before and after PIM – Andhra Pradesh (crop productivity – Kg per ha).
Crop Prior to the PIM
(1997-1998) After the PIM (2000-2001)
Remarks
Paddy 4631.25 5557.5 +926.25 (early transplantation) Sugarcane 111150 123500 +2470 (assured water supply) Maize 6300 7410 +1235 (reliable water supplies)
The following (table 3.5.9) shows the qualitative assessment of the impact of PIM in different irrigation systems. Table 3.5.9. Assessment of impact of PIM. Halali Harsi NSLC KDS Awareness of WUA among farmers
40% 40% 60% 70%
O&M works a) Spread b) Quality c) Costs
More extensive Better NA
More extensive Better NA
More extensive Better Less
More extensive Better Less
Water charges collection Marginal improvement
Marginal improvement
Marginal improvement
Marginal improvement
Presidents elected Mostly large landholders (LL)
Mostly large landholders (LL)
Mostly large landholders (LL)
Mostly large landholders (LL)
Area under irrigation Improved Improved Improved Improved Water delivery to lower reaches Reduced time Reduced time Reduced time Reduced time Availability of required number of waterings
NA NA Adequate Adequate
Participation of farmers in selection and execution of O&M works.
Fair Fair Good Good
In MP, farmers have strategically elected large and powerful farmers as presidents from tail end reaches to ensure that water reaches the tail end. In MP, the choice of generally large and influential people as presidents was driven by the desire of farmers to have someone strong enough to negotiate with 23 World Bank assistance provided an amount of Rs.1,336 per ha to support the program from 1977 to 2000. From February 2001, 50% share of water tax collected is made available from the government for farmers’ organizations
180
the irrigation agency and the outside world. Further, such people are believed to have the capacity to spend money for organizing meetings, receiving outside people and also making travels to represent farmers’ concerns to the authorities.
The other critical thing on which farmers were more or less unanimous was the improved quality of O&M works and their cost-effectiveness. Farmers broadly agreed that the selection and execution of physical work has been much better under the WUAs. Data from PRA exercises suggests that in both selection and execution of works, there has been a good amount of participation among farmers, which was totally missing before PIM was introduced. Unlike in AP, the relationships between the farmers and irrigation officials is not very cordial. Though the signs of improvement are clearly perceptible in relations between officials of the irrigation department and WUA presidents, the control of the irrigation agency is still strong. Without proper sanctioning of the competent authority (an engineer from irrigation department) no physical work can be undertaken. Thus, the relationship between the WUA and the irrigation official becomes critical. In Harsi system for instance, due to lack of good relationship between a number of WUA presidents and irrigation engineers, more than 50 percent of the sanctioned budget for the year 2001-2002 remains unspent. Conclusions Of the four irrigation systems, as shown earlier, the two older systems KDS in AP and Harsi in MP are with a more stabilized ayacut and a longer period over which the farming communities have gained more experience in adjusting to the irrigated agriculture. The expectation is that poverty in these command areas is likely to be less than the relatively recent command areas like NSLC in AP and Halali in MP. But there is also a possibility that if the irrigation system is not efficiently maintained because of neglect or lack of resources and other institutional deficiencies, a result of which is the instability in irrigation supply and higher risk for marginal and small farmers, poverty may still persist at higher levels. The overall picture that emerges from the two older systems shows that KDS in AP reflects positive features of longer experience, while Harsi in MP appears to have experienced more neglect and decay due to inadequate resource mobilization for O&M. A detailed examination of these four systems in terms of certain irrigation performance indicators is done here to assess the impact of irrigation in mitigating poverty under the four irrigation systems. Cost recovery, so far, was not directly linked to O&M of the systems yet, it clearly shows that better maintenance of systems leads to a better collection of fees. The initial impact of IMT has shown encouraging results. Further research in this area is availed as the introduction of IMT is of recent times and institutional development is a slow process.

181
3.6. ANALYSIS OF WATER MANAGEMENT INSTITUTIONS: IMPLICATIONS FOR THE POOR
Irrigation-related Institutions and Water Rights at Operational Level
The focus of this section is to develop an understanding of existing irrigation-related institutions (both formal and informal) in operation, their linkages, strengths and weaknesses, implementation effectiveness and their impact on the poor. Special emphasis is made on understanding the constraints and opportunities of these institutions in order to identify the type of interventions that will make them sensitive to the needs of the poor.
Historically, the degree of devolution of government’s role shaped the evolution and development of specific institutions in relation to water resources. In contrast to many other countries in the West and Asia, the government in India seems to have played a prominent and direct role in planning, construction and allocation of irrigation water from major and medium irrigation sources. The choice of such projects and the approach of government was determined by several factors – agro-climate conditions as well as technology of water control available and several socio-economic factors available at those points of time – all in the backdrop of the compelling need to increase agricultural production. Planning, construction and allocation of water has been in the domain of state governments and the union according to the provisions of the constitution. Elaborate network of organizations and institutions were provided because of total intervention of the state in the construction of physical works like dams, canals, field channels and structures. Management of operations for water deliveries and maintenance of the systems has been all along with the government (Vaidyanathan 99).
A paradigm shift occurred after the initiation of irrigation sector reforms in the country where PIM and IMT have become integral parts of these reforms. Having created an elaborate infrastructure ever since independence, the issue of rehabilitation of the systems now figure prominently along with the required O&M in many states including AP and MP. There have been no special pro-poor programs in irrigated areas. However, measures like rotational water distribution at the field level (Warabandi), canal rotations at the system level and restricting water intensive crops at certain places (localization), were introduced to help the poor in getting adequate irrigation to their fields. These measures were met with varying degrees of success. Except in north Indian states, Warabandi could not be implemented successfully. The reason was that identification of land ownership for water allocation timings and turns posed a big problem and warabandi was viewed more as an administrative solution in its implementation, than as a solution carrying social importance. In south Indian systems, the prescribed localization method whereby water intensive crops are restricted between upper reaches and lower reaches could not be implemented at any point of time. The implementation of PIM/IMT is now seen as a new institutional mechanism to bring equity in water distribution, better cost recovery and O&M in the irrigated areas. This has provided the key institutional interventions, norms and procedures in the management and operation of irrigation systems at the field level, project level and also state level. Institutions related to inter-state sharing of rivers, decisions on construction of new projects and all other technical aspects involving a high order of technical competence are retained under the control of central and state governments, as the case may be.

182
Water Allocation
At the project level for allocation of water, the operation plan based on its entitlement, agro, soil, characteristics and cropping pattern will be prepared by the competent authority and has to be approved by the project-level committee, according to the provisions of the new enactments. However, project-level committees are not formed so far in both the states. Thus, the gap persists between farmers’ organizations and policy-making levels. Though envisaged under the acts, the project committees are either viewed as threatening to the power structures both in politics as well as bureaucracy, or cannot handle the complex task of management at that level. In KDS in AP, where the political awareness is higher, WUA presidents formed a federation-like organization – an association of the presidents and handled issues of WUA and appointed a president and vice president to negotiate with the government for water allocations and other policy interactions. This informal body was successful in conducting meetings with DC presidents ranging from money payments to WUAs by the government, maintenance works including rehabilitation of the Krishna river barrage, water planning at the project level, to demanding the formation of project-level committee for farmers’ organizations. The federation is an informal organization networking with different actors within the project and outside. For the farmers and officials in the delta it was immaterial whether the association was constituted as per the letter of law or not. In early 2002, the federation co-sponsored an all India meeting of WUAs in Vijayawada and successfully negotiated with DC presidents of lower reaches of a branch canal, and adjusted the then experienced water deficit in the adjacent Godavari System by augmenting supplies from a branch canal of the tail-end of the Krishna system. This involved not only the acceptance from tail-end farmers of the Krishna system but also the irrigation officials of the two different irrigation projects (Sivamohan, Scott 2002).
Water distribution from a distributary level is now brought under the purview of farmers’ organizations. However, the distribution schedules follow the old institutional approaches. The competent authority, an irrigation official from the government, at the DC level prepares the schedule depending on the releases from reservoirs into the canals in the particular year. The acts provide for information dissemination widely to farmers regarding the supply position at different branch (minor) canal off-takes, well before the beginning of the season. The opening and closure of the canals is expected to be intimated well in advance so that WUAs will prepare for their farming activities. The operation of branch canals and distributaries is continuous in both AP and MP. In the rabi season they are rotated in AP. Elaborate rules have been formed in the Acts this regard under the headings “operation plan and water budgeting” and ‘water regulation’. However, there is no evidence in the field indicating the adoption of these rules. As the entire exercise requires a certain level of technical knowledge, the designated competent authority along with the assistance of the irrigation department has to prepare water budgeting for farmers’ organizations and advise and assist on water regulation based on water supplies and seasonal conditions. It is anticipated that simultaneously the capacities of the WUAs are also built in this regard. It is not sufficient conducting training programs alone, but the irrigation officials also have to work with the WUAs to provide them hands-on guidance.
It is observed that the training programs conducted in AP are in the nature of repeat lectures. None of the field-level officials have experience with management at field level.

183
It is seen in all the irrigation systems studied, nearly 90 percent of the WUAs do not have any operation plan or even records in relation to water supplies. In the absence of required data and records, it is hard for any one to plan and improve the working of a system.
Water distribution is affected by the poor condition of the state of canals, distributaries and minors of the irrigation systems. The drainage canals were not maintained for years before. In KDS, the initial work of the DCs on drainage canals (weed removal, desilting bunds, repair, etc.) for the three initial years was undertaken with World Bank assistance. Minor repairs on water channels and structures were undertaken by WUAs simultaneously, spreading extensively in the entire project. This has vastly improved water deliveries in the canals. Such works were not taken up by WUAs in MP in a concerted manner and the condition of canals is bad at several places of the irrigation network.
For the distribution of water from the outlet to individual farms, the WUAs are given the responsibility of developing the rotational water supply (Warabandi) schedules and implementing them to ensure equity. The field observations as well as discussions with the farmers in all the irrigations systems show the following: 1. The head-end farmers take the water first and only when their requirement is complete do the
farmers below get the water. 2. The irrigation is by field to field in all the irrigation systems. By practicing ‘warm and cold’
irrigation - a term used for this practice in MP - a good amount of water is wasted as it flows to the drains from the fields at the beginning of the agricultural season. Apart from the principle of first-farmer-first, the influence or the power of farmer also often determines the priorities in irrigation intake. There are some instances reported in MP (especially when water is scarce) that large farmerstake water first. However, in old systems like KDS, the practices are clearly standardized, size of landholding or influence of a particular farmer makes little difference.
3. The crop varieties chosen by almost all farmers in AP are high-yielding varieties of paddy (HYV), and there is no variation in the number of watering required from field to field. In MP, the head -end farmers grow HYV wheat varieties locally called the Mexican varieties, that require five waterings in the Halali project, whereas the tail ends usually grow local varieties of wheat and gram which require only one to two waterings. Scarcity of water prompts them to choose crops like gram, jower, and pulses. etc.
4. Some sort of dependency relationship exists for the small farmer with the large farmers in the villages. In MP, the small farmers and their family members work on the agricultural fields of the large farmers who provide subsistence wages or small parts of latters’ land for cultivation. In such situations, the large farmer helps the small farmer in getting irrigation not as a matter of right but as a favor. The concept of sharing of available water is not internalized by the farmers.
5. In MP, among villages which are homogenous (landholding-wise) there is greater equity in the sharing of water.
In water allocation as Mollinga24 (2002) observes, at all these levels the emphasis is on bureaucratic allocation (legal and administrative decision reserving X,Y, and Z qualities of water for different sub- 24 Peter P. Mollinga (2002), Power in Motion: A Critical assessment of Canal Irrigation Reform in India. In Hooja, G. Pangare, and KV Raju :Users in Water Management, Rawat Publications, New Delhi.

184
systems and sectors). Allocation does not straight forwardly translate into distribution, and allocation mechanisms have given very little protection to tail-enders”. And allocations do not conform to the designed quantities. As the rotational scheduling like Warabandi is not practiced in AP there are no codified procedures for managing drought hence, there is no predictability of supplies and equitable distribution to each outlet.
From the foregoing discussion it can be seen that some of the water allocation institutions addressed to the advantage and betterment of tail enders and poor, though are in place, are not implemented due to a variety of reasons—not only because of gross inequity by the head-end farmers but also because of cropping pattern, the nature of very perpetuated large systems and several technical reasons involved. Conflict Resolution The results of the study shows that in the old stabilized irrigation systems a better and accepted water distribution pattern and in-built equity seems to exist. In KDS as well as the Halali systems the intervention of some DC leaders facilitated solving (by negotiations) head and tail-end water distribution issues. This is mainly by instilling mutual cooperation and agreement by the contending parties in sharing water. This is not the case always. The WUA leaders in all the irrigation systems opined that on an average there was a reduction in disputes (mainly related to water distribution to the fields) to an extent of 15 percent only. Many of the small farmers felt that after the IMT, some forum is now available for redressal, if required. However, the acts have not stipulated any appellate jurisdiction in the framework of farmers’ organizations. The DGs cannot intervene as appellate authorities for the unresolved disputes and conflicts. Water Rights The relevance of water rights in canal irrigation is well appreciated not only by the researchers but also the farmers. But, there is hardly any right to deal with real situations in the canal irrigation sector. The difficulty comes in changing the legal provisions based on historical developments and values, and also any attempts in that direction calls for a whole hog change of laws uniformly in all the states confirming to legal principles. Further, it is not sufficient to attempt a change in one sector, namely irrigation, and in one sphere, but it has to be attempted in a host of sectors and spheres. This has become difficult in the socio-political context of India. All the irrigation acts reiterate the nature of state’s rights over the natural water. Arbitrary control by state though is not possible, its right to regulate irrigation waters is paramount and sovereign in character; the laws enacted in the states are in the nature of institutionalizing several customary and informal rights developed based on the situations in time and space. The fishing rights, for example, are vested with some sections of the population and even after the formation of the WUA cannot be brought under their purview. However, several of the customary rules thus developed had performed well even in a heterogeneous society of a given power structure and with unequal access to means of production.
The PIM Acts in general, are silent on water rights; starting with the AP legislation handing over some rights to the farmers in the management of irrigation systems, several state governments followed suit. These legislations legalize water as property of land owners only, excluding the landless. The Acts

185
are silent on the issue of individual water rights. It is not clear if the agreement the irrigation department enters with farmers at the beginning of the season constitutes the right of the farmer to water, and whether the irrigation department is bound to provide the agreed amount of water. In practice, however, the agreements are few and water allocation has little to do with it. In farmers’ view the purpose of the agreement is not very clear and its efficacy in ensuring enforcement, rights, and water allocation is questionable.
Farmers believe that the aim of the PIM is to ensure that everybody gets sufficient water. The farmers are not yet home with the issue of conserving water and using water prudently. Those WUA presidents are considered good who use their influence to keep the minors open all the time. Thus, WUA presidents instead of meeting together and deciding on who should get how much water based on available water in the reservoir, try to divert as much water as possible into their own WUA territory. DCs are not yet influential enough to prevail upon the WUA presidents to provide water to the tail-end WUAs. The coordination mechanisms are not yet developed. Moreover, the DCs have no teeth in this matter. They cannot enforce norms or penalize the defaulting WUA president.
The negative contribution of the institutionalized caste system in Indian society is well-known. While its influence prevails in all activities, irrigation is gradually coming out of its grip. This is not to say that its influence is totally disappearing. This is not considered as a big issue as it was thirty years ago. Yet, in some of the pockets along the irrigation network in MP, the big farmers not only over-irrigate at the cost of the downstream poor farmer, but also would not allow water to flow until the farmer’s fields are completely irrigated. Some farmers expressed concern that the old social structure would reinforce itself with the formation of the WUA. In the Halali project, the ST and SC farmers even opposed IMT in its initial stages. The other side of the perception was that the influential local leader can effectively negotiate with government authorities for more water to their fields. For many of the office bearers this is a spring board for political progression. Institutional performance of PIM The effective way of realizing the goals of WUAs mainly depends on their working, the process of sharing information with all the water users and the transparency shown in their activities. One of the key indicators of judging performance of a WUA can be an assessment through the frequency of meetings of general body and managing committee (MC) of the WUA. The guidelines according to the acts are that, the general body shall meet at least twice in a year, once before the rabi season; likewise, at least once in every month the managing committee should meet to take care of mainly day-to-day issues. The meetings of general bodies organized are only 60 percent in both the states in a 4-year-period, though the meetings of the managing committees were more frequent. It is observed from the minutes kept by the WUA and also in the PRA exercises, that the main focus of discussions during the general body meetings was centered around maintenance activities. Issues related to water regulation hardly took 20 percent of time in the general body meetings. Issues related to crop production, financial matters, social audit, etc., consumed only around 10 percent of the time in the meetings. The management committees utilized approximately 45 percent of their time on maintenance with issues of water regulation figures for only approximately 15 percent of the time. This shows that both the general bodies and MCs are focusing their attention on maintenance, rather than water regulation and improving water use efficiency and productivity.

186
The other indicators though could not be quantified are reflected in the PRA exercises. None of
the WUAs could generate additional funds from the water users than the funds given by the government, except in KDS. The tail-end villages (WUAs) and some DCs were said to have collected money to supplement government allocations for the clearing of drains in the early phases of IMT implementation. Though empowered, no WUA has taken penal actions against erring and defaulting members. It is already pointed out that activities like allocation plans, water budgeting and efforts to use water efficiently and equitably were totally missing in the functions of the WUAs. It is also opined that some of the WUA presidents and DC presidents are operating more like contractors, forming an unholy nexus with irrigation officials
Clearly defined water allocation and distribution procedures give rise to the need for developing water rights (formal or informal). Lack of such institutional arrangements and flow of transparent information regarding their rights affect the efficiency in water management. More so, the poor are adversely affected in such a situation than the non-poor farmers. Decision-making and Viability Though the information regarding the existence of the WUAs spread to the members incrementally in the four years of functioning of PIM in AP, information regarding WUAs management is still not available to the members. In MP, though the awareness spread quickly regarding the constitution of WUAs among members, the ambit of WUA and its functions are not clear to them. The Acts do not provide for reservation of poor farmers and women representatives on the management bodies (MC). High caste domination is shown among MCs of WUAs both in AP and MP. Further, the representation of poor farmers is marginal in both states. This reinforces the observation of earlier studies (Barbara Van Koppen et al. 2002, Jasveen Jairath 2001)25 that the small and marginal farmers are by and large excluded from decision-making and the opportunity of negotiations with the leaders. The consensus candidates were encouraged by the AP Government by providing financial incentives to the respective WUAs choosing them. Promoting contest through elections is more rewarding as a democratic process and also the context of devolving powers at grass-root level. The poor farmers will have a chance to exercise their franchise through the ballot box. The WUAs become viable in the long run if these and other such issues are attended to.26 Positive contribution of P&M The minor repairs undertaken by WUAs in both the states and also the drainage works in KDS no doubt have resulted in availability of more water to the tail ends which in itself is a pro-poor contribution. In KDS, the WUAs are convinced that less irrigation water to paddy fields give more production. Last year’s drought and the effects of the leaders of farmers in convincing the farmers showed that even less number of waterings to the rice fields (about 4) can yield better outputs. The growing awareness or belief
25 Barbara Van Koppen, R. Parthasarathy and Constantina Safillow (2002):Poverty Dimension of Irrigation management Transfer in Large Scale Canal Irrigation in Andhra Pradesh and Gujarat, India, IWMI, Colombo; 26 Javeen Jairath (2001):Water Users Associations in Andhra Pradesh - Initial Feedback. CESS, Hyderabad.

187
among farmers would also certainly help improve water deliveries to the tail ends giving rise to the evolution of new institutions. Successful learning experiences of farmers spread the message faster than the usual extension methods.
Small farmers mostly rely on canal water which is less costly compared to other sources, for their agricultural production. The O&M works undertaken after the implementation of PIM generally benefited small land holders than the large farmers by creating more opportunities for agricultural wage earning. Gradually, when more representations on MCs for small farmers materialize, in the long run PIM is certainly likely to benefit the poor more than the rich. Towards Pro-poor Strategic Interventions in Irrigated Agriculture in India The analysis made in this report throws up some common and divergent scenarios for initiating strategic interventions at different levels with a pro-poor slant. Ever since the planned effort, the government of India and the state governments have been carving out several interventions from time to time with an aim to alleviate poverty in rural areas. The area development programs, several employment generation programs and those aimed at target population along with subsidized food gain distribution, education and health improvement programs – all have contributed effectively to the reduction in rural poverty. Though it took twenty years initially after the planning, rural poverty has been coming down impressively. Yet, the absolute poverty and the phenomenon of poverty in plenty still haunts the Indian scene.
Special pro-poor programs or interventions by far, are few in irrigated areas. One of the reasons for this may be the policy makers’ long-held belief that increased agricultural production in irrigated commands would automatically decrease poverty in those areas. Among the irrigation projects studied, KDS in AP in the oldest commissioned in 1852 followed by the Harsi in 1935, NSLC in 1968 and Halali in 1978. These projects show varying degrees of irrigation performance and implications for poverty. While the older systems like KDS show more deterioration, the others are also showing signs of considerable decay in the physical infrastructure.

188
3.7. SUMMARY AND CONCLUSIONS Income poverty is taken into account in this report to facilitate six country comparisons, eventually. However, expenditure poverty is also analyzed for a comparison as the official poverty figures in India are based on expenditure.
Households in irrigated areas in general, show a striking contrast to those located in non-irrigated areas. The poverty in the rain-fed villages outside the NSLC is twice the ratio. While the contribution of canal irrigation can be clearly seen in all the systems studied, the extent of non-farm income, land holding size and ground water use obliviate poverty levels to an extent in rain-fed areas. The main impact of irrigation on household income is through increased agricultural productivity, longer periods of employment with higher wages, higher cropping intensity and choice of high value food crops (HYV) as against the traditional varieties in rainfed areas. Though poverty is all-pervasive to some of the households namely, marginal-small and landless categories, the poorest of the poor are found in non-irrigated areas. Thus, the study confirms to the findings of numerous research studies conducted earlier.
Poverty in canal-irrigated areas is one of the crucial issues the report dealt with. The characteristics of the poor households in AP and MP are different. In AP, though landless households prominently figure among the poor, surprisingly, the poorest among the poor are those with some land. Both in NSLC and KDS, non-farm income constitutes a considerable share in income. Landless households spend all their time in wage earning whereas households with land spend only part of their time on off-farm employment. In MP, not many options exist for off-farm employment like in AP, and the landless households who are mostly poor are poorest too. The contribution of agricultural labor is also significant in the income for the landless households. In the Harsi system which is double-cropped, the average per capita income of the poor landless is 35 percent more than in Halali, and the income between landless-poor and landed non-poor is much less compared to Halali. The other socio-economic features of the poor and non-poor households can be captured by the type of their dwelling places, education of the head of the household and number of members constituting the household. Kutcha houses (not firm, thatched, mudwall and roofs) are more in villages with no access to water and the pucca (concrete/tiled) houses are more in irrigated areas. Further, in areas of established irrigation projects like KDS and also with the non-poor landed households (in all the irrigation systems), pucca houses are of common sight. The average household size is 4 in KDS, 5 in NSLC, and 7 in MP. However, the number of members in poor landless households is comparatively higher. Difference in education levels of the heads of households is marginal. The heads of landless households however, spent one or two years less in schools in MP than their counter parts in AP.
Poverty in NSLC seems to be linked to the accessibility of water. Of the non-poor households 66 percent received water during the Kharif, whereas the 30 percent of poor households obtained irrigation during the season. As a result, the cultivated area of poor is less than one-third cultivated by the non-poor and also, the net present value produced is lower in KDS. The poor as well as non-poor received water in Kharif(poor households more, than non-poor households) and the income is similar in both the categories. The productivity of non-poor households in KDS is three times more to that of poor households. In Halali, the difference in average household income between the poor and non-poor is over 7 times and in Harsi it is 4.8 times. The difference is due to the double crop and consequent generation of more employment opportunities in Harsi. Looking at access to irrigation we find considerable differences among the poor and non-poor. In Halali, 45 percent of the poor households received irrigation, 72 percent

189
of the non-poor obtained irrigation in Rabi. In Harsi, the difference between the poor and non-poor in accessibility for irrigation ranges from 20 percent to 50 percent in Rabi, and between 35 percent and 60 percent in Kharif. In the Halali command area, ground water is not used, whereas, in all the other three systems ground water is used conjunctively, to an extent. More ground water usage is seen in Harsi (36% of households in head reach, 14% in the middle and 32% at the tail-end). Only 10-15 percent of households use ground water in AP at head and middle reaches.
It is clearly seen that villages located in parts of the canal system with sufficient access to irrigation are less poor compared to others. Thus, poverty in tail-end-reaches is more compared to the middle reaches of the canals because of lack of availability of water.
An important determinant influencing poverty in irrigated agriculture is the landholding size. Historically, measures like zamindari (intermediate tenant between state and farmer) abolition, land-ceiling legislations, and various tenancy acts have in several states redistributed land resources. In fact, the first signs of poverty reduction were seen during those times. The disparity in land holdings however is not wide now as it used to be at one time in AP or MP. However, several benani (factious) holdings, partitions on paper and other methods circumvent the law. Even the reported landholding pattern shows differences between the poor and non-poor households. In Halali whereas an average poor household landholding is 1.3 hectares for the non-poor it is 6.4 hectares. In other systems the non-poor approximately own double the size of average landholding ranging from 1.38 hectares to 2.85 hectares.
The average size of the landholding increases in all the systems from head to tail ends of the canals, along with the percentage of the landless also generally increasing more in water-scarce systems like NSLC and Halali. This may point to the natural settlement pattern of the poor moving to less- productive and water-scarce reaches. The incomes, however, cannot be explained by landholding size alone. The marginal farmers in water-abundant systems like KDS and Harsi are better off compared to those in water-deficit systems. In water-deficit systems like NSLC, the percentage of lands left uncultivated is more to the percentage of land under a second crop.
Land productivity and crop choices have a bearing on poverty. In both the states in reaches where water is abundantly available all farmers irrespective of land holding size cultivate water-intensive crops. In AP, rice (HYV), is grown during Kharif and minor crops like black gram, groundnut pulses are grown in Rabi. In NSLC, rice crop is preferred in Rabi, also wherever water is available and is supplemented by ground water. In MP, high-yielding wheat (called Mexican variety) is grown in Rabi to an extent of 65-70 percent in both head and middle reaches of Halali. In Harsi, paddy is the main crop (ranging from 90% to 60%) in head and middle reaches. While the tail ends in Halali grew local varieties of wheat, in Harsi, jowar and maize are grown. High value (HYV) crops in both the states yield high monetary returns to the farmers though farm-input costs are also correspondingly high. This once again shows that poor farmers have to contend with local varieties and coarse grains, mainly due to lack of adequate irrigation to their fields. In MP, small farmers are also constrained to use available land in an optimal way, as access to adequate credit and other inputs is lacking. The crop choices of farmers thus fall on crops requiring less expensive inputs.
An important aspect which affects both the poor and marginal farmers in all the projects is the quality of water supply. The unreliable and delayed availability of water for crops adversely affect the output. While large farmers can look for an alternate source of irrigation, small and marginal farmers solely depend on canal water. Until the formation of WUAs minor repairs were undertaken by them and water used to reach the tail-end of the main canals in the KDS system after 2 to 3 months of time, after
190
the release at the head-ends; though the time duration varied from project to project, all the tail-ends in the irrigation canals experience delays and short supplies.
Levy and collection of sufficient water fees from the users is another crucial and long neglected issue in Indian irrigation systems. The supply-side nature of canal irrigation with heavy subsides in all agricultural inputs including water for increased food grains production, deteriorated government revenue collections even for undertaking O&M activities in the irrigation projects. The Vaidyanathan Committee appointed by the Planning Commission in 1992 examined the issue and while endorsing the commonly-held view that the revision in water pricing should cover the O&M costs and a modest amount of the capital costs incurred, it held the view that water pricing should in the long run aim at covering all the recurring and capital costs fully.
Our findings show that the collection of water charges in MP is 33 percent in Halali and 21 percent in Harsi. The corresponding figurers for KDS in AP is 55 percent. For NSLC figures are not available. This reflects on the system’s poor financial self-sufficiency and wide O&M financing gap based on recovery. However, in both the states (in the country as a whole), there is no direct link between irrigation performance and water fee recoveries. Budget allocations are made at the state levels every year, irrespective of quantum of water fee charged and collected. The collections made by the revenue department (AP) or irrigation agency (MP) go directly to the government’s exchequer general pool. Yet another related aspect to the issue of water fee is lack of relationship between the O&M requirements and the decision of amount of water tax to be collected. For example, the annual O&M expenditure in Halali and Harsi are Rs. 29 and Rs. 31 million, respectively. Most of this however goes into payments of salaries and overheads. Even if 100 percent of present water taxes are collected it would meet only 25 percent of the O&M costs. Political considerations perpetuate the downward levels of pricing. The introduction of PIM envisaged collection for water charges by WUAs. But the WUAs have not yet started this function in both states. However, the work on assessment of water charges under joint ajmaish (joint supervision) of both the irrigation department and WUAs in AP, has been initiated. The complete responsibility of assessment and collection is neither handed over to WUAs nor the WUAs accept them willingly because of the social sensitivities involved in collection and enforcement.
It is well known that if proper institutions are in place it would improve the performance of the irrigation systems and also the lot of poor by many times, than attempting improvements merely in physical systems.
The earlier interventions through CAD programs and irrigation modernization programs were seen as administrative and technical solutions to the problems. A major intervention strategy attempted, starting with AP in 1997 and MP in 1999, was the introduction of PIM and handing over management of irrigation to the farmers’ organizations. This was part of the overall sectoral reforms the country was engaged in. This has brought in a ‘paradigm shift’ in the irrigation sector, introducing new institutional arrangements. The institutions hitherto had been ‘control’ oriented by the government. Water allocation and distribution are worked out at the top and their implementation are worked out at the top and their implementation was in the hands of irrigation agencies of the government. The IMT is expected to bring about changes in several customs, norms and rules hitherto governing irrigation management.
Institutional measures like ‘warabandi’ (rotational water supply method) in north India and localization (restriction of water-intensive crops in designated areas from head to tail end, prohibiting cultivation in some zones etc.) were devised to ensure equity in water distribution in some areas. Laws were also enacted, but their implementation (in MP and AP, respectively) remained difficult.

191
Localization in name of equity tended to introduce inequity of another kind. Warabandi as an administrative measure became target oriented and lost the social importance it was supposed to carry. Other methods like rotation of canals and permission of second crops in the command area, though are successful, could not bring about the expected equity. One of the objectives of IMT is to enable the farmers to evolve equitable distribution practices and their implementation. The WUAs in both the states have not yet addressed these issues of water planning, budgeting and equitable distribution. Their functions during the last 4-5 years have centered around construction and repair activities; and water management is yet to figure as an important activity they have to attend upon. The PIM Acts in general, are silent on ‘water rights’. Though several customary rights have performed well before, the need for evolving water rights still remain. The IMT can be seen as a first step in creating “group water rights”; yet, the landless are out of the purview and poor landholders are not represented in the decision-making bodies like management committees.
The role of caste institutions almost working like “bonded labor” are still operative in some areas in MP. Sharing of irrigation water has to a great extent come out of the clutches of the caste system in AP. While on one side the farmers feared reinforcement of old social structures at the beginning of IMT in MP, the overall feeling of WUAs in AP and in MP in electing rich landlords or coincidentally influential high-caste farmers as presidents was backed by prudence. The farmers opined that such a person would be able to carry weight and can negotiate better with the government and members. Project-level committees in both the states have not yet been formed leaving a wide gap in planning and implementation. The experience of IMT as seen from the empirical data calls for institutional learning and capacity building among all stakeholders backed up by several amendments in the Acts. These and other interventions will be further discussed in the following sections.
Findings of generic importance
The report brings home several findings of generic importance which call for strategic interventions at government/policy (macro), project (meso) and field/operational (micro) levels. While initiating these interventions it should be ensured that all of them are connected and have a logical linkage from policy to operational levels. These interventions triggered simultaneously would achieve more than the piece-meal approaches. In the past, the government in its wisdom encouraged macro economic growth, human capital development and also provided safety nets for the poor. At times the trade -ff proved very favorable and also unfavorable. In this wider context the following are some of the findings of generic importance in irrigated agriculture as reflected in the study. 1. Tail reaches of the irrigation canals have low productivity levels causing high poverty incidence.
Head reaches consume more water and the conveyance systems are incapable of delivering water/required water to the tail-ends. The main reasons for this are, a) excess drawls and over-use of water by head-end farmers; b) glaring design and planning deficiencies in the irrigation systems. In NSLC for example, earlier studies showed in the original project, proper estimates of command area and water supply were over-estimated by 36 percent and still the construction of canals is continuing in spite of deficits at the tail-ends. In the same project, it was estimated that in different places of head and middle reaches at least 12mm of water is lost daily on account of deep percolation in paddy

192
fields. The localization specifications are flouted by the users and the changes acquired legitimacy; c) at the time of design of projects there were many lacune like non-availability of sufficient and reliable information, operation of pressure to confirm to the technical and financial criteria of appraisals, and compulsions to include extensive areas in the project. This is an important cause which led to several inconsistencies. In addition to the questions of planning and implementation, the question of equity comes to the fore. The interventions thus needed are policy, economic, financial, legal and institutional-oriented at all levels.
2. The performance of established (old) irrigation projects is better compared to the new projects constructed after independence, showing a ‘stabilization’ effect on the economy of households. In both the older projects, KDS and Harsi, poverty levels are less when compared to the overall poverty of the respective states. The hegemony of castes and landholding sizes is relatively less compared to the other projects in the respective states. There has been a quick adaptation to change (farmers management) and attempts were made to adapt to the new initiatives through required institutional arrangements (formation of federation of water users’ associations, initiatives to prepare water allocation plans and budget, good cooperative functioning of the irrigation department and farmers’ organizations, etc.). In KDS, the initiatives of the DC president to arrange releases of water to the tail-end worked out agreements between head and lower-reach WUAs. Among the old irrigation systems better equity in distribution, higher per hectare output at tail ends, employment of labor for long periods, higher wage rates can be seen. The trend can be explained because of the existence of better institutional development and functioning.
3. Irrigation yields are comparably low in the water-scarce reaches of the projects. This was to an extent due to the crop choice of farmers in the head reaches. In all irrigation areas rice is the preferred crop of the farmer. Absence of water regulation and farmers preference for rice cultivation is also the basis for inequity in sharing water among farmers. Sustained efforts to wean farmers away from rice cultivation are lacking.
4. There is no encouragement for diversification of crop from policy to operational level. The farmer’s preference in the case of rice cultivation to an extent is also conditioned by externalities of rice cultivation itself, in the neighboring ‘field, especially for the downstream farms.’
5. Fixation of water charges and the basis for fixation remained top-down. The collection mechanisms have not changed even after IMT. This is an issue well discussed in India. While in AP the institutional structure has been created to revise water rates periodically, the procedure for fixing and collection are still ambiguous. In the changing scenario after the introduction of IMT the poor service mode remains. There are no clear-cut water delivery schedules, no volumetric devices, no definite water allocation plans prior to the agricultural season. Further, there is no farmer involvement in any of these issues. While fixation of rates is one aspect that can be used effectively in policy development in favor of the poor, collection of water taxes is an ‘important’ issue that calls for attention in view of the misappropriations inherent, and also mounting dues pending from the users. Water tax collection has been very poor in both the states, but better recoveries are evident in systems (KDS) where irrigation performance is better. The issue of water charges is also linked to the question of its viability being related to land and crop.
6. The management change in irrigation sector calls for a great deal of institutional learning and capacity building of the actors involved. The capacity building involves not only training of irrigation officials and farmers but also both of them working together in evolving plans and implementation strategies.
193
The irrigation agency has a major role in providing ‘hands-on’ guidance to the WUA leaders in the management of irrigation. Though the IMT has successfully created farmer collectives and focal officer (competent authority) from the irrigation department, it has not devised institutional mechanisms for capacity building among the different actors. These findings have implications for evolving and developing institutions at operational level with appropriate policy support.
7. Though waterlogging and salinity were not reported in the study area, the degradation of land (non-research resource) is on the increase in irrigated areas in India. Signs of water logging are seen at KDS and Harsi in the head reaches. These externalities have to be addressed both at policy-level and WUA-level.
8. The gender participation in WUA management is meagre in MP and AP. In AP, except for a few elected women representatives, many of them were brought into the management bodies as proxies for their husbands or as a strategy to get financial support from the government. A few women representatives, however, made an excellent imprint on the functioning of the WUAs. This is an issue which has to be addressed at operational level.
9. Farmers’ Participation and IMT: By far, the IMT is the major step which ushered in several institutional changes which in turn showed positive results. Yet, the law is silent on many aspects affecting the poor and the landless. Several other institutions are to be evolved and nurtured by both the farmers and the government before the synergetic effects could be evaluated.

194
Annexure – 1 Nagarjuna Sagar Left Canal Project – Andhra Pradesh.

195
Annexure – 2 Krishna Delta System – Andhra Pradesh.

196
Annexure – 3 Harsi Irrigation System – Madhya Pradesh.
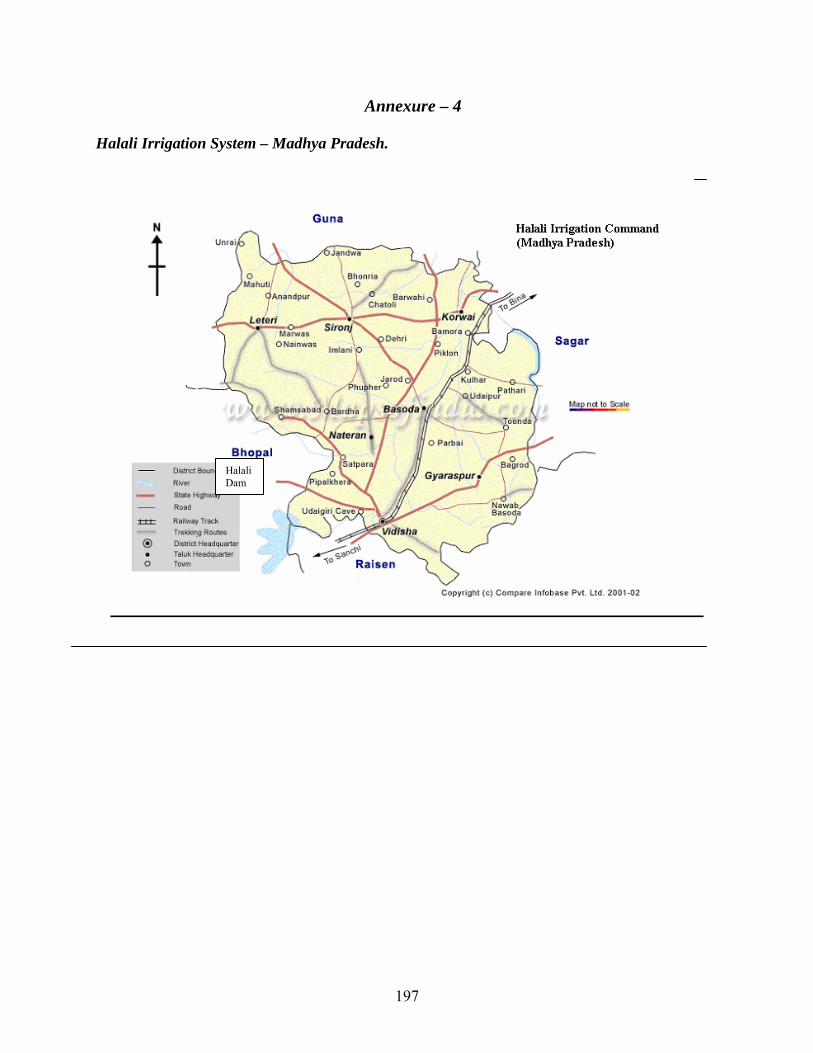
197
Annexure – 4 Halali Irrigation System – Madhya Pradesh.
Halali Dam

198
Annexure – 5
Assessment Performance of the Irrigation System
Net Irrigated Area (NIA) 1. Irrigation Intensity = ----------------------------------------- Designed Command Area (DCA) Gross Cultivated Area (GCA) 2. Cropping Intensity = ----------------------------------------- Designed Command Area (DCA) Total Production (TP) 3. Output per unit of command area = ------------------------- Command Area (CA) 4. Total production in Command Area = Output in command area in value terms for different crops Actual Total Production (ATP) 5. Output per Unit of Diverted Irrigation Water = --------------------------------------- Diverted Irrigation Water (DIW) Actual Total Production (ATP)

199
6. Output per Unit of Consumed Water = --------------------------------------------------- Volume of Water Consumed by ET (WET) Actual Total Production (ATP) 7. Output per Unit of Labor = --------------------------------------------------- Total number of person days in cultivation Average output per unit of area at head reach 8. Head-Tail Equity Ratio in Output = ----------------------------------------------------- Average output per unit of area at tail reach Total Water Supply (TWS= Surface diversion + Ground Water +Rainfall) 9. Relative Water Supply = -------------------------------------------------------------------------- Crop Demand (CD= Potential Crop ET)
Total Irrigation Supply (TIS= Surface diversion + Ground Water) 10. Relative Irrigation Supply = --------------------------------------------------------------------- Irrigation Demand (ID= Crop ET – Effective Rainfall) Canal Capacity to Deliver Water at System Head

200
11. Water Delivery Capacity = --------------------------------------------------------- Peak Consumptive Demand (PCD) (PCD-the peak crop irrigation requirements for a monthly period expressed as a flow rate at the head of the irrigation system) Actual Volume of Water delivered 12. Water Delivery Performance = --------------------------------------------- Targeted Volume of Water delivered
Crop Water Requirement 13. Overall System Efficiency = -------------------------------------- Total inflow into Canal System Average Delivery Performance at Head Reach 14. Head Tail Equity = ------------------------------------------------------ Average Delivery Performance at Tail Reach Gross Value of Farm Production at World Price (SGVP)

201
15. Gross Value of Farm Production = --------------------------------------------------------- Per Unit Area Area 16. Net Value of Farm Production (NVP) Per Unit Area = SGVP – Cash Cost of Production 17. Net Value of Farm Production as Percentage of Total Household Income Net Value of Farm Production
= --------------------------------------- Total Household Income 18. Irrigation Benefit Per Unit of Area = NVP per unit of irrigated area – NVP per unit of rainfed area Irrigation Benefit Per Unit of Area 19. System Level Profitability = ------------------------------------------------- Total Irrigation Expenses per unit of area Actual Total Annual Income from Irrigation Water Charge

202
20. Water Charge Collection Performance = ------------------------------------------------------ Maximum Collectable Irrigation Water Charge Actual Total Annual Income from Irrigation Water Charge 21. System Financial self-sufficiency = ------------------------------------------------------ Actual Total Annual O&M Expenditure Actual Total Annual O&M Expenditure 22. O&M Financing Gap = ------------------------------------------------------------------ Required or Optimum Total Annual O&M Expenditure Income Poverty
}{1
1)(zyizq
inP −
∑
==
αα
Where, n = Total size of population q = Number of poor people below poverty line Z = Poverty line (in rural Andhra Pradesh poverty line = Rs.262.94 per capita per month and in Madhya Pradesh = Rs. 311.34 per capita per month) yi = Income of the people below poverty line α = 0, 1, 2 for Head count Index, Poverty Gap and Squared poverty gap, respectively. ------------------------------------------------------------------------------------------------------------

203
Head Count Index: is defined as the share or proportion of the population, which is poor or whose income is below the specified poverty line. This is a measure of incidence of poverty. Poverty Gap Index: is defined as the mean distance separating the population from the poverty line. This can be interpreted as a measure of depth of poverty. The poverty gap can also be defined as the product of the head count index ration and the income gap ratio. Squared Poverty Gap Index: is a measure of the severity of poverty. The poverty gap takes into account the distance separating the poor from the poverty line, while the squared poverty gap (PG) takes into account the square of the distance. This gives more weight to the poor, by taking into account the inequality among the poor.

204
References Ahluwalia, M.S. (1978). Rural poverty and agricultural performance in India. Journal of Development Studies, Vol.14. Bussolo, M.; and Connor, D.O. (2002). Technology and Poverty: Mapping the connections in Technology and Poverty Reduction in Asia and the Pacific. Development Centre Seminars, OECD. Dandekar, V.M. (1994). The Indian Economy 1947-92 Agriculture. Sage Publications: New Delhi. Datt, G. (1999). Has poverty declined since economic reforms? Statistical data analysis, Economic and Political Weekly, December 11. Gita, Sen. (1999). Endangering poverty alleviation: Challenges and opportunities, Development and Change, Vol 30. Government of Andhra Pradesh, Mission Support Unit, Water Conservation Mission. (2003). Draft Andhra Pradesh Water Vision, GoAP, Hyderabad. Li, H. L.; Squire; and Zon, H.F. (1998). Explaining International and Inter temporal variations in income inequality. The Economic Journal, 108, January. Lipton, M.; and Longhurst, R. (1989). New seeds and Poor people. John Hopkins Univ Press: Baltimore. Narayanamoorthy, A. (2001). Irrigation and rural poverty nexus: A state-wise analysis. Indian Journal of Agricultural Economics, Vol. 36, No.1. Panda, M. (2000). Growth with equity: Policy lessons from experience of India (Reprint). Indira Gandhi Institute of Development Research: Mumbai. Pant, D.K.; and Kakali, Patra. (2001). Rural poverty in the early 1990s. Margin, Vol.33, No 2&3. Radhakrishna, R. (1993). Indian agricultural growth, employment and equity. In Tapas Mazumdar (ed.), Nature Man and Indian economy. Oxford University Press. Rao, V.M. (1996). Agricultural Development with a human face: Experiences and Prospects. Economic & Political Weekly. Ravallion and Datt (1996). How important to India’s poor is the sectoral composition of economic growth? World Bank Economic Review, 10(1). Sastry, S.A.R. (1980). A survey of Literature on poverty, income distribution and development. Artha Vijnana. Volume 22, No.1.