Embed Size (px)
Citation preview

22nd AsiaConstruct Conference /Country Report-India / 2017 P a g e 0 | 61
PREPARED BY
Construction Industry Development Council
(A body established by the Planning Commission (Now Niti Aayog) Govt. of India & Construction Industry)
801, Hemkunt Chambers, 89, Nehru Place, New Delhi - 110 019. India Phone: 011-41617971, 26451766, 26234770; Fax: 011-26451604
Email: [email protected], Website: www.cidc.in
COUNTRY REPORT INDIA
Member Country of

22nd AsiaConstruct Conference /Country Report-India / 2017 P a g e 1 | 61
CONTENTS
1. Preamble
2. Executive Summary
3. Economic Overview
3.1 Main Macroeconomic Indicators
3.2 Economy 2017
4. Comparison of budgetary allocation 11th (2007-12) & 12th Five Year Plan (2012-17)
5. Union Budget 2016-2017 6. Administration and Regulation of Construction Industry
6.1 Structure and Role of Construction Administration
7. Construction Opportunity and Activity Annexures:
A1 Average Construction Material Prices as on 2017
A2 Classification of Contractors
A3
Projected Investment as Percentage of GDP
A4 Salient Changes in Cross border & domestic employment procurement systems.
A5 Executive Summary- Chapter of Construction -12th National Plan
22nd AsiaConstruct Conference /Country Report-India / 2017 P a g e 2 | 61
1. PREAMBLE
Construction Industry Development Council (CIDC) has been jointly established by
the Planning Commission, Government of India and the Indian Construction Industry.
Since its inception in 1996, CIDC has initiated several activities for the benefit of
construction industry. A notable few are:
· Advice the Government on policy formulation related to construction
industry.
· Standardization of construction contracts and procedures.
· Training manpower at skilled worker level and construction management
level.
· Grading of construction entities
· Devise mechanisms for workers' welfare.
· Help evolve policies for financing.
· Dispute Resolution in Construction Contracts.
· Establishing construction equipment bank.
· Computation & publishing Construction Cost Indices
· Interaction and networking with international organizations to promote
emerging technologies and best practices.
2. EXECUTIVE SUMMARY
This report presents the overview of the Indian Economy & the Indian Construction
Industry. Macro economic parameters pertaining to the Indian Economy & the
Construction Industry are also presented. Long term agenda for the Indian
Construction Industry is highlighted through the 11th & 12th Five Year Plans. Further
short term policy issues related to Construction Industry are highlighted through the
Union Budgets. This report also highlights the administration & regulation of the
Indian Construction Industry one of the fastest growing construction industry
internationally. Key areas of construction opportunity are discussed

22nd AsiaConstruct Conference /Country Report-India / 2017 P a g e 3 | 61
3. Economic Overview
The Indian economy has emerged as a bright spot in the world economy, becoming one of the fastest growing large economies in the world. The 7.8 per cent growth in the GDP at constant market prices in 2016-17, according to the advanced estimates of the Central Statistics Office, compares favourably with growth in the previous three years; 7.2 per cent in 2014-15, 6.6 per cent in 2013-14 and 5.6 per cent in 2012-13. It is noteworthy that this growth is estimated to be achieved despite subdued global demand that dampened India's exports significantly, and two consecutive below-normal monsoons that impacted farm output and productivity. GDP Growth
As per the Advanced Estimates released by the Central Statistics Office, the economy is estimated to grow at 7.8 per cent in 2016-17, higher than growth of 7.2 per cent achieved in 2014-15. The growth in agriculture, industry and services is estimated at 1.1 per cent, 7.3 per cent and 9.2 per cent in 2016-17 as opposed to (-) 0.2 per cent, 5.9 per cent and 10.3 per cent respectively in 2014-15. This shows a pick-up in industrial growth, driven by manufacturing which is estimated to grow at 9.5 per cent (in 2016-17), as compared to 5.5 per cent registered in 2014-15. The growth in agriculture remained low on account of second consecutive year of subdued monsoon. GDP growth during April-December 2015 (first 3 quarters) was 7.5 per cent, compared to 7.4 per cent in the same time period in 2014-15. From the demand angle, the growth in private final consumption expenditure at 7.6 per cent in 2015- 16 has been the major driver of growth. The growth of fixed investment improved from 4.9 per cent in 2014- 15 to 5.3 per cent in 2015-16. The exports and imports are both estimated to decline by 6.3 per cent in 2015- 16, the former mainly on account of subdued global demand and the latter largely reflecting the decline in international petroleum prices.
GDP INDIA

22nd AsiaConstruct Conference /Country Report-India / 2017 P a g e 4 | 61
Inflation
v India's consumer prices increased 2.36 percent year-on-year in July 2017, beating
market expectations of 1.87 percent and following a 1.54 percent gain in the previous month. Cost of housing, energy and clothing rose further and food prices fell at a softer pace. Inflation Rate in India averaged 6.90 percent from 2012 until 2017, reaching an all time high of 12.17 percent in November of 2013 and a record low of 1.54 percent in June of 2017.
v The decline in core inflation was largely on account of the decline in the inflation in
housing (rent), transport, communication, education and other services. The headline WPI inflation Foreign Direct Investment
v Foreign Direct Investment into India grew 8 percent & estimated to require about USD 1 trillion during the 12th Five-Year Plan period, to fund infrastructure projects The highest FDI came in services, followed by automobiles, telecommunications, pharmaceuticals and construction development. The FDI inflow was $6.23 Billion (2012-2013), $9.06 Billion (2013-2014), $8.20 Billion (2014-2015) and $1.39 Billion (2016-2017(first two months)
v Singapore led the FDI inflows into India with USD 5.98 billion, followed by Mauritius (USD 4.85 billion), the UK (USD 3.21 billion) and the Netherlands (USD 2.27 billion).
22nd AsiaConstruct Conference /Country Report-India / 2017 P a g e 5 | 61
Foreign Institutional Investment
v The net investments by FIIs into Indian equity markets since the beginning of 2014 have crossed USD 5 billion over Rs 30,000 crore), while the same for debt markets also stands near USD 5 billion (about Rs 29,000 crore)- taking the total to close to Rs 60,000 crore.
v This includes net investments of about Rs 1,500 crore so far in April. This is despite a net outflow of about Rs 7,000 crore from debt markets, as equity markets have seen a net inflow of over Rs 8,500 crore this month till April 25, the latest trading session.
v They invested Rs 20,077 crore in Indian stocks in March, compared with Rs 1,404 crore in February and Rs 714 crore in January.
v The strong inflows in the recent months have taken the cumulative net investments of FIIs into India to close to USD 197 billion, while their investments in rupee terms is a bit away from Rs 10 lakh crore level.
Trade
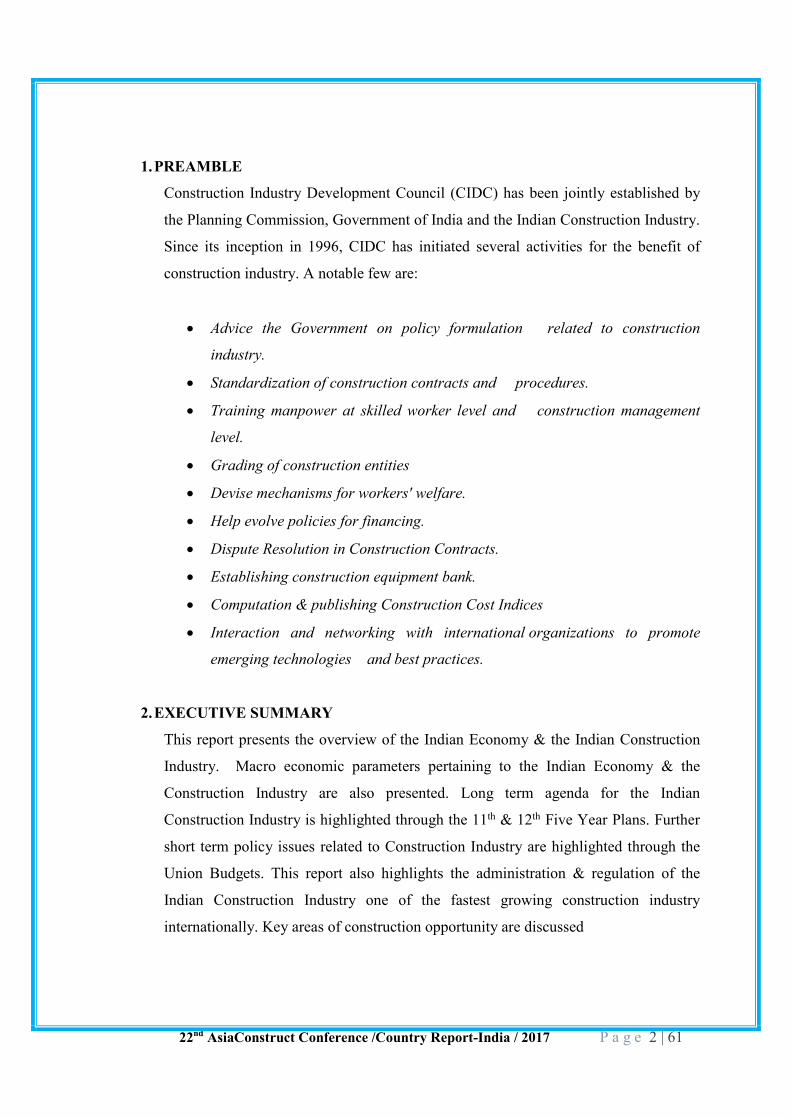
v India's exports grew by 3.98 percent to USD 312.35 billion in FY 2013-14 while imports dipped by 8.11 percent during the period.
v Imports declined to USD 450.94 billion, narrowing the trade deficit to USD 138.59 billion in the last fiscal.
INDIAN EXPORTS
v The household sector is the main contributor to the domestic savings, but the public sector is also expected to contribute positively to savings reflecting a significant turnaround compared with past experience. The projected current account deficit could easily be higher because of the likely continuance of high oil prices but even so, it should remain sustainable given the likely availability of foreign inflows.

22nd AsiaConstruct Conference /Country Report-India / 2017 P a g e 6 | 61
v The strategy for achieving faster growth with greater inclusiveness involves several interrelated components. These are: (i) a continuation of the policies of economic reform which have created a buoyant and competitive private sector capable of benefiting from the opportunities provided by greater integration with the world, (ii) a revival in agricultural growth which is the most important single factor affecting rural prosperity, (iii) improved access to essential services in health and education (including skill development) especially for the poor, which is essential to ensure inclusiveness and also to support rapid growth, (iv) a special thrust on infrastructure development which is a critical area for accelerating growth, (v) environmental sustainability which is becoming increasingly important, (vi) special attention to the needs of disadvantaged groups, and (vii) good governance at all levels, Central, state, and local.
v As in most market economies, the dominant impulse for growth will come from the private sector. India is fortunate in having a strong private sector capability ranging from agriculture, which is entirely dependent on private farmers, most of whom have modest land holdings, through small and medium entrepreneurs in industry and services to larger domestic corporate entities, many of which benefit from FDI to varying degrees. The Eleventh Plan must ensure a policy environment that is supportive of this vibrant and globalized private sector which has an important contribution to make in India’s future development.
v Emphasizing the importance of the private sector is not to downplay the role of the government. On the contrary, apart from the usual role of government in providing a stable macroeconomic policy, the Eleventh Plan envisages a very large role for public policy in a number of sectors.
Size of Indian Household by Profile (Millions)
2014 2015 2016 Population (million) 1,2764 1,293# 1,310" GDP (US$ billion) 2,043 2,091 2,289" Real GDP growth (%) 7.2 7.3 7.5" GDP per capita (US$) 1,6014 1,6174 1,747" Inflation (%) 5.9 4.9 5.3* Exchange rate (per US$, period average) 61.02 64.1 69.37** Exports (US$ billion) 328.4 259.7* 270" Imports (US$ billion) 472.4 390.1* 404** Export growth (%) +2.5 -2.1* +3.8" Import growth (%) -2.1 -17.4* +3.6"
Sources: CEIC, IMF, EIU, WTO, RBI and India's Ministry of Commerce and Industry # IMF Estimate, # EIU Estimate, * *EIU Forecasts, # IMF Forecasts

P a g e 7 | 62
India: Selected Social and Economic Indicators, 2011/12-2016/17 1/ I. Social Indicators
GDP (2014/15) Poverty (percent of population)
Nominal GDP (in billions of U.S. dollars):
2,051 Headcount ratio at $1.90 a day (2011):
21.3
GDP per capita (U.S. dollars):
1,584 Undernourished (2011): 15.4
Population characteristics (2014/15)
Income distribution (2011, WDI)
Total (in billions): 1.30 Richest 10 percent of households:
30.0
Urban population (percent of total):
32 Poorest 20 percent of households:
8.2
Life expectancy at birth (years):
66.0 Gini index (2011): 33.6
II. Economic Indicators 2011/12 2012/13 2013/14 2014/15 2015/16
Proj. 2016/17 Proj.
Growth (in percent) Real GDP (at market prices)
6.6 5.1 6.9 7.3 7.3 7.5
Industrial production 2.9 1.1 -0.1 2.8 … …. Prices (percent change, period average) Consumer prices - Combined
9.5 9.9 9.4 5.9 5.0 5.3
Saving and investment (percent of GDP) Gross saving 2/
34.7 31.5 30.8 30.2 29.8 29.6
Gross investment 2/ 38.9 36.3 32.5 31.6 31.1 31.1 Fiscal position (percent of GDP) 3/ Central government deficit
-6.1 -5.1 -4.6 -4.2 -4.0

22nd AsiaConstruct Conference /Country Report-India / 2017 P a g e 8 | 61
General government deficit -8.1 -7.4 -7.6 -7.0 -7.0 -7.0 General government debt 4/ 68.1 67.5 65.8 66.1 66.3 65.7 Structural balance (% of potential GDP)
-8.4 -7.3 -7.5 -6.9 -6.9 -6.9
Structural primary balance (% of potential GDP)
-3.9 -2.8 -2.8 -2.2 -2.3 -2.1
Money and credit (y/y percent change, end-period)
Broad money 13.5 13.6 13.4 10.8 11.1 13.6 Credit to private sector 17.8 13.5 13.7 9.2 11.1 13.7 Financial indicators (percent, end-period)
91-day treasury bill yield (end-period) 5/
9.0 8.2 8.9 8.3 7.2 …
10-year government bond yield (end-period) 5/
8.6 8.0 8.9 7.8 7.7 …
Stock market (y/y percent change, end-period) 6/
-10.5 8.4 18.7 24.9 9.1 …
External trade 7/ Merchandise exports (in billions of U.S. dollars)
309.8 306.6 318.6 316.5 277.9 280.1
(Annual percent change 20.9 -1.0 3.9 -0.6 -12.2 0.8 Merchandise imports (in billions of U.S. dollars)
499.5 502.2 466.2 461.5 429.8 449.3
(Annual percent change) 30.3 0.5 -7.2 -1.0 -6.9 4.5 Terms of trade (G&S, annual percent change)
-6.1 -0.3 2.3 3.5 7.0 1.8
Balance of payments (in billions of U.S. dollars)
Current account balance -78.2 -88.2 -32.4 -26.7 -27.7 -34.8 (In percent of GDP) -4.2 -4.8 -1.7 -1.3 -1.3 -1.5 Foreign direct investment, net 22.1 19.8 21.6 31.3 34.2 37.4
22nd AsiaConstruct Conference /Country Report-India / 2017 P a g e 9 | 61
Portfolio investment, net (equity and debt)
17.2 26.9 4.8 42.2 -6.8 12.4
Overall balance -12.8 3.8 15.5 61.4 22.7 40.8 External indicators Gross reserves (in billions of U.S. dollars, end-period)
294.4 292.0 304.2 341.6 364.3 405.1
(In months of imports) 8/ 6.1 6.4 6.7 7.9 8.0 7.9 External debt (in billions of U.S. dollars, end-period)
360.8 409.4 446.3 475.2 513.3 550.4
External debt (percent of GDP, end-period)
19.6 22.3 23.8 23.2 24.0 23.6
Of which: Short-term debt 9/ 7.5 9.0 9.8 9.0 9.6 9.7 Ratio of gross reserves to short-term debt (end-period) 8/
2.1 1.8 1.7 1.9 1.8 1.8
Debt service ratio 10/ 6.0 5.9 5.9 7.5 7.1 7.8 Real effective exchange rate (percent change) 11/
(based on annual average level)
-3.4 -2.3 -2.4 7.3 6.0 …
Exchange rate (rupee/U.S. dollar, end-period) 5/
50.3 54.4 61.0 62.6 66.8 …
Memorandum item (in percent of GDP)
Fiscal balance under authorities' definition
-5.8 -4.9 -4.3 -4.0 -3.9 -3.8
Sources: Data provided by the Indian authorities; CEIC Data Company Ltd; Bloomberg L.P.; World Bank, World Development Indicators ; and IMF staff estimates and projections. 1/ Data are for April–March fiscal years. 2/ Differs from official data, calculated with gross investment and current account. Gross investment includes errors and omissions. 3/ Divestment and license auction proceeds treated as below-the-line financing.

22nd AsiaConstruct Conference /Country Report-India / 2017 P a g e 10 | 61
4/ Includes combined domestic liabilities of the center and the states, and external debt at year-end exchange rates. 5/ For 2015/16, as of 6 January 2016. 6/ For 2015/16, year-to-date as of 6 January 2016. 7/ On balance of payments basis. 8/ Imports of goods and services projected over the following 12 months. 9/ Short-term debt on residual maturity basis, including estimated short-term NRI deposits on residual maturity basis. 10/ In percent of current account receipts, excluding grants. 11/ For 2015/16, year-to-date as of November 2015.
India: Macroeconomic Framework, 2011/12–2020/21 1/ Prel:_________________________. Projections
2011/12 2012/13 2013/14 2014/15 2015/16 2016/17 2017/18 2018/19 2019/20 2020/21 Growth (percent change)
Real GDP (at factor cost)
6.9 4.9 6.6 7.2 7.3 7.5 7.5 7.6 7.7 7.7
Non-agricultural sector
7.0 5.0 4.7 7.6 9.2 8.2 8.3 8.4 8.4 8.4
Prices (percent change, period average)
Consumer prices 8.1 9.9 9.4 5.9 5.0 5.3 5.3 5.5 5.3 5.0 Saving and investment (percent of GDP)
Gross saving 2/ 34.7 31.5 30.8 30.2 29.8 29.6 29.6 30.3 30.8 31.4 Gross investment 3/ 38.9 36.3 32.5 31.6 31.1 31.1 31.6 32.5 33.1 33.8 Money and credit (y/y percent change, end-period)
Broad money 13.5 13.6 13.4 10.8 11.1 13.6 15.4 15.5 15.2 14.7 Credit to private sector
17.8 13.5 13.7 9.5 11.1 13.7 16.6 17.0 17.0 16.3

22nd AsiaConstruct Conference /Country Report-India / 2017 P a g e 11 | 61
Fiscal position (percent of GDP)
Central government balance 4/
-6.1 -5.1 -4.6 -4.2 -4.2 -4.0 -3.9 -3.9 -3.7 -3.6
General government balance 4/
-8.1 -7.4 -7.6 -7.0 -7.0 -7.0 -6.8 -6.6 -6.2 -6.0
General government debt 5/
68.1 67.5 65.8 66.1 66.3 65.7 64.9 64.1 63.0 61.8
External trade (percent change, BOP basis)
Merchandise exports (in volume terms)
20.9 -1.0 3.9 5.8 0.8 4.9 6.5 8.5 8.2 8.0
Merchandise imports (in volume terms)
30.3 0.5 -7.2 8.3 13.0 10.0 7.5 7.3 7.3 7.3
Balance of payments (in billions of U.S. dollars)
Current account balance
-78.2 -88.2 -32.4 -26.7 -27.7 -34.8 -52.1 -62.1 -71.4 -79.6
(in percent of GDP) -4.2 -4.7 -1.7 -1.3 -1.3 -1.5 -2.0 -2.2 -2.3 -2.4 Foreign direct investment, net
22.1 19.8 21.6 31.3 34.2 37.4 40.7 44.4 48.8 53.6
Portfolio investment, net (equity and debt)
17.2 26.9 4.8 42.2 -6.8 12.4 26.2 28.6 31.4 34.5
Overall balance -12.8 3.8 15.5 61.4 22.7 40.8 41.1 40.3 42.1 46.3 External indicators Gross reserves (in 294.4 292.0 304.2 341.6 364.3 405.1 446.3 486.6 528.7 575.0
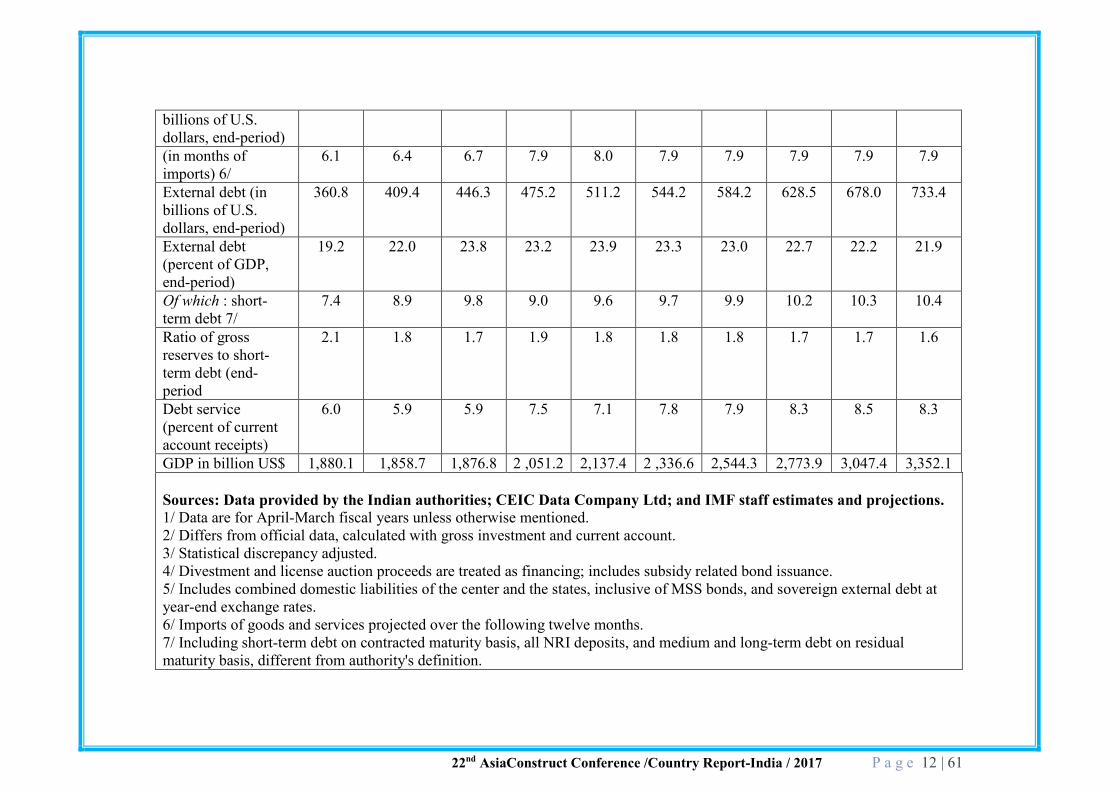
22nd AsiaConstruct Conference /Country Report-India / 2017 P a g e 12 | 61
billions of U.S. dollars, end-period) (in months of imports) 6/
6.1 6.4 6.7 7.9 8.0 7.9 7.9 7.9 7.9 7.9
External debt (in billions of U.S. dollars, end-period)
360.8 409.4 446.3 475.2 511.2 544.2 584.2 628.5 678.0 733.4
External debt (percent of GDP, end-period)
19.2 22.0 23.8 23.2 23.9 23.3 23.0 22.7 22.2 21.9
Of which : short-term debt 7/
7.4 8.9 9.8 9.0 9.6 9.7 9.9 10.2 10.3 10.4
Ratio of gross reserves to short-term debt (end-period
2.1 1.8 1.7 1.9 1.8 1.8 1.8 1.7 1.7 1.6
Debt service (percent of current account receipts)
6.0 5.9 5.9 7.5 7.1 7.8 7.9 8.3 8.5 8.3
GDP in billion US$ 1,880.1 1,858.7 1,876.8 2 ,051.2 2,137.4 2 ,336.6 2,544.3 2,773.9 3,047.4 3,352.1 Sources: Data provided by the Indian authorities; CEIC Data Company Ltd; and IMF staff estimates and projections. 1/ Data are for April-March fiscal years unless otherwise mentioned. 2/ Differs from official data, calculated with gross investment and current account. 3/ Statistical discrepancy adjusted. 4/ Divestment and license auction proceeds are treated as financing; includes subsidy related bond issuance. 5/ Includes combined domestic liabilities of the center and the states, inclusive of MSS bonds, and sovereign external debt at year-end exchange rates. 6/ Imports of goods and services projected over the following twelve months. 7/ Including short-term debt on contracted maturity basis, all NRI deposits, and medium and long-term debt on residual maturity basis, different from authority's definition.
P a g e 13 | 62
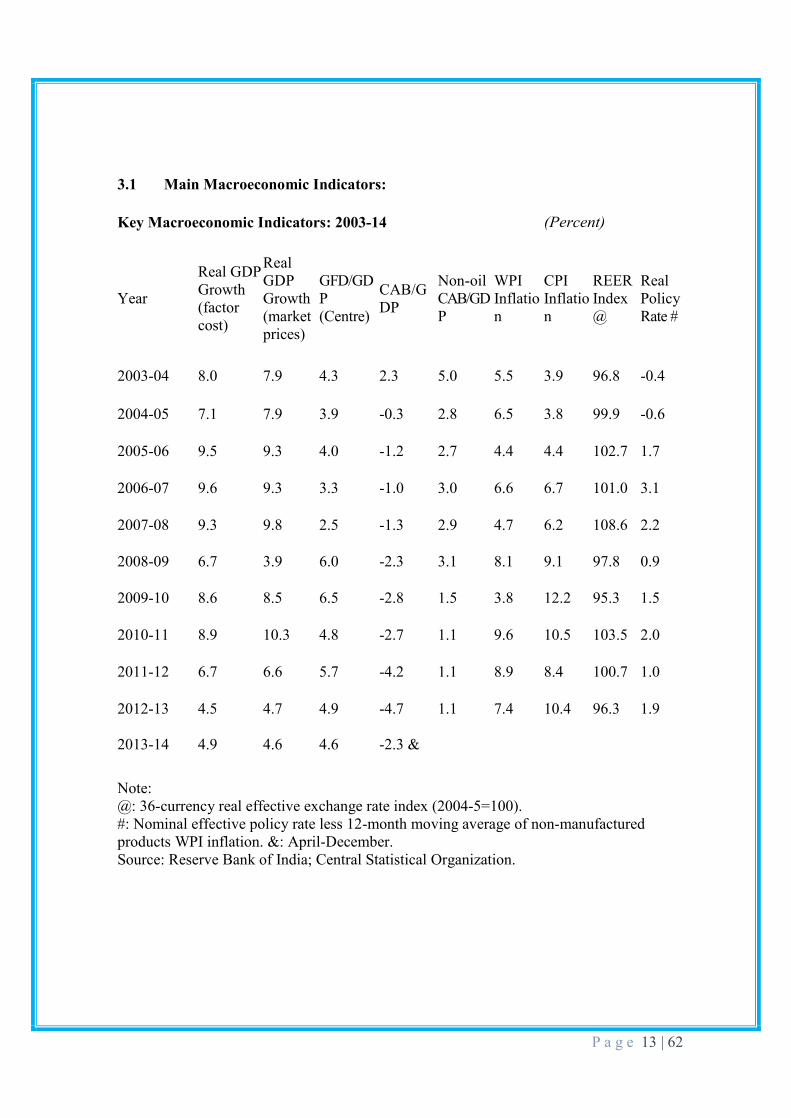
3.1 Main Macroeconomic Indicators:
Key Macroeconomic Indicators: 2003-14 (Percent)
Year
Real GDP Growth (factor cost)
Real GDP Growth (market prices)
GFD/GDP (Centre)
CAB/GDP
Non-oil CAB/GDP
WPI Inflation
CPI Inflation
REER Index @
Real Policy Rate #
2003-04 8.0 7.9 4.3 2.3 5.0 5.5 3.9 96.8 -0.4
2004-05 7.1 7.9 3.9 -0.3 2.8 6.5 3.8 99.9 -0.6
2005-06 9.5 9.3 4.0 -1.2 2.7 4.4 4.4 102.7 1.7
2006-07 9.6 9.3 3.3 -1.0 3.0 6.6 6.7 101.0 3.1
2007-08 9.3 9.8 2.5 -1.3 2.9 4.7 6.2 108.6 2.2
2008-09 6.7 3.9 6.0 -2.3 3.1 8.1 9.1 97.8 0.9
2009-10 8.6 8.5 6.5 -2.8 1.5 3.8 12.2 95.3 1.5
2010-11 8.9 10.3 4.8 -2.7 1.1 9.6 10.5 103.5 2.0
2011-12 6.7 6.6 5.7 -4.2 1.1 8.9 8.4 100.7 1.0
2012-13 4.5 4.7 4.9 -4.7 1.1 7.4 10.4 96.3 1.9
2013-14 4.9 4.6 4.6 -2.3 &
Note: @: 36-currency real effective exchange rate index (2004-5=100). #: Nominal effective policy rate less 12-month moving average of non-manufactured products WPI inflation. &: April-December. Source: Reserve Bank of India; Central Statistical Organization.

P a g e 14 | 62
Savings and Investment:
(Percent to GDP)
Item 2003-04 2004-05 2005-06 2006-07 2007-08 2008-09 2009.10 2010-11 2011-12 2012-131 Household sector 23.1 23.6 23.5 23.2 22.4 23.6 25.2 23.1 22.8 21.9Financial saving 11.0 10.1 11.9 11.3 11.6 10.1 12.0 9.9 7.0 7.1Financial assets 13.7 13.8 15.8 17.8 15.5 12.9 15.3 13.9 10.6 10.8of which: Bank deposits 5.5 5.4 7.2 10.0 7.8 7.4 6.1 7.0 5.9 5.9Financial liabilities 2.5 3.7 5.0 6.6 3.8 2.9 3.1 3.6 3.1 3.2Saving in physical assets 12.1 13.4 11.7 11.9 10.8 13.5 13.2 13.2 15.8 14.82 Private corporate sector 4.6 6.6 7.5 7.9 9.4 7.4 8.4 8.0 7.3 7.13 Public sector of which: Government administration and quasi government bodies
1.3
-3.3
2.3
-2.3
2.4
-2.1
3.6
-1.0
5.0
0.5
1.0
-2.8
0.2
-3.1
2.6
-0.5
1.2
-2.0
1.2
-1.94 Total domestic savings (1+2+3) 29.0 32.4 33.4 34.6 36.8 32.0 33.7 33.7 31.3 30.15 Gross capital formation 26.1 32.5 34.3 35.9 38.0 35.5 36.3 36.5 36.4 34.7Public sector 6.6 7.4 7.9 8.3 8.9 9.4 9.2 8.4 7.7 8.1Private corporate sector 6.5 10.3 13.6 14.5 17.3 11.3 12.1 12.8 10.1 9.2Household sector 12.1 13.4 11.7 11.9 10.8 13.5 13.2 13.2 15.8 14.8Valuables 0.9 1.3 1.1 1.2 1.1 1.3 1.8 2.1 2.7 2.66 Gross fixed capital formation 24.5 28.7 30.3 31.3 32.9 32.3 31.7 30.9 31.8 30.47 Change in stocks 0.7 2.5 2.8 3.4 4.0 1.9 2.8 3.5 1.9 1.78 Errors & omissions 0.7 0.4 0.4 0.2 0.1 -1.2 0.2 0.0 -0.9 0.19 Total investment (5+8=6+7+8+5d) 26.8 32.8 34.7 35.7 38.1 34.3 36.5 36.5 35.5 34.8Memo: 10 Saving-Investment Balance, net (4-9) 2.2 -0.4 -1.2 -1.1 -1.3 -2.3 -2.8 -2.8 -4.2 -4.7
22nd AsiaConstruct Conference /Country Report-India / 2017 P a g e 15 | 61
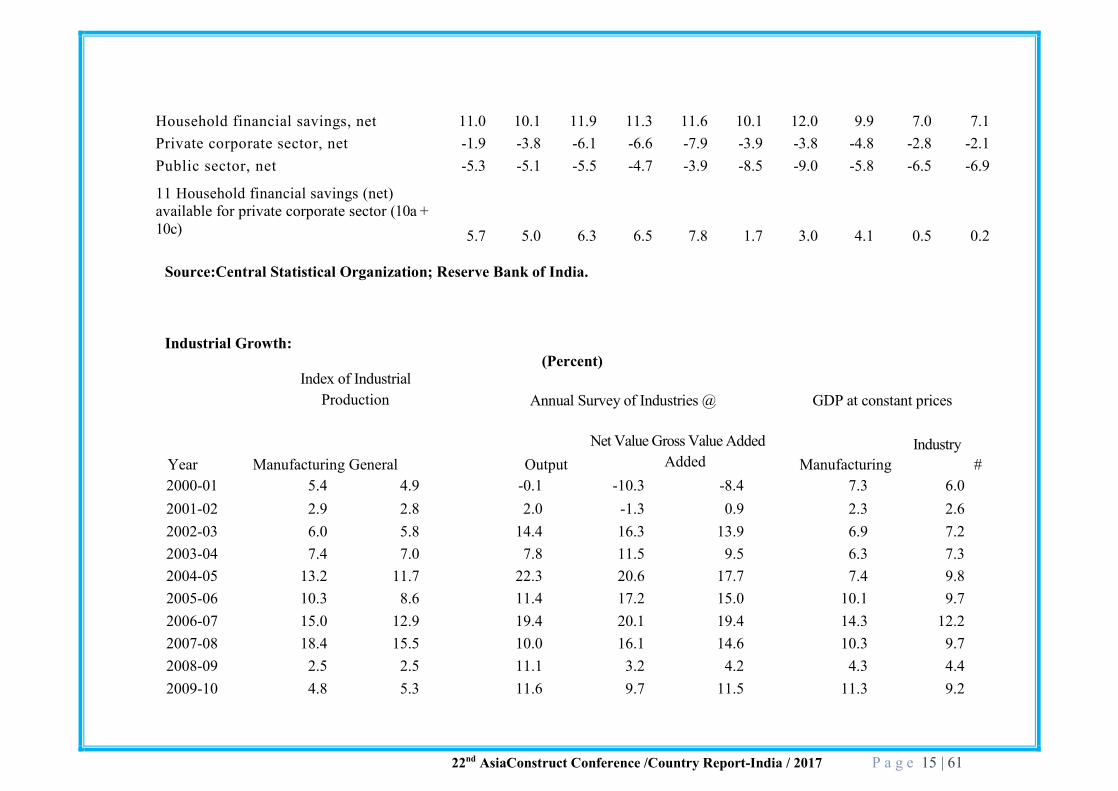
Household financial savings, net 11.0 10.1 11.9 11.3 11.6 10.1 12.0 9.9 7.0 7.1Private corporate sector, net -1.9 -3.8 -6.1 -6.6 -7.9 -3.9 -3.8 -4.8 -2.8 -2.1Public sector, net -5.3 -5.1 -5.5 -4.7 -3.9 -8.5 -9.0 -5.8 -6.5 -6.9
11 Household financial savings (net) available for private corporate sector (10a + 10c) 5.7 5.0 6.3 6.5 7.8 1.7 3.0 4.1 0.5 0.2
Source:Central Statistical Organization; Reserve Bank of India.
Industrial Growth: (Percent)
Year
Index of Industrial Production Annual Survey of Industries @ GDP at constant prices
Manufacturing General Output Net Value Gross Value Added
Added Manufacturing Industry
# 2000-01 5.4 4.9 -0.1 -10.3 -8.4 7.3 6.0 2001-02 2.9 2.8 2.0 -1.3 0.9 2.3 2.6 2002-03 6.0 5.8 14.4 16.3 13.9 6.9 7.2 2003-04 7.4 7.0 7.8 11.5 9.5 6.3 7.3 2004-05 13.2 11.7 22.3 20.6 17.7 7.4 9.8 2005-06 10.3 8.6 11.4 17.2 15.0 10.1 9.7 2006-07 15.0 12.9 19.4 20.1 19.4 14.3 12.2 2007-08 18.4 15.5 10.0 16.1 14.6 10.3 9.7 2008-09 2.5 2.5 11.1 3.2 4.2 4.3 4.4 2009-10 4.8 5.3 11.6 9.7 11.5 11.3 9.2

22nd AsiaConstruct Conference /Country Report-India / 2017 P a g e 16 | 61
2010-11 9.0 8.2 18.5 12.6 12.0 8.9 7.6 2011-12 3.0 2.9 15.3 10.7 10.4 7.4 7.8 2012-13 1.2 1.0 n.a n.a n.a 1.1 1.0
Averages
1980s 7.4 7.6 8.1 7.3 7.9 6.2 5.8 1990s 6.5 6.3 7.3 6.8 6.9 5.8 5.7 2000s 8.6 7.7 11.0 10.3 9.8 8.0 7.8 2003-08 12.8 11.1 14.2 17.1 15.2 9.7 9.7 2008-12 4.8 4.7 14.1 9.1 9.5 8.0 7.2 @: Growth rates are based on MI data deflated by WPI-Manufactured Products index. ft: including construction. Source: Central Statistical Organization.

P a g e 17 | 62
Broad Macro-Economic Parameters - Previous Plans and
Targets for Twelfth Plan
IXth Plan
Xth Plan XIth Plan
XIIth Plan
9.0 9.5
1 Investment Rate (Gross Capital Formation adjusted for errors and omissions)
24.6 31.8 36.4 38.7 41.4
2 Fixed Investment of which 23.2 28.4 30.9 33.5 35.5
Household Sector 9.9 11.7 11.6 12.0 12.0
Private Corporate Sector 6.6 9.6 11.0 12.4 13.5
Public Sector 6.6 7.1 8.3 9.1 10.0
3 Savings Ram of which 23.7 31.7 34.0 36.2 38.9
Household Sector 20.5 23.2 23.2 24.0 24.5
Private Corporate Sector 4.0 6.4 8.2 8.5 9.2
Public Savings of which -0.8 2.0 15 3.7 5.2
Govt. Admin. -4.9 -2.6 -1.3 -0.5 0.8
Public Enterprises 4.0 4.6 3.8 4.0 4.5
4 Current Account Balance of which -0.6 0.0 -24 -2.5 -25
Trade Balance -2.6 -25 -5.0 -4.5 -4.5
Capital Account Balance 2.1 3.5 3.8 5.0 5.0
5 WPI Inflation Rate 4.9 5.0 6.0 4.5-5.0 5.0-5.5
2.15 The investment required to achieve 9.0 pc cent growth in the Twelfth Plan ails for some increase

22nd AsiaConstruct Conference /Country Report-India / 2017 P a g e 18 | 61
from the levels already achieved. The investment rate (which equals gross dome tic capital formation ad-listed for errors and omissions as a r ccntace_of GDflisestimatcd to have inc ascd to 36.4_ocrcent
3.1 Economy in 2017
India is currently one of the world's most attractive investment destinations. With the opening up of foreign direct investment (FDI) in several sectors, the country is an eye-catching destination for overseas investors. The relaxation of norms by the government has also created a vast opportunity for foreign players, who are competing for a greater role in the Indian market. Sectors projected to do well in the coming years include automotive, technology, life sciences and consumer products. India made its entry into the club of the top 15 ultra-high-net-worth households (more than US$ 100 million in private financial wealth) in 2013 obtaining the 13th rank with 284 such households. Further, there has been marked improvement in the hiring scenario in the country, Index for Growth of Economy accelerated to 7.8% in 2016-17.

22nd AsiaConstruct Conference /Country Report-India / 2017 P a g e 19 | 61
Furthermore, the US$ 1.2 trillion investment that the government has planned for the infrastructure sector in the 12th Five-Year Plan is set to help in further improving the export performance of Indian companies and the Indian growth story, which will consequently improve the overall Indian economy. Market size India holds a 6.4 percent share of global gross domestic product (GDP) on purchasing power parity (PPP) basis and presently is the third biggest economy in the world in terms of PPP, according to a World Bank report. The industrial sector in India looks positive as industrial production grew at a 13-month high rate of 3.4 per cent in April 2014, driven mainly by electricity generation and manufacturing, as indicated by the Index of Industrial Production (IIP). The trade and external sector showed improvement as exports posted double-digit growth in May, 2014, as shipments of key commodities registered strong increases. India is all set to become the world's third largest economy by the year 2030. Key Developments Indian equities markets have seen foreign institutional investors (FII) net inflow of US$ 2.3 billion in May 2014, taking the total to US$ 7.8 billion so far in 2014. India is still the most loved market in this region. Some of major developments and investments in the recent past are as follows:
v Overseas investors have invested around US$ 20.4 billion in the Indian market in the first half of 2014, mainly on hopes of a stable and reform-oriented government at the Centre.
v FIIs have helped in pushing up the benchmark BSE sensex by over 20 per cent in the first six months of the year.
v Six qualified institutional placements (QIPs) launched in India during April-June
2014 raised Rs12,151 crore (US$ 2.01 billion) compared with Rs 1,222 crore (US$ 201.9 million) in the same quarter in 2013
v Venture capital (VC) investments in India surged during the first half of 2014,
reflecting optimism about India's entrepreneurial ecosystem. Investments in early stage companies and startups grew nearly 40 per cent as compared with the same period in 2013.
v Private equity (PE) firm SAIF Partners plans to make up to eight investments in FY
15 across different sectors, in an effort to significantly ramp up its investment pace in India and plan for more exits through the public market.

22nd AsiaConstruct Conference /Country Report-India / 2017 P a g e 20 | 61
v Sovereign wealth funds (SWFs) and overseas pension funds plan to invest in India, three sovereign funds from West Asia have invested over US$ 5 billion in the past eight months.
Sector-wise Investment in Infrastructure:
12th Plan
Sectors Rs. crore US $ Billion Share (9$)
Electricity (incl. NCE) 1,820,292 350.1 32.7 Roads & Bridges 914,536 175.9 16.4 Telecommunications 943,899 181.5 16.9 Railways (incl. MRTS) 643,379 123.7 11.5 Irrigation (incl. Watershed) 504,371 97.0 9.0 Water Supply & Sanitation 255,319 49.1 4.6 Ports (including inland waterways) 197,781 38.0 35 Airports 87,714 16.9 1.6 Storage 148,933 28.6 2.7 Oil & Gas Pipelines 58,441 11.2 1.0 Grand Total 5,574,663 1072.1 100.0
US$ I = Rs.52 at nominal Prices
Government Initiatives The Government of India has taken several initiatives to improve the Indian economy, which has been responsible for a number of positive outcomes.
· India's foreign exchange reserves rose by US$ 857 million for the week ending on June 27, 2014, to touch US$ 315.78 billion, while foreign currency assets rose by US$ 851 million to reach US$ 288.81 billion.
· The Ministry of Development of North Eastern Region (DoNER) has sanctioned seven new projects worth Rs 87.88 crore (US$ 14.52 million) in FY 15, which include projects for road construction, irrigation scheme and renewal of electric installations.
· In order to better the ways of doing business, the Government of India has extended the validity period of an industrial licence to three years from two years, with a provision for further extension by two years.
Road Ahead v The total value of India's listed companies is expected to cross the US$ 1.5 trillion
mark within the next 12 months as India enters the top 10 club of countries by market capitalisation.

22nd AsiaConstruct Conference /Country Report-India / 2017 P a g e 21 | 61
v India could become the world's seventh biggest nation in terms of private wealth, with a 150 per cent increase in total, from US$ 2 trillion in 2013 to US$ 5 trillion by 2018, as per a recent study by the Boston Consulting Group (BCG).
Government of India's initiatives for improving trade and infrastructure can go a long way in improving the country's overall economy and make it a force to reckon with in the global economic scenario. References: Press Information Bureau (PIB), Media Reports, Department of Industrial Policy and Promotion (DIPP), Securities and Exchange Board of India (SEBI)
Global Prospects
Our 2017 India attractiveness survey finds that India remains one of the top global destinations for foreign investment. The main drivers are its solid domestic market, an educated workforce and competitive labour.
India accounts for more than 20% of total capital allocated for the developing world. The infrastructure, consumer products, industrials, technology, media and telecom (TMT), and life-sciences sectors are set to drive India’s growth over the next two years.
Investors are considering India for both their services and manufacturing supply chain. With the services sector forming the backbone of India’s economy, the Indian Government is placing more weight on strengthening the country’s manufacturing ecosystem.
Key features of India’s attractiveness
India was the fourth-largest recipient of FDI in terms of projects started in 2012, and in terms of value, it accounted for 5.5% of global FDI.
Increased interest from the Middle East and Southeast Asia
Investors across the world recognize India’s FDI potential. Between 2007 and 2012, the US invested the most in India, with 30.2% of projects, followed by Japan with 10.4%.
Seven of the top 10 investors in India during 2007-12 were from Western Europe, led by the UK and followed by Germany and France. India's pool of business partners is growing, with a striking 123.3% rise in the number of projects from the Middle East

22nd AsiaConstruct Conference /Country Report-India / 2017 P a g e 22 | 61
in 2012, mostly in financial services. Southeast Asian countries are also expanding their investment in the country, with projects mainly originating from Singapore, Malaysia and Thailand.
Top FDI destinations
Actual FDI performance show that metropolitan cities, such as Mumbai, Bengaluru, the National Capital Region (NCR), Chennai and Pune, remain key attractions.
Forty-three percent of respondents could not think of any city other than the main metropolitan areas. Among those who responded, Ahmedabad was the preferred choice in emerging cities, followed by Jaipur, Chandigarh, Coimbatore and Surat.
India’s global market appeal lies in Competitive labour costs, Lucrative domestic market, Skilled workforce. Strong management and business education system Improving telecommunications infrastructure burgeoning middle class growing domestic consumption levels
In order to realize its FDI potential, India needs to improve its operating environment and develop infrastructure. Other priorities should include boosting production, improving the taxation system, easing FDI regulations and increasing
P a g e 23 | 62
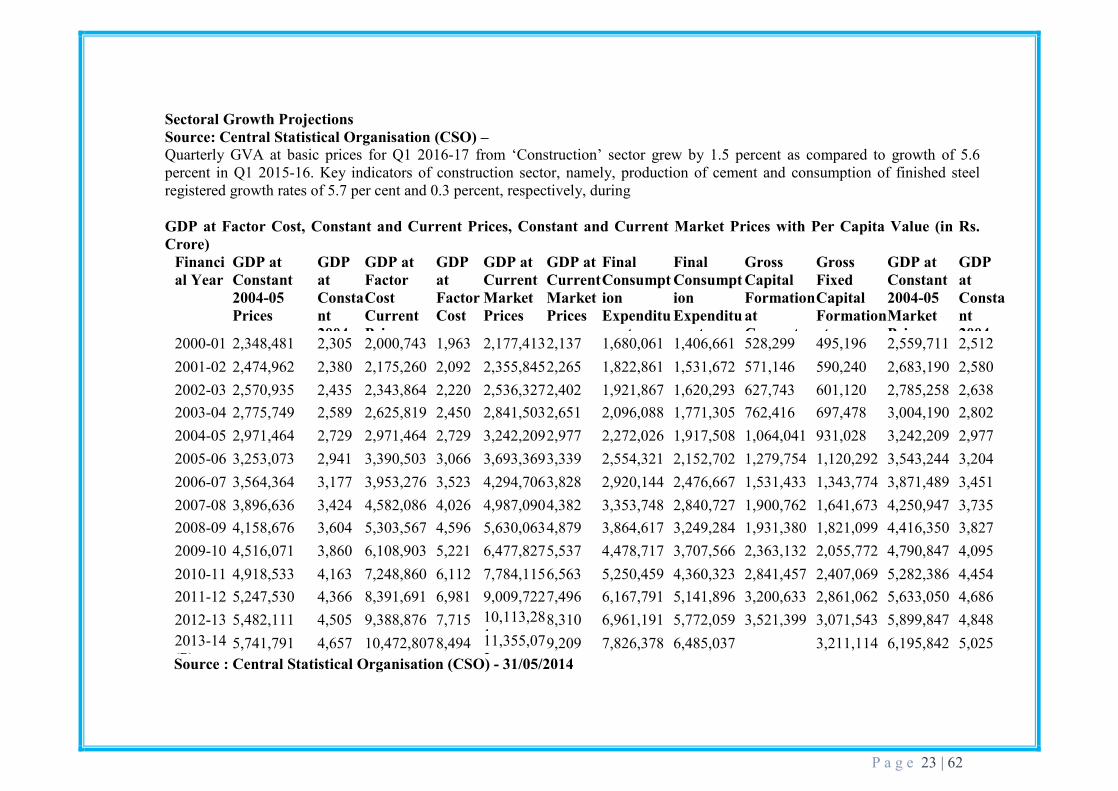
Sectoral Growth Projections Source: Central Statistical Organisation (CSO) – Quarterly GVA at basic prices for Q1 2016-17 from ‘Construction’ sector grew by 1.5 percent as compared to growth of 5.6 percent in Q1 2015-16. Key indicators of construction sector, namely, production of cement and consumption of finished steel registered growth rates of 5.7 per cent and 0.3 percent, respectively, during GDP at Factor Cost, Constant and Current Prices, Constant and Current Market Prices with Per Capita Value (in Rs. Crore)
Financial Year
GDP at Constant 2004-05 Prices
GDP at Constant 2004-
GDP at Factor Cost Current Prices
GDP at Factor Cost per
GDP at Current Market Prices
GDP at Current Market Prices per
Final Consumption Expenditure at
Final Consumption Expenditure at
Gross Capital Formation at Current
Gross Fixed Capital Formation at
GDP at Constant 2004-05 Market Prices
GDP at Constant 2004-2000-01 2,348,481 2,305 2,000,743 1,963 2,177,413 2,137 1,680,061 1,406,661 528,299 495,196 2,559,711 2,512
2001-02 2,474,962 2,380 2,175,260 2,092 2,355,845 2,265 1,822,861 1,531,672 571,146 590,240 2,683,190 2,580 2002-03 2,570,935 2,435 2,343,864 2,220 2,536,327 2,402 1,921,867 1,620,293 627,743 601,120 2,785,258 2,638 2003-04 2,775,749 2,589 2,625,819 2,450 2,841,503 2,651 2,096,088 1,771,305 762,416 697,478 3,004,190 2,802 2004-05 2,971,464 2,729 2,971,464 2,729 3,242,209 2,977 2,272,026 1,917,508 1,064,041 931,028 3,242,209 2,977 2005-06 3,253,073 2,941 3,390,503 3,066 3,693,369 3,339 2,554,321 2,152,702 1,279,754 1,120,292 3,543,244 3,204 2006-07 3,564,364 3,177 3,953,276 3,523 4,294,706 3,828 2,920,144 2,476,667 1,531,433 1,343,774 3,871,489 3,451 2007-08 3,896,636 3,424 4,582,086 4,026 4,987,090 4,382 3,353,748 2,840,727 1,900,762 1,641,673 4,250,947 3,735 2008-09 4,158,676 3,604 5,303,567 4,596 5,630,063 4,879 3,864,617 3,249,284 1,931,380 1,821,099 4,416,350 3,827 2009-10 4,516,071 3,860 6,108,903 5,221 6,477,827 5,537 4,478,717 3,707,566 2,363,132 2,055,772 4,790,847 4,095 2010-11 4,918,533 4,163 7,248,860 6,112 7,784,115 6,563 5,250,459 4,360,323 2,841,457 2,407,069 5,282,386 4,454 2011-12 5,247,530 4,366 8,391,691 6,981 9,009,722 7,496 6,167,791 5,141,896 3,200,633 2,861,062 5,633,050 4,686 2012-13 5,482,111 4,505 9,388,876 7,715 10,113,28
1 8,310 6,961,191 5,772,059 3,521,399 3,071,543 5,899,847 4,848
2013-14 (P)
5,741,791 4,657 10,472,807 8,494 11,355,073
9,209 7,826,378 6,485,037 3,211,114 6,195,842 5,025 Source : Central Statistical Organisation (CSO) - 31/05/2014

22nd AsiaConstruct Conference /Country Report-India / 2017 P a g e 24 | 61
GDP at Constant, Current & Market Prices with value of Consumption Expenditure etc. (in Rs. Crore)
Financial Year
GDP at Constant 2004-05 Prices
GDP at Factor Cost Current Prices
GDP at Constant 2004, 05 Market Prices
GDP at Current Market Prices
Final Consumption Expenditure at Constant 200405 Prices - India
Final Consumption Expenditure at Constant 2004-05 Prices-Private
Final Consumption Expenditure at Constant 2004-05 Prices - Government
At Constant 2004-2005 Prices: Gross Capital Formation (India)
At Constant 2004-2005 Prices: Gross Fixed Capital Formation (India)
2000-01 2,348,481 2,000,743 2,559,711 2,177,413 1,903,928 1,579,201 324,727 630,056 591,610
2001-02 2,474,962 2,175,260 2,683,190 2,355,845 2,005,578 1,673,209 332,369 658,827 682,143
2002-03 2,570,935 2,343,864 2,785,258 2,536,327 2,052,991 1,721,238 331,753 708,637 679,170
2003-04 2,775,749 2,625,819 3,004,190 2,841,503 2,164,189 1,823,227 340,962 819,925 750,940
2004-05 2,971,464 2,971,464 3,242,209 3,242,209 2,272,026 1,917,508 354,518 1,064,041 931,028
2005-06 3,253,073 3,390,503 3,543,244 3,693,369 2,469,316 2,083,309 386,007 1,236,927 1,081,792
2006-07 3,564,364 3,953,276 3,871,489 4,294,706 2,660,471 2,259,892 400,579 1,402,369 1,231,265
2007-08 3,896,636 4,582,086 4,250,947 4,987,090 2,910,316 2,471,397 438,919 1,656,892 1,430,764
2008-09 4,158,676 5,303,567 4,416,350 5,630,063 3,134,069 2,649,610 484,459 1,570,333 1,480,943
2009-10 4,516,071 6,108,903 4,790,847 6,477,827 3,397,005 2,845,303 551,702 1,841,262 1,594,475
2010-11 4,918,533 7,248,860 5,282,386 7,784,115 3,673,232 3,092,373 583,544 2,100,497 1,769,792
2011-12 5,247,530 8,391,691 5,633,050 9,009,722 3,969,459 3,378,506 623,574 2,183,259 1,986,645
2012-13 5,482,111 9,388,876 5,899,847 10,113,281 4,125,959 3,547,584 662,032 2,297,807 2,002,047 2013-14 (P)
5,741,791 10,472,807 6,195,842 11,355,073 3,719,568 687,388 1,999,938 Source : Central Sta istical Organisation (CSO)

22nd AsiaConstruct Conference /Country Report-India / 2017 P a g e 25 | 61
Note: The 2013-14 and 2014-15 figures are RE and BE respectively. All figures reflect actual expenditure. Source: Expenditure Budget Vol. 1, 2013-14; Reserve Bank of India Projected Investment in Infrastructure during the Twelfth Five Year Plan
Source: Mid-Term Appraisal Eleventh Five Year Plan, Planning Commission, GOI; WPI inflation used to convert to current prices; FY12 inflation based on PMEAC projection
Year
Base Year FY12 FY13 FY14 FY15 FY16 FY17 Total
12th Plan
GDP at FY07 Prices (Rs. Crs.) 6,314,265 6,882,549 7,501,978 8,177,156 8,913,100 9,715,280 41,190,063 Infrastructure Investment as % of GDP
8.37% 9.00% 9.50% 9.90% 10.30% 10.70% 9.95% Infrastructure Investment (Rs. Crs. in FY07 prices) 528,316 619,429 712,688 809,538 918,049 1,039,535 4,099,239
Infrastructure Investment (Rs. Crs. in current prices) 721,781 888,572 1,073,470 1,280,315 1,524,526 1,812,581 6,579,463
22nd AsiaConstruct Conference /Country Report-India / 2017 P a g e 26 | 61
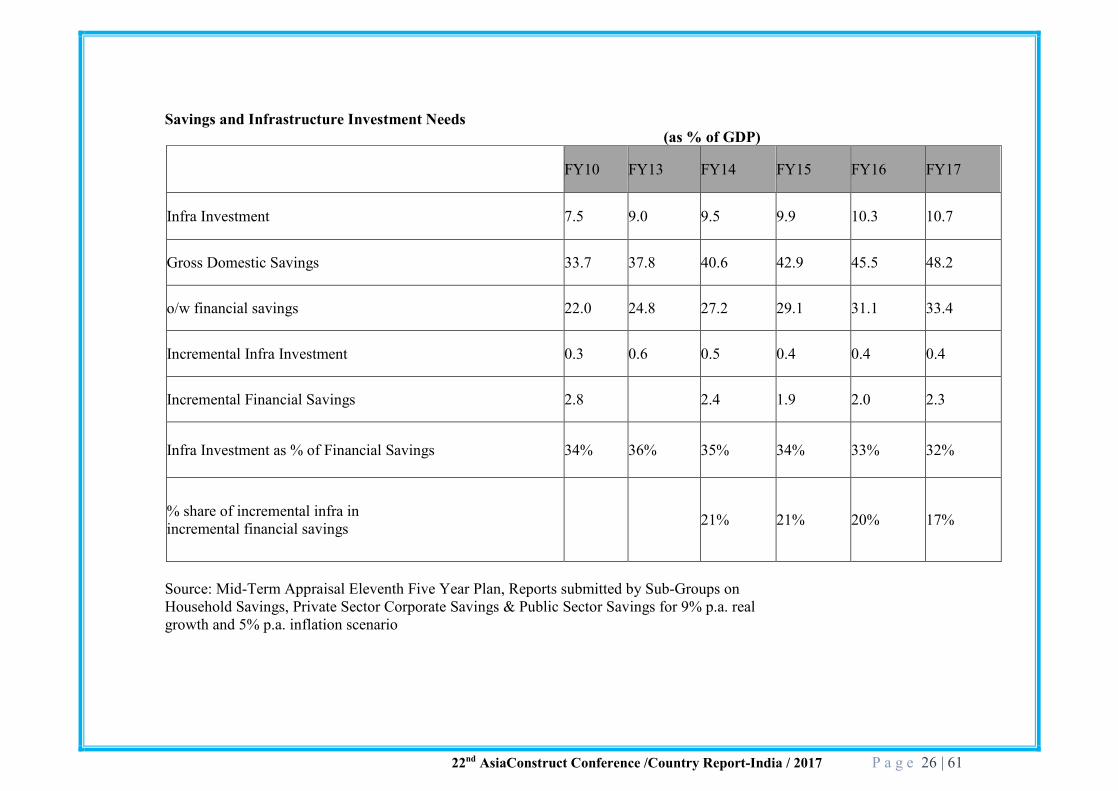
Savings and Infrastructure Investment Needs (as % of GDP)
FY10 FY13 FY14 FY15 FY16 FY17
Infra Investment 7.5 9.0 9.5 9.9 10.3 10.7
Gross Domestic Savings 33.7 37.8 40.6 42.9 45.5 48.2
o/w financial savings 22.0 24.8 27.2 29.1 31.1 33.4
Incremental Infra Investment 0.3 0.6 0.5 0.4 0.4 0.4
Incremental Financial Savings 2.8 2.4 1.9 2.0 2.3
Infra Investment as % of Financial Savings 34% 36% 35% 34% 33% 32%
% share of incremental infra in incremental financial savings 21% 21% 20% 17%
Source: Mid-Term Appraisal Eleventh Five Year Plan, Reports submitted by Sub-Groups on Household Savings, Private Sector Corporate Savings & Public Sector Savings for 9% p.a. real growth and 5% p.a. inflation scenario

22nd AsiaConstruct Conference /Country Report-India / 2017 P a g e 27 | 61
Investment by Centre, States & Private Sector
(Billion US$ nt nominal prices. I USS = Rs. 52)
(per cent shale in brackets)
10th Plan (Actual)
11th Plan (Anticipated)
12th Plan (Projected)
3,52,504 8,56,717 16,01,061Centre $ 68 bn $ 165 bn $ 308 bn (42) (35) (29) 2,98,633 6,80,056 12,89,762States $ 57 bn $ 131 bn $ 248 bn (36) (28) (23) 1,86,023 8,87,504 26,83,840Private $ 36 bn $ 171 bn $ 516 bn (22) (37) (48) 8,37,159 24,24,277 55,74,663
Total $ 161 bn $ 466 bn $ 1,072 bn
4. Comparison of budgetary allocation 11th (2007-12) & 12th Five Year Plan (2012-17) For the 12th five-year plan (for the period 2012-2017) it is proposed to enhance the investment in infrastructure two folds. The estimate of additional investment for the 12th Plan period is given as follows: -

22nd AsiaConstruct Conference /Country Report-India / 2017 P a g e 28 | 61
Project Investment in Infrastructure during
Eleventh &Twelfth Five Year Plan
Major sectors 11th Plan (in Rs crores)
12th Plan (in Rs crores)
Increase over 11th Plan (in %)
Realisation % share Projection % share
Agriculture and water resources 1,16,554 7.3 2,84,030 7.96 143.69
Rural Development and Panchayatiraj 3,97,524 25.01 6,73,034 18.86 69.31
Scientific departments 58,690 3.69 1,42,167 3.98 142.23
Transport and energy 2,04,076 12.84 4,48,736 12.57 119.89
Education 1,77,538 11.17 4,53,728 12.71 155.57
Health and child development 1,12,646 7.09 4,08,521 11.45 262.66
Urban Development 63,465 3.99 1,64,078 4.60 158.53
Others 4,58,849 28.87 9,94,333 27.86 116.70
Total Plan allocation 15,89,342 100.00 35,68,626 100.00 124.53
P a g e 29 | 62
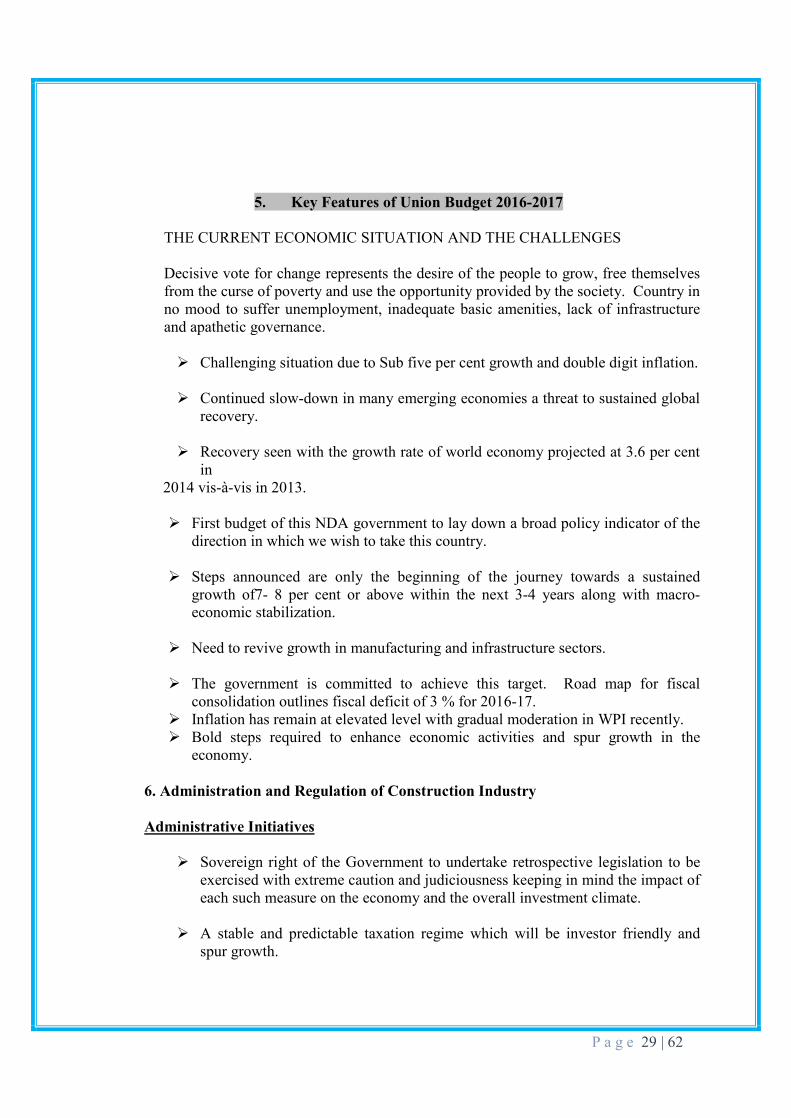
5. Key Features of Union Budget 2016-2017
THE CURRENT ECONOMIC SITUATION AND THE CHALLENGES Decisive vote for change represents the desire of the people to grow, free themselves from the curse of poverty and use the opportunity provided by the society. Country in no mood to suffer unemployment, inadequate basic amenities, lack of infrastructure and apathetic governance. Ø Challenging situation due to Sub five per cent growth and double digit inflation.
Ø Continued slow-down in many emerging economies a threat to sustained global
recovery.
Ø Recovery seen with the growth rate of world economy projected at 3.6 per cent in
2014 vis-à-vis in 2013.
Ø First budget of this NDA government to lay down a broad policy indicator of the direction in which we wish to take this country.
Ø Steps announced are only the beginning of the journey towards a sustained
growth of7- 8 per cent or above within the next 3-4 years along with macro-economic stabilization.
Ø Need to revive growth in manufacturing and infrastructure sectors.
Ø The government is committed to achieve this target. Road map for fiscal
consolidation outlines fiscal deficit of 3 % for 2016-17. Ø Inflation has remain at elevated level with gradual moderation in WPI recently. Ø Bold steps required to enhance economic activities and spur growth in the
economy. 6. Administration and Regulation of Construction Industry Administrative Initiatives
Ø Sovereign right of the Government to undertake retrospective legislation to be exercised with extreme caution and judiciousness keeping in mind the impact of each such measure on the economy and the overall investment climate.
Ø A stable and predictable taxation regime which will be investor friendly and
spur growth.

22nd AsiaConstruct Conference /Country Report-India / 2017 P a g e 30 | 61
Ø Legislative and administrative changes to sort out pending tax demands of more than 4 lakh crore under dispute and litigation.
Ø Resident tax payers enabled to obtain on advance ruling in respect of their
income-tax liability above a defined threshold.
Ø Measures for strengthening the Authority for Advance Rulings.
ECONOMIC INITIATIVES Foreign Direct Investment (FDI)
Ø Government to promote FDI selectively in sectors.
Ø The composite cap of foreign investment to be raised to 49 per cent with full Indian management and control through the FIPB route.
Ø The composite cap in the insurance sector to be increased up to 49 per cent from 26
per cent with full Indian management and control through the FIPB route.
Ø Requirement of the built up area and capital conditions for FDI to be reduced from 50,000 square metres to 20,000 square metres and from USD 10 million to USD 5 million respectively for development of smart cities.
Ø The manufacturing units to be allowed to sell its products through retail including E-
commerce platforms. Ø Bank Capitalization Ø Requirement to infuse `.2,40,000 crore as equity by 2018 in our banks to be in line
with Basel-III norms Ø Capital of banks to be raised by increasing the shareholding of the people in a phased
manner. Ø PSU Capital Expenditure
Ø PSUs will invest through capital investment a total sum of ` 2,47,941 crores in the current financial year.
SMART CITIES
Ø A sum of ` 7060 crore is provided in the current fiscal for the project of developing
“one hundred Smart Cities’

22nd AsiaConstruct Conference /Country Report-India / 2017 P a g e 31 | 61
Real Estate
Ø Incentives for Real Estate Investment Trusts (REITS). Complete pass through for the
purpose of taxation.
Ø A modified REITS type structure for infrastructure projects as the Infrastructure Investment Trusts (INVITS).
Ø These two instruments to attract long term finance from foreign and domestic sources including the NRIs.
Irrigation
Ø 1000 crore provided for “Pradhan Mantri Krishi Sinchayee Yojna” for assured irrigation.
EDUCATION School Education
Ø Government would strive to provide toilets and drinking water in all the girls school in first phase. An amount of ` 28635 crore is being funded for Sarv Shiksha Abhiyan(SSA) and ` 4966 crore for Rashtriya madhyamic Shiksha Abhiyan (RMSA).
Ø A School Assessment Programme is being initiated at a cost of ` 30 crore.
Ø 500 crore provided for “Pandit Madan Mohan Malviya New Teachers Training
Programme” to infuse new training tools and motivate teachers. Ø 100 crore provided for setting up virtual classrooms as Communication Linked
Ø Interface for Cultivating Knowledge (CLICK) and online courses.
Ø Higher Education
Ø Jai Prakash Narayan National Centre for Excellence in Humanities to be set up in MP.
Ø 500 crore provided for setting up 5 more IITs in the Jammu, Chhattisgarh, Goa, Andhra
Pradesh and Kerala.
Ø 5 IIMs in the States of HP, Punjab, Bihar, Odisha and Rajasthan.
Ø Simplification of norms to facilitate education loans for higher studies. Information Technology
22nd AsiaConstruct Conference /Country Report-India / 2017 P a g e 32 | 61
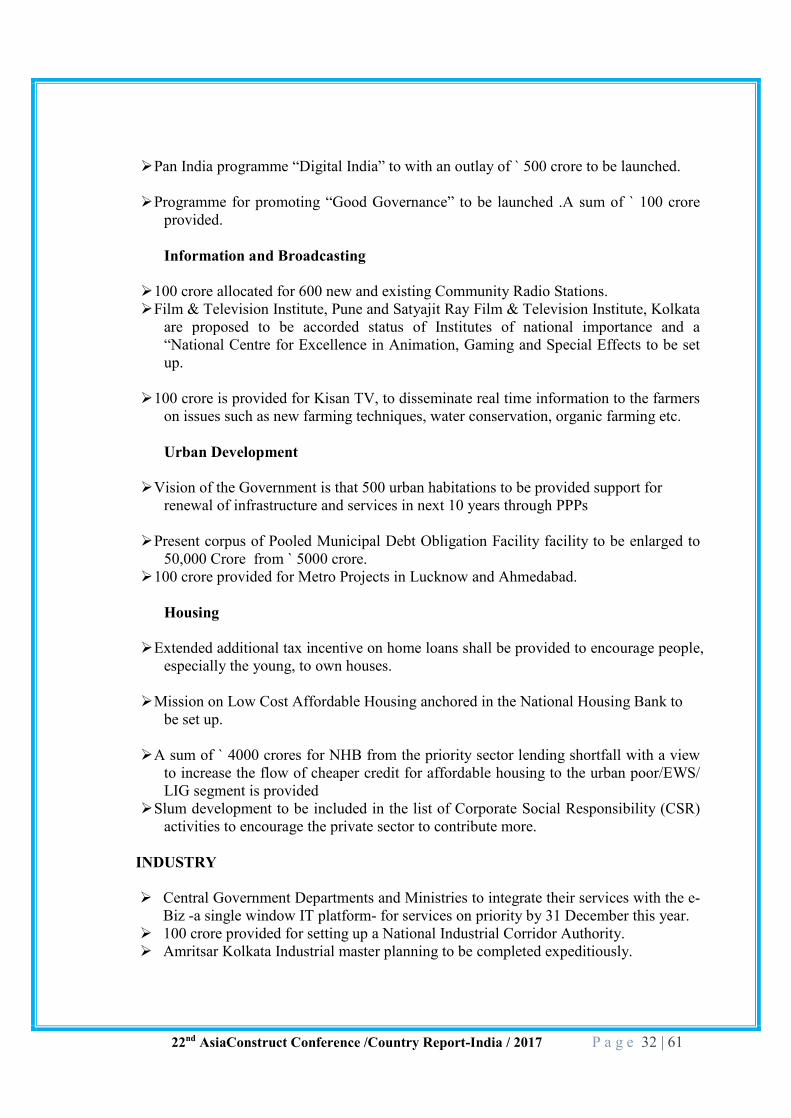
Ø Pan India programme “Digital India” to with an outlay of ` 500 crore to be launched.
Ø Programme for promoting “Good Governance” to be launched .A sum of ` 100 crore provided. Information and Broadcasting
Ø 100 crore allocated for 600 new and existing Community Radio Stations. Ø Film & Television Institute, Pune and Satyajit Ray Film & Television Institute, Kolkata
are proposed to be accorded status of Institutes of national importance and a “National Centre for Excellence in Animation, Gaming and Special Effects to be set up.
Ø 100 crore is provided for Kisan TV, to disseminate real time information to the farmers on issues such as new farming techniques, water conservation, organic farming etc. Urban Development
Ø Vision of the Government is that 500 urban habitations to be provided support for renewal of infrastructure and services in next 10 years through PPPs
Ø Present corpus of Pooled Municipal Debt Obligation Facility facility to be enlarged to 50,000 Crore from ` 5000 crore.
Ø 100 crore provided for Metro Projects in Lucknow and Ahmedabad. Housing
Ø Extended additional tax incentive on home loans shall be provided to encourage people, especially the young, to own houses.
Ø Mission on Low Cost Affordable Housing anchored in the National Housing Bank to be set up.
Ø A sum of ` 4000 crores for NHB from the priority sector lending shortfall with a view to increase the flow of cheaper credit for affordable housing to the urban poor/EWS/ LIG segment is provided
Ø Slum development to be included in the list of Corporate Social Responsibility (CSR) activities to encourage the private sector to contribute more.
INDUSTRY Ø Central Government Departments and Ministries to integrate their services with the e-
Biz -a single window IT platform- for services on priority by 31 December this year. Ø 100 crore provided for setting up a National Industrial Corridor Authority. Ø Amritsar Kolkata Industrial master planning to be completed expeditiously.

22nd AsiaConstruct Conference /Country Report-India / 2017 P a g e 33 | 61
Ø Master planning of 3 new smart cities in the Chennai-Bengaluru Industrial Corridor region, viz., Ponneri in Tamil Nadu, Krishnapatnam in Andhra Pradesh and Tumkur in Karnataka to be completed.
Ø Perspective plan for the Bengaluru Mumbai Economic corridor (BMEC) and Vizag- Chennai corridor to be completed with the provision for 20 new industrial clusters. Ø Development of industrial corridors with emphasis on Smart Cities linked to transport
connectivity to spur growth in manufacturing and urbanization will be accelerated. Ø Proposed to establish an Export promotion Mission to bring all stakeholders under
one umbrella. Ø Apprenticeship Act to be suitably amended to make it more responsive to industry
and youth. Micro Small and Medium Enterprises (MSME) Sector v Skill India to be launched to skill the youth with an emphasis on employability and
entrepreneur skills.
v Committee to examine the financial architecture for MSME Sector, remove bottlenecks and create new rules and structures to be set up and give concrete suggestions in three months.
v Fund of Funds with a corpus of `.10,000 crore for providing equity through venture capital unds, quasi equity, soft loans and other risk capital specially to encourage new startups by youth to be set up.
v Corpus of ` 200 crore to be set up to establish Technology Centre Network.
v Definition of MSME to be reviewed to provide for a higher capital ceiling.
v Programme to facilitate forward and backward linkages with multiple value chain of manufacturing and service delivery to be put in place.
v Entrepreneur friendly legal bankruptcy framework will be developed for SMEs to enable easy exit.
v A nationwide “District level Incubation and Accelerator Programme” to be taken up for incubation of new ideas and necessary support for accelerating entrepreneurship.
INFRASTRUCTURE v An institution to provide support to mainstreaming PPPPs called 4PIndia to be set up
with a corpus of ` 500 crores. Shipping

22nd AsiaConstruct Conference /Country Report-India / 2017 P a g e 34 | 61
v 11635 crore will be allocated for the development of Outer Harbour Project in Tuticorin for phase I.
v SEZs will be developed in Kandla and JNPT.
v Comprehensive policy to be announced to promote Indian ship building industry.
Inland Navigation
v Project on Ganges called “Jal Marg Vikas’ to be developed between Allahabad and Haldia.
New Airports v Scheme for development of new airports in Tier I and Tier II Cities to be launched.
Roads sector
v Sector needs huge amount of investment along with debottlenecking from maze of clearances.
v An investment of an amount of ` 37,880 crores in NHAI and State Roads is proposed
which includes ` 3000 crores for the North East. v Target of NH construction of 8500 km will be achieved in current financial year. v Work on select expressways in parallel to the development of the Industrial Corridors
will be initiated. For project preparation NHAI shall set aside a sum of ` 500 crore. Energy
v 100 crore is allocated for a new scheme “Ultra-Modern Super Critical Coal Based Thermal Power Technology.”
v Comprehensive measures for enhancing domestic coal production are being put in place.
v Adequate quantity of coal will be provided to power plants which are already commissioned or would be commissioned by March 2015.
v An exercise to rationalize coal linkages to optimize transport of coal and reduce
cost of power is underway. New & Renewable Energy v 500 crores provided for Ultra Mega Solar Power Projects in Rajasthan, Gujarat, Tamil
Nadu, Andhra Pradesh and Laddakh. v 400 crores provided for a scheme for solar power driven agricultural pump sets and
water pumping stations.

22nd AsiaConstruct Conference /Country Report-India / 2017 P a g e 35 | 61
v 100 crore provided for the development of 1 MW Solar Parks on the banks of canals. v A Green Energy Corridor Project is being implemented to facilitate evacuation of
renewable energy across the country. Petroleum & Natural Gas v Production and exploitation of Coal Bed Methane reserves will be accelerated. v Possibility of using modern technology to revive old or closed wells to be explored. v Usage of PNG to be rapidly scaled up in a Mission mode. v Proposal to develop pipelines using appropriate PPP models.
Mining
v Changes, if necessary, in the MMDR Act, 1957 to be introduced to encourage
investment in mining sector and promote sustainable mining practices. FINANCIAL SECTOR Capital Market
v Ongoing process of consultations with all the stakeholders on the enactment of the
Indian Financial Code and reports of the Financial Sector Legislative Reforms Commission (FSLRC) to be completed.
v Government in close consultation with the RBI to put in place a modern monetary policy framework.
v Following measures will be taken to energize Capital markets: v Introduction of uniform KYC norms and inter-usability of the KYC records across the
entire financial sector. v Introduce one single operating demat account v Uniform tax treatment for pension fund and mutual fund linked retirement plan
BANKING AND INSURANCE SECTOR Banking
v Time bound programme as Financial Inclusion Mission to be launched on 15 August
this year with focus on the weaker sections of the society. v Banks to be encouraged to extend long term loans to infrastructure sector with
flexible structuring. v Banks to be permitted to raise long term funds for lending to infrastructure
sector with minimum regulatory pre-emption such as CRR, SLR and Priority Sector Lending (PSL).

22nd AsiaConstruct Conference /Country Report-India / 2017 P a g e 36 | 61
v RBI to create a framework for licensing small banks and other differentiated banks.
v Differentiated banks serving niche interests, local area banks, payment banks etc. are
contemplated to meet credit and remittance needs of small businesses, unorganized sector, low income households, farmers and migrant work force.
v Six new Debt Recovery Tribunals to be set up.
v For venture capital in the MSME sector, a ` 10,000 crore fund to act as a catalyst to
attract private Capital by way of providing equity , quasi equity, soft loans and other risk capital for start-up companies with suitable tax incentives to participating private funds to be established.
Insurance Sector v The pending insurance laws (amendment) Bill to be immediately brought for
consideration of the Parliament. v The regulatory gap under the Prize Chits and Money Circulation Scheme (Banking)
Act, 1978 will be bridged.
BUDGET ESTIMATES
v Mandate to be fulfilled without compromising fiscal consolidation. v Non-plan Expenditure of ` 12,19,892 crore with additional provision for
fertilizersubsidy and Capital expenditure for Armed forces. v 5,75,000 crore Plan expenditure - increase of 26.9 per cent over actuals of 2013-14. v Plan increase targeted towards Agriculture, capacity creation in Health and Education,
Rural Roads and National Highways Infrastructure, Railways network expansion, clean energy initiatives, development of water resources and river conservation plans.
v Total expenditure of `.17,94,892 crore estimated. v Gross Tax receipts of ` 13,64,524 crore estimated. Net to centre of ` 9,77,258
crore estimated.
v Fiscal deficit of 4.1% of GDP and Revenue deficit of 2.9% estimated. v New Statement to separately show plan allocation made for North Eastern Region.
Allocation of ` 53,706 crore for North East Regions. v Allocation of ` 50,548 crore under SCSP and ` 32,387 under TSP. v Allocation for women at ` 98,030 crore and for children at ` 81,075 crore. TAX
22nd AsiaConstruct Conference /Country Report-India / 2017 P a g e 37 | 61
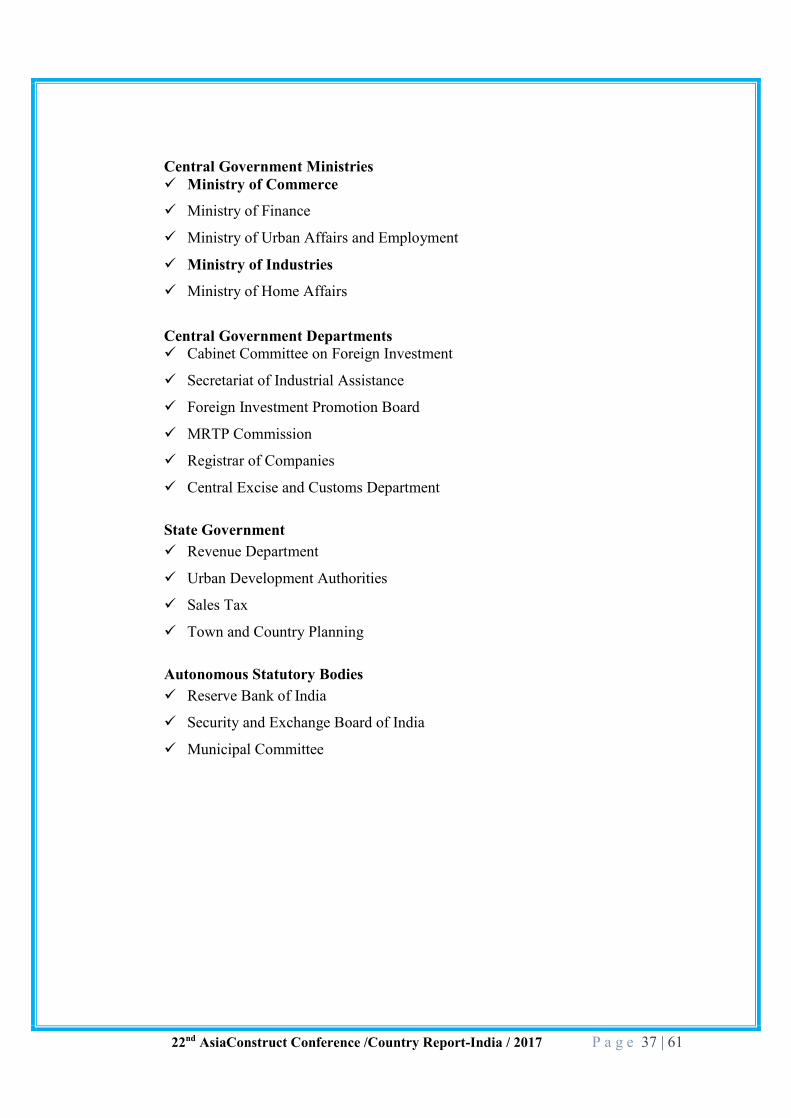
Central Government Ministries ü Ministry of Commerce
ü Ministry of Finance
ü Ministry of Urban Affairs and Employment
ü Ministry of Industries
ü Ministry of Home Affairs
Central Government Departments ü Cabinet Committee on Foreign Investment
ü Secretariat of Industrial Assistance
ü Foreign Investment Promotion Board
ü MRTP Commission
ü Registrar of Companies
ü Central Excise and Customs Department
State Government ü Revenue Department
ü Urban Development Authorities
ü Sales Tax
ü Town and Country Planning
Autonomous Statutory Bodies ü Reserve Bank of India
ü Security and Exchange Board of India
ü Municipal Committee

22nd AsiaConstruct Conference /Country Report-India / 2017 P a g e 38 | 61
7. CONSTRUCTION OPPORTUNITY & ACTIVITY
Estimated Construction Opportunity during XIIth Plan Period
Investment (Rs. crore)
Share (%)
Construction Intensity@ (% of Total Cost)
Construction Opportunity (Rs. crore)
Xth Plan
XIth Plan
XIIth Plan
Xth Plan
XIth Plan
XIIth Plan
Xth Plan
XIth Plan
XIIth Plan
Electricity 340,237 658,630 1,314,32
0 38% 32% 32% 40% 1,36,095 2,63,452 5,25,728
Roads & Bridges
127,107 278,658 556,072 14% 14% 14% 65% 82,620 1,81,128 3,61,447
Railways (incl. MRTS)
102,091 200,802 400,708 11% 10% 10% 75% 76,568 1,50,602 3,00,531
Irrigation 106,743 246,234 491,369 12% 12% 12% 75% 80,057 1,84,676 3,68,527
Water Supply
60,108 111,689 222,879 7% 5% 5% 60% 36,065 67,013 1,33,728
Ports 22,997 40,647 81,113 3% 2% 2% 70% 16,098 28,453 56,779
Airports 6,893 36,138 72,115 1% 2% 2% 30% 2,068 10,841 21,634
Total 766,1761,572,798
3,138,575 85% 77% 77% 429,570 886,164 1,768,3
73 # Assuming similar allocation among sectors during the Xlth Five-Year Plan © Based on past estimates Source: Planning Commission, Gol

22nd AsiaConstruct Conference /Country Report-India / 2017 P a g e 39 | 61
Details of PPP Projects by Sector
Projects in Pipeline Project under Implementation
No. of Projects Project Cost (Rs. crore)
No. of Projects Project Cost (Rs. crore)
Roads 167 115,822 133 102,775
Ports 47 35,902 50 62,058
Airports 7 4,120 3 19,277
Railways 53 90,312 5 5,217
Power 34 62,032 15 29,448
Urban Infrastructure 65 45,708 69 18,690
Other 31 22,534 17 3,575
Total 404 376,430 292 241,040
Source: Planning Commission, Gol
22nd AsiaConstruct Conference /Country Report-India / 2017 P a g e 40 | 61
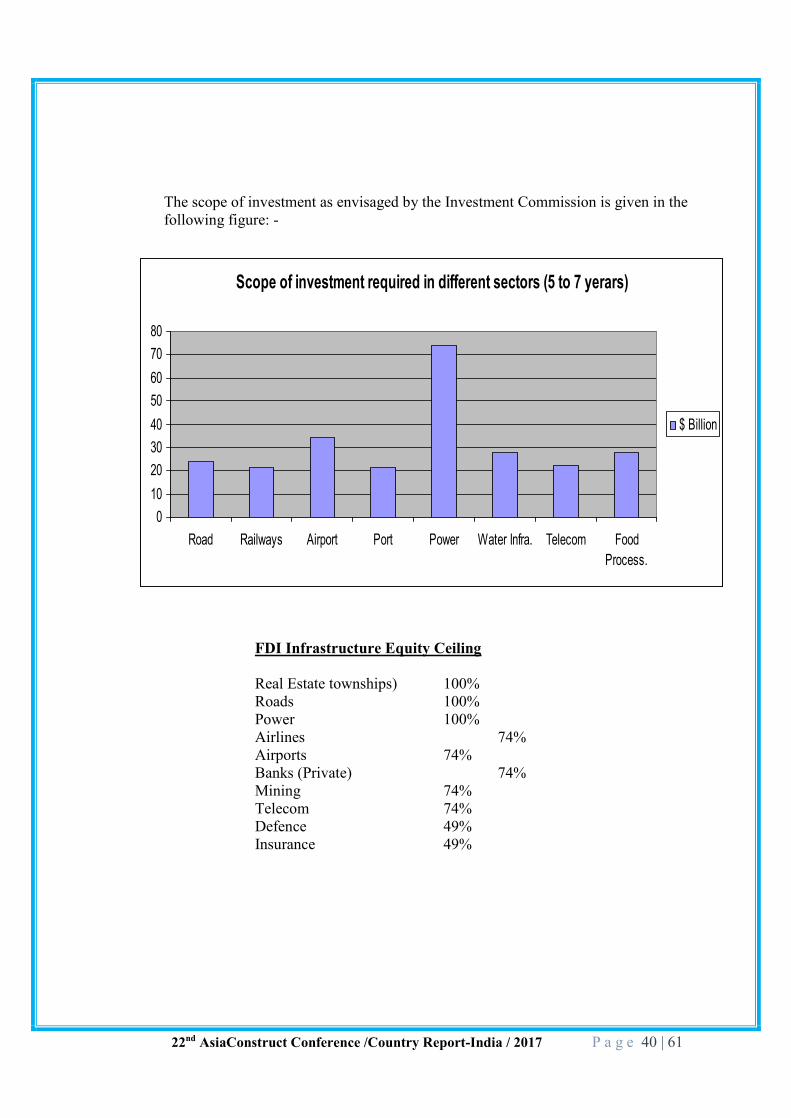
Scope of investment required in different sectors (5 to 7 yerars)
01020304050607080
Road Railways Airport Port Power Water Infra. Telecom FoodProcess.
$ Billion
The scope of investment as envisaged by the Investment Commission is given in the following figure: -
FDI Infrastructure Equity Ceiling
Real Estate townships) 100% Roads 100% Power 100% Airlines 74% Airports 74% Banks (Private) 74% Mining 74% Telecom 74% Defence 49% Insurance 49%

22nd AsiaConstruct Conference /Country Report-India / 2017 P a g e 41 | 61
Annexure-1
Average Construction Material Prices as on 2017
RATES IN INR
Delhi Item Rate
S. No. Item Unit Rate
1. Cement – OPC Tonne 5700 - 6000
2. Reinforcement Steel TMT – 12 mm dia MT 37500 to 40000
3. Burnt Clay Bricks (9” x 4.5” x 3”) Each 5.50 pieces
4. Sand (coarse – local) cum 40 to 50
5. Stone aggregates (20 mm normal size) Tonne 1600 per tonne
6. Kiln Seasoning of Timber Cft 700 to 900
7. Petrol Ltr 67.86
8. Lubricant – Grease Ltr 250
9. Paint – Synthetic Enamel White Ltr 180 to 200
10. Bitumen Grade 60/70 Bulk Tonne 24000 to 25000 per tonne
11. Daily wages of Labour
12. Unskilled Per day 513
13. Semi – Skilled Per day 565
14. Skilled Per day 622
15. Sr. Engineer (Civil) Monthly 29479
16. Jr. Engineer (Civil) Monthly 21285

22nd AsiaConstruct Conference /Country Report-India / 2017 P a g e 42 | 61
Annexure-2
CLASSIFICATION OF CONTRACTORS
Table below gives the categorization of contractors by the size of men they employ: -
S.N No. of people employed by the agency
No. of Agency /contractors
%age Category
1 1 to 200 persons 27,000 96.4% Small
2 200 to 500 persons 800 2.86% Medium
3 500 persons and above
200 0.74% Major
96.40%
2.86% 0.74%0%
10%
20%
30%
40%
50%
60%
70%
80%
90%
100%
Small Medium Major
Category
Classification of Contractors
22nd AsiaConstruct Conference /Country Report-India / 2017 P a g e 43 | 61
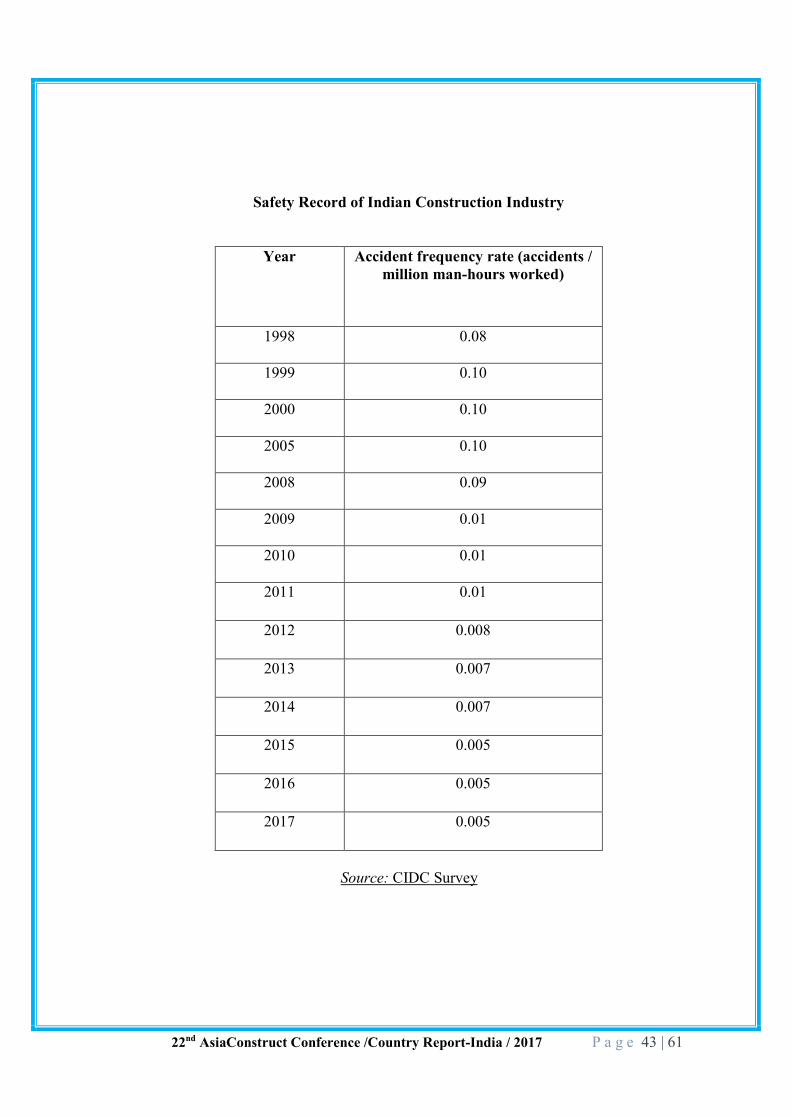
Safety Record of Indian Construction Industry
Year Accident frequency rate (accidents / million man-hours worked)
1998 0.08
1999 0.10
2000 0.10
2005 0.10
2008 0.09
2009 0.01
2010 0.01
2011 0.01
2012 0.008
2013 0.007
2014 0.007
2015 0.005
2016 0.005
2017 0.005
Source: CIDC Survey

22nd AsiaConstruct Conference /Country Report-India / 2017 P a g e 44 | 61
Annexure-3
Projected Investment as Percentage of GDP
(Rs crore at 2006–07 price) Years Base year Total (2006–07
of Tenth Plan)
2007–08 2008–09 2009–10 2010–11 2011–12 Eleventh Plan
(BE/RE) GDP 4145810 4518933 4925637 5368944 5852149 6378843 27044506 Public Investment 175388 192107 227327 273543 332355 411226 1436559
Private Investment 49858 78166 94252 115724 146762 184687 619591
Total investment
225246 270273 321579 389266 479117 595913 2056150
Investment as Percentage of GDP
Public 4.23 4.25 4.62 5.09 5.68 6.45 5.31 Private 1.20 1.73 1.91 2.16 2.51 2.89 2.29 Total 5.43 5.98 6.53 7.25 8.19 9.34 7.60 Source: CSO for 2006–07, and computations of the Planning Commission.
Projected Investment in Infrastructure during the Twelfth Five Year Plan:
Year Base Year FY12
FY13 FY14 FY15 FY16 FY17 Total 12th Plan
GDP at FY07 Prices (Rs. Crs.) 6,314,265 6,882,549 7,501,978 8,177a156 8,913,100 9,715,280 41,190,063
Infrastructure Investment as % of GDP
8.37% 9.00% 9.50% 9.90% 10.30% 10.70% 9.95%
Infrastructure Investment (Rs. Crs. in FY07 prices)
528,316 619,429 712,688 809,538 918,049 1,039,535 4,099,239
Infrastructure Investment (Rs. Crs. in current prices)
721,781 888,572 1,073,470 1,280,315 1,524,526 1,812,581 6,579,463
Source: Mid-Term Appraisal Eleventh Five Year Plan, Planning Commission, G0I; WPI inflation used to convert to current prices; FY12 inflation based on PMEAC projection
22nd AsiaConstruct Conference /Country Report-India / 2017 P a g e 45 | 61
Annexure-4
Salient Changes in Cross border & domestic employment procurement systems. To enhance the efficacy of delivery of Engineering Projects, following improvements in the procurement systems are being resorted to.
1. Engagement of Skill trained & certified work persons. Understanding the need of improving the productivity of the workforces, observance of better SHE practices, & improved quality of works, major Indian project authorities have, in their procurement system introduced a Clause for Mandatory employment of skill certified work persons. Extracts of this Clause are given below. “The contractor shall, at all stages of work, deploy skilled/semi skilled tradesmen who are qualified and possess certificate in particular trade from CPWD Training Institute/Industrial Training Institute/National Institute of construction Management and Research (NICMAR)/ National Academy of Construction, CIDC or any similar reputed and recognized Institute managed/ certified by State/Central Government. The number of such qualified tradesmen shall not be less than 20% of total skilled/semi skilled workers required in each trade at any stage of work. The contractor shall submit number of man days required in respect of each trade, its scheduling and the list of qualified tradesmen along with requisite certificate from recognized Institute to Engineer in charge for approval. Notwithstanding such approval, if the tradesmen are found to have inadequate skill to execute the work of respective trade, the contractor shall substitute such tradesmen within two days of written notice from Engineer- in-Charge. Failure on the part of contractor to obtain approval of Engineer-in-Charge or failure to deploy qualified tradesmen will attract a compensation to be paid by contractor at the rate of Rs. 100 per such tradesman per day. Decision of Engineer in Charge as to whether particular tradesman possesses requisite skill and amount of compensation in case of default shall be final and binding. Provided always, that the provisions of this clause, shall not be applicable for works with estimated cost put to tender being less than Rs. 5 crores.”
2. Introduction of Institutional Arbitration for effective resolution of disputes in Infrastructure Construction Projects. To resolve all commercial disputes effectively & in shortest time frame, the Institutional Arbitration mechanism, in place of Ad-hoc mode of Arbitration is being introduced in the procurement systems. Extract of relevant Clause are given below. “Any dispute of difference whatsoever arising between the parties and of or relating to the construction, interpretation, application, meaning, scope, operation or effect of this Contract or the validity or the breach thereof, shall be settled by arbitration in

22nd AsiaConstruct Conference /Country Report-India / 2017 P a g e 46 | 61
accordance with the rules of Arbitration of the Construction Industry Arbitration Council (CIAC), New Delhi and the award made in pursuance thereof shall be final and binding on the parties. The cost & expenses of Arbitration proceedings will be borne by each party as per terms of the Construction Industry Arbitration Council (CIAC), New Delhi.”
3. Engagement of Professional Engineers Subsequent to the formation of the National Register of the Professional Engineers by the Engineering Council of India, and ensuring that the projects are administered only by professional engineers following Clause is being introduced in the Indian procurement system. This would be applicable to all Engineers, irrespective of their Nationality, who are desirous to work on the Infrastructure Construction project in India. Further details are available at web site www.ecindia.org “ The contractor shall, at all stages of work, deploy engineers including Diploma holders, Degree holders and higher levels who are qualified and registered as Professional Engineers/ Chartered Engineers with the Engineering Council of India or the Institution of Engineers, India. The number of such registered Professional Engineers/ Chartered Engineers shall not be less than 25% of total numbers of engineers at the state of work. Failure on the part of contractor to deploy registered Professional/ Chartered engineers will attract a compensation to be paid by contractor at the rate of Rs.1000 per such Professional engineer per day. Decision of CPWD to whether particular engineer’s registration in valid or not and amount of compensation in case default shall be final and binding.”
4. ECI- AICTE – Internship Program Engineering Council of India (ECI), the apex Engineering Body of India & All IndiaCouncil for Technical Education (AICTE), Min. of HRD, Government of India haveentered into an MoU, for providing “Internship” to the Engineering & Managementprogram to students in all disciplines of Engineering, to enable them to becomeemployable. AICTE has made the “Internship” component mandatory to enable thegraduatingengineers&managementstudentstobecomeemployable.CIDC is one of the foundingmembers of ECI& shallwork towards fulfillment of thisobjective.ThefirstbatchInternshipforthestudentsinCivil,Mechanical&ElectricalwillcommencefromfirstweekofOctober,2017.
5. Engagement of certified Suppliers & Vendors To ensure effective & reliable Supplies for timely completion of Infrastructure Projects, several major project authorities have started sending purchase enquiries to

22nd AsiaConstruct Conference /Country Report-India / 2017 P a g e 47 | 61
the Vendors enlisted in the National Database of the Vendors being developed & maintained by Construction Industry Development Council. The details could be accessed from the website www.cidc.in.
This information is being provided to the members of Asia Construct Network, to enable them to disseminate the information in their respective geographical region.
Annexure-5
EXECUTIVE SUMMARY
In the context of development of the Chapter on Construction in the 12th Plan document, the
Planning Commission constituted a Steering Committee vide their order dated 4th August,
2011. Dr. Arun Maira, Hon’ble Member (Industry), Planning Commission was nominated as
the Chairman of the Steering Committee, which comprised of Senior representatives of
various Ministries of Government of India, Public Sector Undertakings, Construction
Companies, Industry Associations and, Individual Experts from Construction Industry. The
Steering Committee was convened by Dr. P R Swarup, Director General, Construction
Industry Development Council, supported by several Senior Experts drawn from
Construction, Legal, Technical & other sub-sectors. Dr. Manoj Singh, Advisor (Tpt),
provided integral support by organizing the meetings of the steering committee, articulating
and explaining the approach & also moderating the deliberations.
The introduction of Chapter on Construction in the National Plan was done in the 10th Plan
(2002-2007), and recognizing the importance of construction, as a major economic entity, it
was decided to amplify the deliberations during the 11th Plan as well. The 12th Plan document
further amplifies the actions to be taken & also recommends actionable points. It is also
envisages that, post plan document finalization a Steering Committee shall be constituted to
oversee the implementation of the recommended actions made by the plan document drafting
Steering Committee. The proposed terms of reference, have also been detailed in the
subsequent chapters.
22nd AsiaConstruct Conference /Country Report-India / 2017 P a g e 48 | 61
India has been experiencing unprecedented economic growth. During the 10th & 11th Plan
periods, substantial contribution to the National Economy has come from the Construction
Sector, however with the slowing down of global economies, even the Indian economy is
facing certain challenges. Maintaining the pace of growth experienced during last one
decade, probably is a major issue, and this amplifies the need of bringing in further reforms
and streamlining the functioning of construction industry.
Whereas, some of the policy statements recommended in the Chapters of Constructions in
10th & 11th Plan have been initiated for implementation, much needs to be done. The
government has put in place policies, which have generated over 8 % growth on an average
for the past few years. The plans are on anvil to achieve 9-10 % annual growth rate in the
next 5 years. This would be the basis for generating the resources needed for the massive
investments to be made in development of Physical Infrastructure & also the policy frame
work to be modified, developed & adopted.
The 12th Plan envisages a growth rate of over 8% per annum, and would need infusion of
substantial capital, estimated at over Rs.50.0 lakh crores to build India’s physical
Infrastructure. The development of physical infrastructure, through such massive
investments would need commensurate growth in delivery potentials of Construction
Industry which in turn necessitates evolution of reformed practices & establishment of
Institutions.
It is note worthy to mention that the present capacity of asset building of the Indian
Construction Industry isestimated at Rs.4.15 lakh crores per annum. In order to
accomplish the task in hand ( to build assets valuing Rs.50 Lakh Crores), the sector has
to double the capacity. The human as well as the material inputs need substantial
stepping up & therefore the plans & policies too, would need rank upgradation &
modifications.
Impediments therefore need to be removed and necessary facilitation need to be taken.
The objectives and the approach of this Steering Committee are given below:

22nd AsiaConstruct Conference /Country Report-India / 2017 P a g e 49 | 61
I. OBJECTIVES
1. To study & analyze the Indian Construction Industry, keeping in view the focus on creation of a world class infrastructure and rebuilding rural India through schemes such as Bharat Nirman & Schemes under MNREGA. To make an assessment of qualitative and quantitative capabilities of the Indian Construction Industry in the background of category-wise projections for construction and allied supporting activities in the 12th Plan with a view to evolve strategies for overcoming deficiencies and bottlenecks and achieve time bound targets, by suggesting measures for better coordination among the stakeholders.. 2. To review the regulatory framework governing the sector including fiscal & other regulations and suggest any changes required to make the sector more efficient & productive. 3. To review the present procedures of Government procurement including dispute resolution mechanisms for construction work and evolve measures for improvement, especially in view of increase in privatization in the infrastructure sector. 4. To review the present system for execution, supervision of progress and quality, release of funds, certification, billing and payment for work and suggest remedial measures for minimizing time and cost over-runs in projects undertaken by or on behalf of Government. 5. To review the State of present financing models for construction work; institutional financing from Banks/ Financial Institutions and their lending norms, and recommend measures to enable access to finance at globally competitive rates. 6. To focus on R&D activities in the construction sector and suggest measures for greater use of modern technologies and equipment and speedy adaptation of new methods.. 7. To evaluate role of Construction Sector in generating employment, keeping in view the qualitative & quantitative changes which have occurred in the recent past and to suggest measures for qualitative upgradation and more remunerative employment in the construction industry. 8. To assess the demand of manpower, category-wise and suggest remedial measures, including skill development, to face shortages, and suggest improvements in the functioning of National Skill Development Mission. 9. To review the quality and safety aspects in construction and to suggest necessary measures, and to recommend measures for evolving a Techno-legal regime. 10. To review the status of asset management and evolve strategies for implementation at local/State/Central Government level. 11. To study the impact of this industry on environment and suggest measures to make it more environmental friendly and sustainable; to also review the present regulatory framework for environmental clearance with a view to making it more business friendly.
22nd AsiaConstruct Conference /Country Report-India / 2017 P a g e 50 | 61
12. To review the status of data base in the construction sector and to suggest ways and means to upgrade, augment and effectively maintain the same on institutional basis. 13. To study the best practices adopted worldwide and draw lessons for the Indian Construction Industry. 14. To suggest a policy framework for the increasing productivity and reducing construction costs, in order to ensure the healthy development of the construction sector after examining/ reviewing of the above mentioned areas and the existing regulating framework . 15. To recommend the measures for self-regulation for the constituents of the Construction Industry. 16. To evolve suitable mechanisms to ensure implementation of the recommendations of this Group during the twelfth plan period. 17. To examine any other mater considered important by the Steering Committee.
II APPROACH
It is note worthy to mention, that the present day Government having recognized the need to
develop and improve the overall physical infrastructure, is actively taking appropriate
measures to improve the functioning of Construction Industry. Growth and development of
the physical infrastructure is directly related to the growth of the development of National
Economy. Construction is inherent to infrastructure development, and the objectives defined
above were intensively deliberated by the Steering Committee and six associated Working
Groups were constituted, to work on specific areas such as:-
1. Regulatory Framework including self regulation & issues leading to time &
cost over runs.
2. Procurement systems & dispute resolution system.
3. Human Resource Development.
4. Institutional financing.
5. Quality standards & Environment Issue.
6. Research & Development.
22nd AsiaConstruct Conference /Country Report-India / 2017 P a g e 51 | 61
The Chapter on Construction, therefore has been structured to encompass the issues,
impediments, their solution & good practices, which could be emulated with respect to
above defined key areas, another section has been included, articulating the actionable
points & identifying stakeholders.
Keeping in view the continued thrust in several sub-sectors of the physical infrastructure such
as, Transportation, Irrigation, Housing, Urban Utility, Civil Aviation, Agriculture, Power
Generation, Water Conservation & Management and Power & Energy, the Steering
Committee evolved major recommendations, which need to be instilled in the National Plan.
The approach of the Working Groups was focused towards the capacity building of
Construction Industry, both in terms of quality and quantity to handle the substantial work
load, that is confronting the Construction Industry. The major issues of challenge therefore,
were identified are:-
Overall Vision
With the slated investment of over US $ 1 Trillion or Rs.63910 billion (INR) to build the
Physical Infrastructure in the Nation, thereby raising the quality of life of citizens, giving a
boost to the National Economy, & generating employment, the construction sector would
play a major role during the 12th Plan.
Effective management of the sector & mitigation of the bottlenecks & impediments, both in
the regulatory systems and also in the working dynamics of the sector shall be essential to
achieve the targets.
This would involve Institution building, systemic improvements to be instilled & creating a
holistic approach to bring in required reforms to convert the rule bound & rigid structure
administering the sector, to a more meaningful, vibrant & efficiently run entity.
The reforms to be brought in need to be sustainable & must spring from within as well.
Since the sector covers a wide variety of economic activities including construction of
houses & buildings, Transport structures, energy systems, Petrochemicals, Industry &
several more, the issues affecting the performance to this sector are both generic, and
specific to the respective sub sectors.

22nd AsiaConstruct Conference /Country Report-India / 2017 P a g e 52 | 61
With an average annual value of asset creation being Rs.415,000 Crores and an employment
of over 41 Million citizens the sector has many complexities, needing resolution & therefore
the approach to meet the planned growth should be to handle the generic issues, which need
to be looked into very urgently.
It is noteworthy to mention, that with the present capacity, as defined above the targets laid
down may fall short by 45%. It is therefore necessary to critically examine following areas &
do the stock taking.
· Human Resource Development
The key to the sustainable & robust growth of any sector in the National Economy is the
Human Resource. With over 41 Million citizens under direct employment of construction
entities, the sector has the distinction of being the second largest employer.
A miniscule proportion (5.65%) of this strength has the benefit of structured training &
education, keeping the activity under low value/ low productivity tag.
The thrust, therefore needs to be given on creation of Institutions & Institutional frame work
along with provision of Institutional resources to meet the requirements of HRD.
Training, Skill up gradation, & certification of skills need to be taken up vigorously,
where the Government & Industry have to join hands. The resources to meet the
monetory requirements could be channeled through welfare cess & PF deposits as well
as from the training funds earmarked under various state & centrally sponsored
schemes.
While developing the Institutions & creating infrastructure for the Human Resource
Development, some novel actions could be taken, such as
a) Declaring Construction sites as places of learning.
b) Introducing mandatory internship for engineers, post or during their education.

22nd AsiaConstruct Conference /Country Report-India / 2017 P a g e 53 | 61
Mere provision of financial resources may not attain the purpose if the training infrastructure
is lacking, & therefore training programmes to groom the trainers & Institutional provisions
need to be placed in position.
Even a fresh crop of contractor would need formal training to meet the demands.
· Regulatory Frame Work
The regulatory framework governing the construction sector definitely needs toning up in the
12th Plan period.
Enacting a unified set of provisions leading to enactment of a construction law would be a
major necessity.
Another important aspect is to harmonize the central & state level legislations to create an
improved & hassle free operating climate for construction entities.
With the size & diversity of operations in the sector, a fair amount of self regulation would
also be needed to be practiced. Systemic structure, therefore would be evolve to enable the
Industry to exercise self regulation, in several areas.
The 12th Plan shall recommend such measures and also the formation and empowerment of
Institutions to facilitate ingress of this measure.
· Procurement Practices
For effective & transparent performance of the service providers, the toning up of the
Procurement Systems, prevalent in the Nation, shall be another thrust area in the 12th Plan.
Following steps would be taken.
· Adoption & periodic up gradation of standard contracting conditions.
· Adoption & periodic up gradation of works manuals

22nd AsiaConstruct Conference /Country Report-India / 2017 P a g e 54 | 61
The focus shall be on introducing the harmonized, equitable & transparent provisions to
arrest & eliminate the time & cost over runs in the project execution.
· Dispute Resolution
Another irritant in effective project & contract execution is the delayed & amorphous dispute
resolution systems being practiced.
With over Rs. 135,000 Crores investments held up in the contractual disputes & an overage
period of resolution being 15 years, the dispute resolution mechanism in the country are a
major contributor to the time & cost overruns of the project & a retarder to the progress.
The focus of the 12th Plan would be to insure implementation of following.
i. Institutional mode of Dispute Resolution in place of Ad-hoc mode.
ii. Implementation of the Indian Arbitration & conciliation Act 1996.
During the 12th Plan another vital action would be to educate the stake holders in these
aspects.
· Quality & Standards
Construction being a capital intensive venture, the stress on quality of the built products
would be another prime objective of the 12th Plan.
Construction Methodologies, products, and the eventual delivery would be benchmarked to
become comparable to the International Standards. Another important area of action during
the 12th Plan shall be to empower the standard Institutions.
To accomplish the task, Institutions shall be established & existing Institutions would be
empowered and their functioning be harmonized.
· Environment

22nd AsiaConstruct Conference /Country Report-India / 2017 P a g e 55 | 61
Construction activities are known to be the biggest energy consumers & have a profound
impact on the environment.
Starting from mining of natural resources to building the end product, substantial pollution is
created. The thrust of the 12th Plan would also be on
· Adhering to the Environmental Protection laws by construction Industry in a manner
thet the progress is not retarded.
· Making “Green Construction” a major thrust area.
· Research & Development
Ingress & Introduction of new & smart technologies to reduce the costs & time for execution
of the Projects, shall be another thrust area during the 12th Plan.
Presently little investment is made in primary R&D initiatives, specially when compared with
the volume of work done annually.
During the 12th Plan period the thrust areas shall be.
i. Focus of Innovations.
ii. Strengthening the R&D Institutions & facilitating establishment of new Institutes.
iii. Incentivizing the R&D & Innovating initiatives.
· Mechanization of Work Practices.
The functioning of construction sector is primarily manual leading to low value addition,
poor quality of products, and also longer time for completion.
Mechanization of operations, though gaining popularity, yet needs larger thrust. This would
be another area of attention during the 12th Plan period.
Plan period would see
- Establishment of Equipment Banks.
- Better fiscal concessions for manufacturers of construction equipment, thereby
reducing costs.

22nd AsiaConstruct Conference /Country Report-India / 2017 P a g e 56 | 61
- Availability of trained operating & maintenance personnel.
· Project Exports
Construction Industry in India is generally an in bound Industry, with a very small
contribution to the National Economy through Project exports.
At present only 1.85% of the total output comes from projects & need substantial rise.
During the 12th Plan period, Project export shall be another thrust area & following actions be
taken.
- Generating more business for Indian construction companies through G to G
interactions & bilateral treaties.
- Provision of better fiscal incentives to the project exporters both for business
development & execution initiatives.
· Institutional Financing
Institutional Financing is the key to smooth & efficient implementation of construction
projects & following shall be the thrust initiatives during the 12th Plan.
- Raising the share of Institutional lending from 1.5% to at least 5% and more to
improve the liquidity of service Providers.
- Encouraging Institutions to resort to innovative products to meet the equity & debt
provisions for PPP projects.
- Creating & adopting Insurance & non Insurance risk assessment & mitigation
products
- Provision of working capitals for start up ventures & entrepreneurs in construction
Industry.
- Establishing a nodal construction Development Bank to meet all such needs.

22nd AsiaConstruct Conference /Country Report-India / 2017 P a g e 57 | 61
Establishing Institutions, nodal bodies, & facilitating Interaction among all stake
holders.
Construction activities are undertaken by several Ministers, PSUs & also the developers from
the corporate sector.
The most important action, to be taken during the 12th Plan period, shall be to ensure a
seamless coordination among all the Project execution & Project owning agencies.
Needless to mention empowered commissions, regulators and such Organs would be
established to ensure implementation of the Plans thus laid down.
III RECOMMENDATIONS
The development of recommendations took in cognizance the issues listed above,
needing address and encompassed existing impediments/limitations and relevant
mitigation measures, having recognized that, the Construction Industry has a great
contribution potential to the overall National Economy, having displayed consistent
growth trend of around 8% during last plan period. These include the macro
recommendations, which require policy intervention at Central and State
Governments level, action by stakeholders, and certain implementation models at
gross root level, which may be elicited as examples for detailing a blue print for
action.
i) Review of present procedures of procurement of projects & services including dispute
resolution mechanisms, and quality issues and evolve measures for improvement,
particularly in view of the increasing privatization in infrastructure sector. The
Steering Committee recommends following:-
a. The Contract Conditions being used by various Project Authorities in the
Country, whether in Public or Private Sector, should be harmonized.
The recommendations issued by the Ministry of Statistics and
Programme Implementation in this regard, must be implemented
fully by all Project Owners in the Country. This would require
Government’s intervention to convert guidelines of MOSPI into specific
directions for all Public Agencies/ Undertakings/Organizations. The

22nd AsiaConstruct Conference /Country Report-India / 2017 P a g e 58 | 61
recommended guidelines on contract conditions & also the model works
manual are hosted on the web site www.cidc.in.
b. For the Public Private Partnership models, the Model Concession
Agreement developed by the Planning Commission for the Road &
Highway Sector, could be used as a base model and modifications could
be made to cater to other sub-sectors, as well.
c. Necessary provisions in the procurement system, be made to ensure that
standard quality certification (third party) systems are adhered to.
Some system giving incentives for timely completion and good
performance by concerned construction agencies be suitably introduced.
A system may also be developed and promoted to facilitate small and
medium construction companies to share services and available plants and
machinery at equipment banks. In fact similar systems have already been
introduced in several highway construction projects of Maharashtra State
Road Development Corporation.
d. The emphasis must be laid on Institutional Arbitration system, instead of
Ad-hoc system, as is being followed presently. The arbitration should be
in line with Indian Arbitration and Conciliation Act 1996.
e. To minimize “disputes” leading to time and cost overruns proper project
planning process should be encouraged and DPRs may be completed
before technical sanction.
f. Suitable institutional modifications be introduced for risk mitigations.
New insurance products should be developed.
ii) A National Plan for training and certification of Construction personnel at all
levels should be developed and implemented.
The plan should include initiating a system of ‘Graded Certification’ depending upon
levels of proficiency achieved. To meet shortage of available trained manpower in

22nd AsiaConstruct Conference /Country Report-India / 2017 P a g e 59 | 61
certain urgently needed trades short terms courses may be introduced where ITI
courses are of long duration.
It is further recommended that some kind of Permanent Identification number be
granted to the workers, and a nationwide scheme of granting e-cards be launched for
effective availability of the benefits.
The construction sites could be designated as the learning centers & introduction of
mandatory Internship for the students of engineering programs both aat Diploma and
Degree level be made.
iii) Well defined and harmonized institutional financing systems be evolved to build the
capacity of Construction Industry.
iv) A comprehensive Draft Construction Law should be developed and the
Construction Law for India be enacted through wider consultations.
v) Present system of asset management should be reviewed at local/ state/ central
government levels and strengthened. A policy frame work ensuring mandatory
provision for maintenance of assets supported by adequate budgetary allocations
and trained manpower be set-up.
vi) A National strategy and policy framework focused particularly on productivity
enhancement and cost reduction be developed to match with envisaged work
load and delivery targets of various sectors and for sustainable development and
growth of construction industry.
Induction of new technologies, construction systems and energy efficient
materials (preferably based on waste recycling) should be adequately
emphasized in the development of national strategy for enhancing productivity
and efficiency and reducing cost of construction works. For rural roads sector,
there appears to be strong need for developing and introducing use of “marginal
materials” to enhance cost effectiveness of works.
It is therefore proposed, that a National Construction Research & Development
fund be created & an authority be constituted under the auspices of a nodal

22nd AsiaConstruct Conference /Country Report-India / 2017 P a g e 60 | 61
ministry to administer this provision. As an initial seed support a sum of Rs. 100
crores be allocated to persue these objectives
vii) An appropriate Management Information System should be developed and
implemented at National, Provincial and Local levels for construction industry.
An Institution be nominated as the repository of National Data Base for
Construction Industry.
viii) Systems & Institutions should be developed for expansion of network for
project export and attracting more foreign investment. Interactions with Indian
Missions abroad, should be intensified, through evolution of an Institutional
mechanism.
ix) A mechanism for registration of professional engineers need to be established
for which a nodal agency need to be identified. Intake in academic institutions
be regulated to mitigate declining trend in the availability of civil engineers
x) Taxation & Regulatory Systems should be revamped. Sectoral classification and
definition of Construction Industry should be established, as for taxation
purposes construction “is treated as “Industry” as well as “Service” The
Steering Committee recommends that construction be treated as Industry and
the existing definitional anomalies, where for certain sub-sectors of construction
sector, service taxes have been introduced, be removed.
xi) Institutional Arrangements be made to identify, prevent and mitigate the
effects of Natural Disasters. New programs should be taken as per guidelines
and programs announced by National Disaster Management Authority. The
Steering Committee recommends that following actions should be taken up on
priority.
g. To develop the Human Resources in Disaster Mitigation and disaster
resistant construction technologies and
h. Retrofitting Clinics and Disaster Identification Centres be set up in all
major settlements and districts falling in disaster prone regions

22nd AsiaConstruct Conference /Country Report-India / 2017 P a g e 61 | 61
xii) An Institutional mechanism need to be developed for continuous evaluation of
various economic parameters such as Construction Cost Indices and impact of
policies of other sectors having impact on cost of construction works.
xiii) A National Plan need to be developed for upgrading the prowesses of
Engineering Consultants and advisors, and should be implemented.
xiv) Adherence of standards should be ensured through relevant regulatory
provisions.
xv) A national plan to be evolved and implemented for entrepreneur development in
Construction Industry for raising the capability levels.
xvi) A conceptual plan to identify a nodal organization to implement and monitor
above should be formalized and implemented upon.
xvii) A national plan for insuring adherence to the Environment Protection Act
(2006) be developed and Energy Efficiency issues be addressed in conformity to
the Energy Conservation Act of 2001.