Embed Size (px)
Citation preview

Countingthe crowdTUDelft libraryR.J.M.MenkenStudent ID: 4488032Supervisor: Winnie Daamen


Countingthe crowd
TU Delft libraryby
R.J.M. Menken
Student number: 4488032Project duration: April 23, 2019 – June 17, 2019Thesis committee: Dr. ir. W. Daamen, TU Delft, supervisor
Dr. ir. Y. Yuan, TU DelftIr. R. P. Koster, TU Delft


Preface
This report is commissioned by the TU Delft library to research a solution for the people counting problem.This report serves as a recommendation for the TU Delft library with the best solutions for counting the in-and outflow and calculating the occupancy of the building. The in- and outflow and occupancy patterns aredescribed as well in order to give the TU Delft library the information about the patterns of the students thatuse the library.
I would like to thank Winnie Daamen for supervising me during this project and all the advice and feed-back she has given. I also would like to thank Yufei Yuan and Rolf Koster for the support and feedback theyhave given me during the project. The same counts for my fellow students Jarco Vianen and Luc Stappers forreviewing and giving feedback on my work.
R.J.M. MenkenDelft, June 17, 2019
iii

Summary
The TU Delft library is a frequently visited place. For the library it is important to know the occupancy to seewhen the maximum capacity is reached. The employees have tried to measure the occupancy with the use ofpeople counting sensors. However, these sensors are not accurate and deliver unreliable data and this needsto be improved. So the goal of this research is to provide the TU Delft library with an advice which consists of:
• A recommendation about how to use the data.
• A recommendation about the location of the sensors.
• A recommendation which sensors are needed.
A method to improve the information derived from the sensor measurements has been developed. Thishas been done by gathering the ground truth with manual counting sessions. The ground truth is used tocalculate the number of measurement errors. The relation between the measurement error and the numberof measurements done by the sensors have been determined for the inflow and the outflow. This resulted ina parabolic relation between the number of measurement errors and the number of measurements done bythe sensors. With an increasing number of measurements done by the sensors the number of measurementerrors first increased and started decreasing after a certain point.
The relation between the number of measurement errors and the number of measurements done by thesensors is exponential. That means that the number measurement errors increased exponentially with anincreasing number of measurements done by the sensors.
The location to place the sensors have been reviewed as well. The current sensor setup can be improvedin two ways. The sensors are not mounted in an optimal way. This can be improved by mounting the sensorscloser to the doors and placing them horizontal, since the sensors are currently hanging in an angle whichmoves the coverage area further away from the door. Another option to improve the current setup is by closingthe door towards the coffee corner, since this door causes disturbing people motions underneath the sensors.
Other locations to place the people counting sensors have been considered. This resulted into an rec-ommendation to place the sensors outside above the entrance door. This spot provides the best setting tomeasure the in- and outflow, since this is the only people motion underneath the sensors.
If the recommended location to place the sensors is chosen by the TU Delft library new sensors are re-quired, because the current sensors are not suitable to be placed outside. Different sensors have been com-pared to each other. The sensor that is recommended is the FILR Brickstream 3D. This sensor has an accuracyof 95%. It can give the real time occupancy, in- and outflow information and it is suitable to be placed out-side. The V-Count 3D Alpha+ is another sensors that has been compared and is recommended if the sensoris placed inside. This sensors can give the real time occupancy, in- and outflow information as well. It hasan accuracy of 98% according to the manufacturer, but it is not suitable to be placed outside. Another sensorthat is recommended if the sensor is placed inside is the Irisys Gazelle. It can count real time and has anaccuracy of 99% according to the manufacturer. However, it is not suitable to be placed outside.
The last part of this research is to determine and compare the in- and outflow patterns in the TU Delftlibrary. These patterns have been determined for three different type of days, normal days, exam period daysand holidays. The in- and outflow in the highest during the exam periods and the lowest during the holidays.The times of the in- and outflow peaks are depended on the average time that students have lunch and dinner.So is the inflow the highest after lunch time between 13:00 and 14:00. The outflow is the highest before lunchtime between 12:00 and 13:00 and before dinner time between 17:00 and 18:00.
The occupancy patterns have been determined as well. It is not possible to calculate the exact occupancybecause of the difference in in- and outflow measurement errors. The improving functions are not reliable
v

vi Summary
enough to solve this problem. What can be said about the occupancy patterns is that the occupancy of thelibrary is the highest during the afternoon.

Contents
1 Introduction 11.1 Current situation at the library . . . . . . . . . . . . . . . . . . . . . . . . . . . . . . . . . . 11.2 Goal. . . . . . . . . . . . . . . . . . . . . . . . . . . . . . . . . . . . . . . . . . . . . . . . 31.3 Sub-Questions . . . . . . . . . . . . . . . . . . . . . . . . . . . . . . . . . . . . . . . . . . 3
2 Methodology 52.1 Review the current sensors . . . . . . . . . . . . . . . . . . . . . . . . . . . . . . . . . . . . 52.2 Gathering data . . . . . . . . . . . . . . . . . . . . . . . . . . . . . . . . . . . . . . . . . . 52.3 Improving the information derived from the data. . . . . . . . . . . . . . . . . . . . . . . . . 62.4 Locations . . . . . . . . . . . . . . . . . . . . . . . . . . . . . . . . . . . . . . . . . . . . . 62.5 Comparing to other sensors. . . . . . . . . . . . . . . . . . . . . . . . . . . . . . . . . . . . 62.6 Analysing the data . . . . . . . . . . . . . . . . . . . . . . . . . . . . . . . . . . . . . . . . 6
3 Sensor Review 74 Data analysis 9
4.1 Gathering data . . . . . . . . . . . . . . . . . . . . . . . . . . . . . . . . . . . . . . . . . . 94.1.1 Pilot . . . . . . . . . . . . . . . . . . . . . . . . . . . . . . . . . . . . . . . . . . . . 104.1.2 Counting results . . . . . . . . . . . . . . . . . . . . . . . . . . . . . . . . . . . . . . 104.1.3 Comparing the ground truth to the sensor data . . . . . . . . . . . . . . . . . . . . . . 104.1.4 Responsible factors measurement error . . . . . . . . . . . . . . . . . . . . . . . . . . 11
4.2 Improving the data interpretation. . . . . . . . . . . . . . . . . . . . . . . . . . . . . . . . . 11
5 Location Review 195.1 Current location . . . . . . . . . . . . . . . . . . . . . . . . . . . . . . . . . . . . . . . . . 195.2 New location . . . . . . . . . . . . . . . . . . . . . . . . . . . . . . . . . . . . . . . . . . . 205.3 Recommendation . . . . . . . . . . . . . . . . . . . . . . . . . . . . . . . . . . . . . . . . . 21
6 Comparison of sensors 236.0.1 FILR Brickstream 3D Gen 2 . . . . . . . . . . . . . . . . . . . . . . . . . . . . . . . . 236.0.2 V-Count 3D Alpha+ . . . . . . . . . . . . . . . . . . . . . . . . . . . . . . . . . . . . 236.0.3 Irisys Gazelle 2 . . . . . . . . . . . . . . . . . . . . . . . . . . . . . . . . . . . . . . . 246.0.4 FootfallCam 3D Plus . . . . . . . . . . . . . . . . . . . . . . . . . . . . . . . . . . . . 246.0.5 Recommendation . . . . . . . . . . . . . . . . . . . . . . . . . . . . . . . . . . . . . 24
7 Analysing the data 277.1 In- and outflow patterns . . . . . . . . . . . . . . . . . . . . . . . . . . . . . . . . . . . . . 277.2 Comparing different type of days . . . . . . . . . . . . . . . . . . . . . . . . . . . . . . . . . 297.3 Calculating Occupancy . . . . . . . . . . . . . . . . . . . . . . . . . . . . . . . . . . . . . . 29
8 Discussion 339 Conclusion 35References 37A Appendix 39B Appendix 45
vii

1Introduction
The TU Delft library is a frequently visited place on the campus. According to the sensors above the entrancedoors, over 1.4 million people entered the library in 2018. It is open between 8:00 am and 0:00 am and duringexam periods the TU Delft library is opened until 2:00 am.
The library employees have difficulties precisely counting the number of people going in and out of thelibrary during different times of the day. These counts are made by several sensors placed in the building.However, the data delivered by those sensors is not accurate, because of an unknown measurement error.Based on the current measurements the outflow of people in the library is larger than the inflow.
These accurate counts are necessary for the library to have a clear view on the exact occupation. This isimportant to know because the capacity is limited during during the busy moment, for instance during theexam periods. It has been tried before by the library to find a proper solution in order to get the right data.However, the solution to this problem has not yet found. So a further research to his problem is necessary.
1.1. Current situation at the library
To find a solution to the inaccurate people counting sensors a research need to be done. Before this researchcan be started the current situation needs to be reviewed. This is done by a description of the layout of theentrance hall and the location of the sensors.
There is only one regular entrance with two doors to enter the library. Behind those doors is an entrancehall, marked blue in figure 1.1. From the entrance hall it is possible to go into three different rooms, namelythe Coffee corner (marked in orange), a room with some vending machines (marked in green) and the mainhall of the library. As can be seen in figure 1.1, the door for going into the coffee corner from the entrance hallis very close to the door for entering the building. Figure 1.2 shows the most common people motion in theentrance hall of the TU Delft library. All lines can be walked in both directions.
1

2 1. Introduction
Figure 1.1: Map of the library with the Entrance hall, coffee corner and room with vending machines highlighted.
Figure 1.2: The common people motion in the entrance hall of the TU Delft library.
The TU Delft library has currently four people counting sensors installed. Two of them are installed inthe entrance hall, one is installed above the stairs leading into the cone and the last is installed above theentrance of the silence and computer room. The counting of people entering and leaving the library build-ing is done with two sensors above the entrance doors. The data delivered by those sensors are not reliableenough. There is a significant difference in the amount of inflow and the outflow of people. In 2018 themeasured inflow was 1.476.526 people and the measured outflow was 1.543.925.[1] So there is a difference of-67.399 people. This means that either the inflow or outflow is not measured correctly, or both.
The TU Delft library wants to have more specific numbers about the occupation and in people flow pat-terns of the library at several moments. Because of the measurement errors made by the sensors is this notyet possible and this is why the TU Delft library commissioned for a research on the sensors. This researchshould lead to a better way to derive the in- and outflow information from the data that is more accurate thanthat is possible in the current situation. This can then be used to see patterns over the course of a day and to

1.2. Goal 3
calculate the occupation of the library.
1.2. GoalNow the problem description is clear, the goal for the research needs to be specified.
The goal of the client, the TU Delft library, is to answer questions about the in- and outflow patternsand the occupancy of the library during several moments of the day. To get this information, a good way tomeasure the real in- and outflow of people in the library needs to be determined. However, this is not yetpossible with the current sensor setup and this needs to be improved. And it is important to analyse the in-and outflow patterns during different moments. So this leads towards two main research questions that needto be answered:
• What needs to be improved regarding the sensor data and placement to provide the TU Delft librarywith good information about the in- and outflow of people?
• What are the in- and outflow patterns at the entrance of the TU Delft library?
This means that the current sensors, the Count Cam MED[2], need to be evaluated. The locations wherethe sensors are placed need to be evaluated as well. Doing this should lead to an advice about the use ofsensors to count the people going in and out of the library. This advice needs to consist of:
• A recommendation about how to use the data.
• A recommendation about the location of the sensors.
• A recommendation which sensors are needed.
1.3. Sub-QuestionsIn order to answer the main research question and get to the advice, some sub-questions need to be answeredas well. The first sub-questions are about reviewing and improving the sensor setup. So those are necessaryto answer the first main research question.
• How is the data measured by the current sensors compared to the real in- and outflow?
• What factors are responsible for the measurement error?
• What needs to be done to improve the information derived from the data gathered by current sensorsso that it approaches the real values?
• What needs to be improved about the locations where the sensors are currently placed?
– What information do the sensors give at the current locations?
– Which locations are better to place the sensors in the TU Delft library?
• What are the advantages and disadvantages of different types of sensors?
The second main research question is to provide the TU Delft library with good information about the in-and outflow of people. Questions that need to be answered regarding this part of the research are:
• What is the pattern of people entering and leaving the library over a day?
• What is the difference in maxima of the in- and outflow graph, during different kind of days like holi-days, exam periods and normal days?


2Methodology
Now the goal of the research and with that the research questions are known, the methodology to answer thequestions can be specified. It will consist of the following parts:
• 2.1 Review of the sensors: A literature study to get a better view on the currently used sensors
• 2.2 Gathering data: Data collection to quantify the measurement error and the data can be used for thenext step
• 2.3 Improving the information derived from the data: in this step a data analysis will be done to deter-mine a method to improve the measured data.
• 2.4 Location review: based on the observations done during the data gathering phase, the locations ofthe sensors will be reviewed.
• 2.5 Comparing to other sensors: A literature study in other types of sensors will be done.
• 2.6 Analysing the data: during this step a data analysis of the information about the in- and outflow ofthe library will be done.
2.1. Review the current sensorsThe first sub question is about the difference of data measured by the sensor and the real values. Before deter-mining this difference, it is important to find information about the current sensors. Important informationis about the theoretical accuracy of the sensors, the way that they should be mounted and the way the peopleget counted by the sensors. The information about how the sensors should be mounted and the way howthey count people is used to check if the sensors are mounted correctly in the current situation and this in-formation is used in the location review as well.
2.2. Gathering dataIn order to determine the measurement error, a value to compare the measured value to needs to be deter-mined. This is the so-called ground truth and is obtained by manual counting. The manual counting is donein multiple sessions of an hour. The minimal time frame to obtain the data measured by the sensors is onehour, so that is the reason for counting sessions of an hour. During such a session the people going into thebuilding and people leaving the building are counted. This is done for both sensors in the entrance hall atthe same time, because it is not possible to see the data of both sensors separately. The data measured by thesensors ins stored in an online data base that is managed by Dancount, the company that produced the sen-sors[1]. To check if the plan is appropriate, a pilot is done. The minor flaws in the plan can be noted duringthis pilot and those are improved afterwards.
5

6 2. Methodology
2.3. Improving the information derived from the dataWhen the ground truth of the in- and outflow of people is known, the data measured by the sensor is com-pared to this number. The difference can be calculated and expressed into a percentage. This percentage iscalculated by the number of errors divided by the ground truth. After this is done, the possible factors re-sponsible for the difference are given. Those are based on observations done during the counting sessions.
After determining the factors, more measurements under different circumstances are done. This canprove if and how much those factors matter. A possible factor is the number of people that pass the sensor atthe same time, because the sensor might recognize two people as one. To prove if this is true manual countat busy and quiet moments need to be done.
The data that is gathered in the gathering data step has to be analysed to improve the information derivedfrom the measured data by the sensors. It is necessary to formulate a function which uses the data measuredby the sensors as input. The output will have to approach the real values as closely as possible. To do thisthe relation between the number of counts done by the sensors and the percentage and number of measure-ment errors is determined. Then with the use of Python the functions can be fitted and the best option isdetermined with the coefficient of determination (R2). This fitted function is used to make the function thatimproves the information derived from the measured data by the sensors.
2.4. LocationsAnother way to get more representative data that should be considered is the location of the sensors. First thecurrent sensor setup is reviewed and possible improvements are determined. Then other suitable locationsfor the sensors need to be searched for. When this is done the advantages of these locations need to bespecified. And the last step is to compare the advantages and disadvantages to give a recommendation.
2.5. Comparing to other sensorsThis step in the research is to do a literature study that compares different sensors, which are based on differ-ent techniques[3]:
• Infra-red
• Cameras
• WIFI
The focus of this literature study is on the advantages and disadvantages of the different techniques. Thefirst step is searching for information about the different sensors. Once this is done, a comparison betweendifferent sensors can be made. This is done by comparing the advantages and disadvantages to each other.Then the recommendation about which sensor to use is given.
2.6. Analysing the dataDuring this step the data measured by the sensors is used to determine the pattern of the in- and outflowof people in the library. The first thing that is analysed is the pattern of people entering and leaving overthe course of a day. Important for the library to know about the pattern is to see when and how much themaxima and minima of the in- and outflow are. And if the patterns are similar during different types of days,like normal days, holidays and exam periods. The last thing is to calculate occupancy of the library anddescribe the occupancy pattern over the course of the day.
3Sensor Review
To answer a part of the first main research question: What needs to be improved regarding the sensor dataand placement to provide the TU Delft library with good information about the in- and outflow of people?,it is necessary to review the current sensors. What is important is a good view of the theoretical accuracyof the sensors in order to check if the current measurement error is due to the sensor or if other factors areresponsible. The way that the sensors should be mounted is important to know, because this could be areason for the measurement error as well. And the way that the sensor measures people going in and out ofthe building is important to know, in order to determine how the sensors should be placed.
The sensors that are currently used in the TU Delft library are the CountCam MED, fabricated by theDanish company Dancount[4]. It is a overhead people counter, that means that it count people walking un-derneath it. The sensor uses a camera to identify people passing it. It can count multiple people passing thesensor in the same or opposite direction. The sensor should be mounted on the ceiling above the point wherethe measurement is needed. In normal conditions, the sensor has a counting accuracy of 95%.
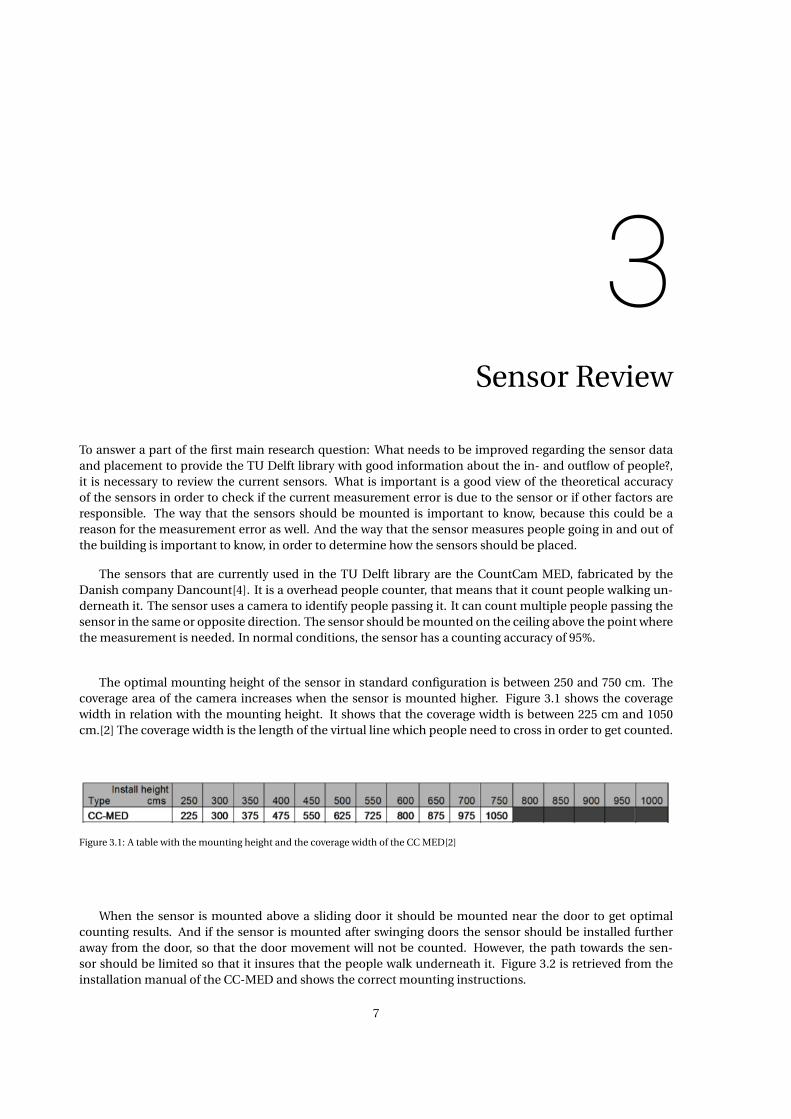
The optimal mounting height of the sensor in standard configuration is between 250 and 750 cm. Thecoverage area of the camera increases when the sensor is mounted higher. Figure 3.1 shows the coveragewidth in relation with the mounting height. It shows that the coverage width is between 225 cm and 1050cm.[2] The coverage width is the length of the virtual line which people need to cross in order to get counted.
Figure 3.1: A table with the mounting height and the coverage width of the CC MED[2]
When the sensor is mounted above a sliding door it should be mounted near the door to get optimalcounting results. And if the sensor is mounted after swinging doors the sensor should be installed furtheraway from the door, so that the door movement will not be counted. However, the path towards the sen-sor should be limited so that it insures that the people walk underneath it. Figure 3.2 is retrieved from theinstallation manual of the CC-MED and shows the correct mounting instructions.
7

8 3. Sensor Review
Figure 3.2: The mounting instructions for the CC-MED.[2]
The coverage area is the area underneath the sensor, in which it can detect people movement. A virtualline is drawn in that area. If a person crosses that line it will be counted by the sensor as a movement in or outof the building. Figure 3.3 shows the coverage area with the virtual line in the middle. This makes in clear whypeople should be guided to walk underneath the sensor in order to get counted by it. If the sensors are placedtoo far from the door, it is possible to walk around the coverage area and still enter or leave the building.
Figure 3.3: The coverage area of the CC MED[2]
The sensors are made for indoor use. So the sensors are not suitable to be placed outside.So this concludes this chapter about the review of the currently used sensors. The information in this
chapter can be used for determining the factors responsible for measurement errors and for the locationreview.
4Data analysis
This chapter contains the gathering data and improving the information derived from the data steps of themethodology described in chapter 2. First the data that is gathered during the manual counting sessionsis compared to the ground truth. Then the responsible factor for the measurement error are clarified. Andfinally the function to improve the information derived from the measured data by the sensors is determined.
4.1. Gathering dataSo the first step is to gather the ground truth of the in- and outflow of people. That is done by manual count-ing the people going in and out of the building. The ground truth is needed to calculate the measurementerror of the sensors, which then can be used for determining the best method to improve the informationderived from the measured data by the sensors.
The counts that are be done during the manual counting sessions are recorded by the use of a data-loggingsoftware that stores the keyboard buttons pressed including a time stamp in a text file, the f button for theinflow and the j for the outflow. By the use of a python script that counts the f and j letters in the text file, thein- and outflow numbers can be counted.
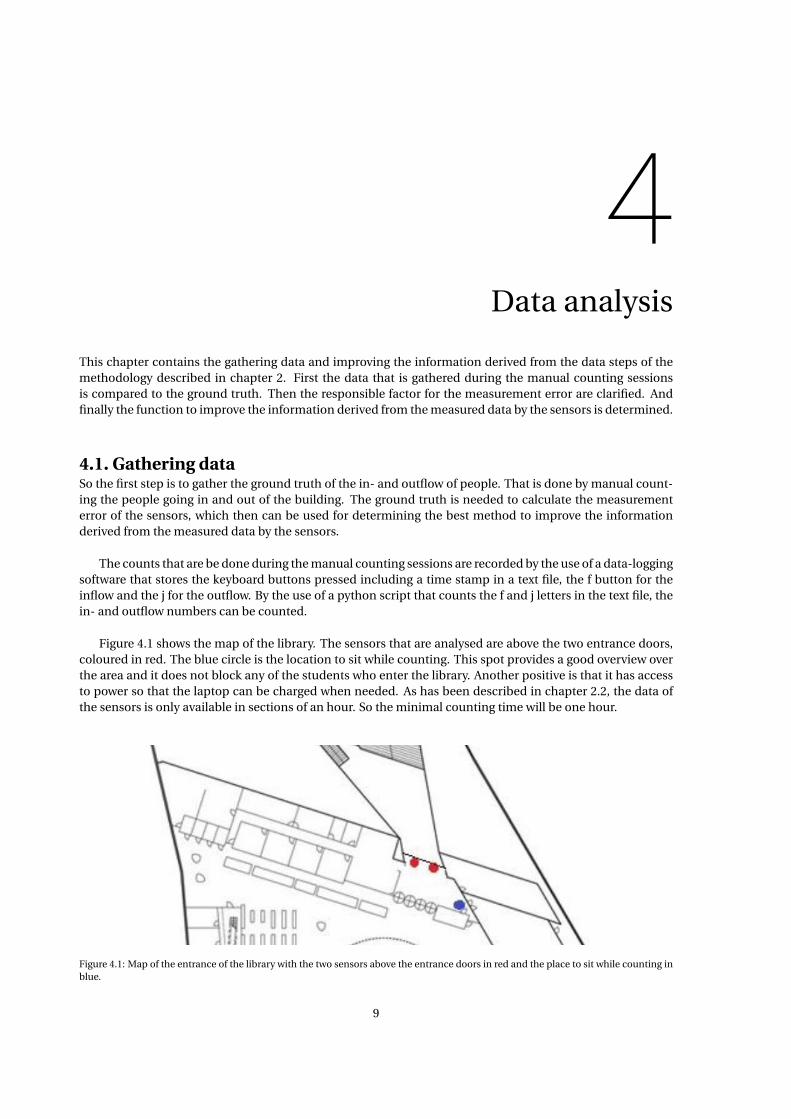
Figure 4.1 shows the map of the library. The sensors that are analysed are above the two entrance doors,coloured in red. The blue circle is the location to sit while counting. This spot provides a good overview overthe area and it does not block any of the students who enter the library. Another positive is that it has accessto power so that the laptop can be charged when needed. As has been described in chapter 2.2, the data ofthe sensors is only available in sections of an hour. So the minimal counting time will be one hour.
Figure 4.1: Map of the entrance of the library with the two sensors above the entrance doors in red and the place to sit while counting inblue.
9

10 4. Data analysis
4.1.1. PilotThe pilot has taken place on Friday May 10, 2019 between 12:00 and 13:00. The results for the counting ses-sion were: 369 walking people into the library and 327 walking people out of the library. The measured inflowis 396 people and the measured outflow is 364 people. The difference between the measured values and thecounted values is 27 for the inflow and it is 37 for the outflow as can be seen in table 4.1.
During the first counting session tally marks were used to count the people walking in and out of the li-brary. However, this was not the best idea to use for counting the people. By writing down the tally marks thefocus is switched away from the door. When it is busy it is easy to miss some of people walking in or out ofthe library. So it is better to find a way of counting people without having to switch focus from the door, likea clicker or software on a laptop. So from this point the data-logger software is used to record the number ofpeople walking in and out of the entrance door of the TU Delft library.
4.1.2. Counting resultsAfter the pilot, more counting sessions have been done. The results of the number of people walking in andout of the TU Delft library are noted in table 4.1.
Table 4.1: Results of the Manual counting sessions.
Date & Time Counted in Counted out10-5-2019, 12:00 - 13:00 369 32713-5-2019, 11:00 - 12:00 232 17614-5-2019, 11:00 - 12:00 264 20615-5-2019, 11:00 - 12:00 322 24615-5-2019, 12:00 - 13:00 409 49716-5-2019, 17:00 - 18:00 297 41717-5-2019, 15:00 - 16:00 225 25020-5-2019, 15:00 - 16:00 403 34521-5-2019, 11:00 - 12:00 303 28421-5-2019, 12:00 - 13:00 369 47323-5-2019, 17:00 - 18:00 262 39828-5-2019, 17:00 - 18:00 232 4125-6-2019, 13:00 - 14:00 486 3726-6-2019, 13:00 - 14:00 504 406
4.1.3. Comparing the ground truth to the sensor dataTo keep track of the results of the different counting sessions and the data measured by the sensors in thesame periods, a table is made. Table 4.2 shows the data measured by the sensors and the results of the manualcounting session. It also shows the difference between the measured data by the sensors and the groundtruth obtained during manual counting sessions. The last two columns of the table show the percentage ofmeasurement errors in comparison to the ground truth. So this means that the measurement error values aredivided by the counted values and multiplied by 100%.
Table 4.2: Results of the Manual counting sessions compared with the measured values.
Date & Time Measured in Measured out Counted in Counted out Error in Error out Percentage error in Percentage error out10-5-2019, 12:00 - 13:00 396 364 369 327 +27 +37 7,3% 11,3%13-5-2019, 11:00 - 12:00 258 204 232 176 +26 +28 11,2% 15,9%14-5-2019, 11:00 - 12:00 274 229 264 206 +10 +23 3,8% 11,2%15-5-2019, 11:00 - 12:00 346 264 322 246 +24 +18 7,5% 7,3%15-5-2019, 12:00 - 13:00 423 494 409 497 +14 -3 3,4% -0,6%16-5-2019, 17:00 - 18:00 341 607 297 417 +44 +190 14,8% 45,6%17-5-2019, 15:00 - 16:00 260 285 225 250 +35 +35 15,6% 14,0%20-5-2019, 15:00 - 16:00 465 426 403 345 +62 +81 15,4% 23,5%21-5-2019, 11:00 - 12:00 339 321 303 284 +36 +37 11,9% 13,0%21-5-2019, 12:00 - 13:00 390 497 369 473 +21 +24 5,7% 5,1%23-5-2019, 17:00 - 18:00 310 589 262 398 +48 +191 18,3% 48,0%28-5-2019, 17:00 - 18:00 250 545 232 412 +18 +133 7,8% 32,3%5-6-2019, 13:00 - 14:00 490 409 486 372 +4 +37 0,8% 9,9%6-6-2019, 13:00 - 14:00 488 429 504 406 -16 +23 -3,2% 5,7%

4.2. Improving the data interpretation 11
A conclusion that can be drawn from table 4.2 is that the sensors usually measure more people walkingin and out of the library than that is actually the case. Only during two hours where a counting session tookplace was the error negative, one for the outflow during session 15-5-2019, 12:00 - 13:00 and one for the inflowduring session 6-6-2019, 13:00 - 14:00. This is not what is expected from people counting sensors. Usuallythese kind of sensors miscount some people instead of counting extra people. Reasons for this will be dis-cussed later on in this chapter.
Three counting sessions have been done between 17:00 and 18:00. During these counting session theerror for the outflow is larger than during the other counting sessions. A reason that is responsible for thisfact is the behaviour of people that differs between different times of a day. This is explained in more detail atthe end of this chapter.
4.1.4. Responsible factors measurement errorAn important factor that might be responsible for the measurement error is the door towards the coffee cor-ner, immediately next to the entrance door, see figure 1.1 in Chapter 1, Introduction, for an overview of theentrance hall. The door is frequently used by students and even some queues appear when multiple peoplewant to go through the door at the same time. Some of those people pass the sensor and it is unclear whetherthey are counted or not. This explains the reason why these sensors count more people walking in and out ofthe building, than that is actually the case. Since some of the people walking through this door are countedalthough they did not enter or leave the building.
In order to prove if this door is responsible for the measurement error, some counts with the door closedhave to be done. The results of those counting sessions in comparison with the data measured by the sensorsare shown in table 4.3.
Table 4.3: Results of the Manual counting sessions compared with the measured values, when the door towards the coffee corner wasclosed.
Date & Time Measured in Measured out Counted in Counted out Error in Error out Percentage error in Percentage error out22-5-2019, 11:00 - 12:00 357 259 351 240 +6 +19 1,7% 7,3%22-5-2019, 12:00 - 13:00 410 614 441 585 -31 +29 -7,6% 4,7%
The mean measurement error for the inflow is -2.7% and the mean measurement error for the outflowis 6.4%. These values can be compared to the average measurement error that has been determined in thenormal situation. For the inflow is it 7.3% and for the outflow is the average measurement error 9.0%. Theseaverages are calculated for only the counting sessions between 11:00 - 12:00 and 12:00 - 13:00. What can beconcluded is that the measurement error is slightly lower when the door was closed. This indicates that theflow of people through the door towards the coffee corner disturbs the sensor measurements. Only two mea-surements have been done with the door closed, this is not enough to prove if the door is fully responsible.However, it gives an indication so it will be assumed that the different motions underneath the sensor causedby the door are responsible for a part of the measurement error.
Another factor responsible for the measurement error of the sensors is the way that the sensors are mounted.The first thing that stands out is that the sensors are placed too far away from the doors. The doors lead-ing into the hall of the library are sliding doors. As has been discussed in chapter 3, the sensors should bemounted close to a sliding door and if this is not possible the passage way underneath the sensors should belimited so that all people walk under neath the sensors. This has not been done in the current situation. Thesecond thing that stands out is that the sensors are placed flat on the ceiling. However the ceiling is sloped,so the sensors are placed in an angle. This means that the coverage area of the sensors is further away fromthe door than that it would be if the sensors are placed flat. This factor also leads to the fact that more peoplemotions are possible underneath the sensors than only the in- and outflow of people in the library building.
4.2. Improving the data interpretationThe data that is gathered is plotted, so that it is easier to find a certain pattern in the values. Different colourshave been used for the dots to show the time slots in which the values were gathered.

12 4. Data analysis
The first plot that is made is figure 4.2. It shows the pattern between the ground truth and the valuesmeasured by the sensor. Ideally those values are on the line y = x, so that the measurement error is 0. However,almost all values lay above this line. That means that the values measured by the sensors are higher thanthe ground truth. So More people are measured by the sensors than that actually enter or leave the librarybuilding. The conclusion that can be drawn from this figure, is that the sensors generally count more peoplethan that is actually is the case. Another thing that can be concluded from this figure is that the measurementerror is larger for the outflow than the inflow, especially for the outflow values between 17:00 and 18:00.
Figure 4.2: The ground truth on the x-axis and the measured values by the sensors on the y-axis. Left: inflow. Right: outflow.
The next plot that is made is figure 4.3, it shows the measured values by the sensors on the x-axis and thepercentage of measurement error on the y-axis. This percentage is calculated by dividing the measurementerror by the amount of measurements made by the sensors. And figure 4.4 shows the measured values bythe sensors on the x-axis and the number of measurement errors on the y-axis. What can be seen in thefigures is that for the inflow the measurement error decreases when more measurements are done by thesensors. For the outflow happens the opposite, namely the measurement error increases when the numberof measurements done by the sensors increase. Possible reasons for this relation will be given after the exactrelation has been determined.
Figure 4.3: The measured values by the sensors - Percentage of measurement errors. For the inflow on the left and outflow on the right.

4.2. Improving the data interpretation 13
Figure 4.4: The measured values by the sensors - Number of errors made. For the inflow on the left and outflow on the right.
Figure 4.3 and 4.4 can be used to determine a relation between the measured values by the sensors andthe measurement error. Which then can be used to improve the information derived from the sensor mea-surements.
In order to do this different relations have been fitted in the graphs. This has been done with the use ofthe linregress and curve_fit package in Python. Then the different fits can be compared to each other. Thiscomparison has been done by calculating the Root mean square error and the coefficient of determination.The Root mean square error can be used to compare the functions fitted in the same graph and the coefficientof determination can be used to give an overall comparison between the fitted plots.
First the fitted functions for figure 4.3 have been made. The functions for the inflow are shown in table4.4 and the functions for the outflow are shown in table 4.5. The plots of these fitted functions are shown inappendix A.
Table 4.4: Fitted functions for the inflow of figure 4.3 with the root mean square error and coefficient of determination
Type of function Function Root mean squared error R^2Linear -0.0324 * x + 19.3 4.46 0.261Parabola -0.000276 * x^2 + 0.171 * x - 16.5 4.18 0.352Exponential - 1.01 ^x + 14.5 4.32 0.308Logarithmic 71.1 - 10.8 * log(x) 4.56 0.230
Table 4.5: Fitted functions for the outflow of figure 4.3 with the root mean square error and coefficient of determination
Type of function Function Root mean squared error R^2Linear 0.0372 * x - 1.45 8.22 0.249Parabola 0.000376 * x^2 + -0.268 * x + 54.2 6.16 0.578Exponential 1.01 ^x + 3.37 7.18 0.426Exponential 2.65e-32 * x ^11.9 + 9.56 5.63 0.647
The conclusions that can be drawn from table 4.4 and 4.5 it that the best function to describe the inflowrelation between the number of measurements done by the sensors and the percentage of measurementerrors is a Parabola:
P =−0.000276X 2 +0.171X −16.5 (4.1)
And the functions to describe outflow relation between the number of measurement error by the sensors andthe percentage of measurement errors is an exponential function:
P = 2.65e −32X 11.9 +9.56 (4.2)
With:P: percentage of measurement error

14 4. Data analysis
X: Number of measurements done by the sensors
The reason that these are determined as the best functions is because the root mean square error is thelowest and the coefficient of determination is the closest to one. The inflow relation between the number ofmeasurements done by the sensors and the percentage of measurement error is parabolic. This means thatthe percentage of measurement errors first increases and after a certain point decreases. The main reasonthat the measurement error decreases is because of the low measurement error that occurred in the countingsessions between 13:00 and 14:00. The inflow was the highest in that hour, so that makes the relation betweenthe percentage measurement error decrease with a higher number of measurements done by the sensors.The outflow relation is exponential, so that means that means that the Percentage of measurement errorsstay about the same and after a certain point start increasing rapidly. The main reason for the exponentialrelation is that the percentage measurement error stays about equal for the most measurements that aredone. However the percentage of measurement errors is significantly higher in the counting sessions between17:00 and 18:00. And the outflow was the highest in this hour, so that makes that the relation is exponential.These functions have been visualized in figure 4.5.
Figure 4.5: The fitted line for the relation between the number of measurements done by the sensors and the percentage of measurementerrors. Left: inflow. Right: outflow
The same has been done for the relation between the number of measurements done by the sensors andthe number of measurement errors. Table 4.6 and 4.7 show the functions that have been fitted and the tablesshow the root mean square error and the coefficient of determination. The plots of these fitted functions areshown in appendix A.
Table 4.6: Fitted functions for the inflow of figure 4.4 with the root mean square error and coefficient of determination
Type of function Function Root mean squared error R^2Linear -0.0597 * x + 46.7 18.3 0.0666Parabola -0.00133 * x^2 + 0.923 * x – 125 16.7 0.226Exponential -0.970 ^x + 25.2 18.9 2.59e-07Logarithmic 131 + -18.1 * log(x) 18.5 0.0479
Table 4.7: Fitted functions for the outflow of figure 4.4 with the root mean square error and coefficient of determination
Type of function Function Root mean squared error R^2Linear 0.336 * x - 74.8 44.2 0.482Parabola 0.00214 * x^2 + -1.40 * x + 242 31.5 0.736Exponential 1.01 ^x + 6.24 30.4 0.755Exponential 4.82e-25 * x ^9.55 + 28.3 26.0 0.820
What can be concluded based on table 4.6 and 4.7 is that the best function to describe the inflow rela-tion between the number of measurements done by the sensors and the number of measurement errors is a
4.2. Improving the data interpretation 15
parabola:
N =−0.00133X 2 +0.932X −125 (4.3)
And the best function to describe the outflow relation between the number of measurements done by thesensors and the number of measurement errors is an exponential function:
N = 4.82∗10−25X 9.55 +28.3 (4.4)
With:N: Number of errorsX: Number of measurements done by the sensor
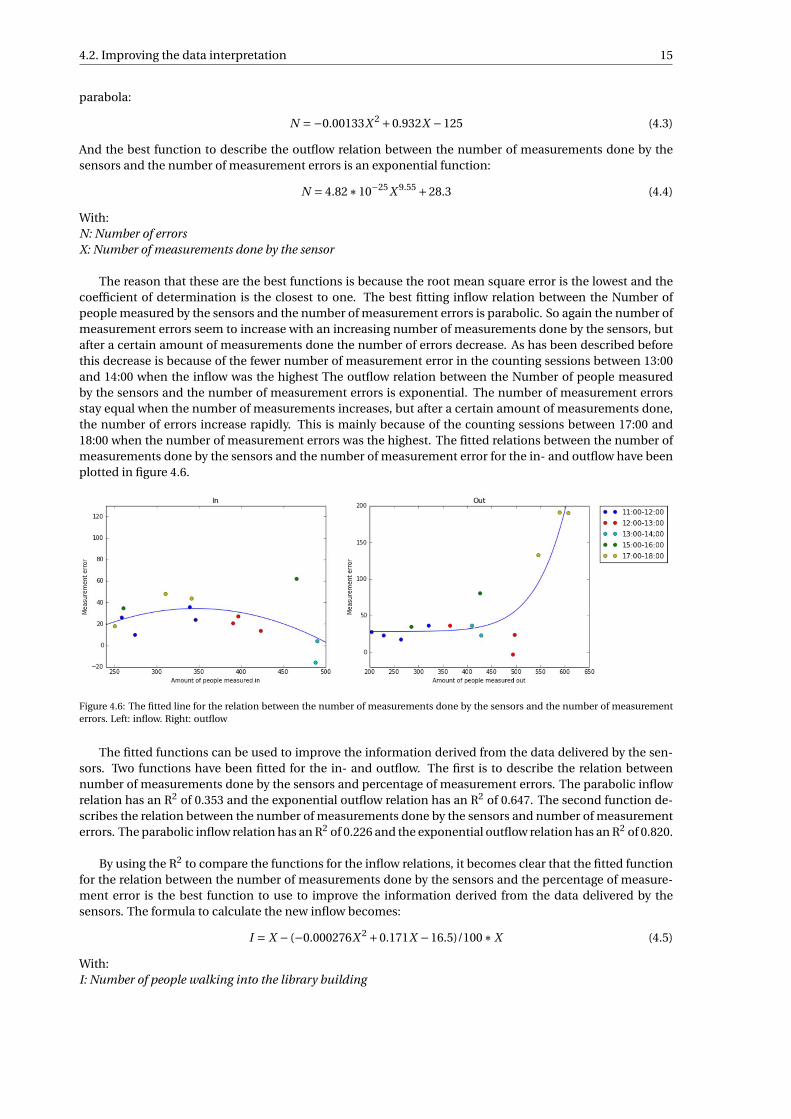
The reason that these are the best functions is because the root mean square error is the lowest and thecoefficient of determination is the closest to one. The best fitting inflow relation between the Number ofpeople measured by the sensors and the number of measurement errors is parabolic. So again the number ofmeasurement errors seem to increase with an increasing number of measurements done by the sensors, butafter a certain amount of measurements done the number of errors decrease. As has been described beforethis decrease is because of the fewer number of measurement error in the counting sessions between 13:00and 14:00 when the inflow was the highest The outflow relation between the Number of people measuredby the sensors and the number of measurement errors is exponential. The number of measurement errorsstay equal when the number of measurements increases, but after a certain amount of measurements done,the number of errors increase rapidly. This is mainly because of the counting sessions between 17:00 and18:00 when the number of measurement errors was the highest. The fitted relations between the number ofmeasurements done by the sensors and the number of measurement error for the in- and outflow have beenplotted in figure 4.6.
Figure 4.6: The fitted line for the relation between the number of measurements done by the sensors and the number of measurementerrors. Left: inflow. Right: outflow
The fitted functions can be used to improve the information derived from the data delivered by the sen-sors. Two functions have been fitted for the in- and outflow. The first is to describe the relation betweennumber of measurements done by the sensors and percentage of measurement errors. The parabolic inflowrelation has an R2 of 0.353 and the exponential outflow relation has an R2 of 0.647. The second function de-scribes the relation between the number of measurements done by the sensors and number of measurementerrors. The parabolic inflow relation has an R2 of 0.226 and the exponential outflow relation has an R2 of 0.820.
By using the R2 to compare the functions for the inflow relations, it becomes clear that the fitted functionfor the relation between the number of measurements done by the sensors and the percentage of measure-ment error is the best function to use to improve the information derived from the data delivered by thesensors. The formula to calculate the new inflow becomes:
I = X − (−0.000276X 2 +0.171X −16.5)/100∗X (4.5)
With:I: Number of people walking into the library building

16 4. Data analysis
X: Number of inflow measurements done by the sensors
By doing the same for the outflow relation, it becomes clear that the fitted function for the relation be-tween the number of measurements done by the sensors and the number of measurement errors is the bestfunction to use to improve the information derived from the data delivered by the sensors. The formula tocalculate the new outflow becomes:
O = X − (4.82∗10−25 ∗X 9.55 +28.3) (4.6)
With:O: Number of people walking out of the library building.X: Number of outflow measurements done by the sensors
What must be noted about these functions is that there will not be a high reliability for these functions.The reason for this is the number of measurements that are done in the research is too low. This will be furtherelaborated in the discussion in chapter 8.
Figure 4.2 is used to show the relation between the measured values and the ground truth. This figure hasbeen recreated to show the difference that the improving functions have made. This can be seen in figure 4.7.
Figure 4.7: The relation between the ground truth and the (improved) measured values.
What can be seen is that the improved point are closer to the y = x line. To show this the root mean squareerror between the ground truth and the measured values has been compared with the root mean squareerror between the ground truth and the improved values. Table 4.8 shows the values for the root mean squareerror(R.M.S.E). It is clear the the R.S.M.E. is significantly reduces for the improved values.
Table 4.8: The root mean square error between the ground truth and the (improved) measured values
R.M.S.E unimproved R.M.S.E. improvedIn 31.4 16.6Out 86.6 26.0
The relation that has been investigated is between the number of measurements done by the sensor andthe measurement error. An assumption for another relation for the measurement error is the relation be-tween the time of the day and the number of measurement errors that occur. This can be explained by thefact that the values for each hour in figure 4.3 and 4.4 are quite clustered. So are the measurement error foreach hour relatively similar. This give an assumption that there is a relation between the hour of the day andthe measurement error. However not enough measurements have been done to prove if there is a relation.See the discussion in chapter 8 for more explanation.
The fact that the measurement errors are different during the different hours can be explained by the dif-ferent behaviour patterns of people over the course of a day. So is the door towards the coffee corner and thetoilet hall not equally used over the day. As has been stated before the use of this door disturbs the measure-ments that are done by the sensors. So when the door is used more, the measurements get more disturbed.The exact behaviour patterns of the people have not been researched, so the exact cause for the difference in

4.2. Improving the data interpretation 17
results between the different time frames is not determined. See the discussion in 8 for a further elaborationon this topic.


5Location Review
In this chapter different locations to place the sensors are reviewed. The current location is reviewed first.Then new possible locations are considered. And to conclude this chapter, a recommendation about the bestpossible location is given.
5.1. Current locationThe TU Delft library has four people counting sensors installed in the current situation. Figure 5.1 shows thefour locations, one on the right in the silence and computer room, one above the stairs leading into the coneand two above the entrance doors. As has been stated before, the main focus of this research is on measuringthe in- and outflow. So only the two sensors in the entrance hall are considered. This means that the othertwo sensors are neglected.
Figure 5.1: Map of the library with the Entrance hall, coffee corner and room with vending machines highlighted.
The goal of placing the sensors in this location is to measure the in- and outflow of people in the library.However, this is not the only people motion in the entrance hall. And some of these motions are measuredas well and added to the in- or outflow numbers. Two factors of this sensor placement might enhance this
19

20 5. Location Review
problem. The first is that the sensors are not placed closely enough to the door. This makes it easier for thepeople who do not leave or enter the building to cross the sensors. The second factor is that the sensors areplaced flat on the ceiling. However, the ceiling has a slope, so that means that the sensors are hanging in anangle. This moves the measurement point further away from the doors and increases the likelihood for thepeople who do not leave or enter the building to cross the sensors’ coverage area and get counted.
It is possible to slightly improve the current sensor setup. The first step to do this is by moving the sensorscloser towards the door. As has been described in chapter 3, this is the best way to install sensors next to asliding door. The second step is mounting the sensors without and angle to the ceiling, so that the coveragearea is closer towards the door. The next step is to limit the passage way underneath the sensor to make itonly possible for people entering or leaving the building to walk through the coverage area of the sensors.The best way to do this is by locking the door towards the coffee corner. People who want to enter the coffeecorner will have to go through the doors in the main hall of the library. This option will decrease the differentpeople motions underneath the sensor, since the biggest disturbance, the people motion towards and fromthe coffee corner, will be gone. However, this option will complicate the movement towards the coffee cor-ner as well and so it disturbs the students in the library and the coffee corner itself. Another option that hasbeen considered is placing objects which guides people to walk underneath the sensors. However, there isnot much space between the entrance door and the door towards the coffee corner. Therefor it will not bepossible to open the door towards the coffee corner, so this is not a viable alternative.
So the conclusion is that it is possible to improve the current sensors setup. But reducing the biggestdisturbance, closing the door towards the coffee corner, will be a big disturbance for the students and thecoffee corner itself.
5.2. New locationThe TU Delft library has two other locations that are suitable for measuring the number of people going inand out of the building. The first location that is considered needs four sensors and all sensors are placedinside. The second location that is considered needs two sensors which are placed outside.
Figure 5.2: Map of the library with the new inside locations for the people counting sensors to measure the in- and outflow. With thepossible waking routes
The first new locations for the people counting sensors are shown in figure 5.2. This setup needs foursensors to measure the in- and outflow of people in the library, because it is possible to enter the main hall ofthe library with four doors. Namely, the two doors at the end of the entrance hall and the door at the end ofthe hallway of the toilets and the door between the main hall of the library and the coffee corner. In this newsetup the current sensors can be used since the sensors will be placed inside of the building. However, thatmeans the in- and outflow towards the silence room and the cone cannot be measured anymore.
This setup can be used for determining the occupancy of the main hall of library for each hour. However,a downside for using this setup is that not the real in- and outflow of the library are measured, but the in-and outflow of the main hall of the library. The total occupation of the main hall of the library can be calcu-lated, which is important to know to determine how much capacity is left at certain hours. However, the real

5.3. Recommendation 21
occupation of the whole building cannot be determined with this sensor setup.
Figure 5.3: Map of the library with the new outside locations for the people counting sensors to measure the in- and outflow.
Figure 5.3 shows the second option for a suitable location to place the people counting sensors. Thislocation requires two sensors and those are placed outside above the entrance door. This location is verysuitable for measuring the actual in- and outflow of the library, since all people who enter or leave the librarywalk underneath the sensor and will be counted. A positive of this location is that no other people motion iscommon underneath the sensors, which could have disturbed the measurements. A negative of this locationto place the sensors is that the current sensors cannot be used, because those are not suitable to place outside.So new sensors are required if this location is chosen as the best option.
5.3. RecommendationIn order to recommend the best possible location to place the people counting sensors, the advantages anddisadvantages need to be compared. This is done by the following criteria:
• Criterion A: Is different people motion common underneath the sensors?
• Criterion B: Does this sensor setup measure the actual in- and outflow of the building?
• Criterion C: Can the current sensors be used for this setup to save costs?
• Criterion D: Are people disturbed by this setup?
These criteria are compared to each other in table 5.1. Four locations will be compared in the table. Theold location is the current setup as it is used now. The old location with improvements is the current setupwith the improvements that are described in section 5.1. New location 1 is the new location with the foursensors placed inside as can be seen in figure 5.2. New location 2 is the new location with the two sensorsplace outside as can be seen in figure 5.3.
Table 5.1: Comparison of the different sensor locations.
Criterion Old location Old location with improvements New location 1 New location 2A Yes No No NoB Yes Yes No YesC Yes Yes Yes NoD No Yes No No
What can be concluded from the table is that the old location is reduced in accuracy, since different peo-ple motion is common underneath the sensor. And these motions can be counted as well. The old locationwith improvements has as downside that the students are disturbed. Since it is impossible to reach the coffeecorner from the entrance hall. New location 1 has as downside that not the real in- and outflow of the build-ing are measured, but only the in- and outflow of the main hall of the library. New location 2 has as downsidethat the costs will increase, since new sensors have to be purchased.
Based on these criteria the best option to measure the in- and outflow of the TU Delft library building is toplace the sensors outside above the entrance door. So this location will be recommended. However, if the TU

22 5. Location Review
Delft library wants to save costs and keep on using the current sensors, the old location with improvementsis recommended. Although this brings as downside that the coffee corner and the hall towards the toilets willbe harder to reach for the students.

6Comparison of sensors
This chapter contains a literature study to compare four different people counting sensors. First a literaturestudy has been done to compare the most commonly used techniques for people counting sensors, which areinfra-red, camera and WIFI[3]. This can be found in appendix B. Then the sensors that will be compared arediscussed and the advantages and disadvantages are compared. From this comparison a recommendationabout what sensor needs to be used is given.
Based on this literature study the most suitable sensors to use for people counting in the TU Delft libraryare the overhead thermal and video-based sensors. Now the different sensors that are based on the tech-niques discussed can be compared. The sensors that are compared to each other are the FILR Brickstream3D Gen 2, V-Count 3D Alpha+, Irisys Gazelle 2 and FootfallCam 3D Plus.
6.0.1. FILR Brickstream 3D Gen 2This sensor can be delivered by HSBIB, the company that also deliver the current sensors. This sensor is basedon a stereo camera technique. This means that two cameras work together so that it is possible to see depths.So adults and children can be distinguished by the sensor. However, this is not really necessary for the TUDelft library, since barely any children visit it. Another positive of the stereo technique is that the sensors areless sensitive for a change in light level.
The FILR Brickstream 3D Gen 2 has an accuracy of 95%. It is suitable for large people flows, with a maxi-mum of 5,000 people per hour. So even with a flow of 5000 people per hour the sensors keep the accuracy of95%.
The FILR Brickstream 3D Gen 2 should be placed on a height between 2.4 and 10 metres. For a heighthigher than 6 metres a special lens can be delivered. If the sensors need to cover a wide area, multiple sen-sors can be placed in line and work together without double counting people. The sensor can be placed bothinside and outside.[5]
With this sensor it is possible to get a real time report of the occupancy of the building. It is even possibleto display the real time occupancy of the website of the TU Delft library, so that students know how crowdedit is.
6.0.2. V-Count 3D Alpha+The V-count is a camera-based sensor as well. Just like the Brickstream 3D Gen 2 it is based on a stereo cam-era technique. It can count people in two directions at the same time, so it is suitable for determining the in-and outflow of a building. The accuracy that is promised by V-Count is 98%.
The main focus in the design of the V-Count 3D Aplha+ is to understand the way people move. So it isvery suitable for retailers and other facilities where it is necessary to understand the people movement.
23

24 6. Comparison of sensors
The V-Count 3D Alpha+ can count people real-time. So with this sensor it is possible to see the exactoccupancy of TU Delft library if it is installed. It can also make reports of the peak hours and the off peakhours. Other features that this sensor has are calculating the conversion rate of customers, compare differentlocations where the sensor is placed. And it can count the number of groups that enter. However, all thesefeatures are not necessary for the TU Delft library.[6]
6.0.3. Irisys Gazelle 2The Irisys Gazelle 2 is a people counter based on the infra-red technique. It is an overhead thermal-basedsensor that detects the heat sources of the human body. This gives an advantage that this sensor is not influ-enced by the light level and can count in the dark. It can also count high crowds.
The Irisys Gazelle 2 can count people in multiple directions.[7].
6.0.4. FootfallCam 3D PlusThe FootfallCam 3D Plus is an overhead people counter that uses Camera and WIFI for detecting peoplemovement. Just like the Brickstream and V-Count sensors it uses a stereo camera setup. Besides the in- andoutflow movement, the FootfallCam 3D Plus can measure 6 other things:
• Dwell time: Thanks to the WIFI measurements the time a visitor stayed can be determined.
• Outside traffic: within a 100 metre radius the number of people passing can be determined
• Number of returning customers: thanks to the WIFI measurements the number of returning customerscan be determined.
• Zone analytics: The number of visits in each zone of a building can be determined
• Traffic flow analytics: The traffic flow between the different zones can be determined.
The in- and outflow of people can be measured with and accuracy of at least 90%. The reporting of these val-ues can be given in time frames of an hour, a day, or a week. So the real time occupancy cannot be determinedwith this sensor. [8]
6.0.5. RecommendationIn order to compare the different sensors some criteria that are important for the TU Delft library have to bedetermined. Those criteria are:
• Criterion A: The costs of the sensor.
• Criterion B: The accuracy of the sensor.
• Criterion C: Can the sensors give the real time information about the occupancy, inflow and outflow?
• Criterion D: Is it possible to use the sensor outside? And between what temperature range.
Table 6.1: Comparison table for the FILR Brickstream 3D Gen 2 and the V-Count 3D Alpha+.
Criterion Brickstream V-countA €1120.00 per piece and €14.10 per piece per month €1200.00 per piece, monthly cost unknownB 95% 98%C Yes YesD Yes, between 0 and 45 degrees Celcius Yes, between +10 and 35 degrees Celsius
Table 6.2: Comparison table for the Irisys Gazelle 2 and the FootfallCam 3D Plus.
Criterion Irisys FootfallcamA Unknown UnknownB 99% 90%C Yes NoD No No

25
Criterion A is not really usable for comparing the different sensors, since not all information about thepurchase and the maintenance costs of all the sensors are available. A possible way to obtain these costs isby contacting the manufacturer or a supplier of the sensors. Criterion B is better to compare the differentsensors. However, the accuracy information is provided by the manufacturer of the sensors itself and theyhave an interest in selling their own products. So it necessary to be careful with this information. One of thewishes of the TU Delft library is to know the real time occupancy of the building. So criterion C is good todetermine if this is possible with each sensor. Criterion D is good to use in the comparison since it has beendetermined in chapter 5 that placing the sensors outside is the best place to measure the in- and outflow ofthe library.
By comparing the table is becomes clear that the FootfallCam 3D Plus is not recommended, since it hasthe lowest accuracy and it cannot give the real time in and outflow. If the TU Delft library chooses to place thenew sensors outside the FILR Brickstream 3D Gen 2, which is delivered and installed by the same companyas the current sensors are, is recommended. The V-Count 3D Alpha+ can be used outside as well. But onlywhen the temperature is higher than +10 °Celsius. So this sensor is not really usable during the winter. If theTU Delft library chooses to place the sensors sensors that are recommended are the V-Count 3D Alpha+ andthe Irisys Gazelle 2, because those sensors have a higher accuracy. However, the FILR Brickstream 3D Gen 2is still a decent option, even if it is placed inside.
After investigating the different techniques and a few sensors that make use of these techniques a rec-ommendation about the best sensor to use has been made. Keeping in mind the location that has beenrecommended in chapter 5 the FILR Brickstream 3D Gen 2 is recommended. However, if the TU Delft librarychooses to place the sensors indoors, the V-Count 3D Alpha+ and the Irisys Gazelle 2 together with the FILRBrickstream 3D Gen 2 are recommended.

7Analysing the data
The last part of the research is to determine the in- and outflow patterns over the course of a day. Thesepatterns are compared between different days. These different days are normal days, days during the examperiods and holidays. Important to see is how the patterns are different between those days. Secondly theoccupancy patterns between the different days are compared to each other.
The data that is used is the in- and outflow data of each hour of each day between the start of the academicyear in September and the last day before the summer break in July for the years 2016/2017, 2017/2018 and2018/2019 (up to and including May 31). The exam period days will be specified as the days during the examperiod and the days in the lecture free week before the exam period when the TU Delft library has already theXXL opening schedule. During the XXL opening schedule the library is open until 2:00 instead of 0:00. Theholidays will be specified as the days when there are no lectures, which includes the Christmas break, springbreak, Kingsday, the Easter weekend, Ascension Day and Whit Monday. The normal days will be specified allother days in the year.
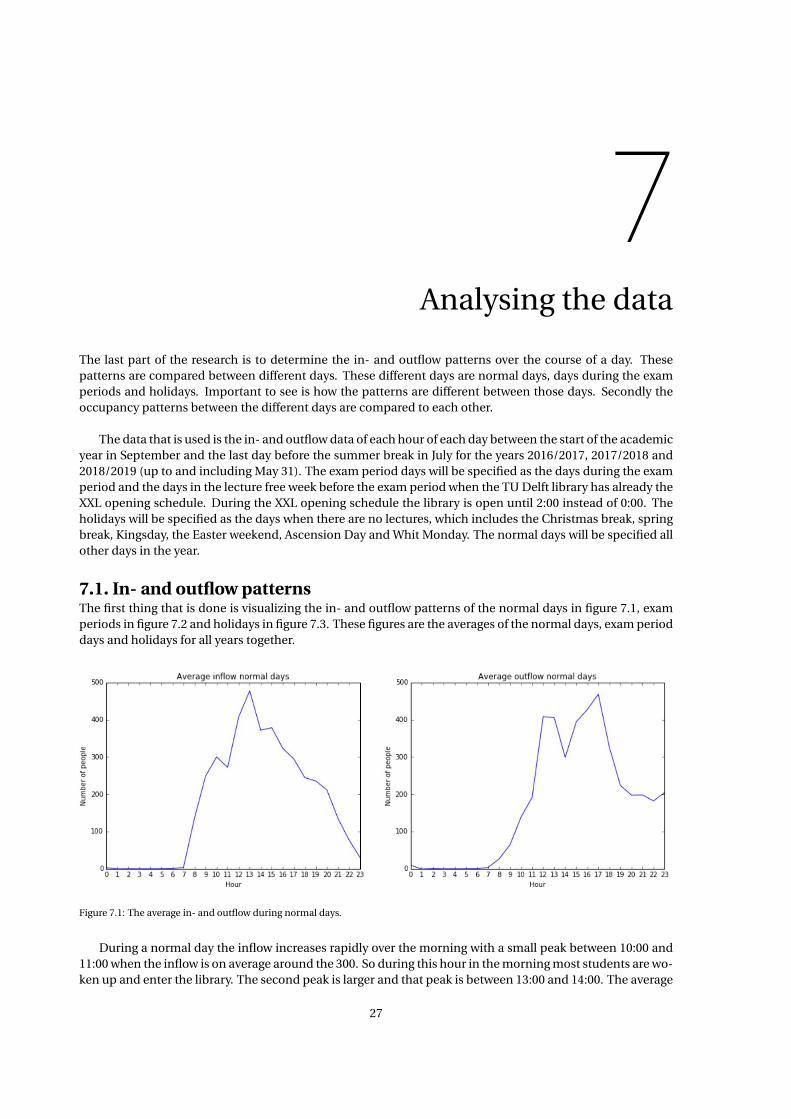
7.1. In- and outflow patternsThe first thing that is done is visualizing the in- and outflow patterns of the normal days in figure 7.1, examperiods in figure 7.2 and holidays in figure 7.3. These figures are the averages of the normal days, exam perioddays and holidays for all years together.
Figure 7.1: The average in- and outflow during normal days.
During a normal day the inflow increases rapidly over the morning with a small peak between 10:00 and11:00 when the inflow is on average around the 300. So during this hour in the morning most students are wo-ken up and enter the library. The second peak is larger and that peak is between 13:00 and 14:00. The average
27

28 7. Analysing the data
inflow during this hour is around 480 people. The reason for this peak is that most students had lunch and re-turn to the library after lunch time. During the rest of the afternoon and evening the inflow decreases steadily.
The outflow during a normal day has two peaks. The first peak is between 12:00 and 14:00 and the averageoutflow is around 400 people per hour. The reason for this peak in outflow is that most people will have lunchduring this time. So most people leave the library to have lunch somewhere else. The second peak in theoutflow is larger and is at the end of the afternoon between 17:00 and 18:00. This is the time that most peoplewill have dinner, so this is the reason that most people leave.
Figure 7.2: The average in- and outflow during exam period days.
During the exam period has the TU Delft library the XXL opening schedule. This means that the library isopened until 2:00 instead of 0:00. The inflow graph has three peaks now. The first peak is between 8:00 and9:00. This is the opening time for the TU Delft library. So that means that students want to use the libraryearlier than during normal days. The second peak is just like normal days after lunch time between 13:00and 14:00. So after having lunch more students come to the library. The third peak in the inflow graph is inthe evening between 19:00 and 21:00. Since the TU Delft library is opened longer during the exam period,students enter the library after dinner to study during the evening.
The outflow graph has two similar peaks during day-time and one smaller peak in the evening. The firstpeak is between 12:00 and 13:00, when more students leave to have lunch. The second peak is at the end ofthe afternoon between 17:00 and 18:00 when more students leave to have dinner. The peak in the evening isbetween 22:00 and 23:00. So this is the time that most students who use the library in the evening leave. Whatcan be seen in the outflow graph is that the library is used between 0:00 and 2:00, the hours that the librarystay open longer during the exam period. So that means that the library is still used during this period.
Figure 7.3: The average in- and outflow during holidays.

7.2. Comparing different type of days 29
During the holidays there is not real peak in inflow during the morning. The inflow increases steadilytowards it reaches the maximum between 13:00 and 14:00. So after lunch time the inflow is maximum. Af-ter this hour the inflow decreases steadily for the rest of the day. There is no peak in inflow during the evening.
The outflow during holidays has two peaks. The first is between 12:00 and 13:00 for the students who leaveto have lunch. The second peak in outflow is between 17:00 and 18:00 when most students leave in order tohave dinner.
7.2. Comparing different type of daysNow the in- and outflow patterns of the different kind of days are described they can be compared. Thepatterns have been plotted in figure 7.4.
Figure 7.4: Comparison of the average in- and outflow.
The first thing the can be concluded from figure 7.4 is that the in- and outflow is the highest during theexam periods. The in- and outflow is the lowest during the holidays. This is obvious because students haveto study a lot more during the exam periods. The least work has to be done during the holidays and somestudents return back home during the holidays. so that is the reason for the lowest in- and outflow during theholidays.
What can be said about the average starting time of students on a day is that most students start the ear-liest during the exam period days. The first peak during exam periods is during the opening hour, between8:00 and 9:00. The inflow in this hour is quite low for the normal days and the holidays. So that means that thelibrary is occupied way earlier than during normal days and holidays. The reason for this is that students haveto study a lot more during the exam period than during other days, so they start earlier. During the holidaysmost students start later than during the other days. The first real peak during the holidays is between 13:00and 14:00.
Another thing that can be seen in the in- and outflow patterns is that the library stays open longer duringthe exam periods and that the library is still used during these times. The evening inflow for the exam daysis significantly higher than during the normal days and the holidays. And there is an outflow between 0:00and 2:00 during the exam period days and there is no outflow between those hours during normal days andholidays.
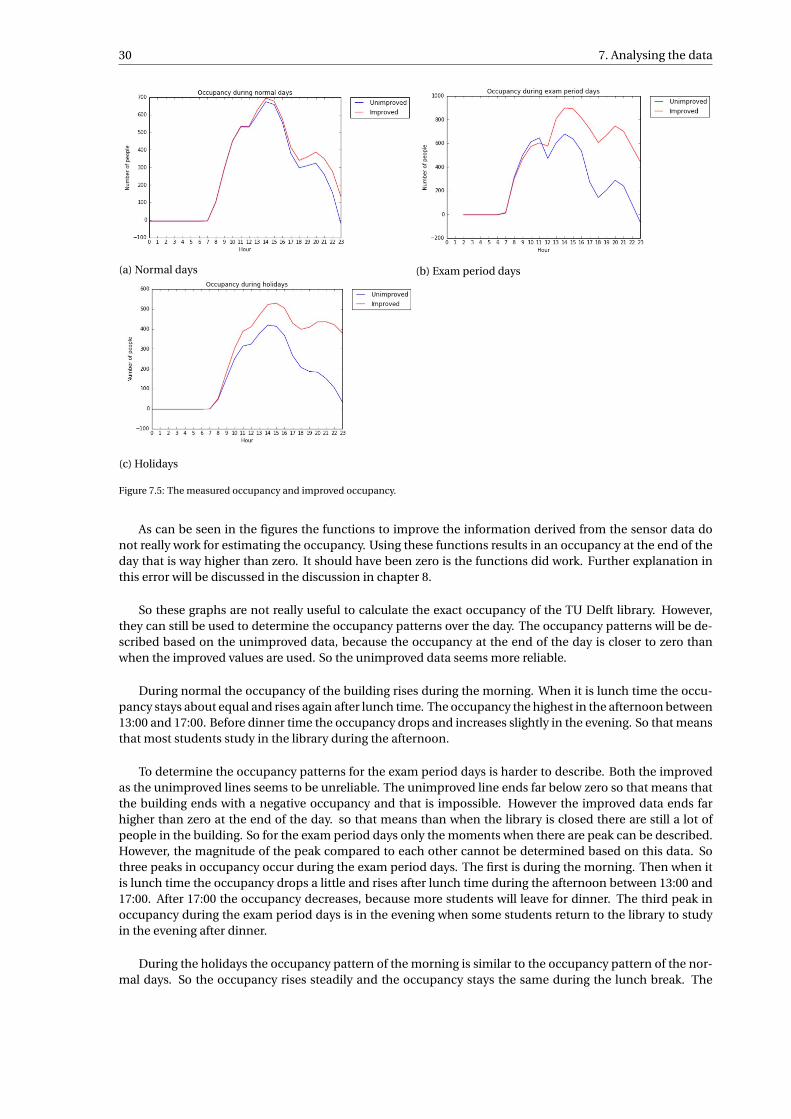
7.3. Calculating OccupancyThe most important use of the in- and outflow data is to calculate the occupancy of the TU Delft library. Thegraphs that show the occupancy in the TU Delft library for the different days are shown in figure 7.5. Theblue line are the unimproved values measured by the sensor and the red line are the improved values. Thesevalues are improved with the functions that are developed in chapter 4.
30 7. Analysing the data
(a) Normal days (b) Exam period days
(c) Holidays
Figure 7.5: The measured occupancy and improved occupancy.
As can be seen in the figures the functions to improve the information derived from the sensor data donot really work for estimating the occupancy. Using these functions results in an occupancy at the end of theday that is way higher than zero. It should have been zero is the functions did work. Further explanation inthis error will be discussed in the discussion in chapter 8.
So these graphs are not really useful to calculate the exact occupancy of the TU Delft library. However,they can still be used to determine the occupancy patterns over the day. The occupancy patterns will be de-scribed based on the unimproved data, because the occupancy at the end of the day is closer to zero thanwhen the improved values are used. So the unimproved data seems more reliable.
During normal the occupancy of the building rises during the morning. When it is lunch time the occu-pancy stays about equal and rises again after lunch time. The occupancy the highest in the afternoon between13:00 and 17:00. Before dinner time the occupancy drops and increases slightly in the evening. So that meansthat most students study in the library during the afternoon.
To determine the occupancy patterns for the exam period days is harder to describe. Both the improvedas the unimproved lines seems to be unreliable. The unimproved line ends far below zero so that means thatthe building ends with a negative occupancy and that is impossible. However the improved data ends farhigher than zero at the end of the day. so that means than when the library is closed there are still a lot ofpeople in the building. So for the exam period days only the moments when there are peak can be described.However, the magnitude of the peak compared to each other cannot be determined based on this data. Sothree peaks in occupancy occur during the exam period days. The first is during the morning. Then when itis lunch time the occupancy drops a little and rises after lunch time during the afternoon between 13:00 and17:00. After 17:00 the occupancy decreases, because more students will leave for dinner. The third peak inoccupancy during the exam period days is in the evening when some students return to the library to studyin the evening after dinner.
During the holidays the occupancy pattern of the morning is similar to the occupancy pattern of the nor-mal days. So the occupancy rises steadily and the occupancy stays the same during the lunch break. The

7.3. Calculating Occupancy 31
occupancy is the highest in the afternoon between 13:00 and 16:00 and after 16:00 the occupancy decreases.So during the holidays more students leave earlier than that they do during normal days and exam perioddays. The occupancy stays about the same between 19:00 and 21:00 and then the most students leave thelibrary in the evening.
What can be concluded from comparing the in- and outflow and occupancy patterns is that the timesthat students have lunch and dinner is a factor that influences the in- and outflow of the library building. Thein- and outflow of the library is the highest during the exam period and the lowest during the holidays. Andduring the exam period more students start earlier and more students stay until later in the library. Duringthe holidays more students start later and leave earlier than normal days and exam period days.


8Discussion
In this chapter, the issues that came up in the previous chapters will be discussed.
Number of measurementsThe number of measurements that are needed can be determined with the following formula:
n = z2 ∗σ2
d 2
In which:n: number of measurements neededz: Z-score, this is 1.96 for a 95% confidence levelσ: the standard deviation
d is the value for the margin of error. This margin of error is chosen to be 5% in order to get reliable data.Then d can be calculated by:
d = 0.05∗mean
The mean and standard deviation is determined with the tools in Microsoft Excel. And then the number ofmeasurements that are needed can be calculated. This has been done for the number of measurement errorsand the percentage measurement errors. The results are shown in table 8.1.
Table 8.1: Calculating the number of measurements with a margin of error of error of 5%.
Error in Error out Percentage error in Percentage error outMean 25.2 61 7.6% 13.6%St. Dev. 19.6 63.7 5.39% 9.84%n measurements 933 1678 767 804
What can be seen in table 8.1 is that by choosing a margin of error of 5% the number of measurementsthat are needed are at least 767 for the inflow and using the percentage error. The number of measurementneeded for the outflow values are even higher. The number of measurements that are done in this researchare 14. This means that using this data will not result in reliable results.
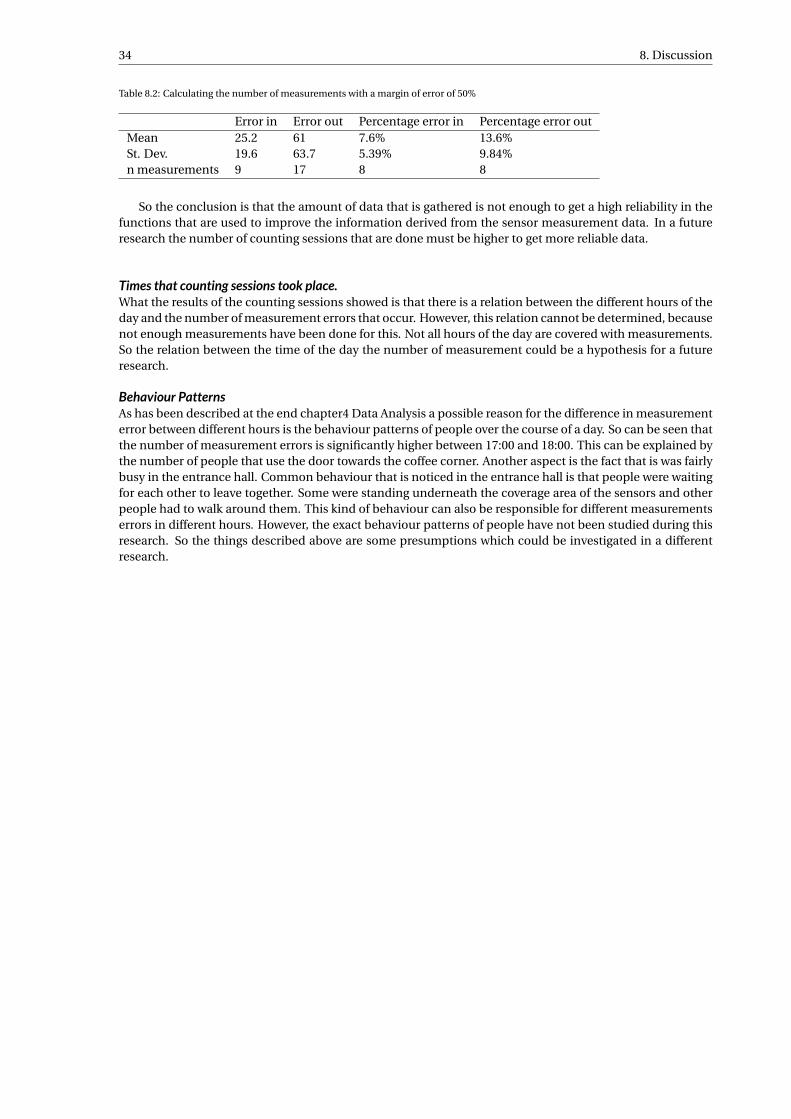
If the margin of error is increased to 50% the number of measurements are shown in table 8.2. So even ifthe margin of error is 50%, which is too high already for reliable results, the number of measurements are noteven sufficient for using the number of measurement errors for the outflow.
33
34 8. Discussion
Table 8.2: Calculating the number of measurements with a margin of error of 50%
Error in Error out Percentage error in Percentage error outMean 25.2 61 7.6% 13.6%St. Dev. 19.6 63.7 5.39% 9.84%n measurements 9 17 8 8
So the conclusion is that the amount of data that is gathered is not enough to get a high reliability in thefunctions that are used to improve the information derived from the sensor measurement data. In a futureresearch the number of counting sessions that are done must be higher to get more reliable data.
Times that counting sessions took place.What the results of the counting sessions showed is that there is a relation between the different hours of theday and the number of measurement errors that occur. However, this relation cannot be determined, becausenot enough measurements have been done for this. Not all hours of the day are covered with measurements.So the relation between the time of the day the number of measurement could be a hypothesis for a futureresearch.
Behaviour PatternsAs has been described at the end chapter4 Data Analysis a possible reason for the difference in measurementerror between different hours is the behaviour patterns of people over the course of a day. So can be seen thatthe number of measurement errors is significantly higher between 17:00 and 18:00. This can be explained bythe number of people that use the door towards the coffee corner. Another aspect is the fact that is was fairlybusy in the entrance hall. Common behaviour that is noticed in the entrance hall is that people were waitingfor each other to leave together. Some were standing underneath the coverage area of the sensors and otherpeople had to walk around them. This kind of behaviour can also be responsible for different measurementserrors in different hours. However, the exact behaviour patterns of people have not been studied during thisresearch. So the things described above are some presumptions which could be investigated in a differentresearch.

9Conclusion
This chapter contains the conclusion of the research. The goal of the client, the TU Delft library is to get betterinsight in the in- and outflow of people in the library and to know the exact occupancy of the building. Thecurrent sensor setup is not accurate enough to provide the TU Delft library with reliable numbers.
First the current sensors have been researched and a method to improve the information derived from thesensor data. The best formula to use to improve the information derived from the inflow data of the sensorsis:
I = X − (−0.000276X 2 +0.171X −16.5)/100∗X
I: Number of people walking into the library buildingX: Number of inflow measurements done by the sensors
The best formula to use to improve the information derived from the outflow data is:
O = X − (4.82∗10−25 ∗X 9.55 +28.3)
With:O: Number of people walking out of the library building.X: Number of outflow measurements done by the sensors
Due to a lack of measurements is the accuracy of these functions not really high as can be read in chapter8, the discussion.
The recommended location to place the sensors is outside above the entrance doors. This is the best pos-sible location to count the in- and outflow of people in the library building without frequent disturbances ofpeople walking in different directions. However, new sensors are needed, because the current sensors cannotbe placed outside. One of the other locations that can be used in order to save costs are the current location.What is recommended if this option is chosen is to close the door towards the coffee corner in order to reducethe different motions underneath the sensors. And the sensors should be moved closer towards the door andplaced without an angle. The second option that can be used in order to save costs is placing the four currentsensors above all entrances leading from the entrance hall and coffee corner into the main hall of the library.However, not the real in- and outflow of the library is measured if this option is chosen.
Some different sensors have been reviewed as well. The recommendation for the best sensor to use is theFILR Brickstream Gen 2. This is the sensor delivered and maintained by the company HS BIB, which alsomaintains the current sensors. This sensor has an accuracy of 95% and can give the real time in- and outflowand occupancy information. Another positive of this sensor is that it can be installed outside. So it can beused for the recommended location. Other sensors that are recommended are the V-Count 3D Alpha+ whichhas an accuracy of 98% and the Irisys Gazelle 2 which has an accuracy of 99%. However, it is not recom-mended to use these sensors outside.
35

36 9. Conclusion
The in- and outflow patterns have been determined as well with help of the in- and outflow data measuredby the sensors. The patterns of the different kind of days have been compared, namely the normal days, examperiod days and the holidays. What can be seen is that more students start earlier and stay longer in the libraryduring the exam periods. During the holidays the library is less used. Most of the people who come duringthese days start later and end earlier than that they do during normal days and exam period days. The averagein- and outflow patterns of these days are shown in figure 9.1.
Figure 9.1: Comparison of the average in- and outflow.
It has been tried to calculate the occupancy of the TU Delft library as well. However, the correcting func-tions that have been determined do not work good enough to calculate the occupancy over the course of aday.

References
[1] Unknown. DanCount web interface. 2019. URL: tudelft.dancount.nl.
[2] Unknown. CC-MED Mounting instructions. 2019.
[3] Wikipedia contributors. People Counter. Ed. by unknown. May 2, 2019. URL: https://en.wikipedia.org/wiki/People_counter#Current_technology.
[4] Unknown. Dancount. 2019. URL: http://dancount.com/company/about-us.
[5] Unknown. FLIR BRICKSTREAM 3D Gen 2. May 31, 2019. URL: http:// www.brickstream.com/NewDatasheets/FLIR-Brickstream_3D-Gen2.pdf.
[6] V-Count employee. Optimize your traffic, staff and marketing strategies to increase conversion rates andprofits with actionable data. May 31, 2019. URL: https://v- count.com/solutions/people-counting/.
[7] Unknown. Gazelle 2 Datasheet. June 14, 2019. URL: https://www.irisys.net/gazelle2-brochure?hsCtaTracking=0a82b7b2-eee2-4500-9f24-9201da470c55%7Cc22476e0-1b5e-40a5-b86f-b173e10f562b.
[8] U. T. employee. FootfallCam product information. May 31, 2019. URL: https://www.footfallcam.com/Content/data/documents/Download-Page/Info-Pack/FootfallCam-Product-Information.pdf.
[9] Unknown Trafsys employee. Which Type of People Counter is Best for You? Jan. 16, 2015.
[10] Stephen Porter et al. “Low cost smart sensors using infrared detector arrays”. In: Sensor Review 21.4(2001), pp. 283–287. DOI: 10.1108/02602280110406927. eprint: https://doi.org/10.1108/02602280110406927. URL: https://doi.org/10.1108/02602280110406927.
[11] M. Piccardi. “Background subtraction techniques: a review”. In: 2004 IEEE International Conferenceon Systems, Man and Cybernetics (IEEE Cat. No.04CH37583). Vol. 4. Oct. 2004, 3099–3104 vol.4. DOI:10.1109/ICSMC.2004.1400815.
[12] S. D. Pore and B. F. Momin. “Bidirectional people counting system in video surveillance”. In: 2016IEEE International Conference on Recent Trends in Electronics, Information Communication Technol-ogy (RTEICT). May 2016, pp. 724–727. DOI: 10.1109/RTEICT.2016.7807919.
[13] U. T. employee. 3D People Counter - 9 What is Wi-Fi counting? June 8, 2019. URL: https://www.youtube.com/watch?v=eQnAkkyCkog.
[14] J. Barandiaran, B. Murguia, and F. Boto. “Real-Time People Counting Using Multiple Lines”. In: 2008Ninth International Workshop on Image Analysis for Multimedia Interactive Services. May 2008, pp. 159–162. DOI: 10.1109/WIAMIS.2008.27.
[15] H. Li et al. “Wi-Counter: Smartphone-Based People Counter Using Crowdsourced Wi-Fi Signal Data”.In: IEEE Transactions on Human-Machine Systems 45.4 (Aug. 2015), pp. 442–452. ISSN: 2168-2291. DOI:10.1109/THMS.2015.2401391.
[16] S. Depatla, A. Muralidharan, and Y. Mostofi. “Occupancy Estimation Using Only WiFi Power Measure-ments”. In: IEEE Journal on Selected Areas in Communications 33.7 (July 2015), pp. 1381–1393. ISSN:0733-8716. DOI: 10.1109/JSAC.2015.2430272.
[17] J. Kalikova and J. Krcal. “People counting by means of Wi-Fi”. In: 2017 Smart City Symposium Prague(SCSP). May 2017, pp. 1–3. DOI: 10.1109/SCSP.2017.7973857.
[18] A. Muralidhan S. Depatla and Y. Mostofi. Head Counting With WiFi: Counting People Without RelyingOn Personal Devices. May 30, 2019. URL: https://www.youtube.com/watch?v=B7o0qA4L4So.
[19] Y. Yang et al. “Wi-Count: Passing People Counting with COTS WiFi Devices”. In: 2018 27th InternationalConference on Computer Communication and Networks (ICCCN). July 2018, pp. 1–9. DOI: 10.1109/ICCCN.2018.8487420.
37


AAppendix
This appendix contains all the fitted plots that are discussed in chapter 4.
The inflow relations between the number of measurements done by the sensors and the percentage ofmeasurement error:
Figure A.1: R.M.S.E = 4.46 and R2 = 0.261
Figure A.2: R.M.S.E = 4.18 and R2 = 0.352
39

40 A. Appendix
Figure A.3: R.M.S.E = 4.32 and R2 = 0.308
Figure A.4: R.M.S.E = 4.56 and R2 = 0.230
The outflow relations between the number of measurements done by the sensors and the percentage ofmeasurement error:
Figure A.5: R.M.S.E = 8.22 and R2 = 0.249

41
Figure A.6: R.M.S.E = 6.16 and R2 = 0.578
Figure A.7: R.M.S.E = 7.18 and R2 = 0.426
Figure A.8: R.M.S.E = 5.63 and R2 = 0.647
The inflow relations between the number of measurements done by the sensors and the number of mea-surement errors:

42 A. Appendix
Figure A.9: R.M.S.E = 18.3 and R2 = 0.0666
Figure A.10: R.M.S.E = 16.7 and R2 = 0.226
Figure A.11: R.M.S.E = 18.9 and R2 = 2.59e-07

43
Figure A.12: R.M.S.E = 18.5 and R2 = 0.0479
The outflow relations between the number of measurements done by the sensors and the number ofmeasurement errors:
Figure A.13: R.M.S.E = 44.2 and R2 = 0.482
Figure A.14: R.M.S.E = 31.5 and R2 = 0.736

44 A. Appendix
Figure A.15: R.M.S.E = 30.4 and R2 = 0.755
Figure A.16: R.M.S.E = 26.0 and R2 = 0.820
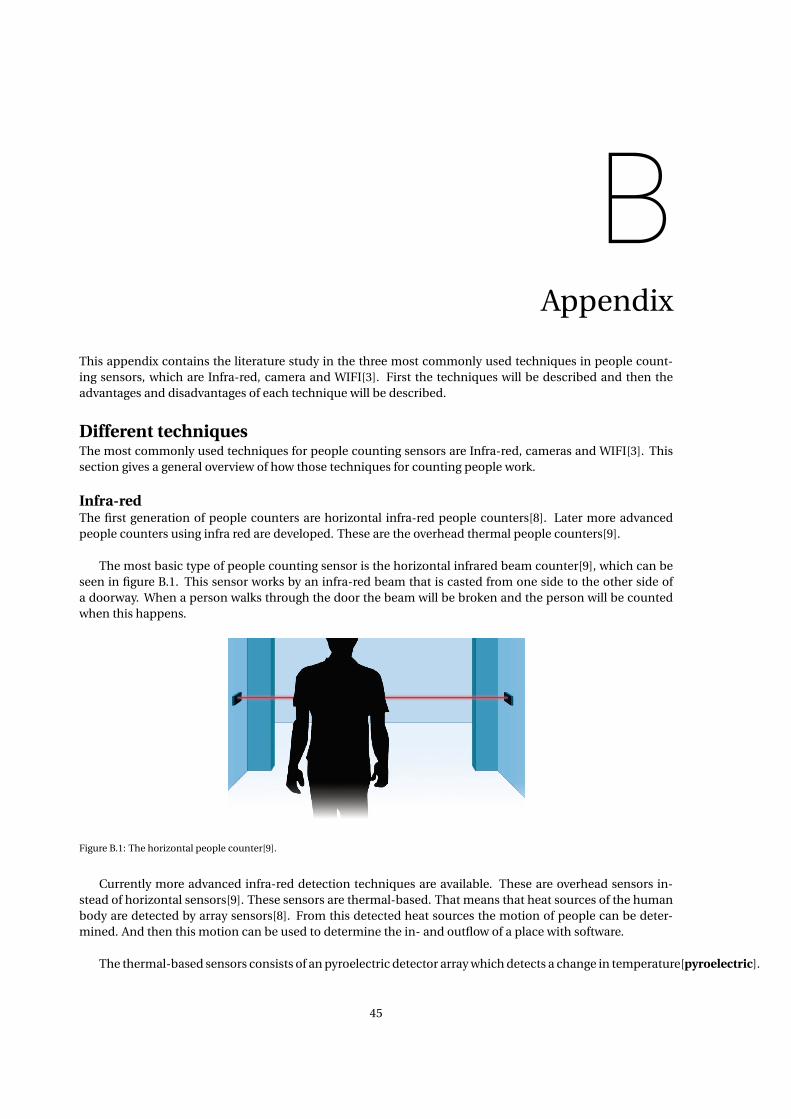
BAppendix
This appendix contains the literature study in the three most commonly used techniques in people count-ing sensors, which are Infra-red, camera and WIFI[3]. First the techniques will be described and then theadvantages and disadvantages of each technique will be described.
Different techniquesThe most commonly used techniques for people counting sensors are Infra-red, cameras and WIFI[3]. Thissection gives a general overview of how those techniques for counting people work.
Infra-redThe first generation of people counters are horizontal infra-red people counters[8]. Later more advancedpeople counters using infra red are developed. These are the overhead thermal people counters[9].
The most basic type of people counting sensor is the horizontal infrared beam counter[9], which can beseen in figure B.1. This sensor works by an infra-red beam that is casted from one side to the other side ofa doorway. When a person walks through the door the beam will be broken and the person will be countedwhen this happens.
Figure B.1: The horizontal people counter[9].
Currently more advanced infra-red detection techniques are available. These are overhead sensors in-stead of horizontal sensors[9]. These sensors are thermal-based. That means that heat sources of the humanbody are detected by array sensors[8]. From this detected heat sources the motion of people can be deter-mined. And then this motion can be used to determine the in- and outflow of a place with software.
The thermal-based sensors consists of an pyroelectric detector array which detects a change in temperature[pyroelectric].
45

46 B. Appendix
Figure B.2 shows a picture of people walking underneath a thermal-based sensor on the left side. On theright the infra-red view is showed. Moving people are visible by the thermal sensor and are visualized as blobs.The algorithm for the post-processing recognizes these blobs as persons, based on their size. When peopleunderneath the sensor stop walking, they will not be detected anymore, as the sensor only detects movingobjects. The software will store the location, so it can pick up the person when it starts moving again. Whenpeople are walking close to each other, they will appear as one bigger blob. Because the algorithm knows thegeometry of one person it can see the bigger blob as two persons[10].
Figure B.2: Left: visible image of people underneath the sensor. Right: the infra-red view.[10]
To use the thermal sensors for people counting, some virtual structures have to be implemented. Thesecan be a line or a box. When people cross the line or walk from one side of the box to the other, they can becounted by the algorithm. This makes it possible for the sensors to count the in- and outflow of people in thelocation where it is installed.
CamerasOne of the techniques for the counting of people is the use of one or more cameras and software to deter-mine the quantity and direction of people flow. First, a commonly used method to detect moving objects isdescribed and after that the algorithms to count the people are described.
A commonly used method to detect moving objects in a static camera is background subtraction[11]. Themost basic form of background subtraction is comparing the current frame produced by the camera to a ref-erence frame. The reference frame is the frame with only the background on it without any moving objects.This reference frame must be updated regularly to account for the varying luminance conditions and geom-etry settings. The moving objects and persons can be detected by the difference in the current frame andthe reference frame. Some of the more advanced methods for background subtractions exist as well[11]. Theexact way those methods work is not relevant for comparing different sensors, so it will not be further elabo-rated.
After the moving objects have been detected they need to be counted based on their direction. A simplemethod to count the people is by using a single reference line. The current sensors, the CC MED, use thismethod for counting people[2]. When a person crosses the line in the in direction, it will be added to theinflow. The same is done for the outflow when the person crosses the line in the out direction[12].
Some systems use two lines to count the in- and outflow of people. One of the lines only count the peopleheading out of an area. The other line is placed a little further into the area and counts only the number ofpeople heading into the area. This is done to prevent the counts of people who make a u-turn at the entranceand decide not to go in[13].
A more advanced method for counting people using a video system is proposed by J. Barandiaran, B.Murguia and J. Boto[14]. It uses multiple lines to count people in two directions. All those lines count thepeople passing it separately. In the final step of this algorithm the results of the different lines are combined.The result of the whole system is equal to the result that is counted by most of the lines.
WIFIWifi counting can be done in multiple ways. One of those is by making use of devices that are connected to aWIFI network[15] and another way is without tracking devices[16].

47
J. Kalikova and J. Krcal propose a method for counting people by using the amount of devices that areconnected to the WIFI network[17]. This method uses an access point that broadcasts a wireless network.Devices like smartphones search for available networks. The software used in the WIFI tracker gathers infor-mation of the searching devices. This information includes the MAC address (Media Access Control Address)and the RSSI (Received Signal Strength Indication). The software uses this information to determine howmany people are inside of a determined area.
The second method where WIFI can be used to determine the occupancy and in- and outflow of peo-ple is without tracking devices. A method to do this has been proposed by S. Depatla, A. Muralidhan and Y.Mostofi[16]. This method can be executed with the use of two devices: one WIFI transmitter and one WIFIreceiver. Two effects will interfere the WIFI signal, namely blocking the Line of sight and scattering effects.When a person is blocking the line of sight between the WIFI-signal transmitter and receiver, the receivedsignal strength decreases. And when a person is walking outside of the line of sight it bounces off a part of thesignal towards the wifi receiver. This will increase the received WIFI signal. A visualization of the blocking theline of sight and scattering effects can be seen in figure B.3. It can be seen that people standing in the line ofsight of the WIFI signal will block it and the people standing on differenct places will increase the signal dueto the multi-path of the signal.
Figure B.3: Visualization of blocking line of sight and scattering effects.[18] LOS: line of sight, MP:multi-path
In the next step a probability density function is created with the effects of blocking the line of sight,scattering effects and static objects kept in mind. Based on this function the occupancy of a room can bedetermined. Experiments have been done with a maximum of 9 people in a location. It has been performedoutdoor and indoor. As can be seen in figure B.4 the accuracy is higher when this method is used outside.
(a) Results of experiment outdoor (b) Results of experiment indoor
Figure B.4: Results of the experiment.
This method has been further elaborated by Y. Yang, J. Cao, X. Liu and X. Liu[19]. This makes it able tocount people entering and leaving a room, even if they carry a device emitting a WIFI signal. The goal when

48 B. Appendix
designing this method was that the people counter should be: non-intrusive, accurate and low-cost. Detect-ing people moving through a doorway is done by analysing the WIFI signal and see how the interference inthe signal is. The signal emitted by the carried WIFI device, like a smartphone, should be filtered out of thedata. In the end the accuracy of this method is between 92% and 95%.
Advantages and disadvantages of the three techniquesNow the different techniques for people counting senors have been described, it is time to discuss the advan-tages and disadvantages of each technique. After this has been done the techniques can be compared to eachother.
Infra-redThe first thing that has been described in subsection B was the horizontal infra-red beam counter.
Table B.1: The advantages and disadvantages of the horizontal infra-red people counter.
Advantages DisadvantagesLow costs Very low accuracyQuick installation Cannot measure multidirectional
Cannot cover wide entrancesCannot detect people walking side by sideCannot be connected to network, so manual reading outAccuracy affected by direct sunlight.
The main advantage of this type of sensor is that the costs are low[9]. This makes it a good starting pointfor businesses that want to try out with customer counting. Another advantage is that the installation is rela-tively quick, because those sensors are placed in the door frame, instead of the ceiling.
The biggest disadvantage is the accuracy of the sensors. That is because the sensor struggles when multi-ple people walk though it at the same time. It can only detect the number of time the beam gets broken. So ifthe beam stays broken when multiple people walk through it, the sensor counts it as one. A second disadvan-tage is that it cannot measure multidirectional people motions. So if the building does not have a separateentrance and exit, they in- and outflow cannot be measured. Another disadvantage is that the sensors cannotmeasure accurate in wide entrances. The accuracy decreases when the entrance is wider than 3 metres.[9]The sensors accuracy is reduced b direct sunlight.
Another type of infra-red sensor that is described in subsection B where the sensors that detects the ther-mal energy of people passing it.
Advantages DisadvantagesDecent accuracy between 80% and 95% Higher costsCan count multidirectional Cannot distinguish children and adultsAccuracy not reduced by the light level Cannot cover wide entrances
Accuracy can be influenced by temperature
Table B.2: The advantages and disadvantages of the overhead thermal people counter.
An advantage of this type of sensor is that it can count multidirectional people motions. These sensorscan be placed in wider entrances without a decrease in accuracy. The overall accuracy is around 95%.[9]
A disadvantage of these sensors is that the costs are higher than the horizontal sensors. Another disad-vantage is that it cannot make a difference between children and adults.

49
Camera
Table B.3: The advantages and disadvantages of the overhead camera-based people counter.
Advantages DisadvantagesDecent accuracy 90-95% Higher costsCan count multidirectional Requires more effort to install and calibrateCan cover wide entrances with multiple units Can be effected by shadow, low light and changing backgroundSoftware ca be updated if better is availableCan distinguish children and adults
Camera-based sensors have multiple advantages. These sensors can cover wide areas when multiple unitsare used together. Another positive side of the camera-based sensors is that a major part of the sensors isbased on software and if this has some flaws, it can easily be updated. The third advantage of the camerabased sensors is that it can distinguish children from adults.[9].
The camera-based sensors have some disadvantages as well. One of those is that the camera-based sen-sors have higher costs. Another downside is that the camera-based sensors require more effort in installingthan the infra-red sensors. The third disadvantage is that the counts of the camera-base sensors can be ef-fected shadows, changing background and changing light levels.
Wifi
Table B.4: The advantages and disadvantages of the horizontal WIFI people counter that detects devices.
Advantages DisadvantagesAccuracy is not reduced by light level, temperature Reduced accuracy due to dependency of people carrying a device.Can detect customer returning behaviour Tracking devices may raise privacy concerns
The WIFI sensors that detect devices connected to the WIFI network has as advantage that the accuracy is notreduced by the light level and temperature. Another advantage is that is can detect the returning behaviourof people.[17]
It has some disadvantages as well. The main disadvantage of this type of WIFI people counting is that it isreliable of people carrying a device. If people don’t they will not be counted. Another disadvantage is that iscan raise privacy concerns since they sensor detects people their devices. Although the identity of the peopleis not known. These sensors can measure the occupancy but it cannot measure the exact in- and outflow.[17]
Table B.5: The advantages and disadvantages of the horizontal infra-red people counter.
Advantages DisadvantagesNo privacy infringement Can be disturbed by other devicesAccuracy is not reduced by light level, temperatureCould reach an accuracy of about 86%Can count multidirectional.
The WIFI detection method that used the WIFI signal to identify humans has as advantage that there areno privacy concerns, since the WIFI signal is not used to detect devices. The accuracy is not reduced by lightlevel and temperature. It can count multidirectional and could reach an accuracy of 86%[19].
It has as disadvantage that the accuracy can be reduced, because of disturbing signals emitted by otherdevices.
ComparisonTo compare the different advantages and disadvantages of the different people counting techniques a com-parison table has been made. The four different point on which the techniques are compared are:

50 B. Appendix
• A: The accuracy is reduced by:
• B: Can it count multidirectional?
• C: Can it cover wide entrances?
• D: Are there privacy concerns?
Table B.6: comparison table for the Infra-red and video people counting techniques.
Horizontal I.R. Overhead thermal VideoA Direct sunlight Temperature shadow, low light and changing backgroundB No Yes YesC No Multiple units can work together Yes and multiple units can work togetherD No concerns No concerns No real privacy issues
Table B.7: Comparison table for the WIFI people counting techniques
WIFI 1 WIFI 2A People not having a device of multiple devices Other devicesB No real in- or outflow is counted, only the occupancy is measured. YesC - YesD Yes No concerns
What can be concluded is that the overhead thermal and video-based sensors are the most suitable. TheWIFI counters are not the most suitable sensors since they can be influenced by devices and most studentsthat come in the library have a smartphone and use their laptop. This makes it complicated to exactly countthe occupancy in the library with the use of WIFI.
The horizontal Infra-red sensors have a very low accuracy so this is not a suitable technique either. Thatleaves the overhead thermal and video-based sensors as the most suitable.