Embed Size (px)
Citation preview

Counting the costof funded early years education and childcare
Presented by Dr Jo Verrill Managing Director, Ceeda

The Pre-school Learning Alliance commissioned the study to answer some fundamental questions
• What does it cost to deliver an hour of quality early education and childcare?
• How much is paid for this hour of quality early education and childcare?
• What is the difference between the delivery cost and funding rate?
Our aim
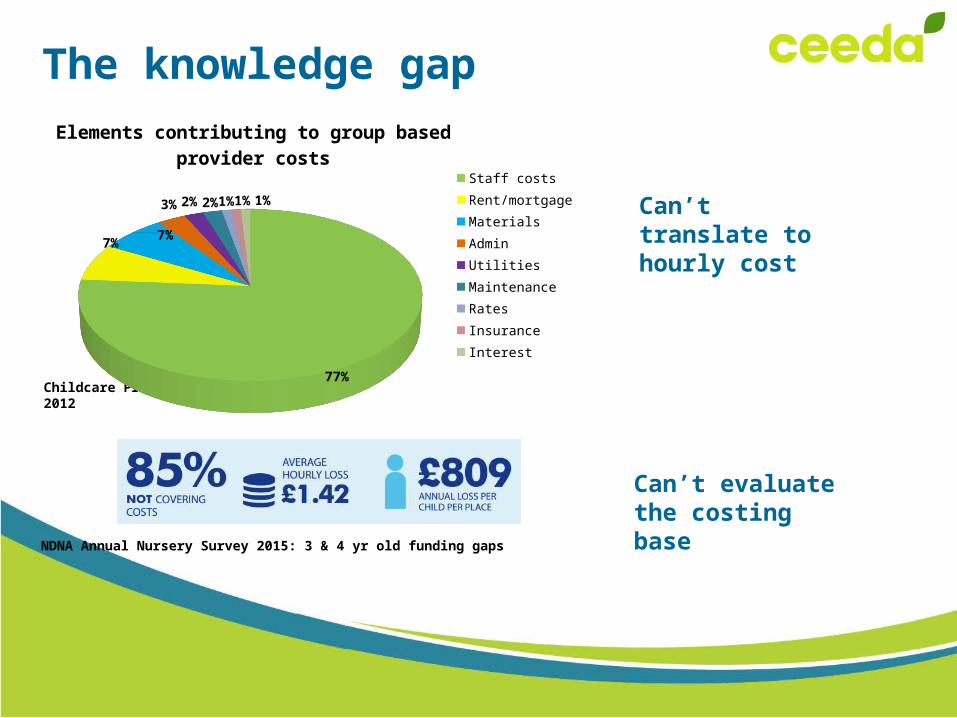
The knowledge gap
Childcare Provider Finance Survey DfE 2012
NDNA Annual Nursery Survey 2015: 3 & 4 yr old funding gaps
Can’t translate to hourly cost
Can’t evaluate the costing base
77%
7%7%
3%2%2%1% 1% 1%
Elements contributing to group based provider costs
Staff costsRent/mortgageMaterialsAdminUtilitiesMaintenanceRatesInsuranceInterest

The scope and scale
• Our challenge was to address this gap– Establish inputs in a consistent way across settings – Track how resources are deployed
– Build the unit cost from the sum of it’s parts • Private voluntary and independent settings on non-
domestic premises • Good or outstanding Ofsted• Random stratified sample • 100 PVI settings

Our approach Costs tracked across 186,712 hrs of early education used by 5,635 children
3,488 funded 3 and 4 year olds383 funded 2 year olds 100 PVI settings across 76 LA’s
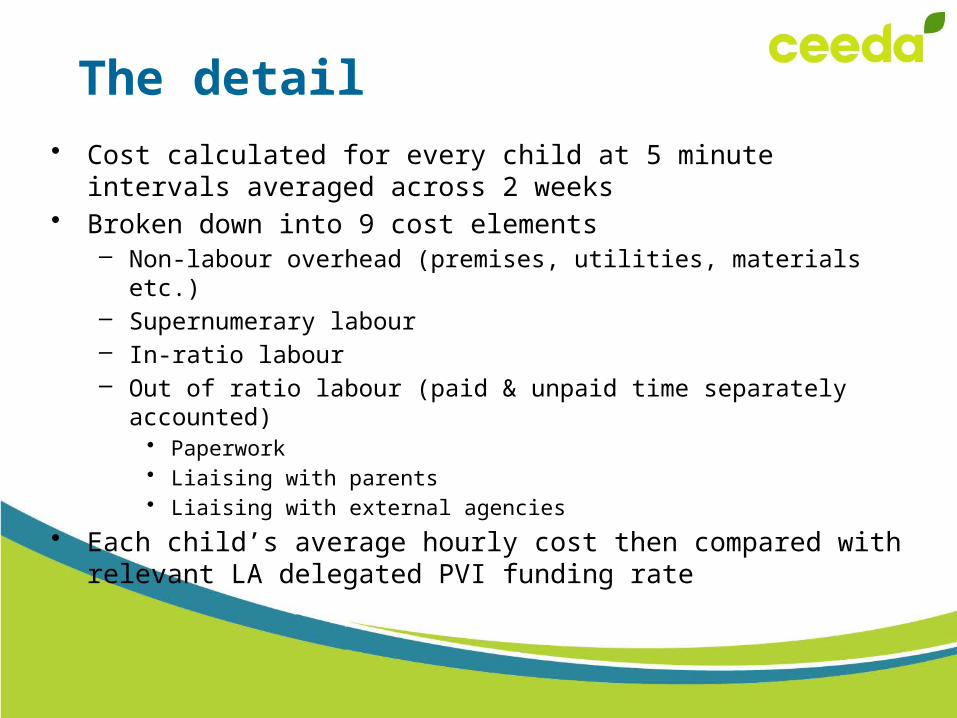
• Cost calculated for every child at 5 minute intervals averaged across 2 weeks
• Broken down into 9 cost elements– Non-labour overhead (premises, utilities, materials etc.)– Supernumerary labour – In-ratio labour – Out of ratio labour (paid & unpaid time separately accounted)
• Paperwork• Liaising with parents• Liaising with external agencies
• Each child’s average hourly cost then compared with relevant LA delegated PVI funding rate
The detail
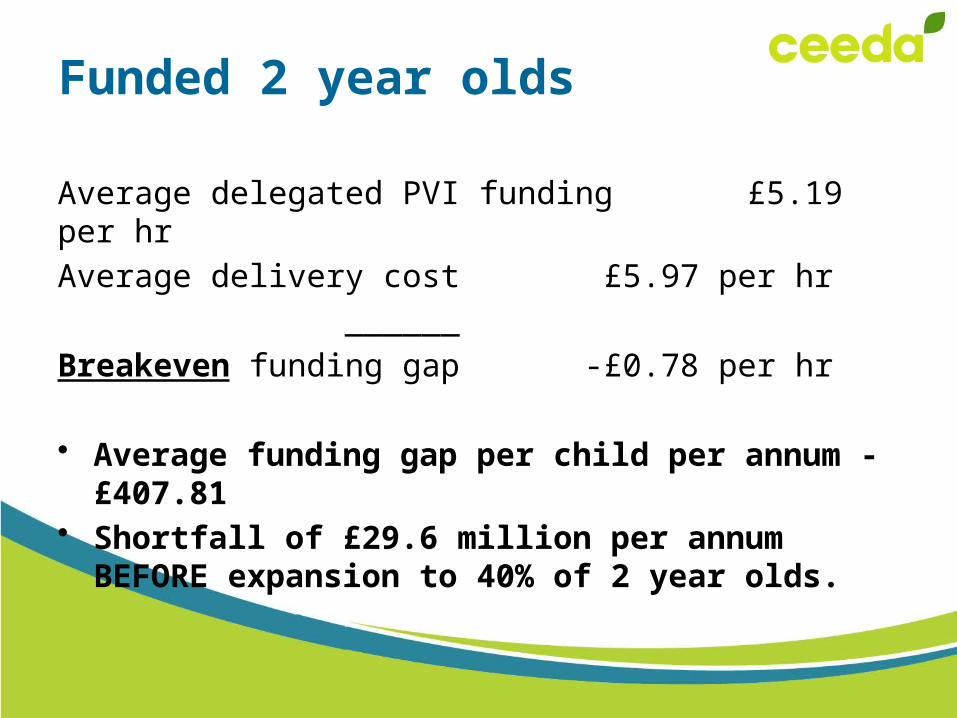
Average delegated PVI funding £5.19 per hr
Average delivery cost £5.97 per hr
______
Breakeven funding gap -£0.78 per hr
• Average funding gap per child per annum -£407.81• Shortfall of £29.6 million per annum BEFORE
expansion to 40% of 2 year olds.
Funded 2 year olds

Funded 3 & 4 year olds
Average delegated PVI funding £3.88 per hr
Average delivery cost £4.53 per hr
______
Breakeven funding gap -£0.65 per hr
• Average funding gap per child per annum -£347.33• Estimated annual shortfall of £177 million

Understanding costs
Non-labour overhead Supernumarary labour Out of ratio labour In ratio labour £0.00
£0.50
£1.00
£1.50
£2.00
£2.50
£3.00
£3.50
Funded 2yr olds
Funded 3 & 4 yr olds
£1.31
£0.61£0.82
£3.23
£1.10
£0.60
£0.99
£1.84
383 funded 2 year old children in 73 non-domestic childcare settings3,488 funded 3 and 4 year old children in 100 non-domestic childcare settingsExcludes unpaid labour
Composition of hourly delivery costs for funded 2, 3 and 4 year olds.
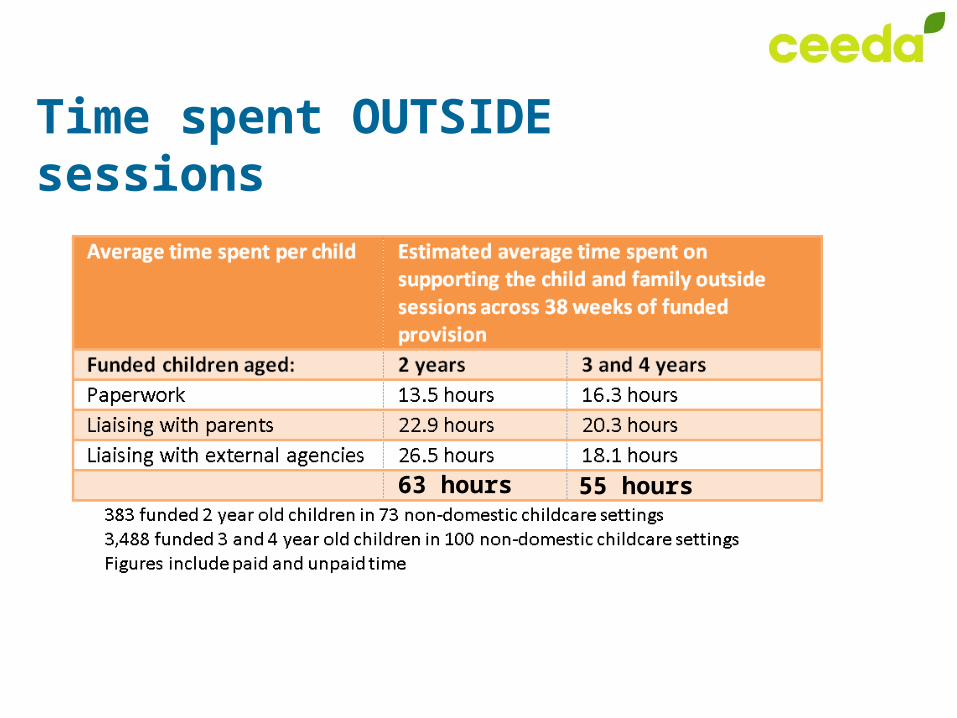
Time spent OUTSIDE sessions
63 hours 55 hours
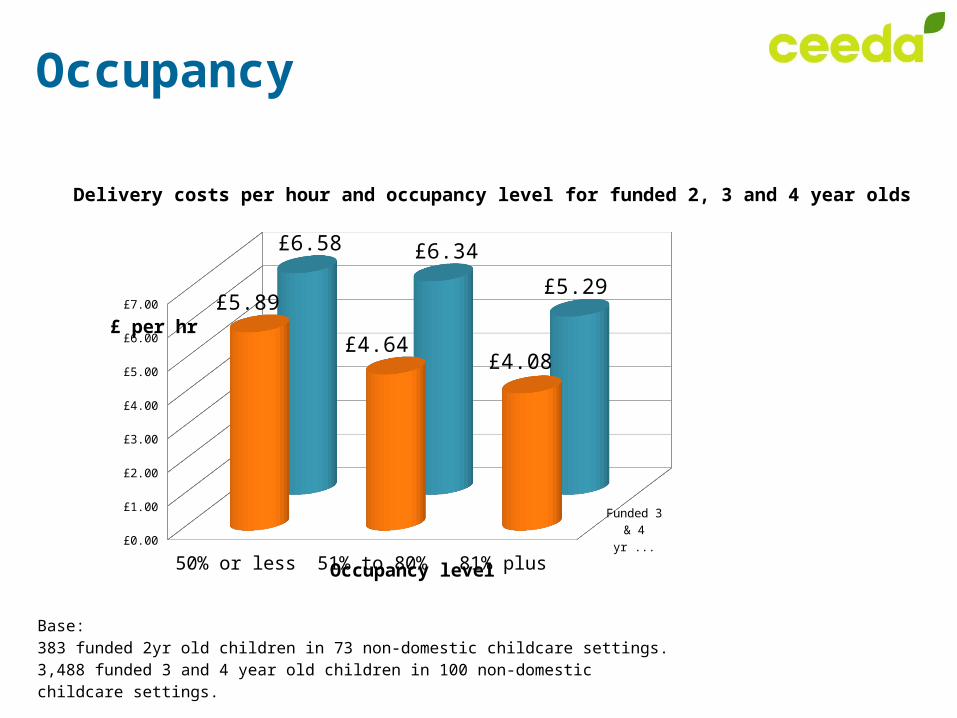
Occupancy
50% or less 51% to 80% 81% plus £0.00
£1.00
£2.00
£3.00
£4.00
£5.00
£6.00
£7.00
Funded 3 & 4 yr olds
Funded 2 yr olds
£5.89
£4.64£4.08
£6.58 £6.34
£5.29
Occupancy level
£ per hr
Base: 383 funded 2yr old children in 73 non-domestic childcare settings.3,488 funded 3 and 4 year old children in 100 non-domestic childcare settings.
Delivery costs per hour and occupancy level for funded 2, 3 and 4 year olds

Funding mix
Funded 2yr olds
Funded 3 & 4 yr olds
0% 10% 20% 30% 40% 50% 60% 70% 80% 90% 100%
83%
52%
17%
48%
Funded onlyMixed
Base: 383 funded 2yr old children in 73 non-domestic childcare settings.3,488 funded 3 and 4 year old children in 100 non-domestic childcare settings.
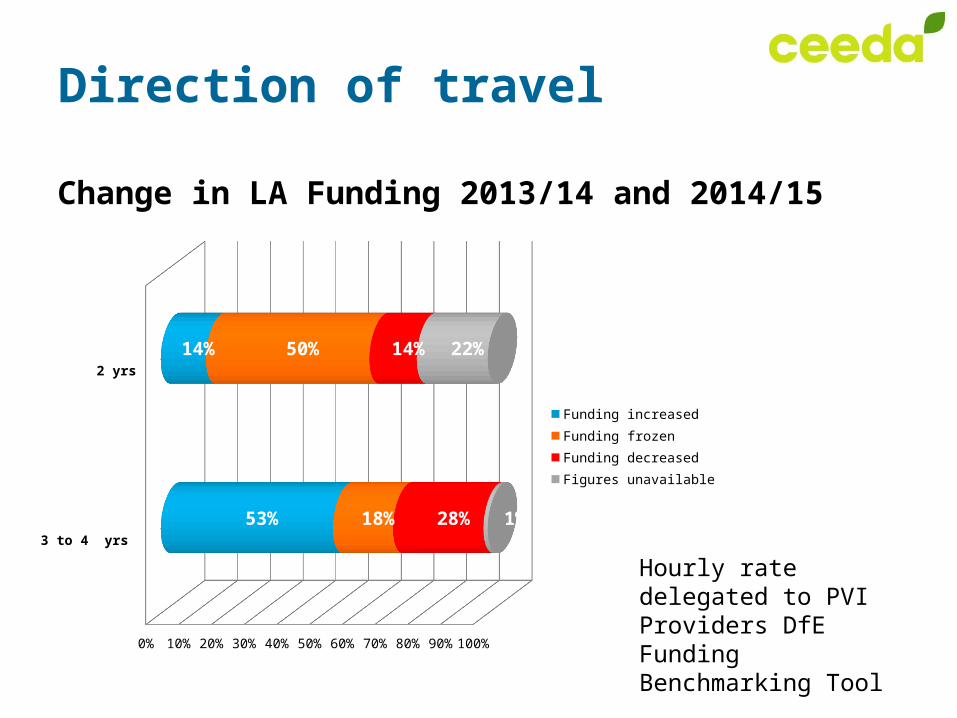
Change in LA Funding 2013/14 and 2014/15
Direction of travel
3 to 4 yrs
2 yrs
0% 10% 20% 30% 40% 50% 60% 70% 80% 90% 100%
53%
14%
18%
50%
28%
14%
1%
22%
Funding increased
Funding frozen
Funding decreased
Figures unavailable
Hourly rate delegated to PVI Providers DfE Funding Benchmarking Tool

£ How it stacks up
The Consumer Prices Index (CPI) grew by 1.6% in the year March 2013 to March 2014
Funding change 13/14 to 14/15DfE Funding Benchmarking Tool
3 to 4 years 2 years
Minimum -£1.92 -£2.04
Maximum +£0.58 +£2.02
England average +£0.03 (0.8%) -£0.05 (-1%)

Devon Education Forum 21st January 2015
“The Early Years funding formula is not sustainable over the longer term. The funding paid out to providers exceeds the level of funding received”Freezing at £4.95 per hour for 2 year olds in 2015-16, reducing to £4.88 (-1.5%) in 2016-17 and by a further 1.5% in 2017-18 to £4.80
2015/16
• Early Years Pupil Premium• 2 year old funding based on participation
Telford and Wrekin School’s Forum 9th January 2015
“In the context of the frozen level of Early Years DSG and the introduction of the Early Years Pupil Premium it is intended to leave the funding rates for 2015/16 unchanged.”

• We have started on the path of understanding delivery costs BUT much more needs to be done– Larger scale to allow local disaggregation – At different points in the year– Across all parts of the sector
• DfE recognised the knowledge gaps in a recent consultation on the Schools DSG:
“We are determined to move as quickly as possible to a fully fair allocation of the whole DSG. We cannot do this for 2015-16 because we do not know enough about the genuine cost of high needs and early years provision and how this varies between different areas. DfE Fairer Schools Funding Arrangements for 2015 to 2016. July 2014
Where next?

In the last 6 months12 November 2014
A Department for Education spokesperson says the research is:
"totally overblown. It is nonsense to suggest that childcare has been underfunded. The cost of childcare is falling in real terms and we have increased annual funding for early education by over £1bn since 2010.
24th February 2015
“Evidence suggests that the money allocated to free early education policy, and distributed by local authorities, does not cover the economic cost of delivering the free hours in the PVI sector.”
April 13th 2015
“A Conservative government will increase the hourly funding rates paid to providers in different parts of the country, and will consult on the appropriate level and design of the uplift.”

• Delivery costs are complex and variable• A robust funding model is needed which factors in:
– Deprivation and additional needs– Local labour and property markets– Changing qualification requirements – Changes to the minimum wage and pensions – National VAT and local business rate policies– Changes to EYFS e.g. integrated reviews at age 2 – Indexed to inflation
• A review of early years funding MUST be the first priority before any further expansion
Key messages