Embed Size (px)
Citation preview

Cou ntercurrent Multistage Fluidized Bed Reactor for Immobilized Biocatalysts: II. Operation of a Laboratory-Scale Reactor
Henk J. Vos, Max Zomerdijk, Dick J. Groen, and Karel Ch. A. M. Luyben Department of Biochemical Engineering, Delft University of Technology, Julianalaan 67, 2628 BC Delft, The Netherlands
Accepted for publication January 24, 7990
In Part I of this series,' we derived a model and made simulations for a multistage fluidized bed reactor (MFBR). It was concluded that the MFBR can be an attractive alternative for a fixed bed reactor when oper- ated with a deactivating biocatalyst. In Part It of this se- ries, the design of a laboratory-scale MFBR and its evaluation to investigate the practical feasibility of this reactor type, will be described. Experiments with a dura- tion as long as 10 days were carried out successfully us- ing immobilized glucose isomerase as a model reaction system. The results predicted by the model are in good agreement with the measured glucose concentration and biocatalyst activity gradients, indicating perfect mixing of the particles in the reactor compartments.
The diameters of the biocatalyst particles used in the experiments showed a large spread, with the largest be- ing 1.7 times the smallest. Therefore, an additional check was carried out, to make sure that the particles were not segregating according to size. Particles with- drawn from the reactor compartments were investi- gated using an image analyzer. Histograms of particle size distribution do not indicate segregation and it is concluded that the particles used have been mixed com- pletely within the compartments. As a result, transport of biocatalyst is nearly plug flow.
INTRODUCTION
The MFBR exhibits some attractive features when com- pared to the fixed bed type of reactor which is generally used for immobilized enzymes. The advantages include fully continuous operation without flow fluctuations at constant conversion and the possibility of treating a reactor feed that contains suspended solids. In addition, the bio- catalyst can be used to a low residual activity using just one reactor.
The objective of this work is to investigate the practical feasibility of the MFBR and to verify the reactor model. Therefore, experimentally determined values for biocata- lyst activity and substrate concentration must be compared to the results of process simulations. Kinetic and physical properties of the biocatalyst particles are needed as input parameters for the model calculations. The characterization of the biocatalyst is therefore an essential part of this study.
Biotechnology and Bioengineering, Vol. 36, Pp. 377-386 (1990) 0 1990 John Wiley & Sons, Inc.
Long-term experiments are needed to test the hydrody- namic stability of the reactor. In every compartment, the holdup of biocatalyst, and thus the bed height, must re- main constant during operation. Segregation due to im- complete particle mixing will cause an unequal residence time for small and large particles which would affect reac- tor performance. Because of this, the particles in every re- actor compartment must be mixed completely.
CHOICE OF IMMOBILIZED BIOCATALYST AND OPERATING CONDITIONS
In fluidized bed operation, the immobilized biocatalyst should preferably consist of spherical particles with a small spread in particle size. Maxazyme GI Immob, the immobi- lized glucose isomerase produced by Gistbrocades nv, is such a biocatalyst. The choice of such an industrially used biocatalyst includes a check whether the spread in particle size of a commercial biocatalyst can be small enough for successful application in a MFBR.
The enzyme is in nonviable cells from a strain of Ac- tinoplanes missouriensis, which are immobilized by occlusion in gelatin, followed by crosslinking with glu- taraldehyde. The spherical brown particles have diameters of approximately 1.0 to 1.5 X m and a dry weight content of approximately 30%. Propylene glycol is used as a preserving agent. Stored at a temperature of 283-288 K, the loss of activity is negligible over a long period of time.2
The industrial isomerization process is carried out in downflow-operated fixed bed reactors. Mg2+ is added at low concentrations as an activator. Demineralized water was used as the basis of the medium because Ca2+ has a poisoning effect on the enzyme.
In order to verify the reactor model as presented in Part I,' the biocatalyst residence time had to be several times the half-life of the biocatalyst. When the reactor is started up with fresh biocatalyst and with plug flow transport of biocatalyst, the steady-state activity gradient is reached af- ter an operation time equal to at least one biocatalyst resi- dence time. From this, it follows that an experiment under
CCC 0006-35921901040377-0 1 0$04.00

industrial isomerization conditions would take at least sev- eral months. Therefore, it was decided to operate the labo- ratory-scale reactor at an elevated temperature. For practical reasons, a low substrate concentration was used. Low concentrations of sodium disulfite were added in or- der to avoid microbial contamination of the medium. The process conditions chosen for the experiments are com- pared with the industrial conditions in Table I . The half- life for first order deactivation of the glucose isomerase shown in Table I was calculated from a correlation by Roels and van Tilburg.’
CHARACTERIZATION OF THE IMMOBILIZED BIOCATALY ST
The biocatalyst properties needed to calculate reactor per- formance are the effective diffusivities of glucose and fruc- tose inside the particle, the particle diameter and density, the biocatalyst activity and deactivation characteristic, and possible partitioning effects. Results of a previous study on the characterization of Maxazyme GI I m m ~ b , ~ using a pseudo-first-order kinetic model, were not applicable because both the effective diffusivity and the pseudo- first-order rate constant are dependent of the initial glucose concentration.
Furthermore, we did use three different batches of Maxa- zyme GI Immob, indicated by the numbers 4510, 4980, and 5090. In order to eliminate possible inaccuracies due to quality differences, each batch of biocatalyst was char- acterized individually.
A small fraction of each batch consisted of very small and rather large particles. Before any measurements were made, these were removed simultaneously with the propy- lene glycol on wet vibrating sieves.
Physical Characterization
Particle density was determined for the terminal falling ve- locity in the medium at 298 K. Alternatively, the volume change was measured when a certain amount of particles was added to the medium. Both methods resulted in a cal- culated particle density of 1100 +5 kg/m3 at 298 K .
To determine the diameter as a function of the tempera- ture, the particles were mounted in a transparent flow cell. Heated water from a thermostated bath, which was con- nected to the flow cell, was circulated through it and di- rectly contacted the particles. In this way, the diameter
was measured at different temperatures using a microscope with a calibrated eyepiece. A considerable decrease of the particle diameter was observed at temperatures above 315 K . In Figure I, relative particle shrinking is plotted against temperature for the different batches of immobi- lized enzyme. Data points at 298 K were obtained as the mean value for 50 particles, while at the other tempera- tures the diameter relative to that at 298 K was measured for 15 particles. By taking into account the particle diame- ter at temperatures lower than 343 K and assuming a smooth relationship between temperature and diameter, the relatively large measuring error can be decreased. Thus the values at 343 K (Fig. l), used in the model calculations, were calculated using a second-order interpolation polyno- mial. Shrinking of the biocatalyst particles caused an in- crease in the dry weight content of the particles, and thus an increase in the particle density. The density was esti- mated to be 1125 kg/m3 at 343 K .
Kinetic Characterization
The kinetics of the isomerization of glucose (S) to fructose (P) catalysed by glucose isomerase ( E ) were investigated, among others, by Lee et al.4 The reaction mechanism was assumed as follows:
S + E [ S E ] E + P
By applying the pseudo-steady-state assumption with respect to the enzyme-substrate complex [ E S ] , the reac- tion can be described by a modified Michaelis-Menten equation:
where:
Table I. Operating conditions for Maxazyme GI Immob
+ K m r . Kmfl ( 2 )
The equilibrium constant was determined as a function of temperature by Roels and van Tilburg3:
(3)
K,, and K,,,, are the Michaelis-Menten constants of the for- ward reaction of glucose to fructose and the reverse reac- tion, respectively. A survey of published data for these
Keq = 28.8 * exp(-1100/T)
Industrial Experimental
Temperature 333 K 343 K pH inlet 7.5 (at 298 K) 7.5 (at 298 K) pH outlet 6.8 minimum (at 298 K) glucose feed 400-450 kg/m’ 20 kg/m3 Na*S,O, 0.6 kg/m3 Mg Half-life time
7 .4 minimum (at 298 K)
0.75 kg/m’ MgSO, . 7H,O 2.63 X lo6 s (730 h)
0.75 kg/m3 MgSO, . 7H,O 0.31 X lo6 s (86 h)
378 BIOTECHNOLOGY AND BIOENGINEERING, VOL. 36, AUGUST 1990

batch 4510
batch 4980
batch 5090
0.93 0.94 298 ~ 303 308 313 318 323 328 333 338 343
Temperature [K]
Figure 1. Particle shrinking vs. temperature for various batches of immobilized glucose isomerase. In- terpolated diameters at 343 K are 1.125 mm for batch 4510, 1.354 mm for batch 4980, and 1.223 mm for batch 5090. The points in the graph were determined within an accuracy of approximately 20.09 mm.
constants was given by Kikkert et al.' Because of the dif- ferent sources of glucose isomerase and the different re- action conditions, there is a large spread in the values. However, for all data it appeared that for So = 20 kg/m3, rC; > 1O(S - SeJ. Therefore, the course of the reaction was approximated by a reversible first-order model:
Like the modified Michaelis-Menten constant, the revers- ible first-order rate constant ( k ' ) is dependent on the initial glucose concentration. The rate constant was determined experimentally at 343 K and a glucose concentration of 20 kg/m3. Measurements were carried out in downflow operated, thermostatically controlled, fixed bed glass reac- tors with an internal diameter of 0.02 m. The reactor feed was preheated at 343 K. The temperature was measured inside the jacketed part of the reactor above and just below the catalyst bed. Because of the short reaction time, by- product formation, which causes a pH decrease,6 was minimized.
Using the observed conversion and a model for the fixed bed reactor that accounts for external mass transfer resis- tance and internal diffusion limitation, k ' could be calcu- lated since this was the only unknown parameter. The modelling of a fixed bed reactor is similar to the model of a single compartment of a MFBR as described in Part I . ' For calculation of the external mass transfer coefficient, the correlation of Dwivedi and Upadhyay,' which is valid for 0.001 < Re < 10000, was used:
(5) 0.765 0.365
E ' J d = - + p
For the calculation of Jd (the mass transfer factor) in this correlation, published data for the viscosity and the dif-
fusion coefficient of glucose in aqueous solutions* were extrapolated:
DM(20 kg/m3, 298 K) = 0.65 X m'/s
pL(20 kg/m3, 298 K) = 1.04 X W3 Pa s
Pa - s pL(20 kg/m3,343 K) = 0.52 X
Assuming DM . p L / T is independent of temperature, which is allowed for dilute solution^,^ the diffusion coeffi- cient of glucose in the medium at 343 K was calculated as follows:
DM(20 kg/m3, 343 K) = 1.5 X W 9 mz/s
The diffusivity of glucose inside the biocatalyst particle is usually lower than the molecular diffusion coefficient. This decrease, which is dependent on the porosity and the tortuosity of the particle," is accounted for in the effective diffusivity. For another type of whole-cell immobilized glucose isomerase, DM/De, was calculated to be 7.3 at 333 K by Boersma et al." Applying this value, which is only slightly dependent on the temperature because of par- ticle shrinkage, to the Maxazyme GI Immob particles, we found Deff = 2.1 X lo-" m2/s at 343 K and 20 kg glucose/m3 reaction medium. This is a rough, but suffi- ciently adequate, estimation. Taking D,/De, equal to 5 or 10 results in somewhat different values for the reaction rate constant and the biocatalyst half-life. However, the calcu- lated glucose conversion in the MFBR is influenced by less than 0.1%. The effective diffusivity is not a sensitive parameter for verification of the reactor model, thus a more accurate estimation was not required.
Implicitly, the reaction rate is influenced by the effective diffusivity of fructose, as the local glucose equilibrium concentration is related to the local product concentration
VOS ET AL.: COUNTERCURRENT FLUIDIZED BED REACTOR: PART II 379
in the particle. " From the fact that glucose and fructose are rather similar compounds, it was assumed that:
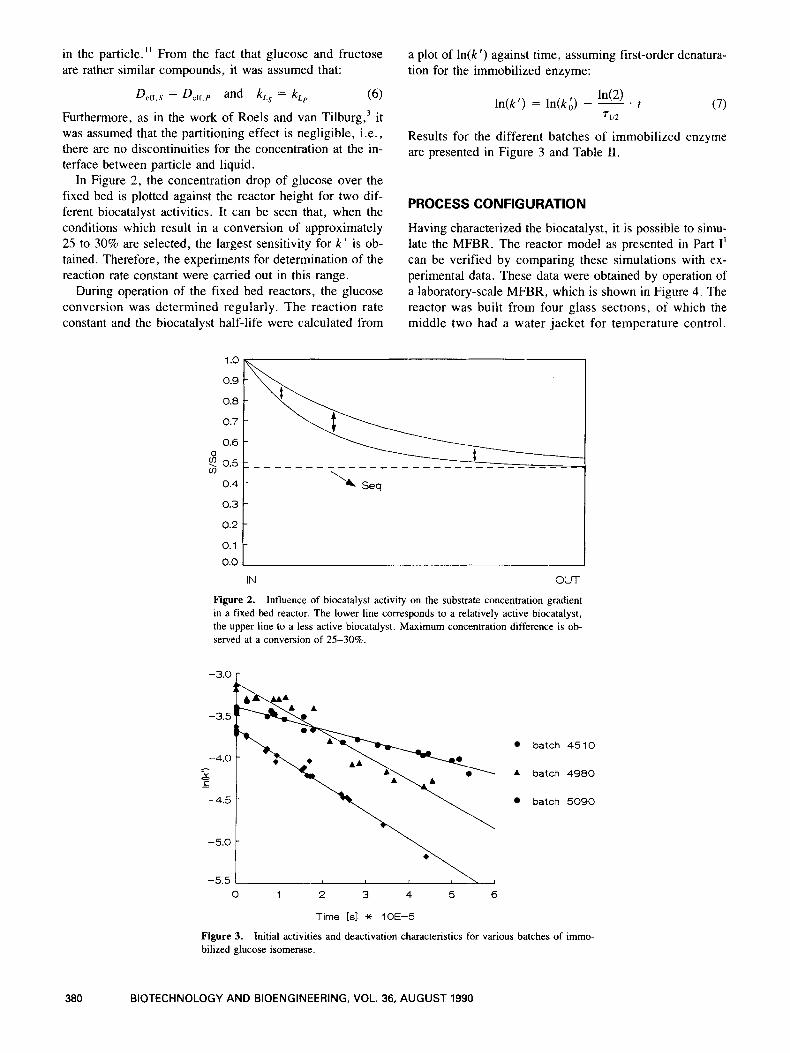
a plot of ln(k') against time, assuming first-order denatura- tion for the immobilized enzyme:
DeKS = D e w and 4, = k L p (6) Furthermore, as in the work of Roels and van T i l b ~ r g , ~ it was assumed that the partitioning effect is negligible, i.e., there are no discontinuities for the concentration at the in- terface between particle and liquid.
In Figure 2, the concentration drop of glucose over the fixed bed is plotted against the reactor height for two dif- ferent biocatalyst activities. It can be seen that, when the conditions which result in a conversion of approximately 25 to 30% are selected, the largest sensitivity for k ' is ob- tained. Therefore, the experiments for determination of the reaction rate constant were carried out in this range.
During operation of the fixed bed reactors, the glucose conversion was determined regularly. The reaction rate constant and the biocatalyst half-life were calculated from
1 .o 0.9
0.8
0.7
0.6
{ 0.5
0.4
In(k') = In(kA) - t (7)
Results for the different batches of immobilized enzyme are presented in Figure 3 and Table 11.
PROCESS CON FIGURATION
Having characterized the biocatalyst, it is possible to simu- late the MFBR. The reactor model as presented in Part I' can be verified by comparing these simulations with ex- perimental data. These data were obtained by operation of a laboratory-scale MFBR, which is shown in Figure 4. The reactor was built from four glass sections, of which the middle two had a water jacket for temperature control.
I
Seq
IN OUT
Figure 2. Influence of biocatalyst activity on the substrate concentration gradient in a fixed bed reactor. The lower line corresponds to a relatively active biocatalyst, the upper line to a less active biocatalyst. Maximum concentration difference is ob- served at a conversion of 25-30%.
-3.0 r
8 - -4.5 -
batch 4510
A batch 4980
batch 5090
-5.5 0 1 2 3 4 5 6
Time [s] * 10E-5
Figure 3. bilized glucose isomerase.
Initial activities and deactivation characteristics for various batches of immo-
380 BIOTECHNOLOGY AND BIOENGINEERING, VOL. 36, AUGUST 1990

Table 11. from different batches.
Activity, half-life, and their standard deviations for immobilized glucose isomerase
Batch 45 10 4980 5090 ~ ~
kA U / S ) 0.0254 50.0011 0.0441 +-0.0019 0.0334 20.0022 7112 (s) (2.12 50.08) x lo5 (2.41 -C0.16) X lo5 (5.18 20.26) X lo5
1 5 1 r I
Figure 4. Schematic representation of laboratory-scale MFBR and additional equipment.
Each of the thermostatically controlled sections was 0.88 m long and had an internal diameter of 0.0354 m.
The reactor was divided into 11 compartments by sieve plates which were mounted on a central axis at intervals of 0.15 m. The medium was fed into the reactor at the bottom and left the reactor via an overflow at the top. The inlet was sealed with a metal gauze to prevent transport of parti- cles to the pulsation section. Below the medium inlet, the deactivated biocatalyst was removed from the reactor to one of two liquid-filled vessels, which could be removed from the reactor during operation.
Plate Design Figure 5. Plate design for the laboratory-scale MFBR
The plates (Fig. 5) consisted of three parts. The upper and lower part had a diameter of 3.45 X m and were made of Teflon. The upper part of the plate had 4 conical holes at an angle of 45" which ended up in straight holes, 5.5 X m in diameter. The free area was approxi-
ging of the holes. Using conical holes, the medium carried all particles along and stagnant zones, which are likely to promote microbial contamination, are eliminated.
mately 10%. Silicone rubber, which had a diameter of 3.62 X m, was mounted in between the upper and Medium Supply and Instrumentation
- _
the lower part to seal the plates to the inner reactor tube. A previous design of a plate which had straight holes
was not successful, because particles stuck together in the dead volumes and agglomerates of particles caused clog-
The substrate solution was prepared continuously. Demin- eralized water was pumped by a centrifugal pump from two storage vessels of 0.3 m3 into a thermostatically con- trolled bath which was kept at 350 K, with the water level
VOS ET AL.: COUNTERCURRENT FLUIDIZED BED REACTOR: PART I t 381

in the bath being maintained constant by a level indicator controller. In this bath, the water was degassed in order to avoid gas development in the reactor because large bubbles generated in coalescing media initiate transport of particles when passing through the sieve plates. A rotary gear pump with a pulseless flow characteristic then pumped the water into a standard fermentor with a volume of 2 x m3 which was used as a mixing vessel. Before entering the pump, the water was cooled to avoid temperature overload of the pump. The fermentor was equipped with two four bladed turbine stirrers. A concentrated substrate solution, which was stored in a stirred 35 X m3 vessel, was also pumped into this fermentor by means of a peristaltic pump. In addition to mixing the two streams, the use of this fermentor allowed the pH to be monitored. The feed then passed a mass flow meter, was heated to the operating temperature and entered the reactor. The flow meter was connected to a PI-controller which controlled the pumping rate of the rotary gear pump so that the total flow rate was kept constant. The flow meter was programmed at a large time constant to avoid immediate control action during pulsation.
With the exception of the central compartment where the two jacketed sections are joined, each reactor compart- ment was equipped with two sample points. In one of these in each compartment, a Pt-100 temperature sensor was installed. The temperature sensors, the flow meter and the pH meter were connected to a micro computer via a data acquisition unit. The pulsation cycles were initiated by the computer program.
Pulsation Mechanism
Transport and addition of fresh biocatalyst were controlled by a switching unit connected to three optical sensors (LI) and seven valves (V) (see Fig. 4). Under normal opera- tion, all valves except V5 were closed. During a pulse, liq- uid flow to the reactor was recycled about the feed pump by closing V5 and opening V6. At the same moment, V1 and V2 were opened and the hydrostatic pressure in the column caused transport of liquid from the reactor to the pulsation tube, which had an internal diameter of 0.01 m and a volume of 20 X m3. The polypropylene float in the pulsation tube moved upward. As soon as it reached LI2, valves V1, V2, and V6 were closed and V5 opened. Valves V3 and V4 were then opened and the float pushed down slowly to its normal position at LI1, by means of compressed air. Valves V3 and V4 were then closed. Dur- ing upward movement of the float, the reversed flow in the reactor forced transport of biocatalyst particles through the holes of the plates which had a diameter several times that of the particles.
Biocatalyst Supply
If the level of biocatalyst in the top compartment became lower than L13, V7 opened and, controlled by the pressure
of the water head, a dense slurry of biocatalyst flowed into the upper compartment. Once the top compartment was filled up to the level of L13, V7 was closed. During a pulse, V7 was always closed to avoid addition of fresh biocatalyst beyond L13. To accomplish a smooth flow of biocatalyst, the piping between the reactor and storage ves- sel must be full of liquid.
OPERATION OF THE MULTISTAGE FLUIDIZED BED
Before startup, the storage vessel was filled with a slurry of biocatalyst in medium without glucose. This medium was also used to fill the water head. A concentrated substrate solution (15 kg/m3 MgSO, 1 7H,O, 12 kg/m3 Na,S,O,, and approximately 400 kg/m3 glucose, pH ad- justed with NaOH) was diluted 20-fold with demineralized water in the mixing vessel.
The startup procedure of the reactor was as follows. Biocatalyst was added to the top compartment. During this period, the flow rate in the holes of the plates was lower than the terminal falling velocity of the particles, and the reactor therefore became completely filled to the ninth compartment with biocatalyst. When the reactor was heated to 343 K, the particles shrank to their operational diameter. The liquid flow was then increased slowly to ap- proximately 1 , l times the flow rate required for the experi- ment. The bed expanded until a steady state was reached, with the fluidized particles filling each compartment. The flow rate was then decreased to the set point, resulting in clearly separated fluidized beds with the top of each bed approximately 0.01 m below the plate of the compartment above. If necessary, compartment 11 was filled to the level of L13.
After the excess biocatalyst below the bottom compart- ment was removed from the reactor, data acquisition and pulsation were started. At every pulse, values for the com- partment temperatures, flow rate, and pH in the mixing vessel were stored. The temperature was constant at 343 k0 .2 K in every compartment during the whole pe- riod of operation. Transport of biocatalyst could be con- trolled by either adjusting the pulsation frequency, or by adjusting the pulsation volume by moving the level indica- tors along the pulsation tube. During every pulse, which took less than a second, approximately 3% of the bio- catalyst was transferred to the compartment below. The amount of biocatalyst transported was determined regularly by weighing the particles which left the reactor. During the experiments, both the flow of biocatalyst and the expanded bed height in every compartment remained constant within measuring accuracy.
m3) were taken through a septum from each compartment and analyzed for glucose by an enzymatic method.” The reac- tor was cooled down to approximately 315 K, when bio- catalyst was taken from the compartments by removing the screw caps at the sample points, starting at the top com- partment. The residual activity of the biocatalyst at the
At the end of an experiment, liquid samples (
382 BIOTECHNOLOGY AND BIOENGINEERING, VOL. 36, AUGUST 1990

compartments was determined several times by immediate re-use of the immobilized enzyme in fixed bed reactors (Fig. 3).
RESULTS AND DISCUSSION
In Table 111, the steady-state operating conditions of the experiments which were carried out in the MFBR are listed. All experiments were camed out at a particle frac- tion of approximately 0.5 in the fluidized bed. The high holdup of particles allowed a large conversion in a rela- tively small reactor. Biocatalyst residence time was varied but the range of conversions obtained was small. The reac- tion was strongly limited by diffusion of glucose, and bio- catalyst deactivation was compensated for, in part, by an increase of the effectiveness factor.
Axial dispersion in the MFBR was described by a four- tanks-in-series model as suggested by Streat and Takel. l 3
The process simulation, however, is little influenced by the
number of liquid tanks per reactor compartment because the reaction rate was, for the most part, controlled by dif- fusion inside the particles and the conversion per compart- ment was low.
The error range for the observed glucose conversions given in Table 111 was calculated from a 2% error in the determination of the glucose concentration. Within this minimum range of inaccuracy, good agreement between the experimentally obtained values and model calculations for the conversion was found. The actual range of inaccu- racy will be somewhat larger, but the errors in the charac- terization of the biocatalyst or other potential inaccuracies (e.g., in the determination of biocatalyst holdup or flow rate) do not need to be taken into account to explain the differences between experiment and model calculations.
The observed concentration gradients over the reactor are also in good agreement with the model calculation. As an example, the observed and simulated gradients for run 5 are shown in Figure 6.
Table 111. Steady-state operating conditions and results ~ ~ ~ ~ ~ ~ ~ ~
Run 1 2 3 4 5 6 7
batch 4510 4510 4980 4980 4980 5090 5090 Biocatalyst
4" x lo6 (m3/s)
Pulsation
Biocatalyst
So (kg/m3)
interval (s)
hold-up (kg at 298 K)
7b ( X 10-7 (s)
t,,,/Tb
7 b /7112
Calculated
Calculated bed height (m)
bed porosity
tobscrved
5.00 24.1
600
1.03 I .47 1 .-I2 0.69
0.150
0.523 0.392 2.018 0.385 0.40 0.48
5.00 20.0
1800
1.03 4.53 1.32 2.14
0.149
0.523 0.321 f .020 0.330 0.41 0.65
5.56 20.1
900
1.03 2.47 1.41 1.02
0.152
0.510 0.396 2.018 0.390 0.27 0.36
5.56 19.5
1200
1.04 3.47 1.12 1.44
0.153
0.510 0.385 2.018 0.378 0.27 0.40
5.56 19.3
600
1.02 1.70 1.52 0.71
0.151
0.510 0.406 2.018 0.400 0.27 0.33
4.72 20.3
600
1.03 1.90 I .39 0.37
0.146
0.500 0.433 f.017 0.426 0.33 0.37
5.00 20.2
1800
1.03 6.62 I .27 1.28
0.149
0.509 0.370 2.019 0.385 0.34 0.46
1.0
. 9
. e
. 7
.6
.5
. 4
.3
.2
. I
0.0 1 2 3 4 5 6 7 8 9 10 11
Bottom-section Top-section Compartment number
Figure 6. Observed glucose concentration gradient and process simulation for run 5 in MFBR.
VOS ET AL.: COUNTERCURRENT FLUIDIZED BED REACTOR: PART I1 383

The values obtained for the residual activity at the reac- tor compartments are shown in Table IV. Good agreement between the measured and calculated values was obtained for all residual activity determinations, except compart- ment 4 of run 2. The reasons for this latter poor agreement are not clear.
An additional check on particle mixing, independent of the activity gradient, was made by determining the particle size distribution in the compartments. For some of the ex- periments, samples of particles from the top, middle, and bottom compartments were examined using an image ana- lyzer. With this technique, it is not possible to distinguish between a single particle or an agglomerate, and it is there- fore essential that the particles do not contact each other. This is difficult to achieve with particles in medium but desiccation causes continuous shrinkage of the particles if the liquid is drained off. To avoid this problem, the parti- cles were immersed in a 33% propylene glycol solution for half an hour. This caused the particles to shrink by ap- proximately lo%, but during the analysis the shrinkage due to desiccation was slowed down considerably. In every sample, the equivalent sphere diameter was determined for 250 particles. This is the diameter of a sphere with an area
Table IV. ity in the reactor compartments.
Observed and calculated values for residual biocatalyst activ-
k ’ / k h k ’ / k A Run Compartment (observed) (calculated)
equal to the projected surface of the particles. The result- ing particle size distribution and mean particle diameter for three runs are shown in Figures 7,8, and 9. The deviations of the diameters in the compartments compared to the mean diameter for top, middle, and bottom compartments are listed in Table V.
For one of the particle samples, the particle size distri- bution was determined twice, and it appeared that the mea- suring inaccuracy of the mean particle diameter for a total of 250 particles was at least 1.4%. If segregation occurs, small particles accumulate in the top compartments be- cause the larger particles are transported preferentially. A decreasing particle diameter from the top to the bottom of the MFBR may be accounted for by attrition. As runs 2 and 5 do indicate the opposite effect of run 7 and the devia- tions are not far outside the 1.4% range, it is concluded that the particle size distribution is equal for all compart- ments. Even for the large spread in particle diameter found in batch 4980, the histograms do not indicate accumulation of any particular fraction (Fig. 8).
From these results, together with the observed biocata- lyst activity gradient, it is concluded that each compart- ment can be regarded as perfectly mixed with respect to the biocatalyst. For the laboratory-scale reactor, this results in a series of 11 mixed vessels and thus nearly plug flow
Table V. MFBR with different batches of biocatalyst.
Deviations from mean particle diameter in three runs in the
2 4 0.44 50.03 0.36 2 9 0.67 20.03 0.68 3 7 0.71 20.03 0.73 6 3 0.83 20.04 0.81 7 3 0.47 20.03 0.50 7 8 0.71 50.02 0.73
Run 2 5 7
Mean diameter (mm) 1.105 1.288 1.181 Deviation top (%) + 1.72 + 1.01 -0.59 Deviation middle (%) +0.36 +0.70 -0.34 Deviation bottom (%) -2.08 -1.63 +0.85
0.9 1 .o 1.1 1.2
diameter [mm]
Figure 7. Mean particle diameter and histograms of particle size distribu- tion for run 2, biocatalyst batch 4510: bottom compartment, mean diameter 1.082 mm, (black bars); middle compartment, mean diameter 1.109 mm, (block-pattern bars); top compartment, mean diameter 1.124 mm, (line-pattern bars).
384 BIOTECHNOLOGY AND BIOENGINEERING, VOL. 36, AUGUST 1990

50
40
- I s 30
0
E! 20
c
u w
Lc
1c
C 0.9 1.1 1.3 1.5 1.7
diameter [mm]
Figure 8. Mean particle diameter and histograms of particle size distribution for run 5 , biocatalyst batch 4980: bottom compartment, mean diameter of 1.267 mm, (black bars); middle compartment, mean diameter of 1.297 mm, (block-pattern bars); top compartment, mean diameter of 1.301 mm, (line- pattern bars).
40
30
- s
0 20
L-
c w 0 m
.I=
1 0
1 .o 1.1 1.2 1.3
diameter [mm]
Figure 9. Mean particle diameter and histograms of particle size distribution for run 7, biocatalyst batch 5090: bottom compartment, mean diameter of 1.191 mm, (bIack bars); middle compartment, mean diameter of 1.177 mm, (block-pattern bars); top compartment, mean diameter of 1.174 mm, (line- pattern bars),
transport of particles, ensuring an optimal use of the bio- catalyst.' For all experiments, an expanded bed height of approximately 0.135 m was observed. This is somewhat lower than the calculated values (20.15 m). This may pos- sibly be accounted for by the fact that the particles were slightly ovoid, with a length/breadth ratio that was deter- mined to be 1.07 by the image analyzer, or the relatively large influence of entrance effects in such a small reactor compartment.
CONCLUSIONS
The theoretical concept of a MFBR with continuous re- freshment of a deactivating biocatalyst can be very well re- alized on a small scale. It is expected that this conclusion will also hold on the large scale as existing full scale ion- exchange plants are hydrodynamically very similar. l4 The laboratory-scale reactor can be operated without segrega- tion of solids with a uniform density, even when the diame-
VOS ET AL.: COUNTERCURRENT FLUIDIZED BED REACTOR: PART II 385

ter of the larger particles is 1.7 times the diameter of the smaller particles.
Due to countercurrent plug flow transport of substrate and particles, the biocatalyst can be used efficiently down to a low residual activity in one reactor. Using a MFBR, some disadvantages of conventional fixed bed operation of immobilized enzyme processes' are thus circumvented. The reactor model is in good agreement with the experimentally obtained results, thus it can be used as a tool for process optimization. An optimal choice of particle diameter and enzyme loading, or creating a temperature gradient over the column are means by which process efficiency might be improved.
NOMENCLATURE
386
area of a projection of the particle (m2) particle diameter (m) effective diffusivity (m2/s) molecular diffusivity (m2/s) mass transfer factor (Sc0 67 . kL/uO) reversible first order reaction rate constant ( l /s) initial reaction rate constant (I/s) external mass transfer coefficient (m/s) equilibrium constant (dimensionless) modified Michaelis-Menten constant (kg/m3) Michaelis-Menten constant for forward reaction (kg/m3) Michaelis-Menten constant for reverse reaction (kg/m3) Reynolds number (dpuo . p L / p L ) glucose concentration (kg/m3) equilibrium glucose concentration (kg/m3) initial glucose concentration (kg/m3) Schmidt number ( p L / ( D M . p L ) ) duration of an experiment (s) superficial velocity (m/s) reaction rate (kg/m3 . s) maximum reaction rate (kg/m3 . s)
Greek letters E
4" volumetric liquid flow (m'/s) pL qov overall effectiveness factor (dimensionless) pL liquid density (kg/m3) 76 biocatalyst residence time (s) 7,,2 biocatalyst half-life time (s) 5 conversion [(So - S)/So]
porosity of fixed bed (dimensionless)
absolute viscosity (Pa . s)
These investigations were supported in part by The Netherlands Technology Foundation (STW) and by DSM Central Laboratory (Geleen, The Netherlands), Immobilized glucose isomerase was obtained freely from Gist-brocades nv (Delft, The Netherlands).
References
1. H. J. Vos, D. J. Groen, J. J. M. Potters, and K. Ch. A. M. Luyben,
2. Gist-brocades nv, technical data sheet Mgi-02-01/83.03. En. 05,
3. J. A. Rods and R. van Tilburg, ACS Symp. Ser., 106, 147 (1979). 4. Y. Y. Lee, A. R. Fratzke, K. Wun, and G. T. Tsao, Biotechnol. Bio-
5. A. Kikkert, K. Vellenga, H. G. J. De Wilt, and G. E. H. Joosten,
6 . J. Straatsma, K. Vellenga, H. G. J. de Wilt, and G. E. H. Joosten,
7. P. N. Dwivedi and S. N. Upadhyay, Ind. Eng. Chem. Process Des.
8. Landholt-Bomstein, Zahlenwerte und Funktionen, 6th ed. (Springer-
9 . C. R. Wilke and P. Chang, Am. Inst. Chem. E n g . J . , I, 264 (1955). 10. J. G. Boersma, K. Vellenga, H. G. J. De Wilt, and G. E. H. Joosten,
Biotechnol. Bioeng., 21, 1711 (1979). 11. H. J. Vos, P. J. Heederik, J. J. M. Potters, and K. Ch. A. M. Luyben,
Bioproc. Eng., 5 , 63 (1990). 12. H. U. Bergmeyer, E. Bernt, F. Schmidt, and H. Storch, in Methoden
der enzymatischen Analyse, H. U. Bergmeyer, Ed. (Verlag Chemie, Weinheim, 1974), Band 2, p. 1241.
Biotechnol. Bioeng., 36, 367 (1990).
1983.
eng., 18, 389 (1976).
Biotechnol. Bioeng., 23, 1087 (1981).
Ind. Eng. Chem. Process Des. Dev., 22, 349 (1983).
Dev., 16, 157 (1977).
Verlag, Heidelberg, 1969), Teil 11, Band 5, pp. 379 and 645.
13. M. Streat and G. J. N. Takel, Hydrometallurgy, 8, 101 (1982). 14. M. Streat, Sep. Proc. Tech., 1, 10 (1980).
BIOTECHNOLOGY AND BIOENGINEERING, VOL. 36, AUGUST 1990