Embed Size (px)
Citation preview
Physics of Atomic Nuclei, Vol. 67, No. 5, 2004, pp. 961–984. Translated from Yadernaya Fizika, Vol. 67, No. 5, 2004, pp. 983–1005.Original Russian Text Copyright c© 2004 by Glushkov.
ELEMENTARY PARTICLES AND FIELDSExperiment
Could Primary Particles of Ultrahigh Energy Be Neutral?
A. V. Glushkov*
Institute of Cosmophysical Research and Aeronomy, Yakutsk Research Center, Siberian Division,Russian Academy of Sciences, pr. Lenina 31, Yakutsk, 677891 Russia
Received December 15, 2002; in final form, July 3, 2003
Abstract—Results are presented that were obtained from an analysis of the nuclear-physics and astro-physical features of extensive air showers of energy in the region E0 ≥ 1015 eV that were recorded at theYakutsk array and other arrays over the world. It is shown that, at some values of E0, different data setsdisplay local irregularities that are correlated in energy and which are interpreted as a manifestation ofneutral particles of an extragalactic origin. The directions of their arrival point to the Supergalaxy plane(Local Supercluster of galaxies). c© 2004 MAIK “Nauka/Interperiodica”.
1. INTRODUCTION
Investigation of the composition of primary cos-mic radiation of ultrahigh energy in the region E0 ≥1015 eV is one of the most difficult problems in as-trophysics. Since the discovery of a knee in the spec-trum of extensive air showers at E0 ≈ 3 × 10¹⁵ eVby a group from Moscow State University more than40 years ago [1], a great number of relevant exper-iments have been performed, but there is still nounambiguous understanding of this phenomenon. Aclarification of its nature would greatly contribute tosolving the problem of the origin of cosmic rays ofultrahigh energies up to about 1020 eV.
There exists the opinion that, at energies in therange 3 × 10¹⁵ < E0 ≤ 1017 eV, the composition ofprimary cosmic radiation is significantly enriched inheavy nuclei (see, for example, [2, 3]), but that, inthe range 1017 < E0 ≤ 1018 eV, it undergoes a sharpreverse change, toward an increase in the fractionof protons [4]. The heaviest composition is assumedto correspond to E0 ≈ 1017 eV. This picture can beexplained within the diffusion model [5], which alsoensures agreement with the shape of the energy spec-trum of primary cosmic radiation in the region aroundthe aforementioned knee.
Important information about the origin of cosmicrays is contained in their anisotropy. A harmonicanalysis of the distribution of the arrival directionsof extensive air showers with respect to the rightascension [6] is one of the basicmethods for assessingthe anisotropy of the global flux of primary cosmicradiation. The application of this method at the Hav-erah Park array [7] resulted in discovering, at E0 ≈
*e-mail: [email protected]
1063-7788/04/6705-0961$26.00 c©
1017 eV, a statistically significant anisotropy that wasfirst confirmed at the Yakutsk array [8] but was thendisproved [9]. The AGASA (Akeno Giant Air ShowerArray) group found a significant anisotropy [the am-plitude of its first harmonic being about (4 ± 0.06)%]at E0 ≈ (8–20) × 1017 eV [10]. This anisotropy iscaused by an increased flux of primary cosmic ra-diation from the region in the vicinity of the Galaxycenter. This result was confirmed and refined by anAustralian group at the SUGAR (Sydney UniversityGiant Air Shower Recorder) array [11].
The aforementioned (and many other) results arebased on the assumption that primary cosmic ra-diation of ultrahigh energy consists predominantlyof charged particles (protons and nuclei of variouscosmic elements). They are strongly mixed by themagnetic field of the Galaxy, so that their distributionover the celestial sphere is nearly isotropic. Undersuch conditions, it is difficult to reveal local sourcesof primary cosmic radiation.
However, these ideas are not unquestionable, be-cause there are still no direct measurements of thecomposition of primary cosmic radiation of ultrahighenergy and because conclusions drawn from data onextensive air showers are ambiguous and contradic-tory. It was previously reported in [12, 13] that, inthe arrival directions of primary cosmic radiation ofenergy in the region E0 ≥ 4 × 10¹⁷ eV, there is aconsiderable number of groups of showers in nar-row solid angles. Their distribution over the celestialsphere has a small-scale ordered structure that can-not be explained by random statistical processes. Inthe opinion of the present author, this may be due toa distribution of extragalactic pointlike sources of pri-mary cosmic radiation that generate neutral particles.Recently, this hypothesis was additionally confirmed
2004 MAIK “Nauka/Interperiodica”
962 GLUSHKOV
15 16 17 18 19log
E
0
[eV]
40
50
60
70
80
90
σ
(
X
m
), g
Òm
–2
(
b
)
p
Fe
400
500
600
700
800
X
m
, g Ò
m
–2
(
a
)
p
Fe
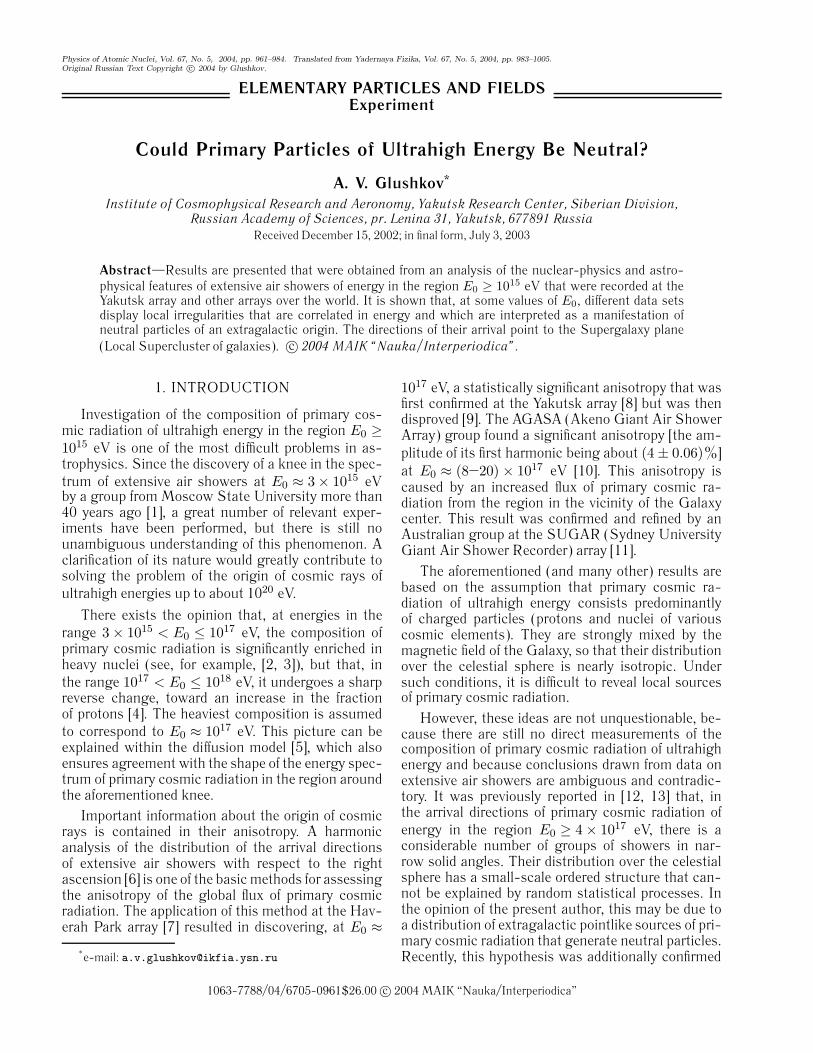
Fig. 1. (a) Mean depth of the shower maximum and (b) its fluctuations versus primary energy: (open circles) generalizedexperimental results from [21], (closed triangles) data from [4], (closed circles) estimates of σ(Xm) on the basis of relation (3)for a mixed composition featuring protons and iron nuclei that is supplemented with the values obtained in this study for 〈ln A〉(see Fig. 2a below), (solid lines) results of the calculations from [23] for primary protons (p) and iron nuclei (Fe) on the basis ofthe QGSJET model [24], and (dashed lines) extrapolation of the results.
in [14–20]. Presented below are new experimentalresults favoring this point of view.
2. DEPTH Xm OF THE SHOWER MAXIMUMAND ITS FLUCTUATIONS
Let us first consider a traditional method accord-ing to which the composition of primary cosmic radi-ation is estimated by using the features of the spatialdevelopment of extensive air showers. The depth Xm
of the shower-development maximum is one of the
PH
extensive-air-shower parameters that are the mostsensitive to the composition of cosmic rays. We have
XAm
∼= X0m + ER(lnE0 − lnA) (1)
= Xpm − ER lnA [g/cm2],
where A is the atomic weight of primary particles;ER = ∂Xm/∂ lnE0; XA
m and Xpm are the depths of
the maxima of showers that are generated by primarynuclei and primary protons, respectively; and X0
m isa constant that depends on the model chosen fordescribing the development of extensive air showers.
YSICS OF ATOMIC NUCLEI Vol. 67 No. 5 2004
COULD PRIMARY PARTICLES OF ULTRAHIGH ENERGY BE NEUTRAL? 963
From relation (1), one can find lnA; in the case ofa mixed composition, we have 〈lnA〉 =
∑Wi lnAi,
where Wi is the fraction of nuclei whose atomicweight is Ai. Since the parameter X0
m is knowninsufficiently well, estimates of lnA on the basis of ex-perimentally measured values of Xm are uncertain toa considerable extent. Estimates of relative changesin the composition of primary particles versus E0 aremore precise:
∂ lnA/∂ lnE0 = 1 − (1/ER)(∂XAm/∂ lnE0). (2)
For a broad range of primary energies, the re-sults obtained in [21] for the depths of the showermaxima by averaging Xm values measured at var-ious arrays worldwide are shown by open circles inFig. 1a. These data (107 values) were supplementedby 132 Xm values found in [21] by the method ofmodel-independent parameters [22] from lateral dis-tributions of charged particles and from the fractionof muons among the total number of charged parti-cles (electrons and muons) according to various dataobtained worldwide. The two data sets (107 and 132values) comply with each other.
The closed triangles in Fig. 1a represent experi-mental data reported in [4], which were obtained at ahybrid facility that consisted of the High-ResolutionFly’s Eye Air Fluorescence Detector (HiRes) and theMichigan Muon Array (MIA). The HiRes recordsthe ionization fluorescence of extensive air showersin the vicinity of the cascade-curve maximum andtherefore sees Xm directly. As to the MIA, it is usedto improve the accuracy in determining this param-eter. The data in question are consistent with thoseconsidered above, especially when E0 is increasedby a factor of 1.5 in the HiRes/MIA experiment (forthe normalization with respect to E0, see Section 3below).
The solid lines in Fig. 1 show the dependencesXm(E0) found for primary (p) protons and iron (Fe)nuclei [23] according to the QGSJET model [24].They correspond to the case where the rate of theshift of the shower maximum is ∂Xm/∂ logE0 =58 g/cm2. The dashed lines represent extrapolationsof the calculations to the region of lower primaryenergies.
It can be seen that the experimental dependenceXm(E0) is of a rather complicated character. At indi-vidual points, there are local irregularities, which areespecially pronounced at energies of E0 ≈ 5 × 10¹⁵
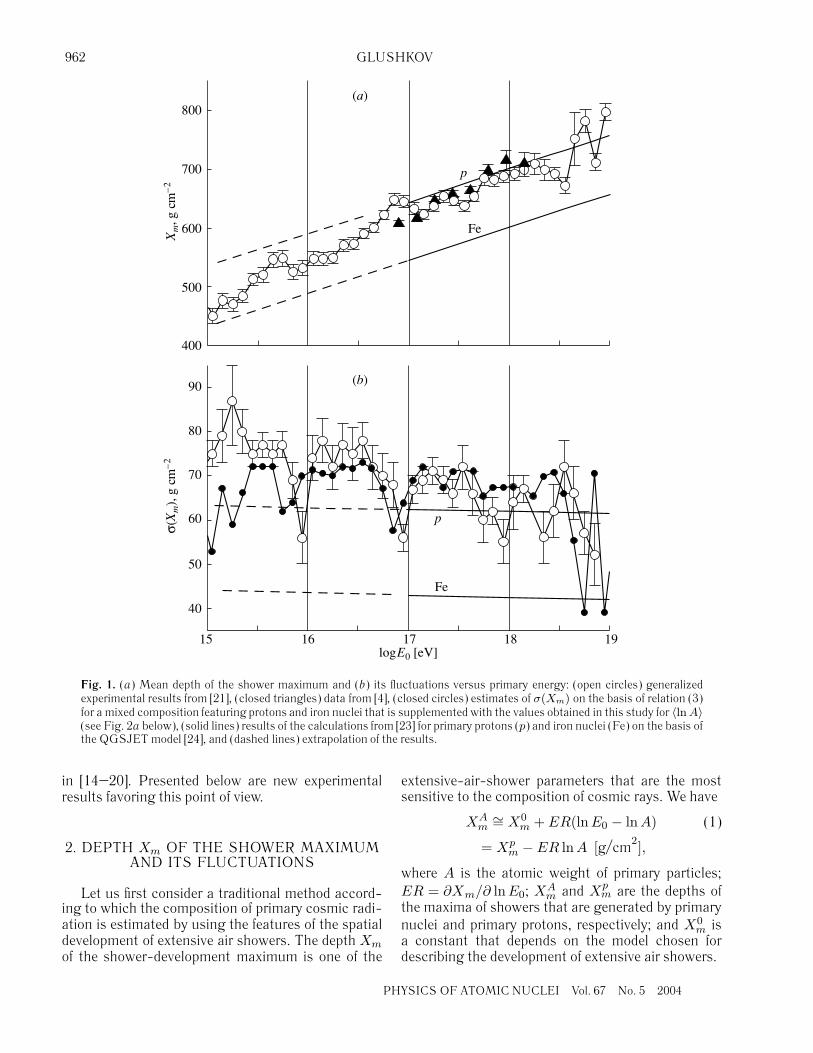
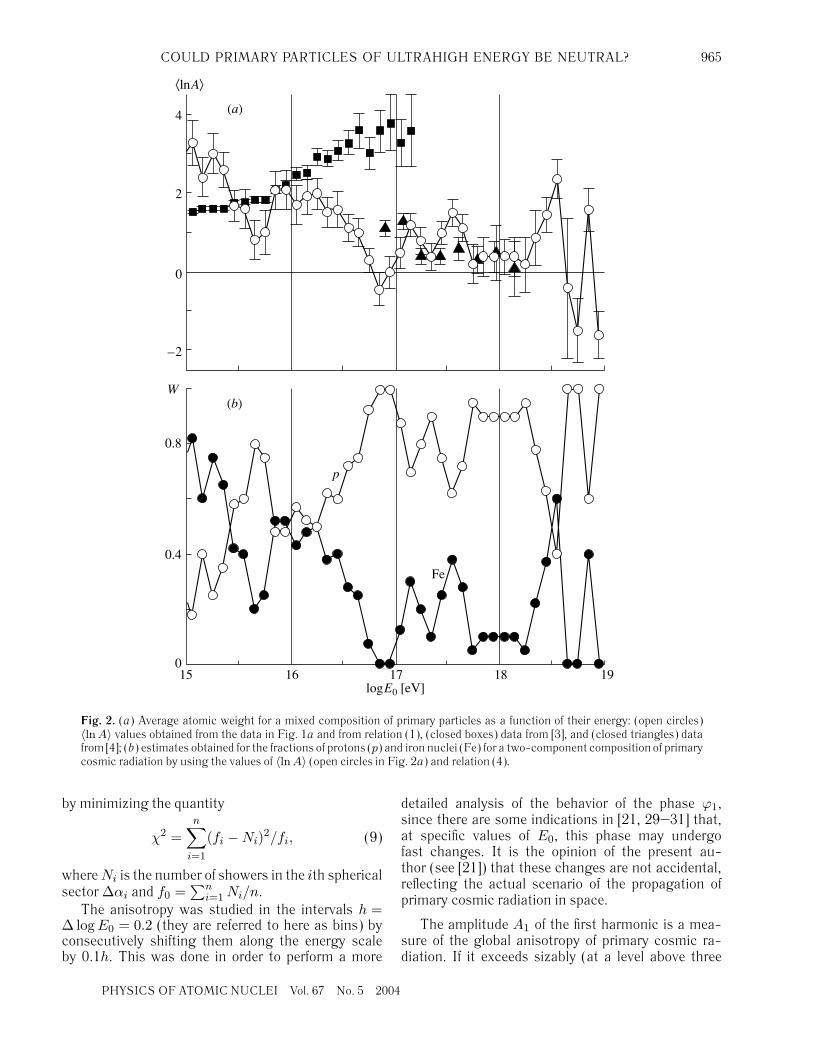
and 7 × 10¹⁶ eV and at energies above 3 × 10¹⁸ eV.By and large, the composition of primary cosmicradiation gradually becomes lighter with increasingenergy. By using relation (1) for the QGSJET modeland the data in Fig. 1a, one can estimate 〈lnA〉. Theresulting values are given in Fig. 2a.
PHYSICS OF ATOMIC NUCLEI Vol. 67 No. 5 200
Let us consider fluctuations of the depth of theshower maximum, σ(Xm). The open circles in Fig. 1brepresent values obtained in [21] by averaging nu-merous data obtained worldwide. They also includethe σ(Xm) values found additionally in [21] fromfluctuations of the lateral distributions of electronsand muons by the aforementioned method of model-independent parameters on the basis of data fromvarious facilities operating worldwide.
Near the aforementioned irregularities, the fluc-tuations of the depth of the shower maximum areless than in neighboring energy regions. From therelation [25]
σ2(Xm) ∼= (σp(1 − η〈lnA〉))2 (3)
+ (σ(lnA))2((ησp)2 + ER2),
where σp represents fluctuations of the depth of themaximum of showers generated by primary protons,(σ(lnA))2 =
∑Wi(lnAi)2 − 〈lnA〉2, and η = 0.1–
0.2 (its specific value depends on the choice of modelfor describing the development of extensive air show-ers), it follows that, in the case of a pure composition(σ(lnA) = 0), small fluctuations σ(Xm) are possiblefor A� 1 nuclei; at A = 1, they are achieved via adecrease in σp (for example, owing to an increase inthe cross section for inelastic nuclear interactions inair).
We will make use of relation (3) and the QGSJETmodel in order to estimate the possible fluctuationsσ(Xm) on the basis of 〈lnA〉 values that we obtained(see Fig. 2a). For the sake of simplicity, we will con-sider the version of a mixed composition featuringprotons and iron nuclei. From the relation
〈lnA〉 =W1 ln(1) +W2 ln(56), (4)
we then derive the weight functionsW1 = 1−W2 (forp) andW2 = 〈lnA〉/ ln(56) (for Fe) shown in Fig. 2bby, respectively, open and closed circles. At η = 0.15,we obtain the σ(Xm) values represented by closedcircles in Fig. 1b.
It can be seen that the fluctuations σ(Xm) ofthe depth of the shower maximum that were ob-tained from the dependence Xm(E0) for the abovetwo-component composition (p+ Fe) and those thatwere measured directly agree within the errors. More-over, the local irregularities atE0 ≈ (6–8)× 1015 and(6–8) × 1016 eV are also in accord in these two inde-pendent results, this being, in all probability, indica-tive of a nonaccidental origin of these irregularities.
The closed boxes in Fig. 2a represent data ob-tained in the KASKADE experiment [3]. These dataare in a glaring contradiction with the estimates pre-sented here and with the result reported in [4].
4
964 GLUSHKOV
3. ENERGY SPECTRUM OF PRIMARYCOSMIC RADIATION
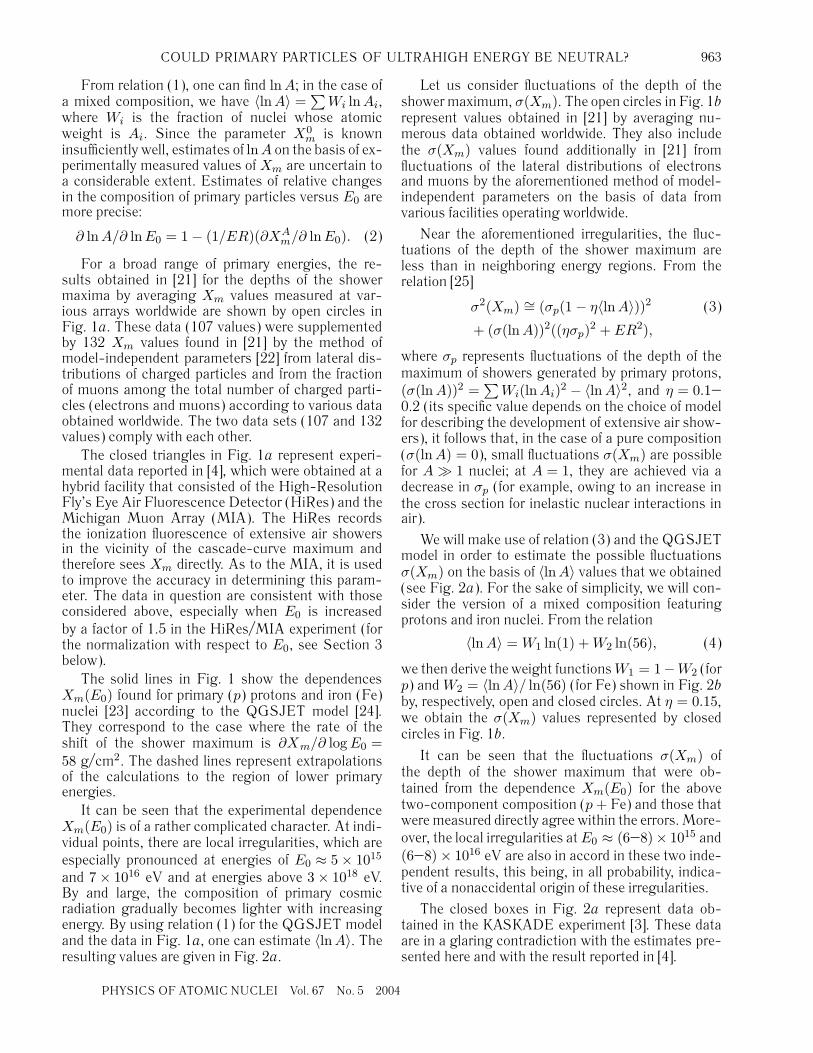
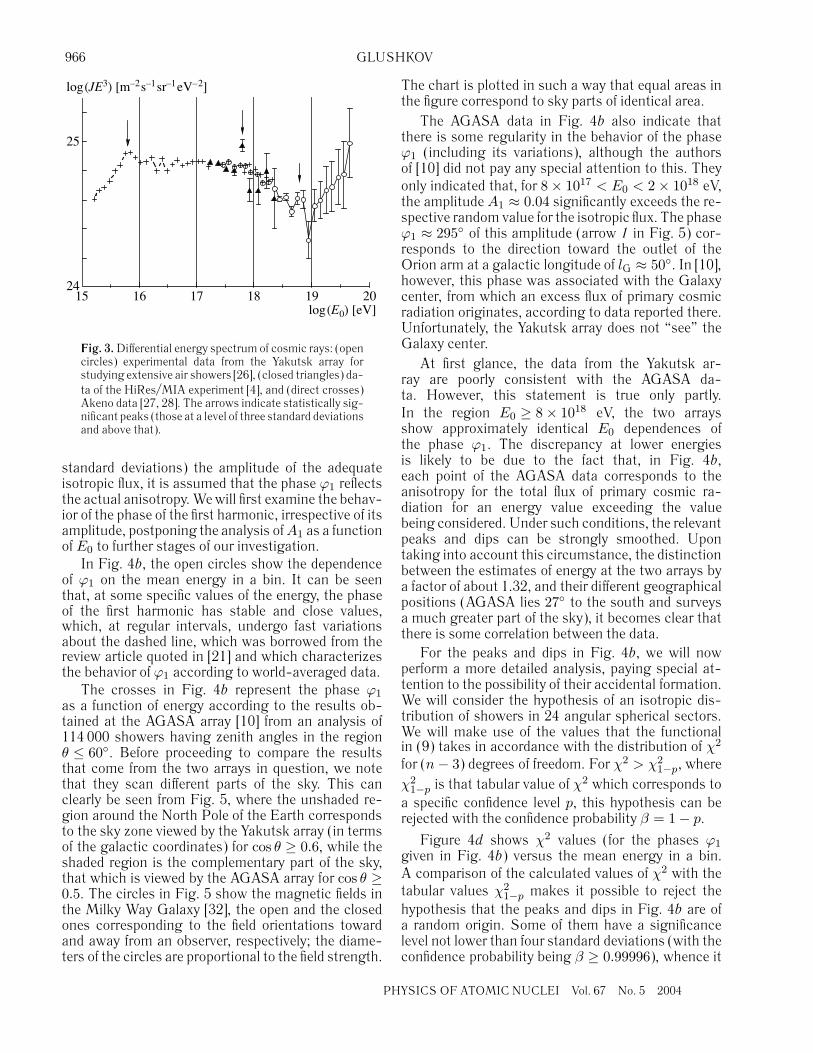
The energy spectrum of cosmic rays of ultrahighenergy can shed additional light on the problem of thecomposition of primary cosmic radiation. In Fig. 3,the differential energy spectrum of extensive air show-ers that was obtained at the Yakutsk array [26] isshown by open circles. This spectrum includes onlythose events that are characterized by zenith anglesin the region θ ≤ 45◦ and which were selected bymaster triangles where the spacings between the sta-tions involved were 500 m. The crosses in this figurerepresent the spectrum [27] measured at the Akenoarray [28], which consists of 156 scintillation detec-tors of area 1 m2 that are arranged within a circle ofradius 1 km. The Akeno spectrum is superimposed onour spectrum by increasing the energy correspondingto the data in [27] by a factor of 1.32, the points beingconcurrently shifted above by 2 log(1.32) = 0.35. Theclosed triangles in Fig. 3 represent the spectrummea-sured in the HiRes/MIA experiment [4]; this spec-trum was also rescaled to the energy region of thespectrum from [26] by increasing the energy of thedata in [4] by a factor of 1.5.
Here, we can see a series of local splashes of theintensity of primary cosmic radiation that are indi-cated by arrows. The first of these, at E0 ≈ (6–7) ×1015 eV, correlates in energy with the irregularities inFigs. 1 and 2 and, in all probability, has a commonorigin with them. The peaks that follow this one, thoseat E0 ≈ (6–7) × 1017 and (6–7) × 1018 eV, are alsostatistically significant (not less than three standarddeviations). All three peaks can be attributed to afast change in the composition of primary cosmicradiation toward an overwhelming dominance of pro-tons. It is difficult to explain this phenomenon withinthe diffusion model of cosmic-ray propagation in theMilky Way Galaxy.
4. ANISOTROPY OF PRIMARY COSMICRADIATION
Many experiments devoted to studying the com-position of primary cosmic radiation of ultrahigh en-ergy lead to contradictory results. The problems thatarise in this connection lie in the uncertainty of thevery approach to solving them rather than in method-ological features of one experiment or another, be-cause the majority of the methods for determiningthe composition of primary cosmic radiation are in-direct. They are based on a comparison of the ob-served features of extensive air showers with theircalculated counterparts that are found by using somemodel concepts of the development of these showersand a specifically preassigned composition of primary
P
cosmic radiation. Here, one encounters some kind ofa vicious circle: in order to choose a correct model, itis necessary to know the composition of primary par-ticles, but, in order to determine this composition, it isnecessary to have a correct model of the developmentof extensive air showers.
In view of this, investigations of the anisotropy ofprimary cosmic radiation—in particular, searches forlocal sources—play a very important role here, sincethe arrival directions of cosmic rays do not dependon any model concepts concerning the developmentof extensive air showers. In [12–20], it was shownthat, at E0 > 1017 eV, some part of primary cosmicradiation has a small-scale ordered structure asso-ciated with the distribution of extragalactic pointlikesources of primary cosmic radiation, which are likelyto generate neutral particles.
4.1. Harmonic Analysis
Let us first investigate the anisotropy of the globalflux of primary cosmic radiation. We consider exten-sive air showers that are characterized by energies inthe region E0 ≥ 1017 eV and zenith angles satisfyingthe condition cos θ ≥ 0.6 (θ ≤ 53◦) and which wererecorded at the Yakutsk array over the period between1974 and 2002. Selected for the present analysis areonly those showers for which the arrival directionswere found on the basis of data from four or morestations and whose axes were within the array centralcircle of radius R ≤ 1000 m. The primary-particleenergy E0 was determined from the relations
E0 = (4.8 ± 1.6) × 1017(ρs,600(0◦))1.0±0.02 [eV], (5)
ρs,600(0◦) (6)
= ρs,600(θ) exp((secθ − 1) · 1020/λρ) [m−2],
λρ = (450 ± 44) (7)
+ (32 ± 15) log(ρs,600(0◦)) [g/cm2],
where ρs,600(θ) is the charged-particle density mea-sured by ground scintillation detectors at the distanceofR = 600 m from the shower axis. The total numberof showers selected in this way is 105 012.
We have used the traditional method of a harmonicanalysis in terms of the equatorial coordinates [6] andexamined the behavior of the first harmonic. The partof the sky viewed by the Yakutsk array was brokendown into 24 sectors (with a step of ∆α = 15◦ withrespect to right ascension). The harmonic-analysismethod consists in choosing the best values for theamplitude A1 and the phase ϕ1 of the function
f(α) = f0(1 + А1 cos(α− ϕ1)) (8)
HYSICS OF ATOMIC NUCLEI Vol. 67 No. 5 2004
COULD PRIMARY PARTICLES OF ULTRAHIGH ENERGY BE NEUTRAL? 965
15 16 17 18 19log
E
0
[eV]
0
0.4
0.8
W
(
b
)
p
Fe
–2
0
2
⟨
ln
A
⟩
(
a
)4
Fig. 2. (a) Average atomic weight for a mixed composition of primary particles as a function of their energy: (open circles)〈lnA〉 values obtained from the data in Fig. 1a and from relation (1), (closed boxes) data from [3], and (closed triangles) datafrom [4]; (b) estimates obtained for the fractions of protons (p) and iron nuclei (Fe) for a two-component composition of primarycosmic radiation by using the values of 〈lnA〉 (open circles in Fig. 2a) and relation (4).
by minimizing the quantity
χ2 =n∑
i=1
(fi −Ni)2/fi, (9)
whereNi is the number of showers in the ith sphericalsector ∆αi and f0 =
∑ni=1Ni/n.
The anisotropy was studied in the intervals h =∆ logE0 = 0.2 (they are referred to here as bins) byconsecutively shifting them along the energy scaleby 0.1h. This was done in order to perform a more
PHYSICS OF ATOMIC NUCLEI Vol. 67 No. 5 200
detailed analysis of the behavior of the phase ϕ1,since there are some indications in [21, 29–31] that,at specific values of E0, this phase may undergofast changes. It is the opinion of the present au-thor (see [21]) that these changes are not accidental,reflecting the actual scenario of the propagation ofprimary cosmic radiation in space.
The amplitude A1 of the first harmonic is a mea-sure of the global anisotropy of primary cosmic ra-diation. If it exceeds sizably (at a level above three
4
966 GLUSHKOV
15 16 17 18 19 2024
25
log(
E
0
) [eV]
log(
JE
3
) [m
–2
s
–1
sr
–1
eV
–2
]
Fig. 3.Differential energy spectrum of cosmic rays: (opencircles) experimental data from the Yakutsk array forstudying extensive air showers [26], (closed triangles) da-ta of the HiRes/MIA experiment [4], and (direct crosses)Akeno data [27, 28]. The arrows indicate statistically sig-nificant peaks (those at a level of three standard deviationsand above that).
standard deviations) the amplitude of the adequateisotropic flux, it is assumed that the phase ϕ1 reflectsthe actual anisotropy.Wewill first examine the behav-ior of the phase of the first harmonic, irrespective of itsamplitude, postponing the analysis ofA1 as a functionof E0 to further stages of our investigation.
In Fig. 4b, the open circles show the dependenceof ϕ1 on the mean energy in a bin. It can be seenthat, at some specific values of the energy, the phaseof the first harmonic has stable and close values,which, at regular intervals, undergo fast variationsabout the dashed line, which was borrowed from thereview article quoted in [21] and which characterizesthe behavior of ϕ1 according to world-averaged data.
The crosses in Fig. 4b represent the phase ϕ1
as a function of energy according to the results ob-tained at the AGASA array [10] from an analysis of114 000 showers having zenith angles in the regionθ ≤ 60◦. Before proceeding to compare the resultsthat come from the two arrays in question, we notethat they scan different parts of the sky. This canclearly be seen from Fig. 5, where the unshaded re-gion around the North Pole of the Earth correspondsto the sky zone viewed by the Yakutsk array (in termsof the galactic coordinates) for cos θ ≥ 0.6, while theshaded region is the complementary part of the sky,that which is viewed by the AGASA array for cos θ ≥0.5. The circles in Fig. 5 show the magnetic fields inthe Milky Way Galaxy [32], the open and the closedones corresponding to the field orientations towardand away from an observer, respectively; the diame-ters of the circles are proportional to the field strength.
P
The chart is plotted in such a way that equal areas inthe figure correspond to sky parts of identical area.
The AGASA data in Fig. 4b also indicate thatthere is some regularity in the behavior of the phaseϕ1 (including its variations), although the authorsof [10] did not pay any special attention to this. Theyonly indicated that, for 8 × 10¹⁷ < E0 < 2 × 10¹⁸ eV,the amplitude A1 ≈ 0.04 significantly exceeds the re-spective random value for the isotropic flux. The phaseϕ1 ≈ 295◦ of this amplitude (arrow 1 in Fig. 5) cor-responds to the direction toward the outlet of theOrion arm at a galactic longitude of lG ≈ 50◦. In [10],however, this phase was associated with the Galaxycenter, from which an excess flux of primary cosmicradiation originates, according to data reported there.Unfortunately, the Yakutsk array does not “see” theGalaxy center.
At first glance, the data from the Yakutsk ar-ray are poorly consistent with the AGASA da-ta. However, this statement is true only partly.In the region E0 ≥ 8 × 10¹⁸ eV, the two arraysshow approximately identical E0 dependences ofthe phase ϕ1. The discrepancy at lower energiesis likely to be due to the fact that, in Fig. 4b,each point of the AGASA data corresponds to theanisotropy for the total flux of primary cosmic ra-diation for an energy value exceeding the valuebeing considered. Under such conditions, the relevantpeaks and dips can be strongly smoothed. Upontaking into account this circumstance, the distinctionbetween the estimates of energy at the two arrays bya factor of about 1.32, and their different geographicalpositions (AGASA lies 27◦ to the south and surveysa much greater part of the sky), it becomes clear thatthere is some correlation between the data.
For the peaks and dips in Fig. 4b, we will nowperform a more detailed analysis, paying special at-tention to the possibility of their accidental formation.We will consider the hypothesis of an isotropic dis-tribution of showers in 24 angular spherical sectors.We will make use of the values that the functionalin (9) takes in accordance with the distribution of χ2
for (n− 3) degrees of freedom. For χ2 > χ21−p, where
χ21−p is that tabular value of χ2 which corresponds to
a specific confidence level p, this hypothesis can berejected with the confidence probability β = 1 − p.
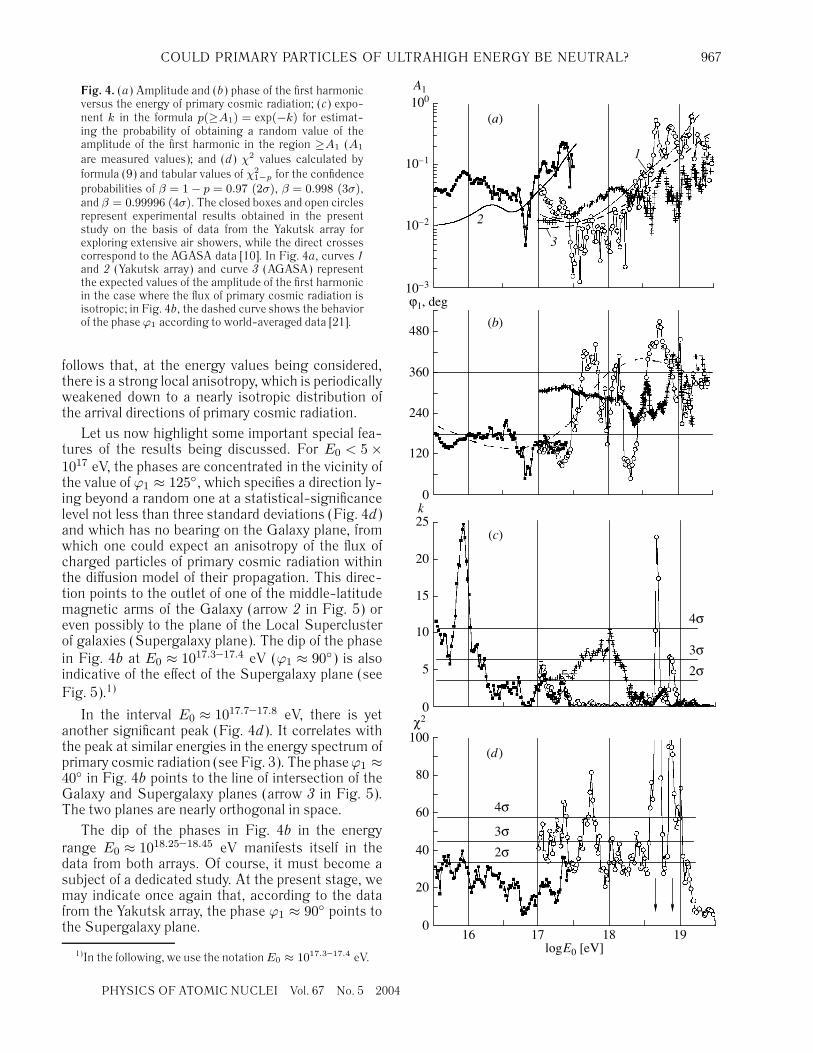
Figure 4d shows χ2 values (for the phases ϕ1
given in Fig. 4b) versus the mean energy in a bin.A comparison of the calculated values of χ2 with thetabular values χ2
1−p makes it possible to reject thehypothesis that the peaks and dips in Fig. 4b are ofa random origin. Some of them have a significancelevel not lower than four standard deviations (with theconfidence probability being β ≥ 0.99996), whence it
HYSICS OF ATOMIC NUCLEI Vol. 67 No. 5 2004
COULD PRIMARY PARTICLES OF ULTRAHIGH ENERGY BE NEUTRAL? 967
Fig. 4. (a) Amplitude and (b) phase of the first harmonicversus the energy of primary cosmic radiation; (c) expo-nent k in the formula p(≥A1) = ехр(−k) for estimat-ing the probability of obtaining a random value of theamplitude of the first harmonic in the region ≥A1 (A1
are measured values); and (d) χ2 values calculated byformula (9) and tabular values of χ2
1−p for the confidenceprobabilities of β = 1 − p = 0.97 (2σ), β = 0.998 (3σ),and β = 0.99996 (4σ). The closed boxes and open circlesrepresent experimental results obtained in the presentstudy on the basis of data from the Yakutsk array forexploring extensive air showers, while the direct crossescorrespond to the AGASA data [10]. In Fig. 4a, curves 1and 2 (Yakutsk array) and curve 3 (AGASA) representthe expected values of the amplitude of the first harmonicin the case where the flux of primary cosmic radiation isisotropic; in Fig. 4b, the dashed curve shows the behaviorof the phase ϕ1 according to world-averaged data [21].
follows that, at the energy values being considered,there is a strong local anisotropy, which is periodicallyweakened down to a nearly isotropic distribution ofthe arrival directions of primary cosmic radiation.
Let us now highlight some important special fea-tures of the results being discussed. For E0 < 5 ×10¹⁷ eV, the phases are concentrated in the vicinity ofthe value of ϕ1 ≈ 125◦, which specifies a direction ly-ing beyond a random one at a statistical-significancelevel not less than three standard deviations (Fig. 4d)and which has no bearing on the Galaxy plane, fromwhich one could expect an anisotropy of the flux ofcharged particles of primary cosmic radiation withinthe diffusion model of their propagation. This direc-tion points to the outlet of one of the middle-latitudemagnetic arms of the Galaxy (arrow 2 in Fig. 5) oreven possibly to the plane of the Local Superclusterof galaxies (Supergalaxy plane). The dip of the phasein Fig. 4b at E0 ≈ 1017.3–17.4 eV (ϕ1 ≈ 90◦) is alsoindicative of the effect of the Supergalaxy plane (seeFig. 5).1)
In the interval E0 ≈ 1017.7–17.8 eV, there is yetanother significant peak (Fig. 4d). It correlates withthe peak at similar energies in the energy spectrum ofprimary cosmic radiation (see Fig. 3). The phaseϕ1 ≈40◦ in Fig. 4b points to the line of intersection of theGalaxy and Supergalaxy planes (arrow 3 in Fig. 5).The two planes are nearly orthogonal in space.
The dip of the phases in Fig. 4b in the energyrange E0 ≈ 1018.25–18.45 eV manifests itself in thedata from both arrays. Of course, it must become asubject of a dedicated study. At the present stage, wemay indicate once again that, according to the datafrom the Yakutsk array, the phase ϕ1 ≈ 90◦ points tothe Supergalaxy plane.
1)In the following, we use the notation E0 ≈ 1017.3–17.4 eV.
PHYSICS OF ATOMIC NUCLEI Vol. 67 No. 5 200
20
0
χ
2
log
E
0
[eV]16 17 18 19
40
60
80
100(
d
)
4
σ
3
σ
2
σ
5
0
k
10
15
20
25(
c
)
4
σ
3
σ
2
σ
120
0
ϕ
1
, deg
240
360
480(
b
)
10
–2
10
–3
A
1
(
a
)
10
–1
10
0
1
3
2
4

968 GLUSHKOV
90
–90
60 60
30 30
3600
–30 –30
–60–60
α
= 270
δ
= 60
α
= 0
α
= 90
δ
= 30
δ
= 0
α
= 180
δ
= –60
δ
= –30
SG
C
SG
AC
SG
1
2
3
Fig. 5. Sky zones (in galactic coordinates) viewed by (unshaded region) the Yakutsk array (δ ≈ 15◦–90◦) and (shaded region)AGASA (δ ≈ −25◦–90◦). The closed and open circles indicate the dispositions of the magnetic arms of the Galaxy withdirections, respectively, away from an observer and toward him [32], the dimensions of the circles being proportional tothe field strength. The dashed arrows 1, 2, and 3 show the phases of the first harmonic according to the AGASA data forE0 ≈ 1017.9–18.3 eV showers [10] and according to data from the Yakutsk array (ϕ1 ≈ 125◦ for E0 < 1017.5 eV and ϕ1 ≈ 40◦
for E0 ≈ 1017.7–17.8 eV). Here, α and δ are, respectively, the right ascension and inclination (equatorial coordinates), whileSG, CSG, and ACSG, are, respectively, the disk, the center, and the anticenter of the Supergaxy.
7426
5614
1812
(
a
)
(
b
)
(
c
)
0
100
200
100
200
300
200
300
400
120 240 360
α
, deg
Number of events
Fig. 6. Right-ascension distributions of extensive airshowers of energy in the range E0 = 1017.7–17.8 eV (а)for the entire data set, (b) for the data set not includingnodes, and (c) at nodes with angular dimensions d ≤ 3◦
for n ≥ 3 showers. The smooth curves correspond to thefirst harmonic in (8), while the numerals in the respectivepanels indicate the numbers of showers.
P
Finally, the energy range E0 ≈ 1018.6–18.9 eV,where the flux of primary cosmic radiation changesglobal direction, possibly two times (arrows inFig. 4d)—from ϕ1 ≈ 90◦ in the intervals E0 ≈1018.6–18.7 and 1018.8–18.9 eV to ϕ1 ≈ 150◦ at E0 ≈1018.7–18.8 eV—also deserves attention. These peaksare especially significant in Fig. 4d. They correlatewith the peak in the differential energy spectrum inFig. 3. It should be noted that, for E0 ≥ 5 × 10¹⁸ eV,the arrival directions of primary cosmic radiationcorrelate with the Supergalaxy plane, exceeding theisotropic flux by four to five standard deviations [15–17]. In [14, 19], it was indicated that there is arelationship between the arrival directions of primarycosmic radiation of such energies and the large-scalestructure of the Universe.
Let us now consider the amplitude of the firstharmonic, A1. It is contrasted against the amplitude∆A1 for the isotropic flux where the number of events,
N =n∑
i=1
Ni,
is equal to the actual number of showers. The ampli-tude ∆A1 can be found from a Monte Carlo simula-
HYSICS OF ATOMIC NUCLEI Vol. 67 No. 5 2004
COULD PRIMARY PARTICLES OF ULTRAHIGH ENERGY BE NEUTRAL? 969
tion or analytically [6]:
∆A1∼= 1.25
√2/N. (10)
From relation (10), it follows that, even in the absenceof an actual anisotropy, an experiment will inevitablyexhibit nonzero amplitudes whose values would in-crease with decreasing number N of showers. Thisoccurs as the energy E0 of the showers subjectedto the analysis becomes higher; that is, a randomdistribution can mimic the expected (on the basisof physical considerations) energy dependence of theamplitude of the first harmonic.
The question of the distribution of the parameterscharacterizing the observed vector of the anisotropythat arises because the data set at small N is insuffi-ciently wide was considered by Linsley [6], who intro-duced the coefficient k = N(A1/2)2 and the formula
p(≥A1) = ехр(−k) (11)
for estimating the probability that the observed valueA1 can be obtained in the case of an isotropic flux.
For the amplitude values corresponding to thephases ϕ1 in Fig. 4b, Fig. 4a shows the results ofmeasurements (circles) and the results of the calcula-tion (curve 1) on the basis of relation (10). The mea-sured and calculated data of the AGASA group [10]are represented by the crosses and by curve 3, re-spectively. The values of the coefficient k are given inFig. 4c.
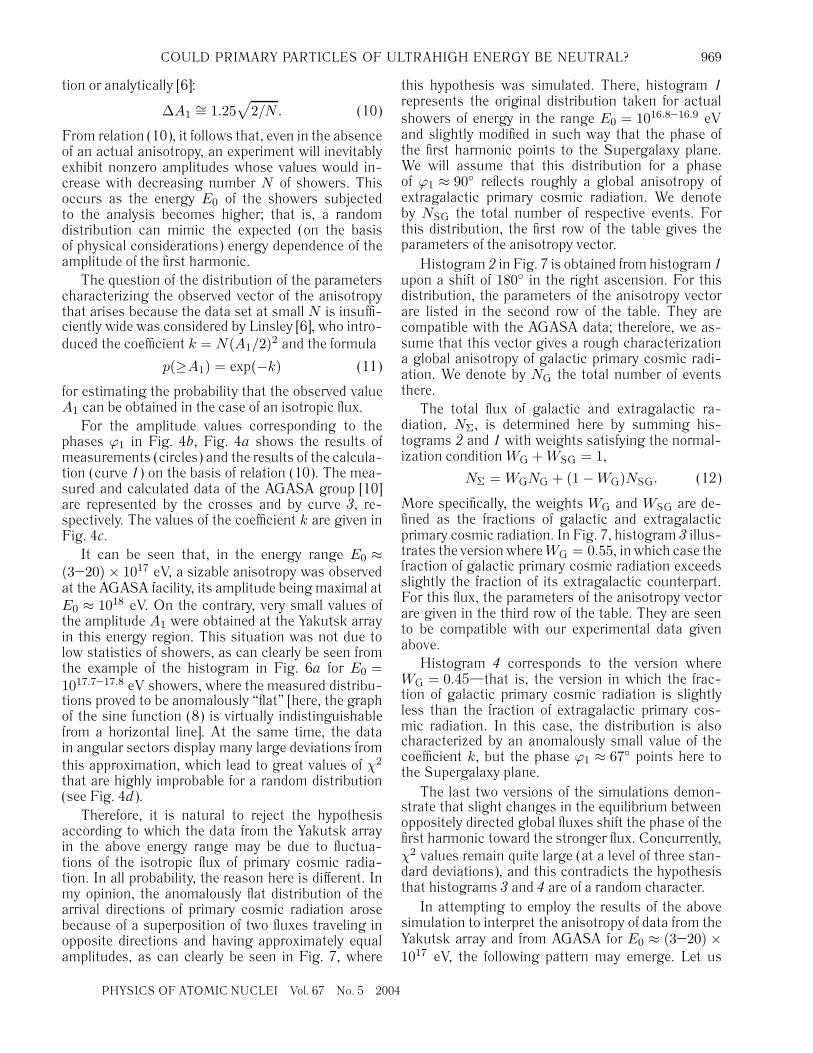
It can be seen that, in the energy range E0 ≈(3–20) × 1017 eV, a sizable anisotropy was observedat the AGASA facility, its amplitude being maximal atE0 ≈ 1018 eV. On the contrary, very small values ofthe amplitude A1 were obtained at the Yakutsk arrayin this energy region. This situation was not due tolow statistics of showers, as can clearly be seen fromthe example of the histogram in Fig. 6a for E0 =1017.7–17.8 eV showers, where the measured distribu-tions proved to be anomalously “flat” [here, the graphof the sine function (8) is virtually indistinguishablefrom a horizontal line]. At the same time, the datain angular sectors display many large deviations fromthis approximation, which lead to great values of χ2
that are highly improbable for a random distribution(see Fig. 4d).
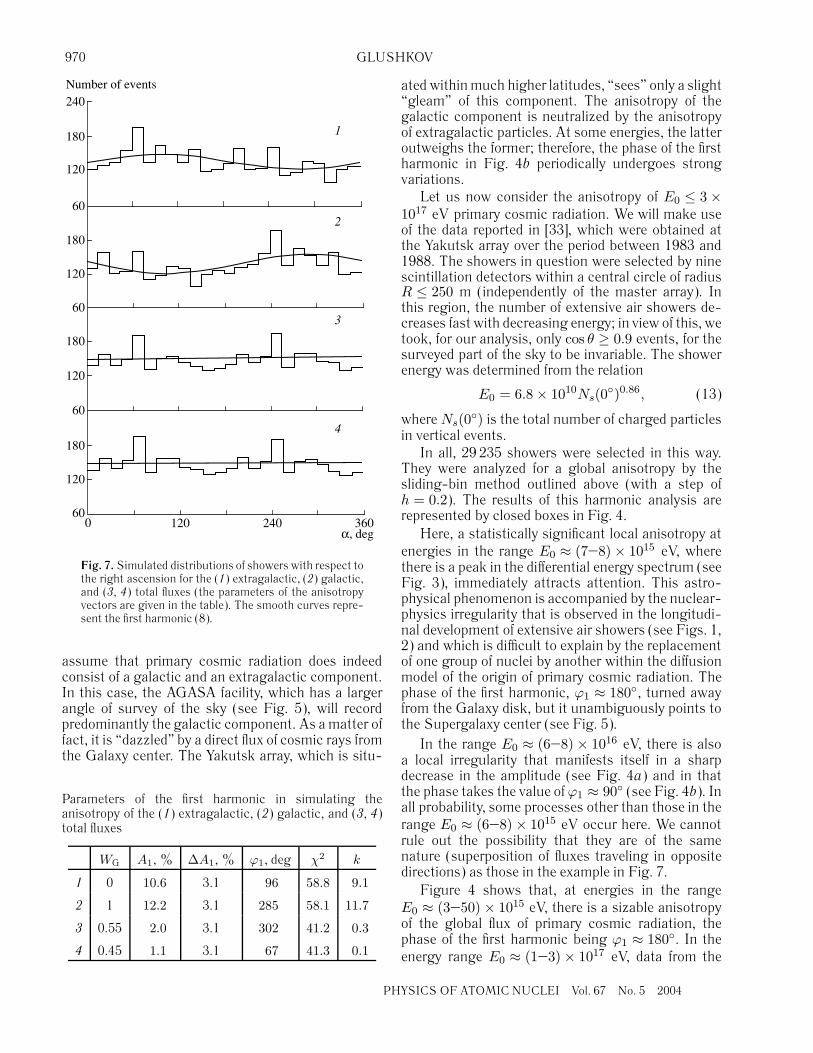
Therefore, it is natural to reject the hypothesisaccording to which the data from the Yakutsk arrayin the above energy range may be due to fluctua-tions of the isotropic flux of primary cosmic radia-tion. In all probability, the reason here is different. Inmy opinion, the anomalously flat distribution of thearrival directions of primary cosmic radiation arosebecause of a superposition of two fluxes traveling inopposite directions and having approximately equalamplitudes, as can clearly be seen in Fig. 7, where
PHYSICS OF ATOMIC NUCLEI Vol. 67 No. 5 200
this hypothesis was simulated. There, histogram 1represents the original distribution taken for actualshowers of energy in the range E0 = 1016.8–16.9 eVand slightly modified in such way that the phase ofthe first harmonic points to the Supergalaxy plane.We will assume that this distribution for a phaseof ϕ1 ≈ 90◦ reflects roughly a global anisotropy ofextragalactic primary cosmic radiation. We denoteby NSG the total number of respective events. Forthis distribution, the first row of the table gives theparameters of the anisotropy vector.
Histogram 2 in Fig. 7 is obtained from histogram 1upon a shift of 180◦ in the right ascension. For thisdistribution, the parameters of the anisotropy vectorare listed in the second row of the table. They arecompatible with the AGASA data; therefore, we as-sume that this vector gives a rough characterizationa global anisotropy of galactic primary cosmic radi-ation. We denote by NG the total number of eventsthere.
The total flux of galactic and extragalactic ra-diation, NΣ, is determined here by summing his-tograms 2 and 1 with weights satisfying the normal-ization conditionWG +WSG = 1,
NΣ =WGNG + (1 −WG)NSG. (12)
More specifically, the weights WG and WSG are de-fined as the fractions of galactic and extragalacticprimary cosmic radiation. In Fig. 7, histogram 3 illus-trates the version whereWG = 0.55, in which case thefraction of galactic primary cosmic radiation exceedsslightly the fraction of its extragalactic counterpart.For this flux, the parameters of the anisotropy vectorare given in the third row of the table. They are seento be compatible with our experimental data givenabove.
Histogram 4 corresponds to the version whereWG = 0.45—that is, the version in which the frac-tion of galactic primary cosmic radiation is slightlyless than the fraction of extragalactic primary cos-mic radiation. In this case, the distribution is alsocharacterized by an anomalously small value of thecoefficient k, but the phase ϕ1 ≈ 67◦ points here tothe Supergalaxy plane.
The last two versions of the simulations demon-strate that slight changes in the equilibrium betweenoppositely directed global fluxes shift the phase of thefirst harmonic toward the stronger flux. Concurrently,χ2 values remain quite large (at a level of three stan-dard deviations), and this contradicts the hypothesisthat histograms 3 and 4 are of a random character.
In attempting to employ the results of the abovesimulation to interpret the anisotropy of data from theYakutsk array and from AGASA for E0 ≈ (3–20) ×1017 eV, the following pattern may emerge. Let us
4
970 GLUSHKOV
1
2
3
4
0 120 36024060
60
60
180
120
120
180
120
180
60
120
180
240
α
, deg
Number of events
Fig. 7. Simulated distributions of showers with respect tothe right ascension for the (1) extragalactic, (2) galactic,and (3, 4) total fluxes (the parameters of the anisotropyvectors are given in the table). The smooth curves repre-sent the first harmonic (8).
assume that primary cosmic radiation does indeedconsist of a galactic and an extragalactic component.In this case, the AGASA facility, which has a largerangle of survey of the sky (see Fig. 5), will recordpredominantly the galactic component. As amatter offact, it is “dazzled” by a direct flux of cosmic rays fromthe Galaxy center. The Yakutsk array, which is situ-
Parameters of the first harmonic in simulating theanisotropy of the (1) extragalactic, (2) galactic, and (3, 4)total fluxes
WG A1, % ∆A1, % ϕ1, deg χ2 k
1 0 10.6 3.1 96 58.8 9.1
2 1 12.2 3.1 285 58.1 11.7
3 0.55 2.0 3.1 302 41.2 0.3
4 0.45 1.1 3.1 67 41.3 0.1
P
ated withinmuch higher latitudes, “sees” only a slight“gleam” of this component. The anisotropy of thegalactic component is neutralized by the anisotropyof extragalactic particles. At some energies, the latteroutweighs the former; therefore, the phase of the firstharmonic in Fig. 4b periodically undergoes strongvariations.
Let us now consider the anisotropy of E0 ≤ 3 ×10¹⁷ eV primary cosmic radiation. We will make useof the data reported in [33], which were obtained atthe Yakutsk array over the period between 1983 and1988. The showers in question were selected by ninescintillation detectors within a central circle of radiusR ≤ 250 m (independently of the master array). Inthis region, the number of extensive air showers de-creases fast with decreasing energy; in view of this, wetook, for our analysis, only cos θ ≥ 0.9 events, for thesurveyed part of the sky to be invariable. The showerenergy was determined from the relation
E0 = 6.8 × 10¹⁰Ns(0◦)0.86, (13)
whereNs(0◦) is the total number of charged particlesin vertical events.
In all, 29 235 showers were selected in this way.They were analyzed for a global anisotropy by thesliding-bin method outlined above (with a step ofh = 0.2). The results of this harmonic analysis arerepresented by closed boxes in Fig. 4.
Here, a statistically significant local anisotropy atenergies in the range E0 ≈ (7–8) × 1015 eV, wherethere is a peak in the differential energy spectrum (seeFig. 3), immediately attracts attention. This astro-physical phenomenon is accompanied by the nuclear-physics irregularity that is observed in the longitudi-nal development of extensive air showers (see Figs. 1,2) and which is difficult to explain by the replacementof one group of nuclei by another within the diffusionmodel of the origin of primary cosmic radiation. Thephase of the first harmonic, ϕ1 ≈ 180◦, turned awayfrom the Galaxy disk, but it unambiguously points tothe Supergalaxy center (see Fig. 5).
In the range E0 ≈ (6–8) × 1016 eV, there is alsoa local irregularity that manifests itself in a sharpdecrease in the amplitude (see Fig. 4a) and in thatthe phase takes the value of ϕ1 ≈ 90◦ (see Fig. 4b). Inall probability, some processes other than those in therange E0 ≈ (6–8) × 1015 eV occur here. We cannotrule out the possibility that they are of the samenature (superposition of fluxes traveling in oppositedirections) as those in the example in Fig. 7.
Figure 4 shows that, at energies in the rangeE0 ≈ (3–50) × 1015 eV, there is a sizable anisotropyof the global flux of primary cosmic radiation, thephase of the first harmonic being ϕ1 ≈ 180◦. In theenergy range E0 ≈ (1–3) × 1017 eV, data from the
HYSICS OF ATOMIC NUCLEI Vol. 67 No. 5 2004
COULD PRIMARY PARTICLES OF ULTRAHIGH ENERGY BE NEUTRAL? 971
two independent experiments in question agree witheach other even in some individual details. The dis-crepancies between them are explained by differentnumbers of showers there.
4.2. Cluster Analysis
From the aforesaid, it follows that, in some in-tervals of the energy E0, one can observe phases ofthe first harmonic that are likely to be indicative ofan extragalactic origin of part of the primary cosmicradiation. Previously, it was reported in [12–20] thatan analysis of the arrival directions for cosmic raysof energy in the region E0 ≥ 1017 eV makes it pos-sible to single out a considerable number of groupsof showers in narrow solid angles. Their distributionover the celestial sphere has an ordered structure thatcannot be explained by random statistical processes.We will now indicate some important special featuresof the small-scale anisotropy of primary cosmic radia-tion that seem to have some bearing on the aforemen-tioned irregularities of the development of extensiveair showers.
4.2.1. Events in the Energy Region E0 ≥ 3× 10¹⁸ eV.
Let us first examine extensive air showers of en-ergy in the region E0 ≥ 3 × 10¹⁸ eV that are charac-terized by zenith angles of θ ≤ 45◦ and which wererecorded at the Yakutsk array over the period be-tween 1974 and 2000. The present analysis deals withshowers whose arrival directions were determined onthe basis of data from not less than five stations andwhose axes were within the array central circle ofradius R ≤ 1700 m. Here, we will consider the datasample used previously in [17].
The analysis has been performed for two data sets,that for E0 = (3–5) × 1018 eV (2033 showers) andthat for E0 > 5 × 10¹⁸ eV (1267 showers). For eachshower, all “neighbors” were found within an angu-lar spacing of d ≤ 3◦ around its arrival direction. Ifthere were n ≥ 3 showers within this circle, then theaverage of their coordinates was calculated and wasfurther used as the coordinates of new points (theyare referred to as nodes). Within this procedure, anyisolated group of showers (that is, a group that isoffset by a distance in excess of d from showers thatdo not belong to this group) forms one node.
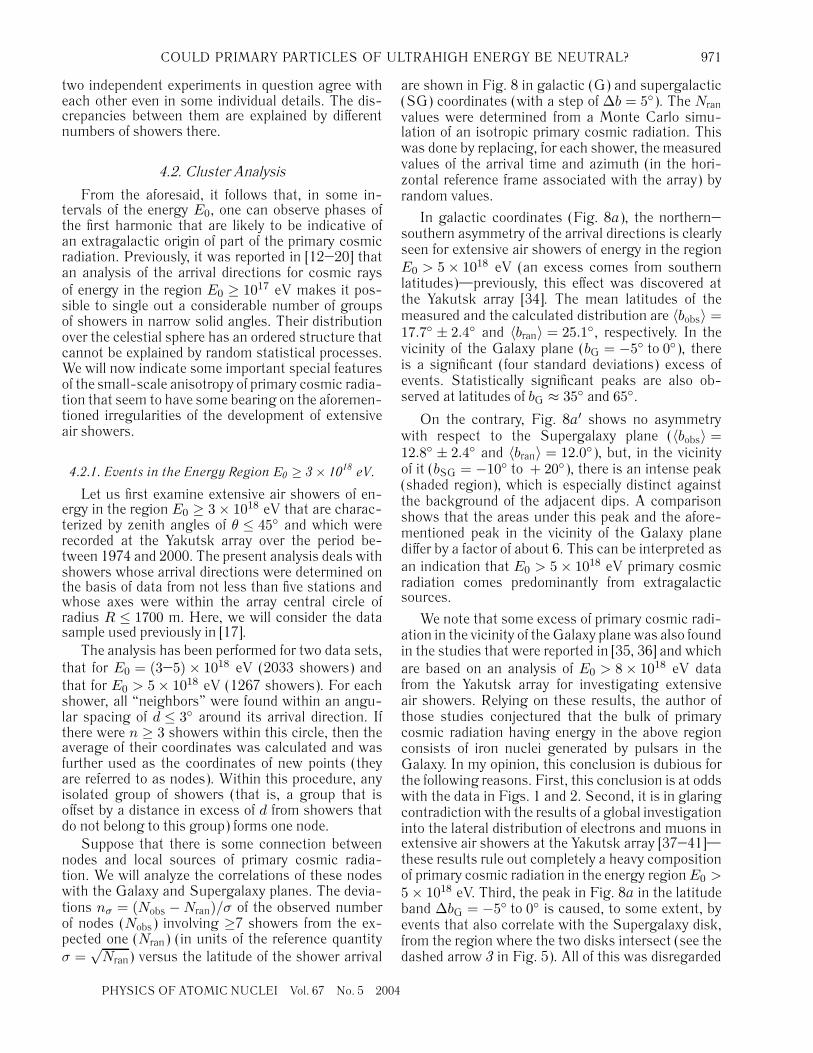
Suppose that there is some connection betweennodes and local sources of primary cosmic radia-tion. We will analyze the correlations of these nodeswith the Galaxy and Supergalaxy planes. The devia-tions nσ = (Nobs −Nran)/σ of the observed numberof nodes (Nobs) involving ≥7 showers from the ex-pected one (Nran) (in units of the reference quantityσ =
√Nran) versus the latitude of the shower arrival
PHYSICS OF ATOMIC NUCLEI Vol. 67 No. 5 200
are shown in Fig. 8 in galactic (G) and supergalactic(SG) coordinates (with a step of ∆b = 5◦). The Nranvalues were determined from a Monte Carlo simu-lation of an isotropic primary cosmic radiation. Thiswas done by replacing, for each shower, the measuredvalues of the arrival time and azimuth (in the hori-zontal reference frame associated with the array) byrandom values.
In galactic coordinates (Fig. 8a), the northern–southern asymmetry of the arrival directions is clearlyseen for extensive air showers of energy in the regionE0 > 5 × 10¹⁸ eV (an excess comes from southernlatitudes)—previously, this effect was discovered atthe Yakutsk array [34]. The mean latitudes of themeasured and the calculated distribution are 〈bobs〉 =17.7◦ ± 2.4◦ and 〈bran〉 = 25.1◦, respectively. In thevicinity of the Galaxy plane (bG = −5◦ to 0◦), thereis a significant (four standard deviations) excess ofevents. Statistically significant peaks are also ob-served at latitudes of bG ≈ 35◦ and 65◦.
On the contrary, Fig. 8a′ shows no asymmetrywith respect to the Supergalaxy plane (〈bobs〉 =12.8◦ ± 2.4◦ and 〈bran〉 = 12.0◦), but, in the vicinityof it (bSG = −10◦ to + 20◦), there is an intense peak(shaded region), which is especially distinct againstthe background of the adjacent dips. A comparisonshows that the areas under this peak and the afore-mentioned peak in the vicinity of the Galaxy planediffer by a factor of about 6. This can be interpreted asan indication that E0 > 5 × 10¹⁸ eV primary cosmicradiation comes predominantly from extragalacticsources.
We note that some excess of primary cosmic radi-ation in the vicinity of theGalaxy plane was also foundin the studies that were reported in [35, 36] and whichare based on an analysis of E0 > 8 × 10¹⁸ eV datafrom the Yakutsk array for investigating extensiveair showers. Relying on these results, the author ofthose studies conjectured that the bulk of primarycosmic radiation having energy in the above regionconsists of iron nuclei generated by pulsars in theGalaxy. In my opinion, this conclusion is dubious forthe following reasons. First, this conclusion is at oddswith the data in Figs. 1 and 2. Second, it is in glaringcontradiction with the results of a global investigationinto the lateral distribution of electrons and muons inextensive air showers at the Yakutsk array [37–41]—these results rule out completely a heavy compositionof primary cosmic radiation in the energy regionE0 >5 × 10¹⁸ eV. Third, the peak in Fig. 8a in the latitudeband ∆bG = −5◦ to 0◦ is caused, to some extent, byevents that also correlate with the Supergalaxy disk,from the region where the two disks intersect (see thedashed arrow 3 in Fig. 5). All of this was disregarded
4
972 GLUSHKOV
–60 –6060 6000
–2
0
2
4
–2
0
2
4G SG
n
σ
(
a
) (
a
′
)
(
b
)(
b
′
)
b
G
, deg
b
SG
, deg
G SG
Fig. 8. Distribution of the deviations nσ = (Nobs − Nran)/√
Nran of the number of nodes (Nobs) involving n ≥ 7 showers fromthe expected one (Nran) in the (a, a′) E0 > 5 × 10¹⁸ eV and (b, b′) E0 = (3–5) × 1018 eV data sets versus the latitude of theshower arrival in galactic (G) and supergalactic (SG) coordinates (with a step of ∆b = 5◦). The shaded regions correspond tosignificant values near the Galaxy and Supergalaxy disks.
by the author of [35, 36], so that his conclusions seemerroneous.
In the energy region E0 = (3–5) × 1018 eV, therole of the Galaxy in the generation of primary cosmicradiation becomes more pronounced, which is sug-gested by an increased excess of events in the regionof its disk (bG = −5◦ to + 5◦) in Fig. 8b in relationto what we have in Fig. 8a. Concurrently, the afore-mentioned northern–southern asymmetry disappears(〈bobs〉 = 23.2◦ ± 1.5◦ versus 〈bran〉 = 24.2◦). The roleof the Supergalaxy seems to become much less im-portant in this energy region, but we cannot rule itout completely at this stage; in Fig. 8b′, a statisti-cally significant, albeit weaker, excess of events sur-vives in the vicinity of the Supergalaxy plane (bSG =−10◦ to − 5◦).
4.2.2. Events in the Energy Range E0 ≈ 1017.7–17.8 eV.
Let us consider showers that are characterized byenergies in the range E0 ≈ 1017.7–17.8 eV and zenithangles satisfying the condition cos θ ≥ 0.6 and whichwere recorded at the Yakutsk array over the periodbetween 1974 and 2001. Our analysis will be per-formed for extensive air showers whose arrival direc-tions were found on the basis of data from four ormorestations and whose axes are within the array central
PH
circle of radiusR ≤ 1000 m. In all, 7426 showers wereselected in this way (see Fig. 6). In Fig. 4d, they forma statistically significant peak. We will now examinethe small-scale anisotropy of these events.
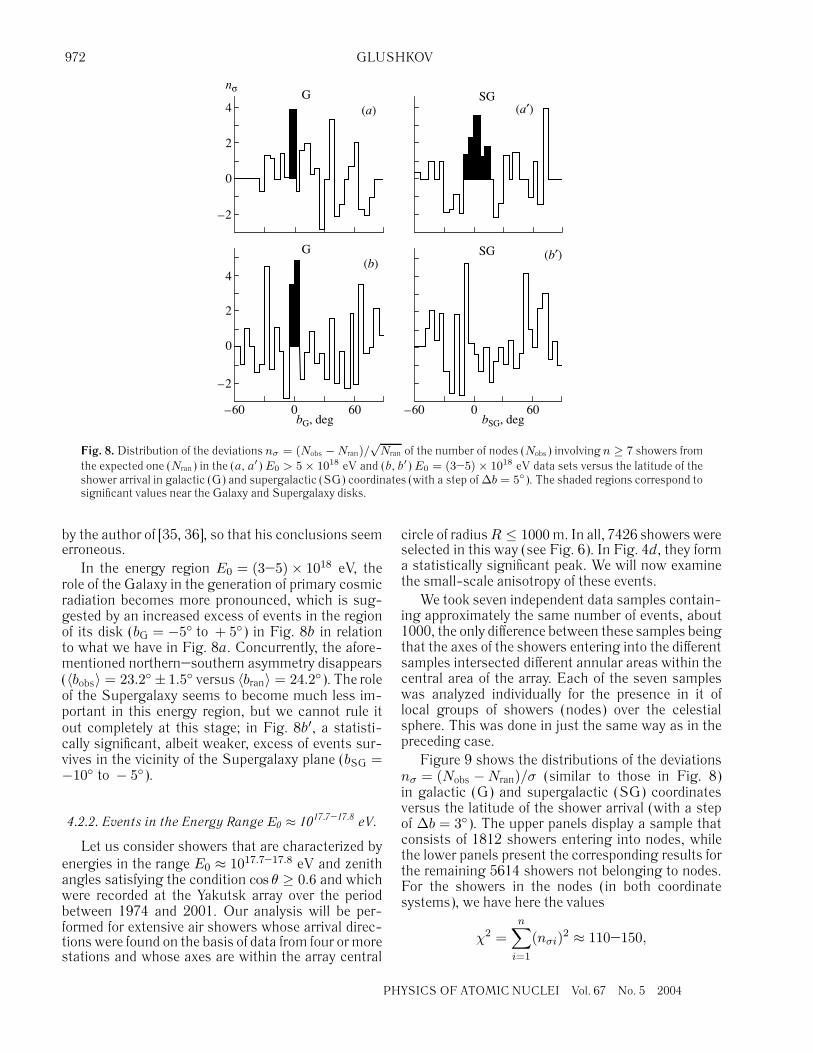
We took seven independent data samples contain-ing approximately the same number of events, about1000, the only difference between these samples beingthat the axes of the showers entering into the differentsamples intersected different annular areas within thecentral area of the array. Each of the seven sampleswas analyzed individually for the presence in it oflocal groups of showers (nodes) over the celestialsphere. This was done in just the same way as in thepreceding case.
Figure 9 shows the distributions of the deviationsnσ = (Nobs −Nran)/σ (similar to those in Fig. 8)in galactic (G) and supergalactic (SG) coordinatesversus the latitude of the shower arrival (with a stepof ∆b = 3◦). The upper panels display a sample thatconsists of 1812 showers entering into nodes, whilethe lower panels present the corresponding results forthe remaining 5614 showers not belonging to nodes.For the showers in the nodes (in both coordinatesystems), we have here the values
χ2 =n∑
i=1
(nσi)2 ≈ 110–150,
YSICS OF ATOMIC NUCLEI Vol. 67 No. 5 2004
COULD PRIMARY PARTICLES OF ULTRAHIGH ENERGY BE NEUTRAL? 973
2.7
σ
5.5
σ
SGG (
a
) (
a
′
)
(
b
′
)
(
b
)G
–60 –600 060 60
b
G
, deg
b
SG
, deg
n
σ
–2
0
2
–2
0
2
4
SG
Fig. 9. Distributions of the deviations nσ = (Nobs − Nran)/√
Nran of the observed number of E0 = 1017.7–17.8 eV showers(Nobs) from the expected one (Nran) versus the latitude of the shower arrival in galactic (G) and supergalactic (SG) coordinates(with a step of ∆b = 3◦): (a, a′) results for 1812 showers entering into nodes (see Fig. 6c) and (b, b′) results for the remaining5614 showers not belonging to nodes (see Fig. 6b). The shaded regions correspond to significant values near the Galaxy andSupergalaxy planes.
which are enormous for n = 50 degrees of freedom.The probability of such random outputs is less than10−5. In the vicinity of the Supergalaxy plane, we cansee a statistically significant (about five and a halfstandard deviations) peak, which, in many respects,is similar to the peak in Fig. 8a′. On the contrary, theGalaxy plane manifests itself in Fig. 9a only as a dip(shaded area there). We note that a similar but moresignificant (9.2σ, where σ is a standard deviation)peak is also observed in the Galaxy disk for E0 ≈1017.1–7.6 eV [18].
These results can be interpreted as an indica-tion of an extragalactic origin of the primary-cosmic-radiation fraction contained in the nodes. In all prob-ability, the Galaxy only absorbs this radiation, thoughmore intensely in the disk. Other significant peaksand dips in Figs. 9a and 9a′ are likely to be in-dicative of a complicated and nonuniform structureof the space housing the sources of primary cosmicradiation that form nodes.
As to the showers in Figs. 9b and 9b′, the patternhere changed sharply. The measured and expecteddistributions for random quantities are close to each
PHYSICS OF ATOMIC NUCLEI Vol. 67 No. 5 200
other (χ2 = 47–59). This result unambiguously indi-cates that the primary-cosmic-radiation fraction se-lected in this way possesses a high degree of isotropy.The fraction of these particles in the total flux is5614/7426 ≈ 0.75.
Within the harmonic-analysis method, we willreturn once again to a global anisotropy of E0 =1017.7–17.8 eV primary cosmic radiation. Figure 6ashows the original distribution of all 7426 showers in24 sectors. That part of the showers which did notenter into the nodes (Fig. 6b) form a distribution thatexhibits but a slight distinction between the fluxes indifferent time zones (χ2 ≈ 37.5); as a result, the phaseϕ1 ≈ 211◦ ± 136◦ was found for them with a largeuncertainty. As before, these data are indicative of ahigh degree of isotropy of primary cosmic radiation.But the showers in the nodes in Fig. 6c are in strongcontradiction with the hypothesis of an isotropicdistribution. For example, the scatter of data aroundthe approximating curve constructed with the aid ofEq. (8) leads to χ2 ≈ 154.8 for n = 24 degrees offreedom, the respective probability of a random outputbeing less than 10−5.
4

974 GLUSHKOV
(
a
)
G
–2
0
2
(
b
)G
–60 0 60
b
G
, deg
–2
0
2(
b
′
)SG
–60 0 60
b
SG
, deg
(
a
′
)
SG
4
n
σ
3
σ
4.6
σ
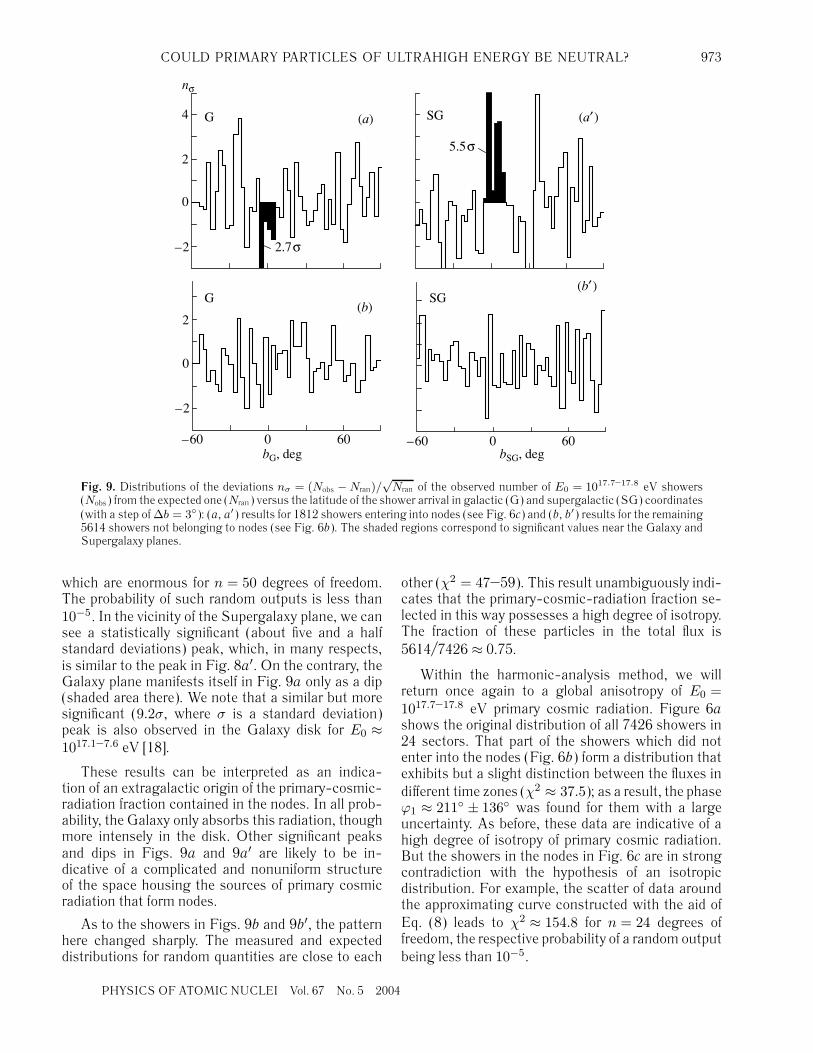
Fig. 10. Distributions of the deviations nσ (similar to those in Fig. 9) in the E0 = 1017.2–17.3 eV set for (a, a′) 1962 showersentering into nodes and (b, b′) the remaining 5261 showers not belonging to nodes.
We would like to highlight some important de-tails of these distributions. The peak in Fig. 6a atα ≈ 180◦–195◦ is indicative of an excess (3.4σ) ra-diation from the Supergalaxy disk in the vicinity ofthe center (CSG in Fig. 5). It fully goes over to thepeak in Fig. 6c, where the excess of events is already(162 − 81)/
√81 = 9σ. As to the peak in Fig. 6a at
α ≈ 270◦–285◦, it goes over to the peak in Fig. 6b,where the excess is (294 − 235)/
√235 = 3.8σ, and
possibly points to the Galaxy center.
4.2.3. Events in the Energy Range E0 ≈ 1017.2–17.3 eV.
Let us consider yet another energy interval, E0 ≈1017.2–17.3 eV; there, the distributions of the standarddeviations nσ (Fig. 10) are similar in many respectsto the distributions in Figs. 8 and 9. Here, use ismade of 7223 showers whose zenith angles satisfythe condition cos θ ≥ 0.6 and whose arrival directionswere determined on the basis of data from not lessthan four stations, their axes lying within the arraycentral circle of radius R ≤ 1000 m. This data samplewas also broken down into seven independent sub-samples featuring approximately the same number ofevents, about 1000, and was analyzed for the presenceof correlations between the nodes and the Galaxy andSupergalaxy disks.
In Figs. 10a and 10a′, the χ2 values for 1962showers entering into the nodes are seen to be
P
enormous in both coordinate frames, χ2 ≈ 120–150.Here, there is, in the Supergalaxy plane, a strongexcess (about 4.6σ) of events, which is especiallypronounced against the background of dips on thetwo sides of it. As before, the Galaxy plane manifestsitself only as a dip of about three standard deviations(shaded region).
For the remaining showers (their number is 5261),which do not enter into the nodes, the distributionsof nσ are shown in Figs. 10b and 10b′. The patternhere is identical to that in Figs. 9b and 9b′. Themeasured distributions are quite close to those thatare expected for random quantities (χ2 = 47–52),this being indicative of a rather high isotropy of theprimary-cosmic-radiation fraction selected in thisway. The fraction of these particles in the total fluxis 5261/7223 ≈ 0.73.
We will now additionally analyze the small-scaleanisotropy of showers entering into the nodes (thosein Figs. 10a, 10a′). We have investigated nodes fortheir intersection of multiplicity m ≥ 2 in any of theseven subsamples (under the condition that their cen-ters are within an angular distance of d ≤ 3◦). If suchnodes were found, the arrival directions of all show-ers entering into such nodes were mutually averagedanew, and the resulting larger node (we refer to itas a cluster) was taken for a further analysis. As amatter of fact, we used here the method of multiplematching of nodes upon superimposing a few similar
HYSICS OF ATOMIC NUCLEI Vol. 67 No. 5 2004

COULD PRIMARY PARTICLES OF ULTRAHIGH ENERGY BE NEUTRAL? 975
90
–90
60 60
30 30
3600
–30 –30
–60–60
α
= 270
α
= 0
α
= 90
δ
= 30
δ
= 0
α
= 180
δ
= –60
δ
= –30
30024018060
Fig. 11. Chart representing the disposition of clusters of 1156 E0 = 1017.2–17.3 eV showers in supergalactic coordinates (alsoshown are equatorial coordinates). The clusters include m ≥ 3 nodes from any of the seven data samples under the conditionthat each of these nodes contains n ≥ 5 showers, their centers lying within the d = 3◦ circle.
charts onto one another. This is an analog of themultiple-matching method, which has successfullybeen used in order to select ultrahigh-energy cosmicrays incident on the Earth by master detectors atarrays for studying extensive air showers.
Figure 11 shows the chart of the dispositionof clusters (for events in the energy range E0 ≈1017.2–17.3 eV) including m ≥ 3 nodes from anyof the seven subsamples under the condition thatthere are n ≥ 5 showers in each of these nodes. Theclusters are displayed in supergalactic coordinates(for the sake of convenience, equatorial coordinatesare also shown there). The longitude is reckoned inthe counterclockwise direction from the line pointingto the anticenter. The equatorial coordinates of theNorth Pole of the Supergalaxy are α = 286.2◦ andδ = 14.1◦.
It can be seen that many clusters form isolatedlocal groups between which there are large voids.In all, clusters contain 1156 showers, the maximumnumber of showers in a cluster being 26. At differentvalues of the primary-cosmic-radiation energy, onecan also observe [16–20] an ordered structure of thedistribution of clusters over the celestial sphere. Byand large, the picture is similar to the cell-like struc-ture of the distribution of galaxies in the Universe(see, for example, [42, 43]).
4.3. On the Structure of the SupergalaxyThe Supergalaxy is one of the elements of the cell
structure of theUniverse. As an individual large-scale
PHYSICS OF ATOMIC NUCLEI Vol. 67 No. 5 200
formation, it was singled out for the first time by deVaucouler [44]. Its disk is a flattened aggregate of fieldgalaxies, small groups, and large clouds [45].
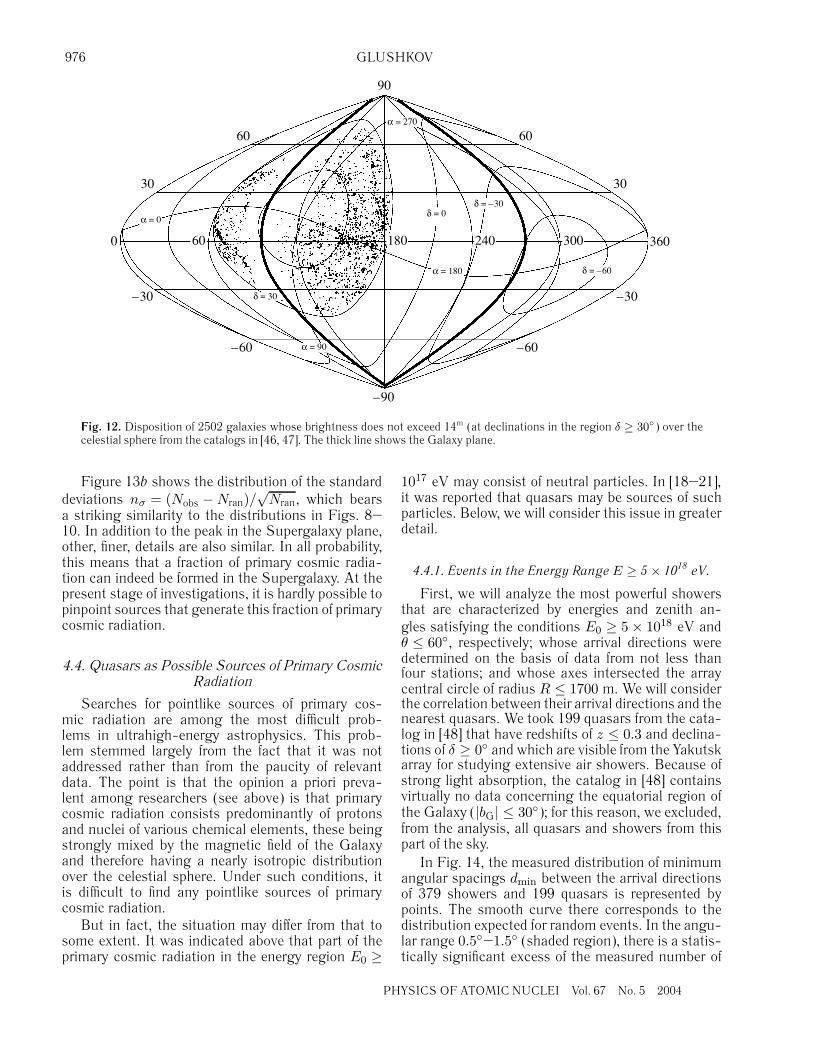
The structure of the Supergalaxy is clearly seen inFig. 12, which displays, in supergalactic coordinates,the distribution of 2502 galaxies that are charac-terized by brightness values not exceeding 14m andwhich are quoted in the catalogs in [46, 47]. Thethick line represents the Galaxy disk. Presented inthis figure are objects whose declination satisfies thecondition δ ≥ 30◦, which makes it possible to com-pare the topologies of clusters and galaxies over thecommon part of the sky. Unfortunately, some galaxiesare not seen because of light absorption in the vicinityof the Galaxy disk; therefore, the region of overlap ofthe data in Figs. 11 and 12 is narrowed considerably.
We would like to list once again some commonstructural features of the Supergalaxy and the distri-butions in Figs. 8–10. The distribution of the galaxiesthat are displayed in Fig. 12 is shown in Fig. 13aversus their supergalactic latitude (with a step of∆bSG = 3◦). The Nran curve represents the expecteddistribution of the galaxies for an isotropic dispositionin space with allowance for the decrease in their num-ber in the region of the Galaxy disk (see Fig. 12). Thisdistribution was obtained by “smearing,” with the aidof the Monte Carlo method, the actual coordinates ofeach galaxy in the parts of the sky that are adjacentto it and which have dimensions of ∆α = ±30◦ and∆δ = ±4◦.
4
976 GLUSHKOV
90
–90
60 60
30 30
3600
–30 –30
–60–60
α
= 270
α
= 0
α
= 90
δ
= 30
δ
= 0
α
= 180
δ
= –60
δ
= –30
30024018060
Fig. 12. Disposition of 2502 galaxies whose brightness does not exceed 14m (at declinations in the region δ ≥ 30◦) over thecelestial sphere from the catalogs in [46, 47]. The thick line shows the Galaxy plane.
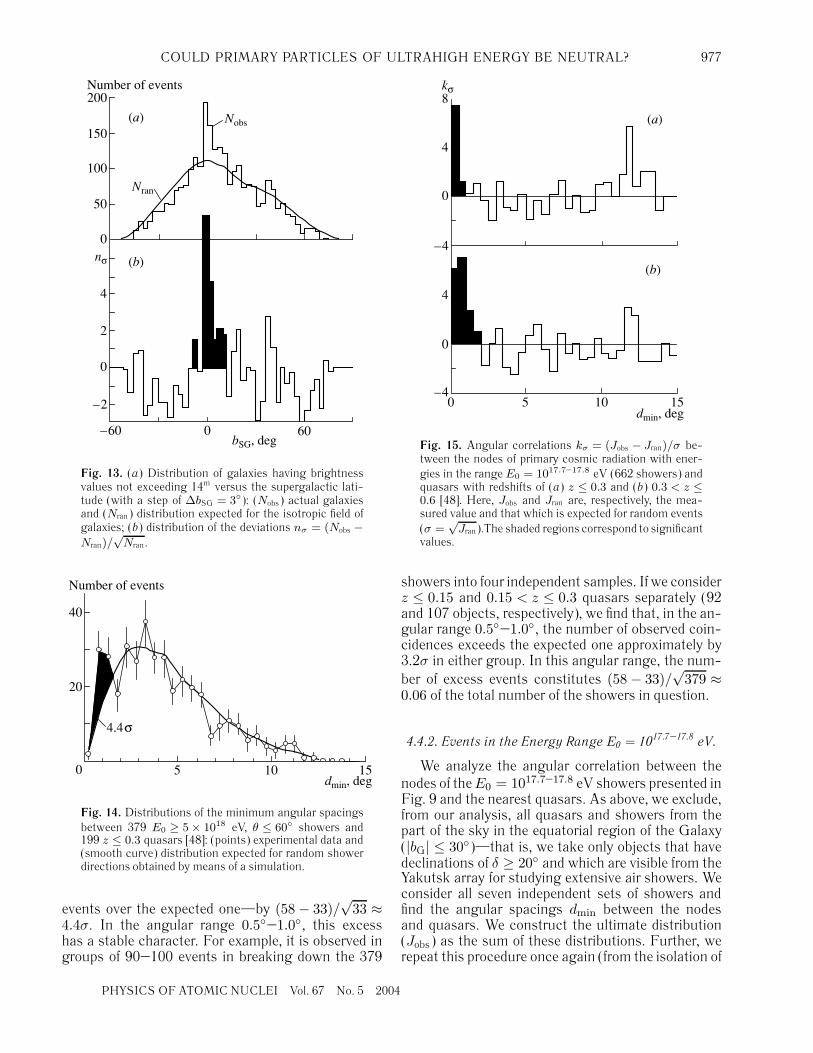
Figure 13b shows the distribution of the standarddeviations nσ = (Nobs −Nran)/
√Nran, which bears
a striking similarity to the distributions in Figs. 8–10. In addition to the peak in the Supergalaxy plane,other, finer, details are also similar. In all probability,this means that a fraction of primary cosmic radia-tion can indeed be formed in the Supergalaxy. At thepresent stage of investigations, it is hardly possible topinpoint sources that generate this fraction of primarycosmic radiation.
4.4. Quasars as Possible Sources of Primary CosmicRadiation
Searches for pointlike sources of primary cos-mic radiation are among the most difficult prob-lems in ultrahigh-energy astrophysics. This prob-lem stemmed largely from the fact that it was notaddressed rather than from the paucity of relevantdata. The point is that the opinion a priori preva-lent among researchers (see above) is that primarycosmic radiation consists predominantly of protonsand nuclei of various chemical elements, these beingstrongly mixed by the magnetic field of the Galaxyand therefore having a nearly isotropic distributionover the celestial sphere. Under such conditions, itis difficult to find any pointlike sources of primarycosmic radiation.
But in fact, the situation may differ from that tosome extent. It was indicated above that part of theprimary cosmic radiation in the energy region E0 ≥
PH
1017 eV may consist of neutral particles. In [18–21],it was reported that quasars may be sources of suchparticles. Below, we will consider this issue in greaterdetail.
4.4.1. Events in the Energy Range E ≥ 5× 10¹⁸ eV.
First, we will analyze the most powerful showersthat are characterized by energies and zenith an-gles satisfying the conditions E0 ≥ 5 × 10¹⁸ eV andθ ≤ 60◦, respectively; whose arrival directions weredetermined on the basis of data from not less thanfour stations; and whose axes intersected the arraycentral circle of radius R ≤ 1700 m. We will considerthe correlation between their arrival directions and thenearest quasars. We took 199 quasars from the cata-log in [48] that have redshifts of z ≤ 0.3 and declina-tions of δ ≥ 0◦ and which are visible from the Yakutskarray for studying extensive air showers. Because ofstrong light absorption, the catalog in [48] containsvirtually no data concerning the equatorial region ofthe Galaxy (|bG| ≤ 30◦); for this reason, we excluded,from the analysis, all quasars and showers from thispart of the sky.
In Fig. 14, the measured distribution of minimumangular spacings dmin between the arrival directionsof 379 showers and 199 quasars is represented bypoints. The smooth curve there corresponds to thedistribution expected for random events. In the angu-lar range 0.5◦–1.5◦ (shaded region), there is a statis-tically significant excess of the measured number of
YSICS OF ATOMIC NUCLEI Vol. 67 No. 5 2004
COULD PRIMARY PARTICLES OF ULTRAHIGH ENERGY BE NEUTRAL? 977
N
obs
(
a
)
(
b
)
N
ran
600–60
b
SG
, deg
–2
0
2
4
0
50
100
150
200Number of events
n
σ
Fig. 13. (a) Distribution of galaxies having brightnessvalues not exceeding 14m versus the supergalactic lati-tude (with a step of ∆bSG = 3◦): (Nobs) actual galaxiesand (Nran) distribution expected for the isotropic field ofgalaxies; (b) distribution of the deviations nσ = (Nobs −Nran)/
√Nran.
0 5 10 15
20
40
d
min
, deg
Number of events
4.4
σ
Fig. 14. Distributions of the minimum angular spacingsbetween 379 E0 ≥ 5 × 10¹⁸ eV, θ ≤ 60◦ showers and199 z ≤ 0.3 quasars [48]: (points) experimental data and(smooth curve) distribution expected for random showerdirections obtained by means of a simulation.
events over the expected one—by (58 − 33)/√
33 ≈4.4σ. In the angular range 0.5◦–1.0◦, this excesshas a stable character. For example, it is observed ingroups of 90–100 events in breaking down the 379
PHYSICS OF ATOMIC NUCLEI Vol. 67 No. 5 200
0 5 10 15
(
b
)
(
a
)
–4
0
4
–4
0
4
8
k
σ
d
min
, deg
Fig. 15. Angular correlations kσ = (Jobs − Jran)/σ be-tween the nodes of primary cosmic radiation with ener-gies in the range E0 = 1017.7–17.8 eV (662 showers) andquasars with redshifts of (a) z ≤ 0.3 and (b) 0.3 < z ≤0.6 [48]. Here, Jobs and Jran are, respectively, the mea-sured value and that which is expected for random events(σ =
√Jran).The shaded regions correspond to significant
values.
showers into four independent samples. If we considerz ≤ 0.15 and 0.15 < z ≤ 0.3 quasars separately (92and 107 objects, respectively), we find that, in the an-gular range 0.5◦–1.0◦, the number of observed coin-cidences exceeds the expected one approximately by3.2σ in either group. In this angular range, the num-ber of excess events constitutes (58 − 33)/
√379 ≈
0.06 of the total number of the showers in question.
4.4.2. Events in the Energy Range E0 = 1017.7–17.8 eV.
We analyze the angular correlation between thenodes of theE0 = 1017.7–17.8 eV showers presented inFig. 9 and the nearest quasars. As above, we exclude,from our analysis, all quasars and showers from thepart of the sky in the equatorial region of the Galaxy(|bG| ≤ 30◦)—that is, we take only objects that havedeclinations of δ ≥ 20◦ and which are visible from theYakutsk array for studying extensive air showers. Weconsider all seven independent sets of showers andfind the angular spacings dmin between the nodesand quasars. We construct the ultimate distribution(Jobs) as the sum of these distributions. Further, werepeat this procedure once again (from the isolation of
4
978 GLUSHKOV
0 5 10 15–4
0
4
–4
0
4
8
(
a
)
(
b
)
d
min
, deg
k
σ
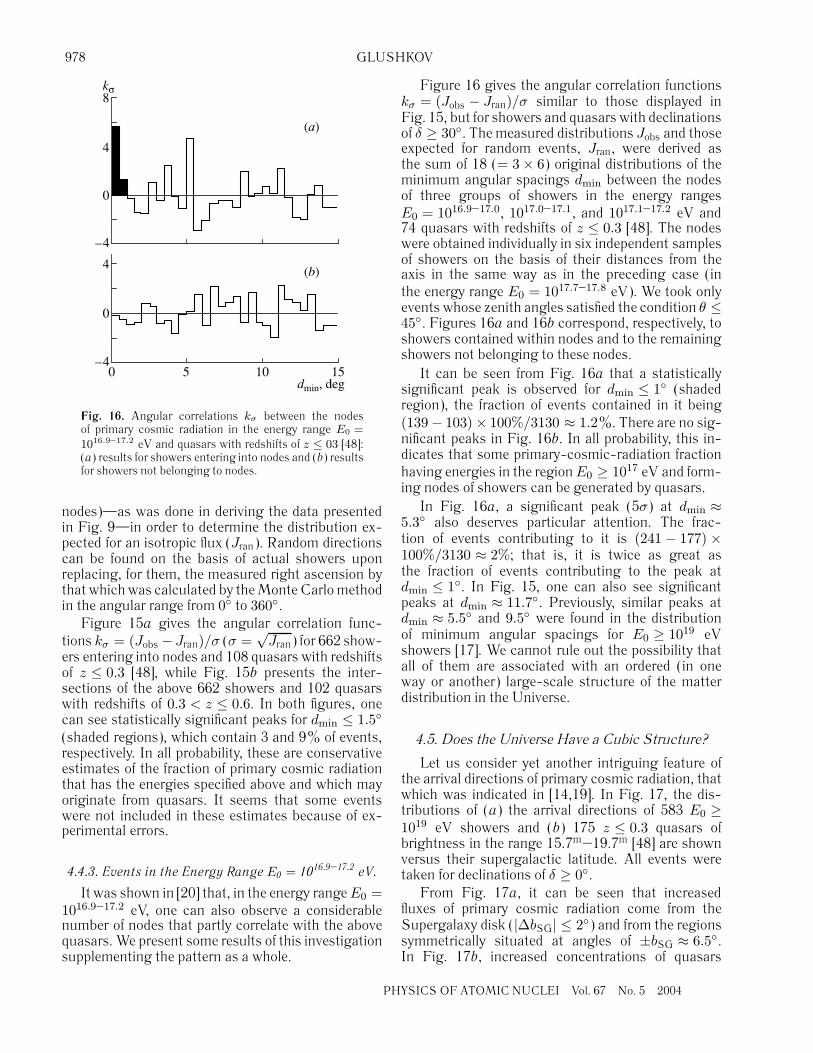
Fig. 16. Angular correlations kσ between the nodesof primary cosmic radiation in the energy range E0 =1016.9–17.2 eV and quasars with redshifts of z ≤ 03 [48]:(a) results for showers entering into nodes and (b) resultsfor showers not belonging to nodes.
nodes)—as was done in deriving the data presentedin Fig. 9—in order to determine the distribution ex-pected for an isotropic flux (Jran). Random directionscan be found on the basis of actual showers uponreplacing, for them, the measured right ascension bythat whichwas calculated by theMonte Carlomethodin the angular range from 0◦ to 360◦.
Figure 15a gives the angular correlation func-tions kσ = (Jobs − Jran)/σ (σ =
√Jran) for 662 show-
ers entering into nodes and 108 quasars with redshiftsof z ≤ 0.3 [48], while Fig. 15b presents the inter-sections of the above 662 showers and 102 quasarswith redshifts of 0.3 < z ≤ 0.6. In both figures, onecan see statistically significant peaks for dmin ≤ 1.5◦
(shaded regions), which contain 3 and 9% of events,respectively. In all probability, these are conservativeestimates of the fraction of primary cosmic radiationthat has the energies specified above and which mayoriginate from quasars. It seems that some eventswere not included in these estimates because of ex-perimental errors.
4.4.3. Events in the Energy Range E0 = 1016.9–17.2 eV.
It was shown in [20] that, in the energy rangeE0 =1016.9–17.2 eV, one can also observe a considerablenumber of nodes that partly correlate with the abovequasars. We present some results of this investigationsupplementing the pattern as a whole.
P
Figure 16 gives the angular correlation functionskσ = (Jobs − Jran)/σ similar to those displayed inFig. 15, but for showers and quasars with declinationsof δ ≥ 30◦. The measured distributions Jobs and thoseexpected for random events, Jran, were derived asthe sum of 18 (= 3 × 6) original distributions of theminimum angular spacings dmin between the nodesof three groups of showers in the energy rangesE0 = 1016.9–17.0, 1017.0–17.1, and 1017.1–17.2 eV and74 quasars with redshifts of z ≤ 0.3 [48]. The nodeswere obtained individually in six independent samplesof showers on the basis of their distances from theaxis in the same way as in the preceding case (inthe energy range E0 = 1017.7–17.8 eV). We took onlyevents whose zenith angles satisfied the condition θ ≤45◦. Figures 16a and 16b correspond, respectively, toshowers contained within nodes and to the remainingshowers not belonging to these nodes.
It can be seen from Fig. 16a that a statisticallysignificant peak is observed for dmin ≤ 1◦ (shadedregion), the fraction of events contained in it being(139 − 103) × 100%/3130 ≈ 1.2%. There are no sig-nificant peaks in Fig. 16b. In all probability, this in-dicates that some primary-cosmic-radiation fractionhaving energies in the regionE0 ≥ 1017 eV and form-ing nodes of showers can be generated by quasars.
In Fig. 16а, a significant peak (5σ) at dmin ≈5.3◦ also deserves particular attention. The frac-tion of events contributing to it is (241 − 177) ×100%/3130 ≈ 2%; that is, it is twice as great asthe fraction of events contributing to the peak atdmin ≤ 1◦. In Fig. 15, one can also see significantpeaks at dmin ≈ 11.7◦. Previously, similar peaks atdmin ≈ 5.5◦ and 9.5◦ were found in the distributionof minimum angular spacings for E0 ≥ 1019 eVshowers [17]. We cannot rule out the possibility thatall of them are associated with an ordered (in oneway or another) large-scale structure of the matterdistribution in the Universe.
4.5. Does the Universe Have a Cubic Structure?
Let us consider yet another intriguing feature ofthe arrival directions of primary cosmic radiation, thatwhich was indicated in [14,19]. In Fig. 17, the dis-tributions of (a) the arrival directions of 583 E0 ≥1019 eV showers and (b) 175 z ≤ 0.3 quasars ofbrightness in the range 15.7m–19.7m [48] are shownversus their supergalactic latitude. All events weretaken for declinations of δ ≥ 0◦.
From Fig. 17a, it can be seen that increasedfluxes of primary cosmic radiation come from theSupergalaxy disk (|∆bSG| ≤ 2◦) and from the regionssymmetrically situated at angles of ±bSG ≈ 6.5◦.In Fig. 17b, increased concentrations of quasars
HYSICS OF ATOMIC NUCLEI Vol. 67 No. 5 2004

COULD PRIMARY PARTICLES OF ULTRAHIGH ENERGY BE NEUTRAL? 979
(peaks 1 and 2) are observed in adjacent regions.This can be considered as an additional indicationthat quasars may be considered as one of the sourcesof ultrahigh-energy primary cosmic radiation. In [49,50], it was shown that Seifert galaxies with z ≤ 0.009and lacertides (BL Lac objects) with z > 0.1 may alsobe such sources. Objects of all of these three types areso-called active-core galaxies, which are among themost powerful sources in the Universe.
Observations reveal—and theoretical calculationsconfirm—the presence of large voids in the Universethat have dimensions of 100 to 130 Mpc and whichare separated by comparatively thin (20 to 30 Mpc)layers [45, 51]. Up to 60–80% of galaxies are con-centrated within these layers, showing a trend towardaggregating into prolate and oblate superclusters, in-cluding the Supergalaxy (of diameter about 50 Mpc),which is considered here. In all probability, manysuperclusters touch one another, forming a cell struc-ture of the Universe [45, 51]. This may be a structureof the type of a “three-dimensional chessboard” [52]or even some kind of a giant quasicrystal [53], withthe bulk of matter being concentrated in its sites.The formation of sites is logically explained withinthe adiabatic (“pancake”) theory of Zel’dovich [54] asthe last stage of the concentration of matter in theevolutionary chain of the expanding Universe: “brightsurfaces”–“bright lines”–“bright drops.”
Let us try to understand the origin of peaks 1and 2 in Fig. 17 within the scenario of an ordereddistribution of matter in the Universe. For the sakeof simplicity, we assume that quasars are situated inthe sites of a cubic lattice. We also assume that theSupergalaxy plane lies in one of the planes of thislattice. We consider in space only those sites that,in equatorial coordinates, have declinations of δ ≥ 0◦;moreover, we exclude, from the data sample beingconsidered, all sites that, in galactic coordinates, liewithin the latitude band bG ≤ 30◦. This is done inorder to render the actually surveyed and simulatedregions of the sky as close as possible.
The distances to the sites are given by
r = сz/H0, (14)
where c is the speed of light andH0 = 75 (km/s) Mpcis the Hubble constant. We will measure these dis-tances in x = r/L units, where L is the lattice con-stant.
Let us consider two versions, that of a steady-stateuniverse and that of an expanding universe.
In the first case, we set L = 120 Mpc. Since weconsider only z ≤ 0.3 quasars, it follows from rela-tion (14) that the farthest objects from the Earthoccur at a distance of r = 1200 Mpc, which, in unitsof the number of sites, corresponds to x = 10. In [55],it was shown that the distribution of quasars features
PHYSICS OF ATOMIC NUCLEI Vol. 67 No. 5 200
205
807
175
583
2 1
1
1
2
2
2 1
(
a
)
(
b
)
(
c
)
(
d
)
b
SG
, deg
Number of events
0
5
10
0
20
40
0
5
10
0
10
20
30
600–60
Fig. 17.Distributions of (a)E0 ≥ 1019 eV showers char-acterized by zenith angles in the region θ ≤ 60◦ andrecorded at the Yakutsk array, (b) quasars with redshifts ofz ≤ 0.3 [48], and sites of a cubic lattice in the (c) steady-state and (d) expanding universe versus their supergalac-tic latitudes (with a step of∆bSG = 2◦). Numerals in plaintext indicate the total number of events; 1 and 2 labelpeaks in the vicinity of the Supergalaxy plane.
a cosmological periodicity, which we will roughly takeinto account by introducing triangle functions withweights of 1, 2, and 4 for vertices at, respectively,x = 2, 4.5, and 7.5 and with zero weight at x = 1, 3,6, and 10.
In the expanding universe, the lattice constantcorresponding to the instant of photon emission by aquasar with a redshift z is [43]
L(z) = 120/(1 + z) [Mpc]. (15)
In our case, we have L = 92.3 Mpc for the farthestquasars, which occur at a distance of r = 1200 Mpc.As photons move from the farthest sites to an ob-server, the lattice constant increases gradually to120 Mpc; although the linear coordinates of siteschange, their projections onto the celestial sphereremain unchanged [43].
4
980 GLUSHKOV
3019
2969
2
31
13
2
(
b
)
(
a
)
Number of events
b
SG
, deg–60 0 600
50
100
150
0
50
100
150
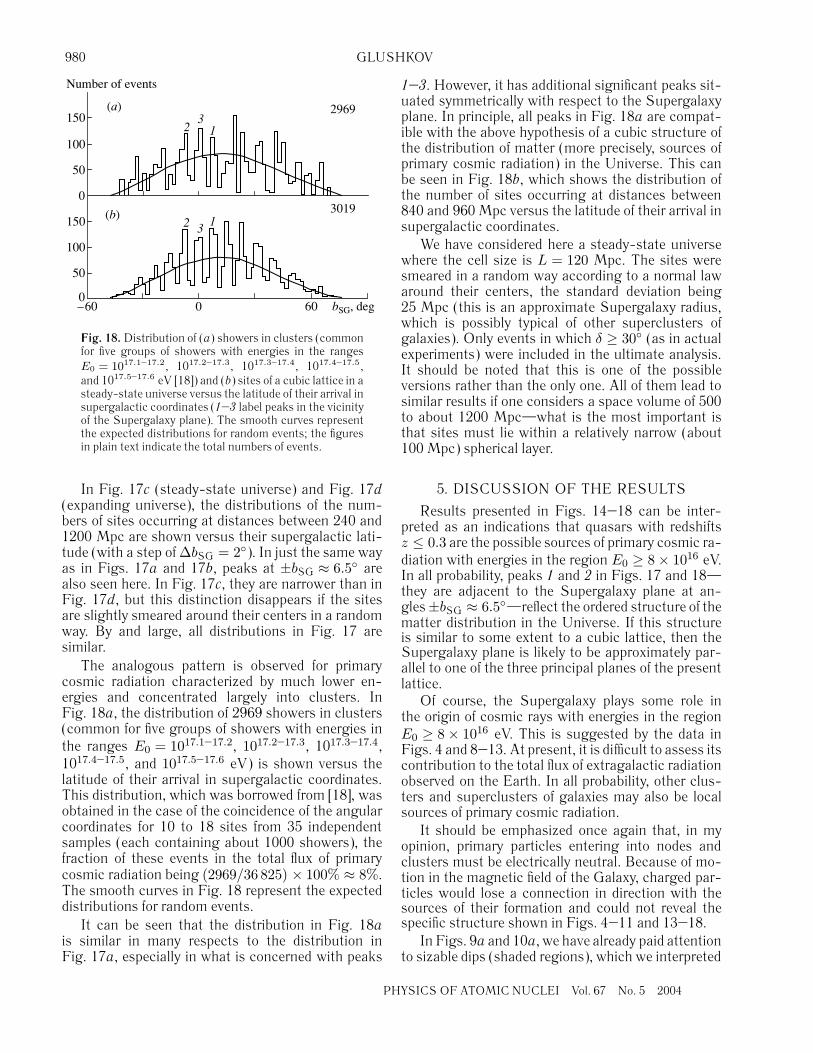
Fig. 18. Distribution of (а) showers in clusters (commonfor five groups of showers with energies in the rangesE0 = 1017.1–17.2, 1017.2–17.3, 1017.3–17.4, 1017.4–17.5,and 1017.5–17.6 eV [18]) and (b) sites of a cubic lattice in asteady-state universe versus the latitude of their arrival insupergalactic coordinates (1–3 label peaks in the vicinityof the Supergalaxy plane). The smooth curves representthe expected distributions for random events; the figuresin plain text indicate the total numbers of events.
In Fig. 17c (steady-state universe) and Fig. 17d(expanding universe), the distributions of the num-bers of sites occurring at distances between 240 and1200 Mpc are shown versus their supergalactic lati-tude (with a step of ∆bSG = 2◦). In just the same wayas in Figs. 17a and 17b, peaks at ±bSG ≈ 6.5◦ arealso seen here. In Fig. 17c, they are narrower than inFig. 17d, but this distinction disappears if the sitesare slightly smeared around their centers in a randomway. By and large, all distributions in Fig. 17 aresimilar.
The analogous pattern is observed for primarycosmic radiation characterized by much lower en-ergies and concentrated largely into clusters. InFig. 18a, the distribution of 2969 showers in clusters(common for five groups of showers with energies inthe ranges E0 = 1017.1–17.2, 1017.2–17.3, 1017.3–17.4,1017.4–17.5, and 1017.5–17.6 eV) is shown versus thelatitude of their arrival in supergalactic coordinates.This distribution, which was borrowed from [18], wasobtained in the case of the coincidence of the angularcoordinates for 10 to 18 sites from 35 independentsamples (each containing about 1000 showers), thefraction of these events in the total flux of primarycosmic radiation being (2969/36 825) × 100% ≈ 8%.The smooth curves in Fig. 18 represent the expecteddistributions for random events.
It can be seen that the distribution in Fig. 18ais similar in many respects to the distribution inFig. 17a, especially in what is concerned with peaks
PH
1–3. However, it has additional significant peaks sit-uated symmetrically with respect to the Supergalaxyplane. In principle, all peaks in Fig. 18a are compat-ible with the above hypothesis of a cubic structure ofthe distribution of matter (more precisely, sources ofprimary cosmic radiation) in the Universe. This canbe seen in Fig. 18b, which shows the distribution ofthe number of sites occurring at distances between840 and 960 Mpc versus the latitude of their arrival insupergalactic coordinates.
We have considered here a steady-state universewhere the cell size is L = 120 Mpc. The sites weresmeared in a random way according to a normal lawaround their centers, the standard deviation being25 Mpc (this is an approximate Supergalaxy radius,which is possibly typical of other superclusters ofgalaxies). Only events in which δ ≥ 30◦ (as in actualexperiments) were included in the ultimate analysis.It should be noted that this is one of the possibleversions rather than the only one. All of them lead tosimilar results if one considers a space volume of 500to about 1200 Mpc—what is the most important isthat sites must lie within a relatively narrow (about100 Mpc) spherical layer.
5. DISCUSSION OF THE RESULTS
Results presented in Figs. 14–18 can be inter-preted as an indications that quasars with redshiftsz ≤ 0.3 are the possible sources of primary cosmic ra-diation with energies in the region E0 ≥ 8 × 10¹⁶ eV.In all probability, peaks 1 and 2 in Figs. 17 and 18—they are adjacent to the Supergalaxy plane at an-gles±bSG ≈ 6.5◦—reflect the ordered structure of thematter distribution in the Universe. If this structureis similar to some extent to a cubic lattice, then theSupergalaxy plane is likely to be approximately par-allel to one of the three principal planes of the presentlattice.
Of course, the Supergalaxy plays some role inthe origin of cosmic rays with energies in the regionE0 ≥ 8 × 10¹⁶ eV. This is suggested by the data inFigs. 4 and 8–13. At present, it is difficult to assess itscontribution to the total flux of extragalactic radiationobserved on the Earth. In all probability, other clus-ters and superclusters of galaxies may also be localsources of primary cosmic radiation.
It should be emphasized once again that, in myopinion, primary particles entering into nodes andclusters must be electrically neutral. Because of mo-tion in the magnetic field of the Galaxy, charged par-ticles would lose a connection in direction with thesources of their formation and could not reveal thespecific structure shown in Figs. 4–11 and 13–18.
In Figs. 9а and 10а, we have already paid attentionto sizable dips (shaded regions), which we interpreted
YSICS OF ATOMIC NUCLEI Vol. 67 No. 5 2004
COULD PRIMARY PARTICLES OF ULTRAHIGH ENERGY BE NEUTRAL? 981
7104
7214
00
b
G
, deg60–60
50
100
150
0
50
100
150
200
(
b
)
(
a
)
Number of events
4.8
σ
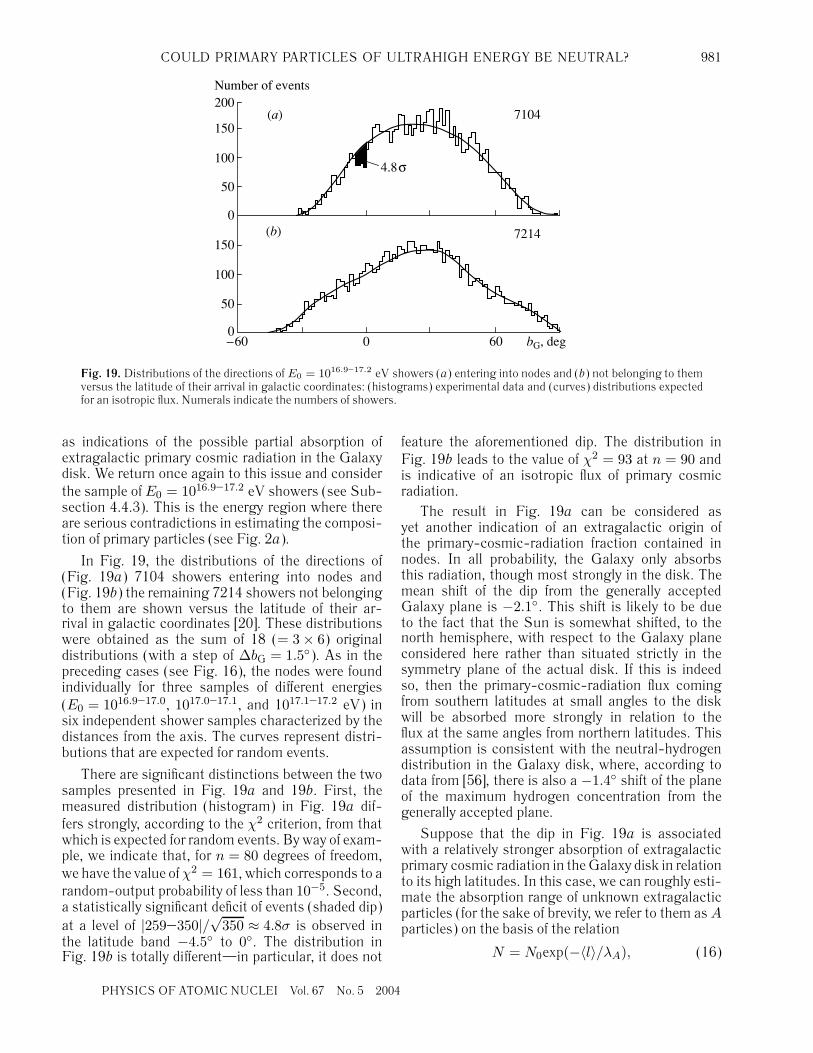
Fig. 19. Distributions of the directions of E0 = 1016.9–17.2 eV showers (а) entering into nodes and (b) not belonging to themversus the latitude of their arrival in galactic coordinates: (histograms) experimental data and (curves) distributions expectedfor an isotropic flux. Numerals indicate the numbers of showers.
as indications of the possible partial absorption ofextragalactic primary cosmic radiation in the Galaxydisk. We return once again to this issue and considerthe sample of E0 = 1016.9–17.2 eV showers (see Sub-section 4.4.3). This is the energy region where thereare serious contradictions in estimating the composi-tion of primary particles (see Fig. 2а).
In Fig. 19, the distributions of the directions of(Fig. 19а) 7104 showers entering into nodes and(Fig. 19b) the remaining 7214 showers not belongingto them are shown versus the latitude of their ar-rival in galactic coordinates [20]. These distributionswere obtained as the sum of 18 (= 3 × 6) originaldistributions (with a step of ∆bG = 1.5◦). As in thepreceding cases (see Fig. 16), the nodes were foundindividually for three samples of different energies(E0 = 1016.9–17.0, 1017.0–17.1, and 1017.1–17.2 eV) insix independent shower samples characterized by thedistances from the axis. The curves represent distri-butions that are expected for random events.
There are significant distinctions between the twosamples presented in Fig. 19а and 19b. First, themeasured distribution (histogram) in Fig. 19а dif-fers strongly, according to the χ2 criterion, from thatwhich is expected for random events. By way of exam-ple, we indicate that, for n = 80 degrees of freedom,we have the value ofχ2 = 161, which corresponds to arandom-output probability of less than 10−5. Second,a statistically significant deficit of events (shaded dip)at a level of |259–350|/
√350 ≈ 4.8σ is observed in
the latitude band −4.5◦ to 0◦. The distribution inFig. 19b is totally different—in particular, it does not
PHYSICS OF ATOMIC NUCLEI Vol. 67 No. 5 20
feature the aforementioned dip. The distribution inFig. 19b leads to the value of χ2 = 93 at n = 90 andis indicative of an isotropic flux of primary cosmicradiation.
The result in Fig. 19а can be considered asyet another indication of an extragalactic origin ofthe primary-cosmic-radiation fraction contained innodes. In all probability, the Galaxy only absorbsthis radiation, though most strongly in the disk. Themean shift of the dip from the generally acceptedGalaxy plane is −2.1◦. This shift is likely to be dueto the fact that the Sun is somewhat shifted, to thenorth hemisphere, with respect to the Galaxy planeconsidered here rather than situated strictly in thesymmetry plane of the actual disk. If this is indeedso, then the primary-cosmic-radiation flux comingfrom southern latitudes at small angles to the diskwill be absorbed more strongly in relation to theflux at the same angles from northern latitudes. Thisassumption is consistent with the neutral-hydrogendistribution in the Galaxy disk, where, according todata from [56], there is also a −1.4◦ shift of the planeof the maximum hydrogen concentration from thegenerally accepted plane.
Suppose that the dip in Fig. 19а is associatedwith a relatively stronger absorption of extragalacticprimary cosmic radiation in theGalaxy disk in relationto its high latitudes. In this case, we can roughly esti-mate the absorption range of unknown extragalacticparticles (for the sake of brevity, we refer to them asAparticles) on the basis of the relation
N = N0exp(−〈l〉/λA), (16)
04
982 GLUSHKOV
where N0 ≈ 350 and N ≈ 259 are, respectively, theexpected and the measured number of events inthe band of Galaxy latitudes between −4.5◦ and 0◦
(Fig. 19а) and 〈l〉 is the mean thickness (in g/cm2)ofthe Galaxy disk in the sector of our observations.From (16), we obtain
λA ≈ 3.3〈l〉.In order to find the value of 〈l〉, we assume that neutralhydrogen plays the main role in the weakening ofprimary cosmic radiation, since the contribution ofdust (about 1%) is negligible [56]. From Fig. 5, it canbe seen that, in the Galaxy disk, primary cosmic ra-diation comes to us from the sector ∆lG ≈ 60◦–180◦.Within this sector, the path r from the observer to theexternal boundary of the Galaxy changes from about10 to 5 kpc (〈r〉 ≈ 8 kpc). According to data from[56], the mean hydrogen concentration in the latitudeband |bG| ≤ 10◦ decreases from ρ ≈ 0.5 cm−3 (at adistance of about 10 kpc from the Galaxy center) toρ ≈ 0.1 cm−3 at about 15 kpc (〈ρ〉 ≈ 0.25 cm−3).From here, we obtain
〈l〉 ≈ 〈r〉〈ρ〉mp ≈ 10−2 g/cm2,
where mp = 1.67 × 10⁻²⁴ g is the proton mass. Thesought range is
λA ≈ 3.3 × 10⁻² g/cm2.
The resulting range of unknownA particles provedto be approximately 1000 times shorter than the rangeofE0 ∼ 1017 eV protons with respect to nuclear inter-actions; nevertheless, these particles can arrive with-out losses almost from the very horizon of the visibleUniverse. Assuming that the age of the expandingUniverse is T ≈ 13 billion years and that its meanmatter density is ρ0 ≈ 10−30 g/cm3,we obtain
lT = ρ0cT ≈ 1.23 × 10⁻² g/cm2,
where c is the speed of light. From (16), the attenu-ation factor is exp(−lT /λA) ≈ 0.7. In the Earth’s at-mosphere, A particles begin to interact at an altitudehA above sea level. This altitude can be found fromthe barometric formula
λA = p0exp(−hA/h0), (17)
where p0 = 1020 g/cm2 is the air pressure at sea leveland h0 = 6.85 km; it follows that hA ≈ 71 km.
These particles initiate the development of exten-sive air showers much earlier than particles of theusual composition of cosmic rays. If one takes, byway of example, protons of energy E0 ∼ 1017 eV, theytravel, in the Earth’s atmosphere, a mean path ofabout 50 g/cm2 to the first event of nuclear interac-tion; for iron nuclei, it is approximately two to threetimes shorter.
PH
After the first interaction, mysterious A particlesseem to disappear, giving way, in the developmentof extensive air showers, to a normal cascade ofsecondary particles. Otherwise, showers initiatedby them would differ strongly from ordinary onesand would reveal themselves readily. Because of soshort a range to the first nuclear interaction, showersfrom A particles are expected to cause an enhanceddevelopment of extensive air showers, with a highermaximum of the cascade curve in relation to the caseof primary protons. In view of this, showers from Aparticles could be misinterpreted as showers fromiron nuclei. We cannot rule out the possibility thatone of the primary-cosmic-radiation componentsthat is presented in Fig. 2b as iron reflects roughlythe contribution of these particles, because, as wasmentioned above, the majority of the methods fordetermining the composition of primary cosmic ra-diation are indirect: they are based on a comparisonof the observed features of extensive air showers withtheir counterparts calculated on the basis of modelconcepts of the development of extensive air showersfor some specifically presumed composition of pri-mary cosmic radiation. Here, it is quite possible thatthe effect of any new primary particles characterizedby very short ranges with respect to interactions canbe erroneously treated by researchers in terms of anincrease in the fraction of heavy nuclei.
6. CONCLUSION
Upon a generalization of the results presentedabove, there arises the following pattern. In the re-gion of energies higher than that of the Khristiansenknee (E0 ≥ 3 × 10¹⁵ eV), primary cosmic radiationis likely to consist of two components, one of thesebeing, in all probability, of an extragalactic origin.This is suggested by the data in Figs. 4–19. Ofcourse, the Supergalaxy plays a nontrivial role in theorigin of ultrahigh-energy cosmic rays (at least forE0 ≥ 8 × 10¹⁶ eV). Pieces of evidence for this canbe found in Figs. 4 and 8–13. The results presentedin Figs. 14–18 can be interpreted as an indicationthat quasars with redshifts of z ≤ 0.3 may be oneof the possible sources of primary cosmic radiationwith energies in the region E0 ≥ 8 × 10¹⁶ eV. Peaks1 and 2 in Figs. 17 and 18—they are adjacent to theSupergalaxy plane at angles of±bSG ≈ 6.5◦—reflect,in all probability, the ordered structure of the matterdistribution in the Universe.
Within d ≤ 3◦ solid angles, the extragalactic com-ponent forms many nodes and clusters. Most likely,primary particles entering into the nodes and clustersare electrically neutral; otherwise, their motion in themagnetic field of the Galaxy would lead to the dis-appearance of their connection with their sources in
YSICS OF ATOMIC NUCLEI Vol. 67 No. 5 2004
COULD PRIMARY PARTICLES OF ULTRAHIGH ENERGY BE NEUTRAL? 983
direction, so that these particles could not disclose theaforementioned structure of the matter distribution inthe Universe.
In all probability, these particles have a very shortrange with respect to nuclear interaction (λa ≈ 3.3 ×10⁻² g/cm2) and cause an earlier development ofextensive air showers in relation to the case of theusual composition of primary cosmic radiation. Theirfraction in the total flux of primary cosmic rays atE0 ≈ 1017 eV is 7104/14 318 ≈ 0.5, which is abouttwo to three times higher than in the adjacent energyrange E0 ≈ 1017.2–17.8 eV.
So fast an increase in the fraction of neutral par-ticles at E0 ≈ 1017 eV can be misinterpreted as aconsiderable change in the composition of primarycosmic radiation toward its higher weight. We cannotrule out the possibility that unknown neutral particleshypothesized here can manifest themselves sizably inthe energy region E0 < 1017 eV as well, but furtherinvestigations are necessary in order to clarify thispoint conclusively.
The remaining showers, which do not belong tonodes and clusters, are distributed almost isotrop-ically over the celestial sphere. In all probability,this part of the primary cosmic radiation consistsof charged particles (protons and nuclei of variouschemical elements) propagating through Galaxy viadiffusion. One of their powerful sources is situated inthe vicinity of the Galaxy center [10,11].
Within different energy intervals, the contributionsof the components conjectured here are strongly dif-ferent. It is highly probable that such a change in thecomposition of primary cosmic radiation is especiallypronounced in the energy ranges E0 ≈ 1015.7–15.9,1016.7–16.9, 1017.7–17.9, and 1018.7–18.9 eV, whereone observes correlated astrophysical and nuclear-physics anomalies in the development of extensive airshowers.
ACKNOWLEDGMENTS
The financial support extended by the Ministry forScience of the Russian Federation to the Yakutskmultipurpose array for studying extensive air showers(grant no. 01-30) is gratefully acknowledged.
REFERENCES
1. G. V. Kulikov and G. B. Khristiansen, Zh. Eksp. Teor.Fiz. 35, 635 (1958) [Sov. Phys. JETP 8, 441 (1958)].
2. E. A. Vishnevskaya, N. N. Kalmykov, G. V. Kulikov,et al., Yad. Fiz. 62, 300 (1999) [Phys. At. Nucl. 62,265 (1999)].
3. H. Ulrich, T. Antoni, W. D. Apel, et al., in Proceed-ings of the 27th ICRC, Hamburg, 2001, Vol. 2, p. 97.
PHYSICS OF ATOMIC NUCLEI Vol. 67 No. 5 200
4. T. Abu-Zayyad, K. Belov, D. J. Clay, et al., astro-ph/0010652.
5. V. S. Ptuskin et al., Astron. Astrophys. 268, 726(1993).
6. J. Linsley, Phys. Rev. Lett. 34, 1530 (1975).7. R. N. Coy, J. Lloyd-Evans, M. Patel, et al., in Pro-
ceedings of the 17th ICRC, Paris, 1981, Vol. 9,p. 183.
8. A. A. Mikhailov and M. I. Pravdin, Pis’ma Zh. Eksp.Teor. Fiz. 66, 289 (1997) [JETP Lett. 66, 305 (1997)].
9. M. I. Pravdin, A. A. Ivanov, A. D. Krasil’nikov, et al.,Zh. Eksp. Teor. Fiz. 119, 881 (2001) [JETP 92, 766(2001)].
10. N. Hayashida, M. Nagano, D. Nishikawa, et al., As-tropart. Phys. 10, 303 (1999).
11. J. A. Bellido, B. W. Clay, R. B. Dawson, andM. Johnston-Hollitt, astro-ph/0009039.
12. A. V. Glushkov, Pis’ma Zh. Eksp. Teor. Fiz. 48, 513(1988) [JETP Lett. 48, 555 (1988)].
13. A. V. Glushkov, Priroda, No. 5, 111 (1989).14. A. V. Glushkov, Pis’ma Zh. Eksp. Teor. Fiz. 73, 355
(2001) [JETP Lett. 73, 313 (2001)].15. A. V. Glushkov and I. E. Sleptsov, Izv. Akad. Nauk,
Ser. Fiz. 65, 437 (2001).16. A. V. Glushkov andM. I. Pravdin, Zh. Eksp. Teor. Fiz.
119, 1029 (2001) [JETP 92, 887 (2001)].17. A. V. Glushkov and M. I. Pravdin, Pis’ma Astron. Zh.
27, 577 (2001) [Astron. Lett. 27, 493 (2001)].18. A. V. Glushkov, Pis’ma Zh. Eksp. Teor. Fiz. 75, 3
(2002) [JETP Lett. 75, 1 (2002)].19. A. V. Glushkov, Izv. Akad. Nauk, Ser. Fiz. 66, 1601
(2002).20. A. V. Glushkov, Yad. Fiz. 66, 1292 (2003) [Phys. At.
Nucl. 66, 1252 (2003)].21. A. V. Glushkov, Preprint IKFIA (Yakutsk, 1988).22. A. V. Glushkov, N. N. Efimov, N. N. Efremov, et al.,
in Proceedings of the 19th ICRC, La Jolla, 1985,Vol. 7, p. 48.
23. A. V. Glushkov, M. I. Pravdin, I. E. Sleptsov, et al.,Yad. Fiz. 63, 1557 (2000) [Phys. At. Nucl. 63, 1477(2000)].
24. N. N. Kalmykov, G. B. Khristiansen, S. S. Ostapenko,and A. V. Pavlov, in Proceedings of the 24th ICRC,Rome, 1995, Vol. 1, p. 123.
25. J. Linsley, in Proceedings of the 18th ICRC, Banga-lore, 1983, Vol. 12, p. 135.
26. M. I. Pravdin, M. N. Dyakonov, A. V. Glushkov, et al.,in Proceedings of the 26th ICRC, Salt Lake City,1999, Vol. 3, p. 292.
27. N. Hayashida, K. Honda, M. Honda, et al., in Pro-ceedings of the Tokyo Workshop on ExtremelyHigh Energy Cosmic Rays: Astrophysics and Fu-ture Observatories, 1996, Ed. by M. Nagano, p. 17.
28. M. Nagano, T. Hara, Y. Hatano, et al., J. Phys. G 10,1295 (1984).
29. J. Linsley and A. A. Watson, Phys. Rev. Lett. 46, 459(1981).
4

984 GLUSHKOV
30. J. Lloyd-Evans and A. A. Watson, in Proceedingsof the 8th European Cosmic Rays Symposium,Bologna, 1983.
31. A. A. Watson, Nucl. Phys. B (Proc. Suppl.) 28, 3(1992).
32. A. G. Lyne and F. Graham-Smith, Pulsar Astron-omy (Cambridge Univ. Press, 1990).
33. V. V. Prosin, private communication.34. B. N. Afanasiev, M. N. Dyakonov, T. A. Egorov,
et al., inProceedings of the 24th ICRC, Rome, 1995,Vol. 2, p. 756.
35. A. A. Mikhailov, Pis’ma Zh. Eksp. Teor. Fiz. 72, 233(2000) [JETP Lett. 72, 160 (2000)].
36. A. A. Mikhailov, in Proceedings of the 27th ICRC,Hamburg, 2001, Vol. 2, p. 420.
37. A. V. Glushkov, I. T. Makarov, E. S. Nikiforova, et al.,Astropart. Phys. 4, 15 (1995).
38. A. V. Glushkov, I. T. Makarov, M. I. Pravdin, andI. E. Sleptsov, Izv. Akad. Nauk, Ser. Fiz. 63, 538(1999).
39. A. V. Glushkov, I. T. Makarov, M. I. Pravdin, et al.,Pis’ma Zh. Eksp. Teor. Fiz. 71, 145 (2000) [JETPLett. 71, 97 (2000)].
40. A. V. Glushkov, I. T. Makarov, M. I. Pravdin, et al.,in Proceedings of the 27th ICRC, Hamburg, 2001,Vol. 2, p. 411.
41. A. V. Glushkov, M. I. Pravdin, I. E. Sleptsov, et al.,Yad. Fiz. 65, 1346 (2002) [Phys. At. Nucl. 65, 1313(2002)].
42. M. Seldner, B. Siebars, E. J. Groth, and E. P. J. Pee-bles, Astron. J. 82, 249 (1977).
43. D. Layzer, Constructing the Universe (Sci. Ameri-can, New York, 1984; Mir, Moscow, 1988).
PH
44. G. de Vaucouleurs, Astron. J. 58, 30 (1953).45. B. A. Vorontsov-Vel’yaminov, I. D. Karachentsev,
E. Turner, et al., in Large-Scale Structure of theUniverse (Mir, Moscow, 1981).
46. B. A. Vorontsov-Vel’yaminov and A. A. Krasno-gorskaya,Morphology Catalogue of Galaxies (Izd.Mos. Gos. Univ., Moscow, 1962), Part 1.
47. B. A. Vorontsov-Vel’yaminov and V. P. Arkhipo-va, Morphology Catalogue of Galaxies (Izd. Mos.Gos. Univ., Moscow, 1964), Part 2.
48. A. Hewitt and G. Burbidge, Astrophys. J., Suppl. Ser.63, 1 (1987).
49. A. V. Uryson, Zh. Eksp. Teor. Fiz. 116, 1121 (1999)[JETP 89, 597 (1999)].
50. P. G. Tinyakov and I. I. Tkachov, Pis’ma Zh. Eksp.Teor. Fiz. 74, 499 (2001) [JETP Lett. 74, 445 (2001)].
51. A. V. Gurevich and K. P. Zybin, Usp. Fiz. Nauk 165,1 (1995).
52. J. Einasto et al., Nature 385, 139 (1997).53. S. G. Fedoskin, Physics and Phylosophy of Simi-
larity from Preons to Metagalaxies (Perm, 1999).54. Ya. B. Zel’dovich, Pis’ma Astron. Zh. 8, 195 (1982)
[Sov. Astron. Lett. 8, 102 (1982)].55. M. F. Khodyachikh, Astron. Zh. 73, 11 (1996) [As-
tron. Rep. 40, 6 (1996)].56. I. Oort, in Handbuch der Physik, Bd. 53, Astro-
physik IV: Sternesysteme (West Berlin, 1959; Inos-trannaya Literatura, Moscow, 1962).
Translated by A. Isaakyan
YSICS OF ATOMIC NUCLEI Vol. 67 No. 5 2004