Embed Size (px)
Citation preview

5
Economic Outlook
Could monetary policy become ineffective?
Key points
• The US Federal Reserve and other global central banks, including the Bank of England, have so far adopted a two-pronged approach to dealing with the credit crunch. First, they have supplied large volumes of liquidity to the banking sector to try to ease financial strains caused by a sharp rise in risk aversion and the resultant sudden illiquidity of many assets. Second, policy rates have been reduced to try to offset the real economy fall-out from the credit crunch.
• Despite this radical action by the Fed, there have been concerns expressed that monetary policy will prove an ineffective tool to combat the current economic slowdown. Some commentators have worried that the US, in particular, might fall into a so-called ‘liquidity trap’ - as nominal interest rates approach zero, it is argued that the Fed will ‘run out of ammunition’ to boost the economy. Others worry about the malfunctioning of the banking sector, arguing that, even if the demand for credit is stimulated by lower central bank rates, banks will not expand lending to meet it, instead concentrating on repairing their balance sheets.
• Recent surveys have shown banks significantly tightening their lending standards for corporates and for households. And there has been a marked disconnection between policy rates and interbank lending rates, a disconnection resulting from ‘liquidity hoarding’ by banks concerned about counterparty risk and keen to ensure the timely repayment of their own obligations.
• But while higher-end estimates suggest that bank write-downs will total around $1 trillion in the current crisis, this is not without precedent measured relative to GDP. For example, it is broadly on a par with the losses seen in the early 1990s Nordic banking crises. And it is much smaller than the losses faced by Japanese banks which led to its prolonged deflation.
• The Japanese experience certainly demonstrates that delaying intervention in a badly damaged banking sector risks unnecessarily prolonging a credit crunch. But the Japanese crisis can also be seen as demonstrating the remarkable capacity of central banks to absorb the impact of collapsing asset price bubbles with expansionary monetary policy. For despite its enormous asset price deflation and the mismanagement of bank restructuring, the scale of the output losses suffered by Japan was nevertheless relatively mild.
• It is clear that the banking system today has been seriously impaired by large scale losses and write-downs. There is therefore a good case to be made that monetary policy will be less effective than normal in combating the real economy spillovers of recent financial market turbulence. The extent to which policy will be hampered, and for how long, is less clear. Neither the US nor the UK looks like repeating the Japanese experience, as the scale of asset price falls and collateral erosion which occurred in Japan are highly unlikely to be repeated given the very different starting points of asset markets. But it appears highly likely that the next year will see the authorities in the major countries – especially the US – turn to aggressive use of fiscal policy as an additional weapon to fight the downturn if credit conditions do not improve.

6
Economic Outlook
The effectiveness of monetary policy
1. Introduction
The US Federal Reserve and other global central banks, including the Bank of England, have so far adopted a two-pronged approach to dealing with the credit crunch. First, they have supplied large volumes of liquidity to the banking sector to try to ease financial strains caused by a sharp rise in risk aversion and the resultant sudden illiquidity of many assets. Over time, liquidity injections have become larger, of longer duration and granted against a widening base of collateral. The precise details have varied form jurisdiction to jurisdiction.
Second, policy rates have been reduced to try to offset the real economy fall-out from the credit crunch. The scale of the response here has been varied, reflecting to a great extent the different cyclical positions that existed before the credit crunch hit last summer, and the different degrees of vulnerability to financial sector problems among the main countries. Most dramatic has been the action of the US Federal Reserve, which has brought rates down by 300bp since last August, with 200bp of these reductions coming this year. In tandem with the depreciating dollar, US monetary conditions are now at their loosest since 2004.
Despite this radical action by the Fed, there have been concerns expressed that monetary policy might prove an ineffective tool to combat the current economic slowdown, and a range of alternative policy prescriptions, including some very drastic ones, has been floated. The US administration has also moved quickly to augment the Fed’s action with a major fiscal stimulus package worth $150 billion and a number of additional, essentially fiscal, measures aimed at shoring up the housing market.
So what is the basis for concerns about monetary policy being ineffective in the current environment? One line of reasoning has been that the US might fall into a so-called ‘liquidity trap’. In this scenario, as nominal interest rates approach zero, it is argued that the Fed will ‘run out of ammunition’ to boost the economy. Not only will nominal rates be unable to fall further, but real rates may even rise if price deflation takes hold, leading to further downward pressure on activity. Some proponents of this view also argue that even direct enlargements of the monetary base by the central bank would fail to stimulate the economy in this scenario, as, with a zero opportunity cost of holding money, the extra liquidity would simply accumulate in ‘idle balances’ rather than being lent out.
Another set of arguments relates to the malfunctioning of the banking sector. In this scenario, heavy losses and impaired balance sheets mean that banks become extremely risk averse and are unwilling to expand lending. Even if the demand for credit is stimulated by lower central bank rates, banks will not expand lending to meet it, instead concentrating on repairing their balance sheets. Spreads between lending rates and central
-12
-9
-6
-3
0
3
6
9
12
1990 1995 2000 2005Source: Oxford Economics
US: Monetary conditions indicatorloose
tight

7
Economic Outlook
bank rates remain high due to greatly increased risk premiums and the need for banks to boost profitability. So, the normal process of money creation and increased demand for goods and services is short-circuited and the economy remains in stagnation.
2. Liquidity trap or banking sector ‘malfunction’?
How well do these scenarios compare with the reality of the current situation? Clearly the US is some way from a liquidity trap, as classically defined. While the Fed Funds rate is low at 2.25%, it is well above zero and still 125bp higher than the last cyclical trough in 2003. Nor is it the case that the US is anywhere near a deflation scenario. Headline inflation is above 4%, and long-term inflation expectations, although they appear to have dipped a little recently, remain above 3%. Again, this is well above the levels seen during the last so-called ‘deflation scare’ in 2003, and implies real interest rates are negative.
The behaviour of monetary aggregates provides a more confused picture. Growth in narrow measures of money has been very sluggish of late, despite the sharp Fed cuts, and in great contrast to the behaviour of
1.5
1.7
1.9
2.1
2.3
2.5
2.7
2.9
3.1
2003 2004 2005 2006 2007 2008
US 5-year forward inflation rate%
Source : Oxford Economics/Haver Analytics
Average since 2003 2.4%
'Deflation scare'
-10
-5
0
5
10
15
20
25
1990 1992 1994 1996 1998 2000 2002 2004 2006 2008
-6
-5
-4
-3
-2
-1
0
1
2
3
4
US monetary aggregates and Fed rates% year
Source : Oxford Economics/Haver Analytics
Broad money (MZM), LHS
Narrow money (M1), LHS
Change in Fed Funds rate, RHS (inverted)
%
8
Economic Outlook
The effectiveness of monetary policy
these aggregates in 2001-2002 when the Fed embarked on a similar process of rapid rate cuts. Broad money growth, on the other hand looks surprisingly rapid, rising more than 15% year-on-year in February. This suggests a rather healthy – possibly too healthy – response of the financial system to Fed rate cuts.
The broad money growth figures, however, are probably distorted by measurement issues. One of the peculiar features of the credit crunch has been that it has led to banks being forced to bring back on to their balance sheets loans and other assets that had been intended for on-sale to end investors, or had been held by off-balance sheet vehicles. This involuntary expansion of balance sheets looks to be at the heart of the apparent rapid growth in bank lending that underlies the buoyant broad money growth.
The evidence for this is in the behaviour of the commercial paper market, which has collapsed since last summer. Many off-balance sheet vehicles used commercial paper to fund their holdings of assets, and as investors refused to roll this paper over due to concerns about asset quality, these assets migrated back on to bank balance sheets. A few figures are instructive – in March, US banks’ loans to commerce and industry were up $190 billion from the previous June, or a racy 22% year-on-year. Yet over the same period, the stock of outstanding commercial paper dropped by some US$330 billion.
If we add commercial and industrial loans together with commercial paper to get a hybrid measure of credit expansion, we get a very different picture to that from the lending data alone. The total volume of ‘credit’ according to this measure is down $135 billion from last June and the year-on-year growth rate of this hybrid aggregate was less than 1% in March, compared to 18% nine months ago. While crude, we believe this measure gives a better picture of real credit conditions than the raw bank lending or broad money data.
A careful look at the monetary data therefore suggests credit conditions are tightening, and this is in line with the results of recent central bank surveys of the banking sector which have shown banks tightening their lending standards for corporates and for households. Such tightening phases are regular features of economic downturns, but the details of the surveys suggest there is more to the recent changes in bank behaviour than simply expectations of leaner economic times ahead.
In the latest Bank of England survey, a changed economic outlook was widely cited by respondents as a factor leading to tighter credit standards, as would be expected against the background of a cyclical downturn. But respondents also reported that the collapse of securitisation markets, higher funding costs, the need to ‘repatriate’ assets from off-balance sheet vehicles and lower risk appetite were key factors behind tightening lending standards. The first three factors in this list are clearly specific to the credit crunch, as is the latter -
-15
-10
-5
0
5
10
15
20
25
1989 1991 1993 1995 1997 1999 2001 2003 2005 2007
US lending growth% year
Source : Oxford Economics/Haver Analytics
Commercial & Industrial
Real estate
Loans+commercial paper outstanding

9
Economic Outlook
insofar as it refers to the current high level of counterparty risk among banks. Moreover, survey respondents did not expect these factors to ease soon – indeed, in some cases, expectations for the quarter ahead were worse. This chimes with the one of the conclusions of the recent CBI/PWC survey of the UK financial services industry, which suggested that ‘business models are being adapted for a long siege’.
More evidence for possible banking sector ‘malfunction’ comes from examining the behaviour of various borrowing rates in response to moves in central bank rates. A striking feature of the recent credit crunch has been the disconnection between policy rates and interbank lending rates, a disconnection resulting from ‘liquidity hoarding’ by banks concerned about counterparty risk and keen to ensure the timely repayment of their own obligations. There have been three ‘waves’ of this since the credit crunch, the latest of which has left 3-month LIBOR rates some 70-95bp above relevant policy rates in the US, UK, and Eurozone. This in turn has caused upward pressure on borrowing costs in the wider economy, many of which are linked either explicitly or implicitly to interbank rates.
-50
-40
-30
-20
-10
0
10
20
30
Economicoutlook
Market Share Risk appetite Funding Change insecuritisation
Jun-07 Sep-07Dec-07 Mar-08Jun-08F
Factors affecting UK mortgage lending supply% balance
Source : Oxford Economics/Haver Analytics
-400 -300 -200 -100 0 100 200
Fed rates
3-monthEurodollar
AA ratedcorporate bonds
BB/B- ratedcorporate bonds
30-yr mortgages
Jumbomortgages
US: Fed Funds and market rate changesbasis points, July 31 to Apr 17
Source : Oxford Economics/Haver Analytics
10
Economic Outlook
The effectiveness of monetary policy
In the US, despite 300bp of Fed rate cuts so far, rising risk spreads mean that borrowing costs for AA-rated borrowers have fallen only slightly, and those for junk-rated borrowers have actually risen substantially over the last nine months. Jumbo mortgage rates have also risen notably over the same period, while the drop in conventional mortgage rates has been limited to just 80bp.
The story is similar in the UK, where many mortgage rates have actually crept up, especially for weaker borrowers, despite lower Bank of England rates. Moreover, the disruption of the securitisation market has meant that many UK mortgage lenders have been left with serious problems in funding their mortgages, leading to a sharp tightening of lending standards, as well as ‘sticky’ mortgage rates. In the face of serious balance sheet strains, many lenders are now looking to actively discourage new borrowers and reduce their market share.
3. How serious are the problems in the banking sector?
The evidence for possible banking sector ‘malfunction’ therefore appears to be strong. Many borrowing rates have proved ‘sticky’ in recent months, even in the face of falling central bank rates, and banks appear to be tightening lending standards significantly in the face of balance sheet strains and disruptions to funding channels including the closure of the securitisation market. But just how bad is the situation in the banking sector? And to what extent could it impair the proper functioning of monetary policy?
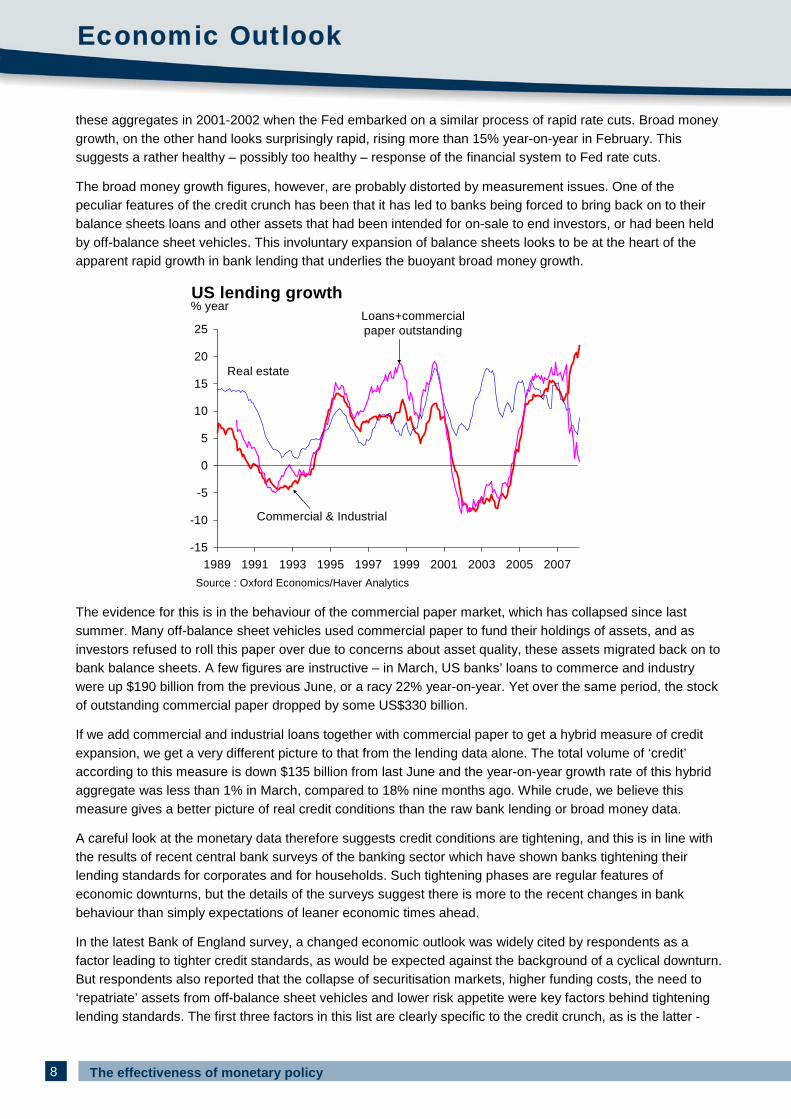
One way of looking at this is to compare the scale of banking sector losses in the current crisis with those in previous banking crises. Higher-end estimates, including the recent work by the IMF, suggest aggregate write-downs and losses of around $1 trillion in the current crisis, or around 7% of US GDP. This is somewhat higher than the losses in the savings and loans crisis in the 1980s-1990s, and broadly on a par with the losses seen in the early 1990s Nordic banking crises. The IMF estimates losses on this scale would reduce the capital adequacy of US banks by around 250bp.
This is a potentially major erosion of capital adequacy, and implies that banks will have to engage in a significant process of balance sheet reconstruction, which could well sap their appetite for extending lending, even in an atmosphere of very low nominal Fed rates. In addition, the process of repairing balance sheets could have additional negative effects by depressing asset prices, eroding the value of collateral and leading to further erosion of bank capital in a so-called ‘negative feedback loop’.
0 5 10 15 20
Japanese bank losses1990s
Nordic bank losses1990s
Savings & Loanslosses 1990s
Potential losses (highestimates)
Potential losses (lowestimates)
US Bank writedownsso far
Banking sector losses - comparisons% of country GDP
Source : Oxford Economics
11
Economic Outlook
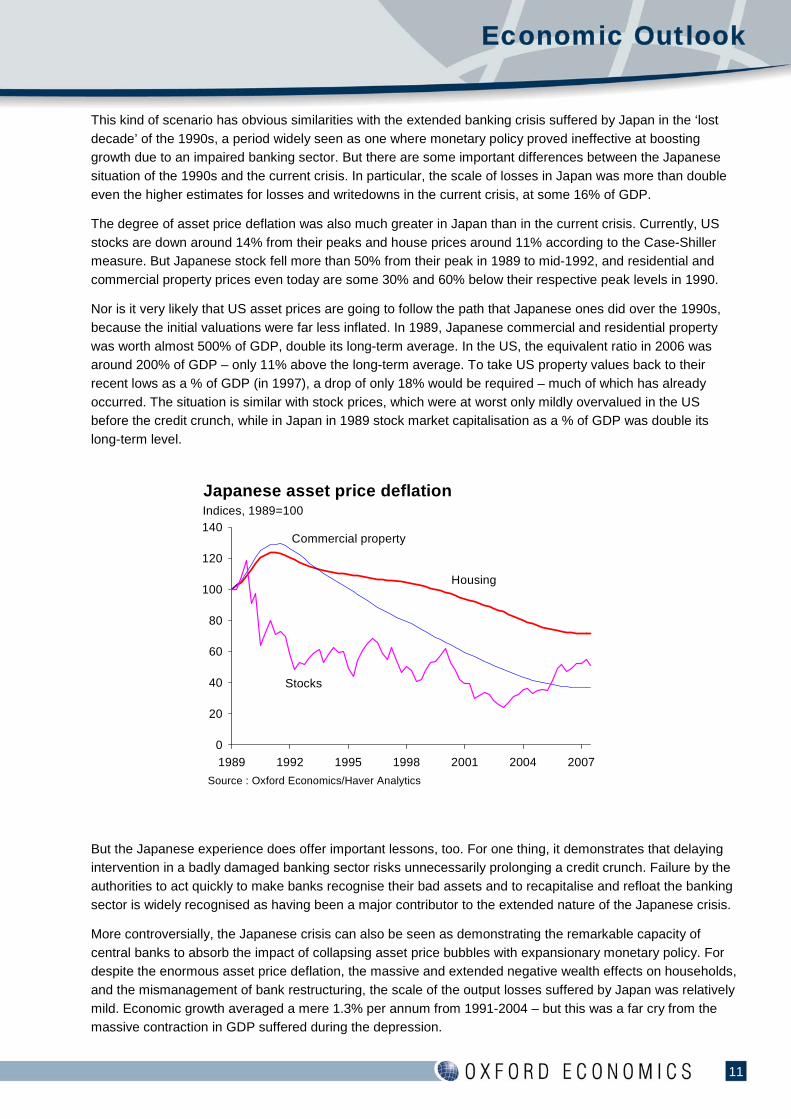
This kind of scenario has obvious similarities with the extended banking crisis suffered by Japan in the ‘lost decade’ of the 1990s, a period widely seen as one where monetary policy proved ineffective at boosting growth due to an impaired banking sector. But there are some important differences between the Japanese situation of the 1990s and the current crisis. In particular, the scale of losses in Japan was more than double even the higher estimates for losses and writedowns in the current crisis, at some 16% of GDP.
The degree of asset price deflation was also much greater in Japan than in the current crisis. Currently, US stocks are down around 14% from their peaks and house prices around 11% according to the Case-Shiller measure. But Japanese stock fell more than 50% from their peak in 1989 to mid-1992, and residential and commercial property prices even today are some 30% and 60% below their respective peak levels in 1990.
Nor is it very likely that US asset prices are going to follow the path that Japanese ones did over the 1990s, because the initial valuations were far less inflated. In 1989, Japanese commercial and residential property was worth almost 500% of GDP, double its long-term average. In the US, the equivalent ratio in 2006 was around 200% of GDP – only 11% above the long-term average. To take US property values back to their recent lows as a % of GDP (in 1997), a drop of only 18% would be required – much of which has already occurred. The situation is similar with stock prices, which were at worst only mildly overvalued in the US before the credit crunch, while in Japan in 1989 stock market capitalisation as a % of GDP was double its long-term level.
But the Japanese experience does offer important lessons, too. For one thing, it demonstrates that delaying intervention in a badly damaged banking sector risks unnecessarily prolonging a credit crunch. Failure by the authorities to act quickly to make banks recognise their bad assets and to recapitalise and refloat the banking sector is widely recognised as having been a major contributor to the extended nature of the Japanese crisis.
More controversially, the Japanese crisis can also be seen as demonstrating the remarkable capacity of central banks to absorb the impact of collapsing asset price bubbles with expansionary monetary policy. For despite the enormous asset price deflation, the massive and extended negative wealth effects on households, and the mismanagement of bank restructuring, the scale of the output losses suffered by Japan was relatively mild. Economic growth averaged a mere 1.3% per annum from 1991-2004 – but this was a far cry from the massive contraction in GDP suffered during the depression.
0
20
40
60
80
100
120
140
1989 1992 1995 1998 2001 2004 2007
Japanese asset price deflationIndices, 1989=100
Source : Oxford Economics/Haver Analytics
Housing
Commercial property
Stocks

12
Economic Outlook
The effectiveness of monetary policy
4. Conclusion – the biggest challenge for monetary policy since the depression?
But while the Japanese experience shows that expansionary monetary policy can contain the impact of collapsing asset price bubbles and a dysfunctional banking sector, it also shows that engineering a quick and sustained recovery is far from straightforward. In part, this reflects the fact that monetary policy inevitably acts with a lag – usually reckoned to be 12-18 months for most of the major economies. But also it appears that while expansionary policy may ameliorate the output effects of burst bubbles (for example by reducing the burden of interest payments on firms and households), actually reversing asset price deflation is much harder, and there tends to be a sustained drag on growth from weak asset prices for some years.
In the case of stock markets, the average US recession has seen about a 30% peak to trough drop in equity prices, with the average time from peak to trough around 18 months and the average period from trough to recovery of the previous peak around 2.5 years. Ominously, this time scale is even more elongated for housing bubbles - the average time for house prices to recover their previous peak in the wake of a burst bubble seems to be more like 7-8 years. The last housing downturn in the US began in October 1989 and prices did not regain their previous peak until January 1998. In the UK, a deeper downturn began in May 1989 with prices also not regaining their earlier level until January 1998.
Indeed, experience suggests that few countries escape a banking crisis and related bursting of asset price bubbles without enduring a recession. Japan actually suffered two – in 1992-1993 and 1997-1998 – and the Nordic countries – especially Sweden – also suffered in the early 1990s despite having arguably handled their crises in a ‘textbook’ fashion. Finally, the most extreme case in recent times was the Asian crisis in 1997-1998, where bank losses were over 30% of GDP and GDP contracted in countries like Thailand, Korea and Indonesia by 7-13% in a single year.
Returning to the major economies of today, it is clear that the banking system has been seriously impaired by large scale losses and writedowns. There is therefore a good case to be made that monetary policy will be less effective than normal in combating the real economy spillovers of recent financial market turbulence. The extent to which policy will be hampered, and for how long, is less clear. Neither the US nor the UK looks like repeating the Japanese experience, as the scale of asset price falls and collateral erosion which occurred in Japan are highly unlikely to be repeated given the very different starting points of asset markets.
But there is a significant risk that malfunctioning credit – and especially mortgage – markets could be with us
80
85
90
95
100
105
110
115
120
125
130
1989 1990 1991 1992 1993 1994 1995 1996 1997 1998 1999
US & UK house prices in the 1990sIndex, May 1989=100
Source : Oxford Economics/Haver Analytics
UK
US

13
Economic Outlook
for some time, and this would imply that one of the most important transmission channels for monetary policy in the UK and US could be blocked. In addition, if home prices are set for prolonged weakness, as historical experience warns is a real risk, it will also be the case that mortgage equity withdrawal – a major support for personal consumption in the US and UK in recent years, will be subdued. As a result, it would appear to be imperative for policy-makers to take steps to try to unfreeze the securitisation markets, and more broadly to act to identify and isolate illiquid and bad assets within the banking sector. Without action on the latter issue, credit supply could be hobbled for some time by continued concerns about counterparty risk and a self-defeating process of balance sheet shrinkage which exacerbates asset price weakness and the erosion of bank capital.
In the absence of a properly functioning credit market, the main impact of looser monetary policy may instead come via the weakening of the exchange rate. But even here, there are limits. The dollar and sterling have both already depreciated strongly against the currencies of their main trading partners, and engineering further depreciation may be difficult – especially for the US where short-term interest rates have already been cut to low levels. There may also be barriers in the form of inflation concerns (justified or otherwise) and political resistance among trading partner countries.
As a result, while we consider that the conditions for a classic ‘liquidity trap’ in which monetary policy becomes ineffective do not exist in the major industrial countries – and are unlikely to emerge – we do consider that monetary policy faces one of its most serious challenges since the end of WWII, and that there is a strong risk that it may be less effective in meeting its goals than in previous crises, including 1998-1999 and 2001-2003. In consequence, it appears highly likely that the next year will see the authorities in the major countries – especially the US – turn to aggressive use of fiscal policy as an additional weapon to fight the downturn if credit conditions do not improve.