Embed Size (px)
Citation preview

E C O L O G I C A L E C O N O M I C S 6 8 ( 2 0 0 8 ) 3 8 1 – 3 9 3
ava i l ab l e a t www.sc i enced i rec t . com
www.e l sev i e r. com/ l oca te /eco l econ
ANALYSIS
Costs of climate changeThe effects of rising temperatures on health andproductivity in GermanyMichael Hübler⁎, Gernot Klepper1, Sonja Peterson2
Kiel Institute for the World Economy, 24100 Kiel, Germany
A R T I C L E I N F O
⁎ Corresponding author. Tel.: +49 431 8814 40E-mail addresses: michael.huebler@ifw-kie
(S. Peterson).1 Tel.: +49 431 8814 485.2 Tel.: +49 431 8814 406.
0921-8009/$ – see front matter © 2008 Elsevidoi:10.1016/j.ecolecon.2008.04.010
A B S T R A C T
Article history:Received 23 October 2007Received in revised form28 February 2008Accepted 13 April 2008
The aim of the study is to quantify climate induced health risks for Germany. Based on highresolution climate scenarios for the period 2071 to 2100 we forecast the number of days withheat load and cold stress. The heat frequency and intensity rise overall but more in thesouth. Referring to empirical studies on heat induced health effects we estimate an averageincrease in the number of heat induced casualties by a factor of more than 3. Heat relatedhospitalization costs increase 6-fold not including the cost of ambulant treatment. Heat alsoreduces the work performance resulting in an estimated output loss of between 0.1% and0.5% of GDP.
© 2008 Elsevier B.V. All rights reserved.
Keywords:Costs of climate changeHealth effectsHeat wavesMortalityHospitalization costsLabor productivity
JEL classification:I10; Q51; Q54
1. Introduction
Climate change is a complex phenomenon that alters thewhole environment in which humans live. Assessing thepotential impacts of climate change onhumanhealth provides
1.l.de (M. Hübler), gernot.kl
er B.V. All rights reserved
already a challenging task. Evaluating these effects in terms ofthe economic cost that these health effects may impose on aneconomy is even more challenging. The range of potentialhealtheffects fromclimate change is quite large encompassingdirect effects such as the impact of heat load on human health
[email protected] (G. Klepper), [email protected]
.

Table 1 – Estimated impacts of the European heat wave in 200332
Place Number of cases of heat mortality Number of hospital emergencyadmissions
Source
Europe 25000 – 35000 Cited in Koppe et al.(2003), compare withKosatsky (2005)
Germany 7000 Zebisch et al. (2005)Baden-Württemberg
1100; 16–24% increase Cited in Koppe et al.(2003)
England 2091; 17% increase, 23% increase among people aged 75 yearsor older, 85% of victims older than 75 years
1% increase among people up to64 years, 6% increase among peopleaged 75 years or older
Johnson et al. (2005)
London 616; 42% increase, 59% increase among people aged 75 orolder
4% increase among people up to64 years, 16% increase among peopleaged 75 or older
Johnson et al. (2005)
France 14800; 16% increase, 80% of victims older than 75 years, 70%mortality increase among people aged 75 to 94 years, 120%mortality increase for people older than 94
EEA (2004), Kosatsky(2005)
Netherlands 650 WHO Europe (2005)Switzerland 975; 6.9% increase WHO Europe (2005)Italy 9704, 92% of victims older than 75 years WHO Europe (2005),
Conti et al. (2005)Portugal 1854; 40% increase, 58% up to 96.6% of victims older than
75 years11.6% increase; 27.2% increase amongpeople aged 75 or older
Calado et al. (2005),Kovats and Jendritzky(2006)
32 For further literature reviews on heat related mortality see Basu and Samet (2002) and Kovats and Jendritzky (2006).
382 E C O L O G I C A L E C O N O M I C S 6 8 ( 2 0 0 8 ) 3 8 1 – 3 9 3
andwell-being but also indirect effects that result fromclimateinduced stormsand floods, tick-borne and food-bornediseasesand allergies causing plants. Since it is difficult to attributefuture economic costs to these indirect impacts, this studyconcentrates on the direct effects of heat load.
In the summer of 2003 thousands of people died inGermany and other European countries due to long periodsof intensive heat. Yet, fatal outcomes are just the peak of avariety of heat related health risks and negative effects forhuman well-being and performance. Table 1 summarizesestimates of the tremendous health impacts of the heat wave2003 — in terms of increased mortality and increasedemergency hospital admissions for different European States.
There is no mono-causal relationship between tempera-ture and detrimental health effects, though. The mostimportant variables influencing the risk of detrimental healtheffects are low as well as high temperatures, humidity, windand short- and long-wave radiant fluxes. Furthermore,different risks such as adverse physical conditions (highblood pressure, heart, kidney, liver or metabolic diseasesetc.) and low physical fitness exacerbate the effects of heatload. The main individual risk, however, is age. Older people(as well as young children) are most susceptible to heat,because weakness and diseases occur increasingly withhigher age while the human adaptation capacity decreases.Therefore it is not surprising that fatalities due to heat loadmostly occur in hospitals and nursing homes.3
Generally, humans are able to adapt to changing climaticconditions via more efficient sweating and improved blood- andfluid-circulation. We call this physiological adaptation. High tem-
3 Calado et al. (2005).
peratures in the first half of a year,when the affected people havenot yet adapted are thus especially dangerous.4 Furthermore,people can adapt their behaviour to climate change, generallyspeaking by living healthier. Action plans can be prepared inhospitals and old people's homes to organize the adaptationmeasures during heat waves. In this context, heat warning sys-tems can help to adapt behaviour on time. They lead to thecategory of technical solutions (financed by public or private in-vestment).Climate relatedbuildingdesignandair-conditioning inbuildings are typical technical solutions. Adaptation possibilitiesare related to people's social status, because poverty reduces thepossibilities for heat protection through technical and structuralmeasures, careandservices. Singleolderpeoplemiss support andsurveillance, and restricted mobility reduces the possibilities to“escape” from high temperatures (see Basu and Samet, 2002).
Against this background, the aim of this study is to quantifyclimate induced health risks for Germany. It addresses scien-tists, decision makers, medical care personnel and the public,providing findings on future health risks, so that appropriatemitigation and adaptation measures can be derived. Thisinterdisciplinary work combining scientific knowledge fromthemeteorological, geographical,medical and economic field isprobably one of the first attempts to systematically quantifyfuture negative health effects of climate change in Germany.The focus is on such effects for which there is at least somequantitative information. For this reason we estimate heatinduced mortality, hospitalization costs and losses in labor productiv-ity. For mortality we also consider the effects of less coldness inwinter. The estimates predict a regionally differentiatedincrease in heat load within Germany and consequently
4 Kalkstein and Davis (1989).

383E C O L O G I C A L E C O N O M I C S 6 8 ( 2 0 0 8 ) 3 8 1 – 3 9 3
substantially higher negative health impacts and productionlosses in some regions. The mortality rise during the summerclearly dominates the possible mortality decrease during thewinter. Formoredetails than presented in this study, seeHüblerand Klepper (2007). Since there are many uncertainties in pastparameter values and unknown future development paths, thestudy is only a first step in this direction. And it has thedrawbacks of a typical partial equilibrium model. The studydoes neither account for future changes in the sectoral patternof the economynor for changes of prices and quantities that arerelevant for assessing future economic impacts. Moreover, itdoes not include future adaptation, which can significantlyreduce the negative effects. The estimations are based on apopulation that is more or less adapted to the present climate.
The paper proceeds as follows. In Section 2 we explainforecasts of the climate model REMO5 based on IPCC scenariosforGermany in theperiod 2071–2100.Using these climatedatawecompute additional days p. a. (per annum) with heat load. InSection 3 we derive approximations of the resulting increase inmortality as an indicator for the futurehealth risk. In Section 4wetry to estimate the economic costs of non-fatal heat risks focus-sing on the costs of hospitalization and the reduction in laboroutput. In both Sections 3 and 4 we apply parameter values fromexisting empirical studies for our estimations. Section 5concludes.
2. Heat scenarios for Germany
Climate change causes worldwide higher temperatures withdifferent regional patterns. To generate heat and coldnessscenarios for Germany in the necessary high spatial resolutionwe use the Regional Climate Model REMO. The model, theunderlying emission scenarios and the resulting forecasts aredescribed in the following subsections.
2.1. Employed climate models and climate scenarios
The Regional Climate Model REMO6 computes climate datawith a high temporal and spatial resolution (10 km times10 km, 121 squares in the horizontal, and 103 in the verticalaxis) for Germany and the surroundings.
Future emission paths depend on the uncertain develop-ment of the world economy. The forecasts therefore use theemission scenarios of the IPCC (2001) that are based ondifferent plausible assumptions on important determinantsfor emissions such as economic activities and economicintegration. Scenario A2 is the business as usual case. Inscenarios A1B and B1 emissions rise till 2050 and then falluntil 2100. While B1 implies rigorous climate protectionmeasures, this study mainly refers to scenario A1B with amedium emissions increase.
5 REMO has been criticized concerning the estimation ofprecipitation (the use of different time scales and deviations ofthe results depending on the spatial resolution). The problem hasbeen explained and corrected (Max-Planck-Institut, 2006), andprecipitation is not the focus of our examination.6 Jacob et al. (2001); REMO is run by the Max Max-Planck
Institute (MPI) for Meteorology in cooperation with DeutschesKlimarechenzentrum (DKRZ), both located in Hamburg.
The climate data computed by REMO are then used asinputs for the so so-called climate “Michel” model developedby the German Weather Service.7 This complete humantemperature exchange model combines data on temperature,humidity, wind speed, radiation, clothing and physical activityof affected persons to calculate the so-called perceivedtemperature for a typical reference person. Perceived tem-perature is ameasure of how temperature affects humanwell-being. For instance, the heat wave in 2003 had such severeeffects in France because humidity was higher than in othercountries like Germany.
For practical applications it is useful to convert theperceived temperature into classes of thermal perception orclasses of thermo-physiological stress according to Jendritzkyet al. (2000). The 6 am and 12 am values of perceivedtemperatures are smoothed by applying half a Gaussian filterover 41 days. The longer agoa value, the lower is itsweight. Thesmoothed values are thenused todefinedynamic limits for theclasses of perceived temperature composed of fixed (2/3weight) and variable (1/3 weight) limits.8 Thismethod imitatesthe human ability to adapt to climatic changes in the short-run. The procedure is also used in the heat warning system ofthe German Weather Service.9
2.2. Heat scenarios
Togenerateheat scenarios for theperiod2071–2100wecalculatethe average number of days p. a. with heat stress from thetemperature data sorted in classes of perceived temperatureaccording to Jendritzky et al. (2000). In the illustrations heatstress encompasses the classes of strong and extreme heatstress, i.e. perceived temperatures of at least 32 °C.
The numbers of additional days with heat stress for theperiod 2071–2100 and for the different IPCC scenarios aregiven by the difference to a reference run for 1971–2000(CTL=control). The reference run uses actually measuredgreenhouse gas concentrations as inputs. The total numberof future hot days results from adding the expected addi-tional number of hot days to the actually observed number ofhot days in the reference period 1971–2100. The followingmap (Fig. 1a) shows the number of days with strong andextremeheat stress for the REMO experiment A1B (2071–2100)minus the number of hot days in the control run CTL (1971–2000) in Germany and the surroundings in 10 km times 10 kmresolution.
All experiments (B1, A1B and A2) forecast a significantincrease in the frequency of days with strong or extreme heatat the end of the 21st century (2071–2100) compared to the endof the 20th century (1971–2000) and result in two to five timesas many hot days. In general, the number of hot days per yearrises from north to south Germany. Note that acclimatisationwill weaken the north–south gradient of heat stress. Experi-ment A1B predicts one additional day with strong or extreme
7 Fanger (1972), Gagge et al. (1986), VDI (1994, 1998), Staiger et al(1997), Jendritzky et al. (1990), Jendritzky et al. (2000). For adescription of risk factors see Havenith (2005).8 Koppe and Jendritzky (2005), Koppe (2005).9 Becker (2005).
.

Fig. 1 –a: Additional number of days with (strong or extreme)heat stress, REMO experiment A1B (2071–2100)minus controlrun CTL (1971–2000) in Germany. b: Additional number ofdays with (strong or extreme) heat stress, REMO experimentB1 (2071–2100) minus control run CTL (1971–2000) inGermany.
10 It is not clear if events of strong cold stress will occur moreoften in the future.11 Since we include light cold stress, the reported total decreaseof cold days becomes relatively high.12 Absolute numbers are written in capital letters, relativenumbers in small letters.
384 E C O L O G I C A L E C O N O M I C S 6 8 ( 2 0 0 8 ) 3 8 1 – 3 9 3
heat at the coast in the north, seven to 15 in the middle ofGermanyand26near theLakeConstanceandinMunich (Fig. 1a).Scenario B1 with lower emissions yields one additional hot dayat the coast and around 18 near the Lake Constance in the south(Fig. 1b). The results of scenario A2 (not shown) are very similarto those of A1B. Accordingly, the regional climatic differenceswill increase in Germany. Figs. 1a and b also reveal the heatisland effect in cities like Hamburg, Berlin and Munich, thatmeans, higher temperatures in densely populated areas com-pared with the surrounding areas.
The comparison of Fig. 1a with 1b clearly shows that asuccessful mitigation of greenhouse gas emissions (assumedin scenario B1) can significantly reduce future heat load.
Additionally, we use temperature time series data for theGerman federal states, forecasted for one city in each state likeFrankfurt/Main for Hessen. Fig. 2 shows for Frankfurt/Main therising trends of heat days p. a. for B1, A1B, A2 and for the baserun CTL. It is again obvious, that a successful emissionsmitigation policy, represented by scenario B1, reduces theoccurrence of heat and consequently the related health risks.
2.3. Coldness scenarios
Climate change will not only increase summer temperaturesand the likelihood of heat waves, but will also lead to higheraverage temperatures during the winter.10
Analogously to theheat forecastweestimate futurecoldstressas the averagenumber of days per yearwith cold stress accordingto the IPCC scenarios B1, A1B and A2 for 2071–2100 and comparethe results with the control run CTL for 1971–2000. We aggregatethe number of days with light, modest, strong and extreme coldstress, i.e. perceived temperatures of 0 °C or lower, since therewere no days with strong and extreme cold stress (perceivedtemperaturesof−26 °Cor lower)andonly fewdayswithmoderatecold stress (from −13 °C to −26 °C) in the past (in CTL).
Obviously, the reduction of cold stress is highest in the north-east ofGermany reachingadecreaseof 30days in scenarioB1 and44days inA1B (Fig. 3) andA2. The reduction in colddays amountsto 10 to 20 days in themiddle of Germany in B1 and up to 25 daysinA1BandA2. Inall scenarios the lowestdecreaseof ca. 2daysperyear is foundat theupperRhinerift in thesouth-west.11Moreover,the reduction of average coldness rises with altitude, which isobvious in the higher German regions and in the Alps.
3. Temperature induced fatalities
In this section we use information on the relationship oftemperature and mortality from the literature and combine itwith the heat and coldness scenarios described before as wellas with statistical population data in order to estimate futureclimate change induced changes in mortality. Section 3.1refers to heat load and Section 3.2 to cold stress.
3.1. Heat induced mortality
Our estimation model refers to McMichael et al. (2002) andrelates heat induced mortality to the predicted additionalnumber of hot days12:
D ¼XK
k
XWw
Tw;k þ T0;w;k� � � Mw
365� dk � dseason � p ð1Þ

Fig. 2 –Additional number of days per yearwith strong or extremeheat stress in Frankfurt/Main (Hessen),moving averages over5 years.
385E C O L O G I C A L E C O N O M I C S 6 8 ( 2 0 0 8 ) 3 8 1 – 3 9 3
D Average total number of heat induced deaths p. a. inGermany 2071–2100 for IPCC scenario A1B
Tw,k Average number of additional days p. a. in 2071–2100in perceived temperature class k in location w
T0,w,k Actually measured average number of days p. a. in1971–2000 in perceived temperature class k inlocation w
Mw Absolute mortality over the whole base year 2005 infederal state w
Fig. 3 –Reduction in the number of days per year with (light,moderate, strong or extreme) cold stress, control run CTL(1971–2000) minus REMO experiment A1B (2071–2100) inGermany.
dk Average relative mortality increase in perceivedtemperature class k
dseason Seasonal mortality adjustmentp Demographic change (age structure and population
size) 2050 relative to 2005 in Germany.
In two different runsw represents first one location for eachfederal state (W=16) and second the 121 times 103 fields, eachwith a size of 10 km times 10 km. The temperature classes k(K=3) are strong (perceived temperatures of at least 32 °C up to38 °C) andextreme (at least 38 °C) aswell asmoderateheat stress(at least 26 °C up to 32 °C), all causing increased mortality.
Tw,k is the average number of additional days p. a. in theprediction period (A1B, 2071–2100) compared to the referenceperiod (CTL, 1971–2000) when the threshold of perceived tem-perature class k is reached in location w. Tw,k is given by theclimate forecast explained in Section 2.2 and can be expressed asfollows,where j ( J=30) is the time index for years in thepredictionor reference period:
Tw;k ¼XJ
j¼1
Tj;w;k� �
=J
24
352071–2100
�XJ
j¼1
Tj;w;k� �
=J
24
351971–2000
ð2Þ
In order to calculate the total number of heat related futurefatalities, in the first run we add T0,w,k, the actually measuredaverage number of days p. a. in the reference period 1971–2000, to the estimated number of hot days. Since pastobservations are not available in 10 km times 10 km resolu-tion, we cannot add T0,w,k, in the second run.
Mw is the absolute number of deaths in general (due to anyreason for death) in the base year 2005 in federal state w.13 In
13 Statistisches Bundesamt (2006a).

Fig. 4 –Number of heat induced deaths p. a. in Germany,2071–2100 (exponential extrapolation for extreme heatstress).
386 E C O L O G I C A L E C O N O M I C S 6 8 ( 2 0 0 8 ) 3 8 1 – 3 9 3
case of 10 km times 10 km squares, Mw is the mean mortalityrate in Germany multiplied by the population size in thesquare.14 Dividing by 365 yields the number of deaths per day.
dk denotes the percentage increase in general mortality Mw
due to heat stress of class k. We use parameter values fromLaschewski and Jendritzky (2002) for the period 1968–1997 inthe federal state of Baden-Württemberg and observationsduring the heat wave 2003 in Baden-Württemberg reported byKoppe et al. (2003) that refer to classes of perceived tempera-tures. Based on Laschewski and Jendritzky (2002) we computethe mortality increase for moderate heat stress amounting toapproximately 6.6%; according to Koppe et al. (2003) themortality increase for strong heat stress is about 9.3%. Forextreme heat stress no suitable information is available.Extrapolation yields an increase of 12.0% (linear extrapolation)and 14.8% (exponential extrapolation), respectively.
Furthermore, we take the seasonal adjustment of generalmortality denoted by dseason into account, because wintermortality is circa 8% higher than the yearly average mortalitywhile summer mortality is about 8% lower.15 The mortalitychange referring to the summer is therefore multiplied by thefactor 0.92.
p is the demographic adjustment coefficient. The numberof people below the age of 75 will decrease by 18% (p(74−)=0.82) until 2050, and the number of people aged 75 years andmore will increase by 95% (p(75+)=1.95) resulting in a decreaseof total German population by 9.3%.16 In accordance with theexperiences of the heatwave in 2003we assume that 80% of allheat stress victims are people aged 75 years andmore (m(75+)=0.8) and carry out sensitivity analyses to control for differentparameter assumptions.17 The following formula captures thedemographic change:
p ¼ m 75þð Þ � p 75þð Þ þ 1�m 75þð Þð Þ � p 74�ð Þ ð3Þ
m(75+) Share of people of age 75 and more among heatfatalities during the heat wave 2003
p(75+) Number of people of age 75 andmore in 2050 relativeto 2005
p(74−) Number of people of age 74 and less in 2050 relativeto 2005.
Since there is a lack of more disaggregated information, weassume that the demographic development is the same acrossall federal states and 10 km times 10 km squares.Moreover, weneglect population movements within Germany (that willmainly take place from the east to the west and to the south ofGermany) as well as international migration.
The calculations result in a substantially increased heatrelated mortality at the end of the 21st century. The first runon federal state level yields on average ca. 16 700 heat induced
14 Data from Landscan (2001).15 Calculation based on Laschewski and Jendritzky (2002).16 Calculation with data from Statistisches Bundesamt (2006a).We use population forecasts for 2050 since the forecasts byStatistisches Bundesamt do not include the period 2051–2100.17 Shares of affected elderly people reported in the literature varybetween 44% (in the USA) and 96.6% (in Portugal); overview inTable 1; EEA (2004), p. 74; Morbidity and Mortality Weekly Reportfor the USA cited in Uphoff and Hauri (2005).
deaths p. a. in the period 2071 to 2100 (using exponentialextrapolation for the class of extreme heat stress) which canbe disaggregated as follows: Today's number of deathsamounts to ca. 4500 (bottom part in Fig. 4). This value is notmeasured but is generated by the model as a reference.Without demographic change the prediction yields about 5200additional heat induced deaths (middle part in Fig. 4). Thejoint effect of a decrease in total population and an almostdoubling number of elderly people creates ca. 7000 additionalpotential heat victims, since the latter effect dominates (upperpart in Fig. 4). This means, the total number of heat inducedfatalities rises by the factor 3.7. Excluding today's number ofheat related deaths from the calculation leads to ca. 9000additional future deaths p. a.
Accordingly, the future health risk increases substantiallywithout appropriate mitigation and adaptation efforts. It isimportant to note that these estimations do not include anyadaptation to climate change and hence overestimate the realeffects. Furthermore, we do not take the so-called “harvestingeffect” into account, meaning that a certain number of sickand elderly people might have died even without heat in thenear future. The heat event accelerates the date of death. As aconsequence the mortality ratio can decrease under itsaverage level after the heat event. Subtracting these casualtieswill in the short-run probably result in an up to 25% reductionof the mortality numbers for Germany. However, Koppe (2005)finds (referring to Baden-Württemberg, 1968–2003) that theextent of the “harvesting effect” differs substantially, beingmuch higher for people younger than 75 years (85.4% formoderate heat load and 50.7% for strong heat load) than forpeople in the age of at least 75 years (17.7% for moderate heatload, only 2.1% for strong heat load).
Furthermore, we carry out sensitivity analyses for theparameters “heat related mortality increase dk” and “share ofelderlypeople amongheat victimsm(75+)”. Both varywith timeandregionanddependontheadaptationstatusandadaptationability of the affected population and can thus not bedetermined exactly. The vertical sensitivity bar on the left

Fig. 5 –Distribution of additional heat induced deaths p. a. per10 km times 10 km sectors in Germany, 2071–2100, A1B(exponential extrapolation for extreme heat stress).
387E C O L O G I C A L E C O N O M I C S 6 8 ( 2 0 0 8 ) 3 8 1 – 3 9 3
hand side shows the range of total outcomes from about11 500 to about 21 500 when dk varies by ±30% in accordancewith the range of findings in the literature. The verticalsensitivity bar on the right hand side of Fig. 4 shows the rangeof total mortality from ca. 13 500 to ca. 19 000 when m(75+) ischanged between 50%and 100%, again referring to the findingsin the literature (see Table 1). In the second run we computeheat induced mortality in 10 km times 10 km resolutionvisualized in Fig. 5. Obviously,most heat fatalitieswill be in theregions with the highest population densities, i.e. in the cities,and the health risk increases fromnorth-east to south-west (inaccordance with Fig. 1a).
Adding up the numbers of all 10 km times 10 km sectorsyields the average additional number of heat related deaths inGermany p. a. amounting to 8500 (compared to almost 9000 inthe first run ignoring the base value of today's observations).18
These results have a similar order of magnitude as studiesfor the UK, Portugal and Australia.19 A test run using thenumber of hot days in the year 2003 as an input indeedreproduces the estimated ca. 7000 heat victims in Germany.
3.2. Coldness induced mortality
While we expect dangerous health impacts in summer, theremight be positive effects in winter due to less coldness. Thereare much less empirical studies on the relationship of healthand coldness and the role of age as a risk factor than for heat.The time lags of low temperature events and health effects are
18 Same demographic adjustment as in the first run. Ignoring thebase value means excluding the lower part in Fig. 4 as well as partof the upper (demographic) part in Fig. 4, because today's basevalue is expanded by the demographic factor, which is included inthe upper part.19 Overview of heat victims prognoses in Kovats and Jendritzky(2006).
much longer than in summer, and the correlation is statisti-cally weaker. The medical causality is different, and it is notevident, whether the health risk steadily increases with lowertemperatures. To get an idea of the effects in winter wenevertheless apply again model Eq. (1), this time in highspatial resolution only (w refers to 10 km times 10 km sectors)with the following new parameters:
Tw,k is now the average reduction of the number of daysp. a. with cold stress in the prediction period (A1B, 2071–2100)compared to the reference period (CTL, 1971–2000). k encom-passes the classes of perceived temperature with light andmoderate cold stress.
T0,w,k, the actually measured average number of days p. a.with cold stress in the reference period 1971–2000, is notavailable in the high resolution and therefore not includedhere.
Mw is the general mean mortality rate of Germany multi-plied by the population size in a 10 km times 10 km square asbefore.20 Dividing by 365 in the formula yields the number ofdeaths per day.
dk is the relative increase in general mortality Mw due tocold stress of class k. Sincewe expect less dayswith cold stressin the future, this mortality increase will occur less frequently.We use again parameter values from Laschewski and Jen-dritzky (2002) that refer to classes of perceived temperature.The value for moderate cold stress is ca. 9.3%. The value forlight cold stress is computed as the average ofmortality from 0to −12 °C amounting to approximately 5.7%.21
General mortality in winter is about 8% higher than theyearly average. Hence, the adjustment coefficient dseason is1.08.
According to Hassi (2005) elderly people are very suscep-tible to cold stress. Thus, it appears plausible to apply thesame demographic adjustment factor p as for heat loadmaking both results comparable.22 80% of the affected peopleare at least 75 years old.
The resulting map (Fig. 6) shows the highest expectedreduction in winter mortality in areas with the highestpopulation densities, i.e. in the cities. Comparing Hamburg,Berlin and Munich reveals higher mortality risk reductions inthe north and north east compared to the south of Germany(in accordance with Fig. 3).
Adding up the numbers of all 10 km times 10 km sectorsyields the average reduction in heat related deaths inGermanyp. a. amounting to ca. 5200 comparedwith 8500p. a. due to heatin summer, assuming the same demographic adjustment (ageeffect). Hence, on average, the dangers of heat dominate thepossible health advantages of milder winters by far, and theuncertainties of the estimations for the winter are higher thanthose of the summer (different to Donaldson et al. 2002 for theUK). Fig. 7 visualizes these results. A calculation without theage effect leads to only ca. 3000 p. a.
A comparison of Figs. 5 and 6 shows that in most parts ofGermany the positive and negative thermal effects roughlybalance each other. While only the north-eastern region with
20 Data from Landscan (2001).21 Laschewski and Jendritzky (2002) eliminate the impact oinfluenza epidemics by smoothing outliers in the mortality data22 Data on England show a higher coldness risk for people agedmore than 75 years than for people in other age groups.
f.

Fig. 6 –Distribution of the reduction in coldness induceddeaths p. a. per 10 km times 10 km sectors in Germany, 2071–2100, A1B.
388 E C O L O G I C A L E C O N O M I C S 6 8 ( 2 0 0 8 ) 3 8 1 – 3 9 3
its mild maritime climate can benefit from a positive neteffect, dangerous heat impacts dominate in the south andsouth-west. This outcome has to be interpreted with cautionthough: A zero or slightly positive net effect in some regionsdoes not mean that there is no need to react. Even thoughthere might be advantages in winter, the harmful impacts insummer can be avoided via feasible adaptation activities.
24 Similar to McMichael et al. (2002) predicting mortality in-creases.25 Absolute numbers are written in capital letters, relativenumbers in small letters.
4. Economic costs of heat
Casualties represent the most extreme danger of heat. Asdescribed in Table 1, the European heat wave in 2003 alsocaused a rise in hospital emergency admissions. This fact isconfirmed by a study for the USA: Semenza et al. (1999) find11% more hospital emergency admissions during the heatwave 1995 in Chicago in general and 35% more admissions inthe age group 65 years andmore.23 Nevertheless, the empiricalevidence is much weaker than for heat related mortality.Moreover, heat can negatively affect well-beingmaking us feeluncomfortable and exhausted and entails difficulties toconcentrate. These aspects are hard to quantify, but becomeevident when doing physical or mental work.
Estimating the economic costs of the different effects ofheat entails a number of methodological problems. The mainproblem is that the temperature scenarios are for the timeperiod 2071 to 2100, while it is not possible to obtain resilientforecasts of the development of the German society andeconomy over the next 100 years. We thus assess the costs ofheat referring to the current gross national income, to thecurrent sectoral structure, to current prices and to today's
23 Also see Schwartz et al. (2004).
(medical and general) technologies. There is also a lack ofhospitalization data referring to perceived temperatures.Again, we neglect any kind of adaptation to climate change.
In Section 4.1 we use the indicator “hospital emergencyadmissions” to get an idea of the costs associated with seriousillnesses. In Section 4.2 we obtain rough estimates of theeffects of heat on labor productivity. We abstain from amonetary valuation of the fatalities estimated in Section 3.1.
4.1. Heat induced hospitalization costs
Since there is no suitable information onmedical treatment inpractices and the related costs of treatment and medication,our estimation refers to statistics on the influence of heat onhospital emergency admissions and hospitalization costs.Moreover, it is difficult to identify the quantitative influenceof temperature on specific diseases and the costs directlyrelated to those diseases.
The projection of hospitalization costs is based on theestimation of additional heat days for the 16 reference placesin different federal states for the IPCC scenario A1B in 2071 to2100. The estimation model24 is similar to formula (1)25:
H ¼XK
k
XWw
Tw;k þ T0;w;k� � � SW
365� Kw � hp
k ð4Þ
H Average total hospitalization costs p. a. in Germanyin the prediction period 2071–2100 for IPCC scenarioA1B
Tw,k Average number of additional days p. a. in theprediction period in perceived temperature class kin location (federal state) w
T0,w,k Actually measured average number of days p. a. inthe reference period 1971–2000 in perceived tem-perature class k in location w
Sw Absolute number of new patients over the wholebase year 2004 in federal state w
Kw General hospitalization costs per case in federal statew
hkp Average relative increase in the number of hospitalemergency admissions in perceived temperature classk, the demographic change p (age structure and popula-tion size) 2050 relative to 2005 in Germany is included.
Tw,k and T0,w,k are given by the climate data as before.Sw denotes the base number of new patients over thewhole
base year 2004 in federal state w and Kw the related averagemedical treatment costs per case of medical treatment.26
hkp is the average relative increase in the number of hospitalemergency admissions in the classes of moderate, strong andextreme heat load including the demographic development. Thereis no information available on the relationship of perceivedtemperature and emergency cases in Germany. Thus, we apply
26 Statistisches Bundesamt (2004a), Statistisches Bundesamt(2004b).

Fig. 7 –Comparison of the increase in heat related deaths and the reduction in coldness related deaths p. a. in Germany, 2071–2100, A1B, both computed in 10 km times 10 km resolution without base observations from the past.
389E C O L O G I C A L E C O N O M I C S 6 8 ( 2 0 0 8 ) 3 8 1 – 3 9 3
parameter values in absolute temperatures from a study forEngland during the heat wave 2003. In this statistical analysisJohnson et al. (2005) find a 1% rise inhospital emergency admissionsin the age group up to 64 years and a 6% increase for people aged75 years andmore atmaximal temperatures in the range of about 25to 31 °C.27 According to Johnson et al. (2005) hospital emergencyadmissions decrease by 4% in the age group 65 to 74 years. Thesevalues are applied to the class ofmoderate heat load referring to thetemperature range during the heatwave 2003 in England. In Londonmaximumtemperaturesduring theheatwave2003were in therangeof 35 to 38 °C. Thus, we apply the following numbers to the class ofstrong heat stress: A 4% increase of hospital admissions in the ageclass up to 64 years, a 5%decrease in the age group 65 to 74 years anda 16% rise among people aged 75 and older. Due to a lack ofinformation on extreme heat stress we compute the related hospitaladmission changes via (linear and exponential) extrapolation.
The relative mean change hkp can then be expressed in thefollowing way:
hpk ¼ share 64�ð Þ � p 64�ð Þ � hk 64�ð Þ þ share 65� 74ð Þ
� p 65� 74ð Þ � hk 65� 74ð Þ þ share 75þð Þ � p 75þð Þ� hk 75þð Þ
ð5Þ
Where share(.) is the share of people in the age group inparentheses among the people who left hospital in thereference year 2004.28
p(.) denotes the size of the age group in parentheses in 2050relative to 2004.29 This includes the change of the wholepopulation size. We assume that the demographic develop-ment is the same across all federal states.
hk (.) are the parameter values for the classes k of moderate,strongandextremeheat stress and theage groups inparenthesesderived from England and London as described above.
Amethodologically precise calculation requires the follow-ing consideration: Hospitalization costs in the reference year
27 Also see Kovats et al. (2004).28 Statistisches Bundesamt (2006b).29 Statistisches Bundesamt (2006a).
2004 already include heat induced costs. So, before calculatingthe future heat related cost increase, today's heat inducedcosts need to be subtracted:
H0 ¼ hpk � Sw � Kw �H0ð ÞfH0 ¼ hp
k
1þ hpk
� Sw � Kw: ð6Þ
H0 denotes heat related hospitalization costs in thereference year. Thus, total reference year hospitalizationcosts net of heat effects become slightly smaller than before,because we diminish base costs Sw.Kw by H0:
H ¼XK
k
XWw
Tw;k þ T0;w;k� � � SW � Kw �H0
365� hp
k: ð7Þ
The result shown in Fig. 8 indicates average hospitalizationcosts of about 495million€ per year in the period 2071 to 2100.This corresponds to an increase by a factor 6 compared to theclimatic reference period 1971 to 2000. On the other hand, thisnumber represents only 0.88% of total German hospitalizationcosts (for all kinds of diseases) and 0.27% of German healthcare expenses. Fig. 8 shows that more frequent and moreintensive heat directly causes costs of ca. 222 million €(middle part), while the demographic change (age effect)contributes 191 million € (upper part). The base value of82 million € (lower part) was not measured in the past but isgenerated by the model.
The reaction of emergency cases to heat hkp is a crucialparameter. Hence, we carry out a sensitivity analysis varyingthe impact of heat on emergency cases by ±30% according tothe magnitudes found in the literature. This yields totalhospitalization costs in the range of 300 to 700 million € p. a.,represented by the vertical bar in Fig. 8.
4.2. Heat induced production loss
A number of studies investigate work performance or mentalandmechanical abilities under different thermal environmentsand find evidence for strong negative effects of temperatures
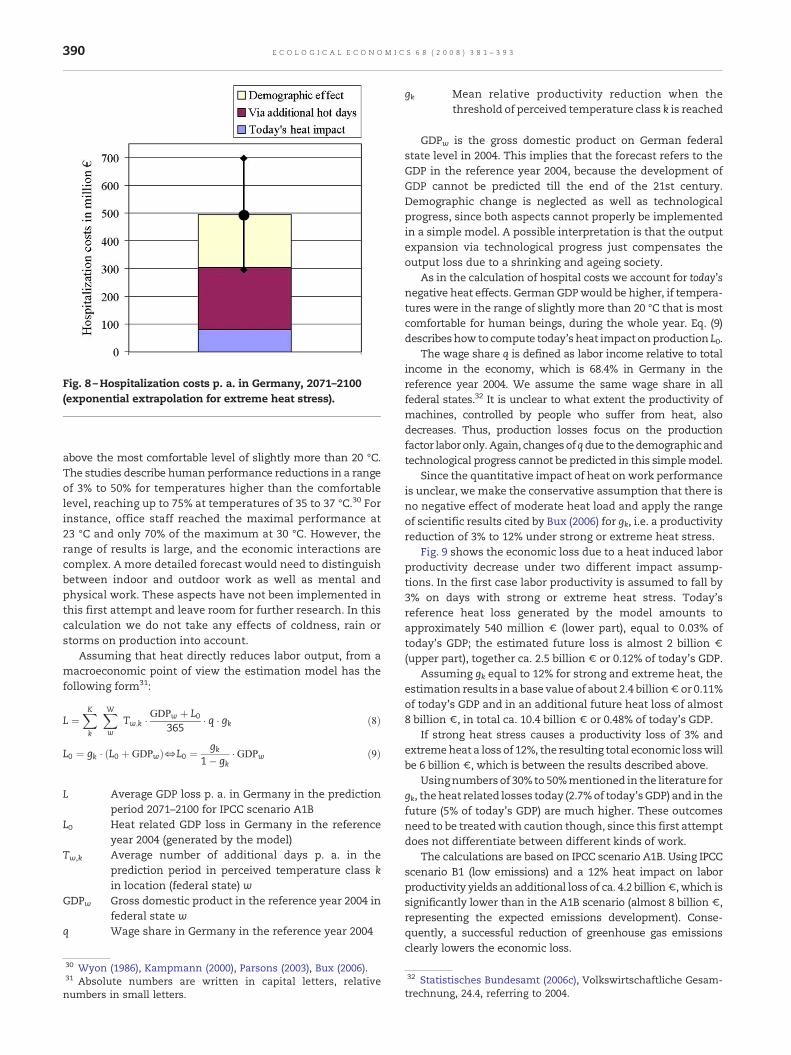
Fig. 8 –Hospitalization costs p. a. in Germany, 2071–2100(exponential extrapolation for extreme heat stress).
390 E C O L O G I C A L E C O N O M I C S 6 8 ( 2 0 0 8 ) 3 8 1 – 3 9 3
above the most comfortable level of slightly more than 20 °C.The studies describe human performance reductions in a rangeof 3% to 50% for temperatures higher than the comfortablelevel, reaching up to 75% at temperatures of 35 to 37 °C.30 Forinstance, office staff reached the maximal performance at23 °C and only 70% of the maximum at 30 °C. However, therange of results is large, and the economic interactions arecomplex. A more detailed forecast would need to distinguishbetween indoor and outdoor work as well as mental andphysical work. These aspects have not been implemented inthis first attempt and leave room for further research. In thiscalculation we do not take any effects of coldness, rain orstorms on production into account.
Assuming that heat directly reduces labor output, from amacroeconomic point of view the estimation model has thefollowing form31:
L ¼XK
k
XWw
Tw;k �GDPw þ L0
365� q � gk ð8Þ
L0 ¼ gk � L0 þ GDPwð ÞfL0 ¼ gk1� gk
� GDPw ð9Þ
L Average GDP loss p. a. in Germany in the predictionperiod 2071–2100 for IPCC scenario A1B
L0 Heat related GDP loss in Germany in the referenceyear 2004 (generated by the model)
Tw,k Average number of additional days p. a. in theprediction period in perceived temperature class kin location (federal state) w
GDPw Gross domestic product in the reference year 2004 infederal state w
q Wage share in Germany in the reference year 2004
30 Wyon (1986), Kampmann (2000), Parsons (2003), Bux (2006).31 Absolute numbers are written in capital letters, relativenumbers in small letters.
gk Mean relative productivity reduction when thethreshold of perceived temperature class k is reached
GDPw is the gross domestic product on German federalstate level in 2004. This implies that the forecast refers to theGDP in the reference year 2004, because the development ofGDP cannot be predicted till the end of the 21st century.Demographic change is neglected as well as technologicalprogress, since both aspects cannot properly be implementedin a simple model. A possible interpretation is that the outputexpansion via technological progress just compensates theoutput loss due to a shrinking and ageing society.
As in the calculation of hospital costs we account for today'snegative heat effects. GermanGDPwould be higher, if tempera-tures were in the range of slightly more than 20 °C that is mostcomfortable for human beings, during the whole year. Eq. (9)describeshow to compute today's heat impact on production L0.
The wage share q is defined as labor income relative to totalincome in the economy, which is 68.4% in Germany in thereference year 2004. We assume the same wage share in allfederal states.32 It is unclear to what extent the productivity ofmachines, controlled by people who suffer from heat, alsodecreases. Thus, production losses focus on the productionfactor laboronly. Again, changesofqdue to thedemographic andtechnological progress cannot be predicted in this simplemodel.
Since the quantitative impact of heat on work performanceis unclear, we make the conservative assumption that there isno negative effect of moderate heat load and apply the rangeof scientific results cited by Bux (2006) for gk, i.e. a productivityreduction of 3% to 12% under strong or extreme heat stress.
Fig. 9 shows the economic loss due to a heat induced laborproductivity decrease under two different impact assump-tions. In the first case labor productivity is assumed to fall by3% on days with strong or extreme heat stress. Today'sreference heat loss generated by the model amounts toapproximately 540 million € (lower part), equal to 0.03% oftoday's GDP; the estimated future loss is almost 2 billion €(upper part), together ca. 2.5 billion € or 0.12% of today's GDP.
Assuming gk equal to 12% for strong and extreme heat, theestimation results in a base value of about 2.4 billion€ or 0.11%of today's GDP and in an additional future heat loss of almost8 billion €, in total ca. 10.4 billion € or 0.48% of today's GDP.
If strong heat stress causes a productivity loss of 3% andextremeheat a loss of 12%, the resulting total economic losswillbe 6 billion €, which is between the results described above.
Usingnumbers of 30% to 50%mentioned in the literature forgk, theheat related losses today (2.7%of today'sGDP) and in thefuture (5% of today's GDP) are much higher. These outcomesneed to be treatedwith caution though, since this first attemptdoes not differentiate between different kinds of work.
The calculations are based on IPCC scenario A1B. Using IPCCscenario B1 (low emissions) and a 12% heat impact on laborproductivity yields an additional loss of ca. 4.2 billion€, which issignificantly lower than in the A1B scenario (almost 8 billion €,representing the expected emissions development). Conse-quently, a successful reduction of greenhouse gas emissionsclearly lowers the economic loss.
32 Statistisches Bundesamt (2006c), Volkswirtschaftliche Gesam-trechnung, 24.4, referring to 2004.

Fig. 9 –Heat related production loss in Germany p. a., 2071–2100 under two different impact assumptions.
391E C O L O G I C A L E C O N O M I C S 6 8 ( 2 0 0 8 ) 3 8 1 – 3 9 3
Fig. 10 illustrates the different magnitudes of average percapita income losses across the German federal states.33 Thesouthern states Bavaria (Bayern) and Baden-Württemberg notonly face the most severe heat load, but also have the highesttotal GDPs and high per capita incomes. Consequently, the percapita income losses reach around 50€ per person and year inBavaria and Baden-Württemberg, while the mean incomereductions in Schleswig–Holstein and Mecklenburg WesternPomerania (Mecklenburg–Vorpommern) amount to ca. 5€ p. a.and person only. Although the heat load is rather low in thenorthern cities Hamburg and Bremen, their estimated percapita income losses are about the German average loss of ca.24 € p. a., because the per capita incomes in these northerncities are relatively high.
The results have a similar magnitude as cost estimates ofaround 10 billion € for Europe for the heat summer 2003.34
Nevertheless, so far the economic impacts of heat waves havenot been evident in countries' growth rates.35 According to ourresults, heat already has a high negative influence on theGerman economy today which will substantially sharpen inthe future. Themain caveat is that we do not take into accountwho is affected by heat towhat extent andwho is not, and thatsuch a disaggregated view is hard to predict for the end of the21st century. Maybe most people will work in air conditionedenvironments, and machines will do any physical work, sothat heat will have little influence on labor output.
33 Population data for 2004 from Statistisches Bundesamt (2005),Bevölkerungsfortschreibung; graphic based on a map of Germanyfrom Universität Trier (2007).34 Michael Heise, chief economist of the Allianz Group, cited inWelt am Sonntag (23.07.2006), this number includes othereconomic effects of heat besides health impacts.35 Michael Heise and Claudia Kemfert, cited in Welt am Sonntag(23.07.2006).
5. Conclusion
Climate change will lead to a number of detrimental healthimpacts. In this study we focus on the effect of heat load onhuman well-being. The study is based on high resolutioncomputations of climate data for the period 2071 to 2100 inGermany referring to IPCC scenarios. We calculate the changein the number of days with thermal stress. For this purpose,we apply perceived temperatures including humidity, windand radiation, which better describe the heat subjectively feltby human beings than normal absolute temperatures. Theresults are then used to derive rough estimates of heat relatedhealth problems: the potential change in mortality, thepotential costs of hospital emergency admissions, and themacroeconomic costs of a reduced work performance.
Heat induced mortality is examined as an indicator for thefuture health risk, since in contrast to particular heat relateddiseases sufficient statistical information on mortality is avail-able.We expect an increase of heat related casualties by a factorof 3.7 at the end of the century compared with today. Thisincrease is partly due to the rising share of elderly people whoare known to suffermost from heat waves. The negative effectsof heat waves, mainly in the south of Germany, dominate thereduction in the number of casualties because of milder winterperiodsby far.Wedonot take into account thata certainnumberof sick and elderly peoplemight have died even without heat inthe near future. Subtracting these casualties can possibly reducethe mortality numbers by up to 25% (in the short-run).
The majority of negative health effects will not lead todeaths but may require medical assistance. Due to a lack of
Fig. 10 –Heat related income losses p. a. and per capita, 2071–2100 across German federal states in 2004-€.

392 E C O L O G I C A L E C O N O M I C S 6 8 ( 2 0 0 8 ) 3 8 1 – 3 9 3
data we concentrate on heat induced hospital admissions. Wefind future hospitalization costs of 300 to 700million€ p. a. forGermany at today's prices, i.e. a 6-fold cost increase.
Finally, we look at the labor productivity of people underfuture heat load. A rough calculation yields a reduction ofGerman GDP by 0.1 to 0.5%, i.e. a loss 4 times larger than attoday's climate. These costs are significantly higher than theestimated hospitalization costs.
This study represents a first attempt to quantify the effects ofclimate change on health in Germany. The focus on directtemperature related effects was determined both by the size ofthe project andby the lack of conclusive results from thedifferentdisciplines concerned with the quantitative assessment ofclimate related health risks. The underlying empirical evidencefor heat related hospital admissions and for thermal impacts onwork performance shows a large variance. The results couldbecomemore robust if a larger research project brought togetherfurther interdisciplinary expert knowledge. A more detailedanalysis of the working conditions in different sectors wouldenhance thequalityof theestimates. Furthermore,more researchisnecessary to quantify the influenceof climate changeonhealthand productivity during the cold period of the year.
These estimates are all performed without consideringphysiological adaptation of the population andwithout includingadaptation strategies in order to illustrate the size of the problemand becausewe did lack information on adaptation costs. Takingadaptation into account would change the numerical results andthe appearance of the presented figures. One of the challengingtasks would be to assess different adaptation options and therelated costs.While physiological and behavioural adaptation arehard to quantify inmonetary terms, the cost of private and publicadaptation measures (such as building design and urban plan-ning) couldbeestimated. Thesimulationsbasedondifferent IPCCscenarios also show that the health impacts can differ substan-tially depending on the emission path of greenhouse gases, thusindicating the benefits of mitigating climate change can besubstantial. An analysis of the benefits of mitigation comparedwith the costs of adaptationwould constitute a fruitful extensionof the research that is presented here.
Acknowledgements
We thank the Umweltbundesamt for the REMO data,Deutscher Wetterdienst for providing the climate “Michel”model, Wolfram Mauser for contributing geographicalpopulation data and WWF Germany for initiating andsupporting the project. Special thanks to Birger Tinz forcomputing and documenting the climate forecasts and forhis competent help. We also thank Gerd Jendritzky and theanonymous referees for very helpful comments.
R E F E R E N C E S
Basu, R., Samet, J.M., 2002. Relationship between ambienttemperature and mortality: a review of the epidemiologicevidence. Epidemiologic Reviews 24 (2).
Becker, P., 2005.DasHitzewarnsystemdesDeutschenWetterdienstes:Notfallvorsorge. Zeitschrift für Katastrophen-management undHumanitäre Hilfe 22–23.
Bux, K., 2006. Klima am Arbeitsplatz — Standarbeitswissenschaftlicher Erkenntnisse — Bedarfsanalyse fürweitere Forschungen. Bundesamt für Arbeitsschutz undArbeitsmedizin, Dortmund, Forschung Projekt F 1987.
Calado, R.M.D., da Silveira Botelho, J., Catarino, J. and Carreiro, M.,2005. Health Impacts of the 2003 Heat-Wave in France. In: W.Kirch, B. Menne and R. Bertollini, Extreme Weather Events andPublic Health Responses. WHO Europe, EU Kommission, EEA,EUPHA, Springer Berlin Heidelberg New York; 89–97.
Conti, S., Meli, P., Minelli, G., Solimini, R., Toccaceli, V., Vichi, M.,Beltrano, M.C. and Perini, L., 2005. Epidemiologic Study ofMortality During Summer 2003 in Italian Regional Capitals:Results of a Rapid Survey. In: W. Kirch, B. Menne and R.Bertollini, Extreme Weather Events and Public HealthResponses. WHO Europe, EU Kommission, EEA, EUPHA,Springer Berlin Heidelberg New York; 109–120.
Donaldson, G., Kovats, R.S., Keatinge, W.R., McMichael, A.J., 2002.Heat- and cold-related mortality and morbidity and climatechange. Health Effects of Climate Change in the UK. Departmentof Health.
EEA, European Environment Agency, 2004. Impacts of Europe'schanging climate — An indicator-based assessment. EEA.Report No 2/2004.
Fanger, P.O., 1972. Thermal Comfort. Analysis and Applications inEnvironmental Analysis. McGraw-Hill, New York.
Gagge, A.P., Fobelets, A.P., Berglund, P.E., 1986. A standardpredictive indexofhumanresponse to the thermal environment.ASHRAE transactions 92, 709–731.
Hassi, J., 2005. Cold Extremes and Impacts on Health. In: W. Kirch,B. Menne, and R. Bertollini, ExtremeWeather Events and PublicHealth Responses. WHO Europe, EU Kommission, EEA, EUPHA,Springer Berlin Heidelberg New York; 59–67.
Havenith, G., 2005. Temperature Regulation, Heat Balance andClimatic Stress. In: W. Kirch, B. Menne, and R. Bertollini,Extreme Weather Events and Public Health Responses. WHOEurope, EUKommission, EEA, EUPHA, Springer BerlinHeidelbergNew York; 69–80.
Hübler, M., Klepper, G., 2007. Kosten des Klimawandels: DieWirkungsteigenderTemperaturenaufGesundheitundLeistungsfähigkeit.Eine Studie für WWF Deutschland.
IPCC, 2001. Climate change 2001: Synthesis report. Summary forpolicymakers.
Jacob, D., Andrae, U., Elgered, G., Fortelius, C., Graham, P.L., Jackson,S.D., Karstens, U., Koepken, C., Lindau, R., Podzun, R., Rockel, B.,Rubel, F., Sass, H.B., Smith, R.N.D., Van den Hurk, B.J.J.M., Yang,X., 2001. A comprehensive model inter-comparison studyinvestigating the water budget during the BALTEX-PIDCAPperiod. Meteorology and Atmospheric Physics 77, 19–43.
Jendritzky, G., Menz, G., Schirmer, H., Schmidt-Kessen, W., 1990.Methodik der räumlichen Bewertung der thermischenKomponente im Bioklima des Menschen (FortgeschriebenesKlima-Michel-Modell). Beiträge d. Akad. f. Raumforschung undLandesplanung Bd. 114, 7–69.
Jendritzky, G., Staiger, H., Bucher, K., Graetz, A., Laschewski, G.,2000. The perceived temperature: the method of DeutscherWetterdienst for the assessment of cold stress and heat load forthe human body. Internet Workshop on Windchill, April 3–7,2000, Meteorological Service of Canada. Environment Canada.
Johnson, H., Kovats, R.S., McGregor, G., Stedman, J., Gibbs, M.,Walton, H., Cook, L., Black, E., 2005. The impact of the 2003 heatwave on mortality and hospital admissions in England. Healthstatistics Quarterly 25, 6–11.
Kalkstein, L.S., Davis, R.E., 1989. Weather and humanmortality: anevaluation of demographic and interregional responses in theUnitedStates.Annalsof theAssociationofAmericanGeographers79 (1), 44–64.

393E C O L O G I C A L E C O N O M I C S 6 8 ( 2 0 0 8 ) 3 8 1 – 3 9 3
Kampmann, B., 2000. Zur Physiologie der Arbeit inwarmemKlima.Ergebnisse aus Laboruntersuchungen und aus Feldstudien imSteinkohlenbergbau. Habilitationsschrift, BergischeUniversität — Gesamthochschule Wuppertal.
Koppe, C., Jendritzky, G., Pfaff, G., 2003. Die Auswirkungen derHitzewelle 2003 auf die Gesundheit. DWD Klimastatusbericht2003, 152–162.
Koppe, C., Jendritzky, G., 2005. Inclusion of short-term adaptationto thermal stresses in a heat load warning procedure.Meteorologische Zeitschrift 14 (2), 271–278.
Koppe, C., 2005. Gesundheitsrelevante Bewertung von thermischerBelastung unter Berücksichtigung der kurzfristigen Anpassungder Bevölkerung an die lokalenWitterungsverhältnisse. Berichtdes DeutschenWetterdienstes DWD 226, Offenbach.
Kosatsky, T., 2005. The 2003 European heat waves. Eurosurveillance10 (7), 148–149.
Kovats, R.S., Hajat, S., Wilkinson, P., 2004. Contrasting patterns ofmortality and hospital admissions during hot weather andheat waves in Greater London, UK. International Journal ofBiometeorology 61, 893–898.
Kovats, R.S., Jendritzky, G., 2006. Heat-waves and Human Health.In: B. Menne, and K.L. Ebi, Climate Change and AdaptationStrategies for Human Health. WHO Europe, 6397.
Landscan, 2001. Global Population Database. Oak Ridge NationalLaboratory, Oakridge, TN. www.ornl.gov/gist/.
Laschewski, L., Jendritzky, G., 2002. Effects of the thermalenvironment on human health: an investigation of 30 years ofdaily mortality data from SW Germany. Climate Research 21,91–103.
Max-Planck-Institut für Meteorologie, 2006. Stellungnahme desMax-Planck-Instituts für Meteorologie zu den Artikeln vonVolker Mrasek „Peinlicher Fehler im Klimamodell“,Spiegel-online, 13.Oktober 2006, „Prognoseverhagelt“, FinancialTimes, Deutschland, 16. Oktober 2006. http://www.mpimet.mpg.de/fileadmin/grafik/presse/Stellungnahme_LAST_161006.pdf.
McMichael, A.J., Whetton, P., Hennessy, R., Nicholls, N., Hales, S.,Woodward, A., Kjellstrom, T., 2002. Human Health and ClimateChange in Oceania: A Risk Assessment. Commonwealth ofAustralia 2003.
Parsons, K., 2003. Human Thermal Environments — The effects ofhot, moderate and cold environments on human health,comfort and performance, Second Edition. Taylor & Francis.
Schwartz, J., Samet, J.M., Patz, A., 2004. Hospital admissions forheart disease — the effects of temperature and humidity.Epidemiology 15 (6).
Semenza, J.C., McCullough, J.E., Flanders, W.D., McGeehi, M.A.,Lumpkin, J.R., 1999. Excess hospital admissions during the July
1995 heat wave in Chicago. American Journal of PreventiveMedicine 16 (4), 269–277.
Staiger, H., Bucher, K., Jendritzky, G., 1997. Gefühlte Temperatur.Die physiologisch gerechte Bewertung von Wärmebelastungund Kältestress beimAufenthalt im Freien in derMaβzahl GradCelsius. Annalen der Meteorologie 33, 100–107.
Statistisches Bundesamt, 2004a. Kostennachweis der Krankenhäuser,Fachserie 12, Reihe 6.3, 1.1.
Statistisches Bundesamt, 2004b. Gesundheitswesen, Grunddatender Krankenhäuser, Fachserie 12, Reihe 6.1.1, 2.2.2.
Statistisches Bundesamt, 2005. Bevölkerungsfortschreibung,Fachserie 1, Reihe 1.3, 3.2.
Statistisches Bundesamt, 2006a. Genesis online, Ergebnisse der 10.koordinierten Bevölkerungsvorausberechnung (Basis31.12.2001), https://www-genesis.destatis.de/genesis/online/logon.
Statistisches Bundesamt, 2006b. Statistisches Jahrbuch,Gesundheitswesen, 9.1.3.
Statistisches Bundesamt, 2006c. VolkswirtschaftlicheGesamtrechnung, 24.4, 2004.
Universität Trier, 2007. Deutschlandkarte der Hochschulen.Uphoff,H.andHauri,A.M., 2005.Auswirkungeneinerprognostizierten
Klimaänderung auf Belange des Gesundheitsschutzes in Hessen.Hessisches Landesamt für Umwelt und Geologie (HLUG).
VDI, 1994. Umweltmeteorologie. Wechselwirkungen zwischenAtmosphäre und Oberflächen; Berechnung der kurz- undlangwelligen Strahlung. VDI-Richtlinie 3789, Blatt 2.
VDI, 1998. Umweltmeteorologie. Methoden zurhuman-biometeorologischen Bewertung von Klima undLufthygiene für die Stadt- und Regionalplanung. Teil I. Klima,VDI-Richtlinie 3787, Blatt 2.
Welt am Sonntag, 23.07.2006. Schon zehn Gradmehr Hitze senkendie Arbeitsleistung um rund 30 Prozent. Von Jost, S,Wüpper, G.,Struve, A. and Finkenzeller, K.
WHO Europe, 2005. Health and Climate Change: the ‘now andhow’ — A policy action guide. http://www.euro.who.int/document/E87872.pdf.
Wyon, D., 1986. The effects of indoor climate on productivity andperformance — a review. WS and Energy 3, 59–65.
Zebisch, M., Grothmann, T., Schröter, D., Hasse, C., Fritsch, U.,Cramer, W., 2005. Klimawandel inDeutschland—Vulnerabilitätund Anpassungsstrategien klimasensitiver Systeme.Potsdam-Institut für Klimafolgenforschung im Auftrag desUmweltbundesamts. Climate Change (ISSN: 1611-8855),122–136 08/05.