Embed Size (px)
Citation preview

RESEARCH BULLETIN 1110 APRIL 1979
Costs and Financing of Volunteer Emergency Ambulance Services in Rural Ohio
WILLIAM L. MANZ
FREDRICK J. HITZHUSEN
OHIO AGRICULTURAL RESEARCH AND DEVELOPMENT CENTER U.S. 250 and Ohio 83 South
Wooster, Ohio

CONTENTS
*** * *** Introduction _________________________ -- ____ -- __ -- _- _----- --------- 3
Background and Problem ____ - _________ - __ -------------------------- 3
Objectives __________________________ -- _____ --_-------------------- 4
General Conceptua I Model _______________________ - ___ - _ -- _- ___ - _- -- _ 5
Sampling and Data Collection __________ ----------------------- ----- 6
Characteristics of Services Surveyed----------------------------------- 9
Imputed Values for Volunteer Effort ___________________________________ 9
Sources of Financial Support _________________________________________ 10
Statistical Model and Results ________________________________________ 10
Summary and Conclusions __________________________________________ 15
Literature Cited ____________________________ . ______________________ 17
Appendix A-Questionnaire for Cost Study of Emergency Ambulance Services for Calendar Year 1975 ______________________ 18
Appendix B-Am. Sub. H. B. 1173 ____________________________________ 25
AGDEX 886 4-79-2.5M

Costs and Financing of Volunteer Emergency Ambulance Services in Rural Ohio 1
WILLIAM L. MANZ and FREDRICK J. HITZHUSEN2
INTRODUCTION This research focuses on the costs and financing
of 33 volunteer emergency ambulance services in rural Ohio. The general objective of this study is to measure the costs associated with volunteer emergency ambulance services in rural communities and to identify the factors including size or scale related to variation in costs per capita and per ambulance r~n. In addition, the sources used to provide financial support for these services are examined. Such information should be of value to community leaders in planning for or operating volunteer emergency ambulance services.
BACKGROUND AND PROBLEM Historically, emergency ambulance service has
been provided by a great diversity of organizations, such as police and fire departments, volunteer organizations, funeral homes, and commercial ambulance companies (8). Frequently more than one of these organizations has operated in the same community and there has often been a lack of coordination between them. At the other extreme many rural communities have not had an emergency ambulance service ( 9). Even when a rural community h~s had an emergency ambulance service, the serVIce has often been poorly equipped and the personnel inadequately trained.
Although there is a large diversity of organizations providing emergency ambulance service, funeral homes have traditionally been the primary providers of emergency ambulance service in nonmetropolitan communities (3, 5, 8, 9). Funeral directors found emergency ambulance service compatible with their primary business. Additional costs were minimal since the personnel and vehicles were already available. In the mid-1960's, many funeral homes began to find providing emergency ambulance service in-
'This study was the basis for on M.S. thesis by William Manz (1 0) and is the second of a two-part consideration of rural volunteer emergency ambulance services. While this study concentrated on the cost and financing of volunteer emergency ambulance services the first study focused upon response time as a measure of servic~ quality. Both studies are part of a regional research project in the North Central States [NC-123) and were funded under Project 461, Economic Analysis of Selected Community Services in Rural Ohio, in the Dept. of Agricultural Economics and Rural Sociology, Ohio Agricultural Research and Development Center and The Ohio State Uni· versity. Helpful comments were received from Professors leroy Hushak and George Morse.
~Former Graduate Research Associate and Associate Professor, Dept. of Agricultural Economics and Rural Sociology, The Ohio State University and Ohio Agricultural Research and Development Center.
3
creasingly unprofitable due to inflationary pressures; subsequently a few began to discontinue emergency services.
The financial problems of these funeral homes began to compound with the passage of legislation at the state and federal level. The Fair Labor Standards Act of 1966 established new regulations for minimum wages and overtime pay. The effect of this legislation upon funeral homes was to increase the wage costs of providing emergency ambulance service.
With the increasing concern about the quality of emergency ambulance service, the National Highway Safety Act was passed in 1966 in an attempt to improve both the quality and quantity of emergency medical service ( 6). Limited funds were made available by this Act to assist communities in the improvement or establishment of emergency ambulance services.
More recently, the Emergency Medical Service Systems Act of 1972 authorizes appropriations for research, feasibility studies, establishing new operations, and improving existing emergency services ( 4) . As administered by the Dept. of Health, Education and Welfare (HEW), the Emergency Medical Services Systems Act is intended to further the development of emergency medical services begun under the National Highway Safety Act.
Both the National Highway Safety Act of 1966 and the Emergency Medical Services Systems Act of 1972 increased the standards emergency services were required to meet in order to continue providing service. Funeral home operators generally found themselves severely affected by these new standards. Large capital outlays were often required and these new laws frequently increased the operating cost of emergency ambulance service. As a result, many funeral homes found emergency ambulance service no longer profitable, and the number discontinuing emergency ambulance service increased rapidly.
Only recently has empirical evidence been made available on the decline of funeral homes providing emergency ambulance service in rural Ohio communities. An unpublished survey conducted by the Ohio Dept. of Health's Emergency Medical Service m 1972 found 203 funeral homes providing emergency ambulance service in Ohio's rural counties ( 11). A subsequent survey in 1976 found only 69 funeral homes still providing emergency ambulance

service ( 11 ) . This represents a 66% decline in the number of funeral homes providing emergency ambulance service between 1972 and 1976 in rural Ohio counties.
This decline in the number of funeral homes providing emergency ambulance service has left many rural communities without emergency ambulance protection. At the same time, there is evidence that the need for emergency ambulance service in rural communities will continue and probably grow, particularly in those counties experiencing a population turnaround.
One evidence of need for emergency ambulance service is the fatality rate from traffic accidents in rural areas. A study conducted by the California Dept. of Health and Highway Patrol found that traffic accidents in rural areas resulted in one and onehalf times as many injured people per 1,000 population as in urban counties ( 14). In addition, it was discovered that persons injured in rural counties were almost four times as likely to die of their injuries a~ those in urban counties. There is also evidence that a portion of the fatalities in rural accidents died of survivable injuries, i.e., if they had received help in time they would have survived ( 15). A Vermont study found that out of 164 highway fatalities, 23% died of survivable injuries ( 13). Another study found that 25% of permanent disabilities suffered by 166,000 annual traffic victims could have been prevented if adequate care had been received in time ( 5) .
There has been a substantial increase in the number of recreational facilities in rural areas during recent years ( 15). These recreational facilities have become havens for urban residents ( 15). This means increased travel by urban residents in rural areas. One study in the mid-1960's found that 32% of the fatalities in rural counties involved urban residents ( 14) .
Community leaders in communities which no longer have an emergency ambulance service must now face the problem of how to provide an emergency ambulance service that is ready to respond 24 hours a day ( 2, 12). These leaders must often work with limited financial support (2). In addition, other problems must be dealt with such as: sparse and scattered population, longer service times due to the greater distances which must be traveled, and few calls ( 3) . Nevertheless, many rural communities have found alternative methods for providing emergency ambulance service.
One method of growing popularity in rural communities is to use volunteer labor to provide emergency ambulance service ( 15). Until recently there were no data to document this shift toward a greater reliance upon volunteers for providing emergency
4
ambulance service. However, with the recent completion of the Ohio Dept. of Health's inventory of emergency ambulance services, statewide data now exist.
During the period from 1972 to 1976, the number of volunteer organizations providing emergency ambulance service increased by 22%. In 1972 there were 128 volunteer organizations or 34.2% of the emergency ambulance services in Ohio's rural counties. By 1976 the number had increased to 158 or 57.1% of the emergency ambulance services in Ohio's rural counties.
Reasons that may explain some of the popularity for this alternative are:
• Rural residents may generally be more willing to donate time for the support of community services.
• Rural volunteer fire departments have a history of responding to emergencies and the additional activity of emergency ambulance service is an extension of the service they are already providing ( 12) .
• Many rural communities lack the financial resources to support a fully paid emergency ambulance service ( 3, 15). The cost saving that can be obtained through the use of volunteers may make an emergency service a possibility for a rural community.
OBJECTIVES In order for community leaders to make an in
formed decision when deciding whether or not to provide emergency ambulance service, economic information on the operation of these services must be available. However, the actual costs of volunteer emergency ambulance services arc not generally known. Once the actual costs of volunteer emergency ambulance services have been measured, it may be possible to identify some of the factors influencing costs. It is also important that sources of revenue and support be identified so community leaders have a better understanding of the resources with which they can potentially work. In addition, measuring the sources of support used by volunteer emergency ambulance services and determining their relative importance may provide insight into some of the fiscal mechanisms which exist in rural communities.
The specific objectives of this study are to: 1. Identify and measure annual fixed and vari
able costs per run and per capita for the sample of volunteer emergency ambulance services operating in rural Ohio.
2. Develop cost functions to identify factors related to unit cost variations and to test for

the existence of size "economies" and/ or "diseconomies."
3. Identify and compare the sources of support used to finance volunteer emergency ambulance services in nonmetropolitan Ohio communities.
4. Use three alternative methods to determine a value for the volunteer effort used to operate the sample volunteer emergency ambulance services and compare these values to the non-volunteer costs of the services.
GENERAL CONCEPTUAL MODEL When dealing with the costs of a government
service, such as volunteer emergency ambulance service, a distinction is usually made between agency and social costs (7). Agency costs are considered to be the actual payments made to employ resources for the production of goods and services. Agency costs may be divided into two categories (variable costs and fixed costs) based upon the nature of the resources used in the production process. Variable costs vary with the level of output, and fixed costs exist regardless of the level of output. 8 Agency costs, the actual expenditures of volunteer emergency ambulance services, are the focus of the statistical cost function analysis of this study.
Social costs are the value of all the resources employed in the production process in terms of their best alternative use; i.e., the opportunity costs of the resources employed. The social costs of the volunteer resources employed in the provision of emergency ambulance service are dealt with in a separate analysis.
Cost and quasi-cost functions are used in empirical cost studies to test for the presence of size economies and for diseconomies. Hirsch has suggested that certain factors affect the unit cost of a government service (7). These are: quantity of service output, service quality, input prices, conditions of the service area which influence input requirements, input factors, and state of the technology and productivity. Explicit inclusion or assumptions regarding control of the effect of these factors and precise specification of output in the model provide the basis for an "ideal" cost function. A quasi-cost function utilizes population of the service area as an output proxy and provides an evolutionary link between an ideal cost function which is often difficult to quantify and the quantifiable expenditure per capita function which is theoretically less appealing.
In the cost function model developed for this research, two measures of output are used. The
"The fixed and variable cost distinction is appropriate regarding Individual emergency ambulance units. Capital and operating costs might be more accurate terms for the cross-sectional comparisons.
5
number of annual ambulance runs facilitates an approximation of the ideal cost function defined by Hirsch and the population of the service area results in what Hirsch calls a quasi-cost function ( 7) . Both functions will be referred to as cost functions.
The general cost function model may be ex-pressed in the following form:
Cl-n/01-n = f (01-n, Q, SI-n, x,_n) where: C = cost measures 0 = measures of output Q = output quality measure S = service condition factors X = organizational characteristics
The total costs of volunteer emergency ambulance services are divided into two categories: fixed costs and variable costs. Fixed costs are independent of the output of the emergency service; i.e., fixed coste; do not vary directly with the output of the service. This category includes primarily costs related to the existence of physical facilities. Included in this category are: depreciation of the building and its contents, utilities, telephone, building maintenance and repairs, interest on loans, and insurance. Variable costs of an emergency ambulance service include the costs directly associated with the output of the service. The major components of this category are: vehicle operating costs, vehicle depreciation, depreciation of monitors and rescue equipment, and medical supplies. For the most part, primary data were provided on the costs of volunteer emergency ambulance services by those surveyed. There were a few cases where the costs were estimated from other primary information collected on the sample services.
Each of the categories of total cost and the total cost of the volunteer emergency ambulance service are divided by the measure of service output quantity to provide the unit or average cost of the services.
The service output quantity variables are measures and/ or proxies of service output. The number of annual emergency ambulance runs ( 01) provides a direct measure for service output. The other output quantity variable, the population of the service area (02), acts as a proxy for emergency ambulance service output. The presence of either of the service output quantity variables in the equations permits the testing of the hypothesis that size economies are associated with the operation of volunteer emergency ambulance services.
A quality measure for a public service should ideally provide a basis for the consumer (user) to assess the effectiveness of the service and for the purveyor of the service to judge his effectiveness in delivering

the service to the consumer. For many public services a measure of this type is difficult to define and quantify. Ideally, an index of mortality or morbidity should be used as a measure of emergency ambulance service quality. However, since an index of this type does not yet exist, average travel out time per mile ( Q1) or average total response time ( Q2 ) provide proxy measures by which the consumer and purveyor can assess the quality of service output. This service output quality Yariable is expected to have a negative relationship with the unit costs of volunteer emergency ambulance services.
The service condition variables ( S1-n) reflect various community characteristics which can affect the unit costs of volunteer emergency ambulance services. Generally, the relationship between these variables and unit costs is unclear. For example, if the size of the service area ( sl) acts as a proxy for the distance to the scene of an emergency, the relationship with unit costs would be positive. However, if the size of the service area acts as a proxy for population, while holding population density ( S8 ) constant, the relationship with unit costs would be negative. Likewise, the relationship with unit costs of the percent of the service area population residing in the village where the station is located ( s2) and the percent of the population under 18 ( s4) is unclear.
Various organizational attributes are hypothesized to be important in affecting the unit costs of volunteer emergency ambulance service (X1-n). The factors in this category reflect organizational maturity and either enticements for or actual measures of volunteer support of the emergency ambulance service.
The number of years emergency ambulance service has been provided by the organization (X1 ) is expected to have a negative relationship with the unit costs of volunteer emergency ambulance services. The number of facilities in the squadroom or lounge (X2) is expected to be positively related to the unit costs of the service. The number of active volunteers (X4) acts as a proxy for community involvement in the operation of the emergency ambulance service. With a large number of volunteers, it is more likely that many of the functions or jobs associated with the operation of an ambulance service will be performed by the volunteers and thus a negative relationship is expected to exist with unit costs.
The relationship between the number of annual social events (X8 ) and unit costs is unclear. If X3
acts as a proxy for volunteer motivation, a negative relationship with unit costs is expected to exist. However, if it is assumed that a large number of social events generates a greater level of donations and/ or tax support, a positive relationship is expected to exist.
6
SAMPLING AND DATA COLLECTION This study is the second phase of a two-phase
study of emergency ambulance services in rural Ohio. The same sample selected in the first phase is used in this study for two reasons. First, during the first phase of the study a rapport was established with various community leaders involved in the operation of volunteer emergency ambulance services. This rapport was essential in order to obtain some of the needed information concerning the costs and financing of volunteer emergency ambulance services. Second, since some of the data in the first phase of the study were necessary for this study, any duplication of test instruments was avoided.
Since a new sample was not selected, the procedures used to select the sample in the first phase are summarized ( 1). Volunteer emergency ambulance services in Ohio's rural counties were the population from which the sample was selected. Clark established that a sample size of at least 30 volunteer emergency ambulance services was required in order to pro• vide statistically reliable results ( 1). To obtain the targeted sample size, nonmetropolitan counties were randomly selected, with the exception of Clark's home county, until the desired sample size was obtained. A total of 11 counties were sampled. Of these 11 counties, 8 had a total of 33 volunteer emergency ambulance services operating within them. Three counties had no volunteer emergency ambulance service units ( Figure 1 ) .
Data on the variables specified in the conceptual model, but not available from either secondary sources or the first phase of the study, were collected from the volunteer emergency ambulance services with a mailed survey instrument and telephone follow-up. The data included the components of total operating costs, characteri'1tics of the volunteer emergency ambulance organization, and sources of revenue and support. The questionnaire was pretested to assess it~ weaknesses.
As a result of voluntary returns, telephone followup, and personal contact, 27 of the 33 services in the sample returned the questionnaire, a response level of 82.0%. One of the observations was not usable due to a lack of available information, reducing the sample size to 26 (79.0%). Of the 26 responding, some additional information was collected via telephone follow-up when the questionnaire was incomplete. Information collected in Phase I for the six non-responding services was examined and no unique characteristics were observed. Thus, it was assumed that no bias wa.'> introduced into the sample by the non-responses.

P"ULDING
1 VAN WERT
5
7
PREBLE
6 u
16
TIUJMeULt.
u
Total Services = 810 Minus 12 Urban
Counties = 516
t~:~:~ Counties in Sample
U Urban Counties * SEOEMS System: Athens, Gallia, Hocking, Jackson, Lawrence, Meigs, Vinton counties. Headquarters in Gallia County.
FIG. 1.-Distribution of ambulance services by counties with urbanized populations of less than 150,000-1975.
Source: Ohio Dept. of Health, EMS Division.
7
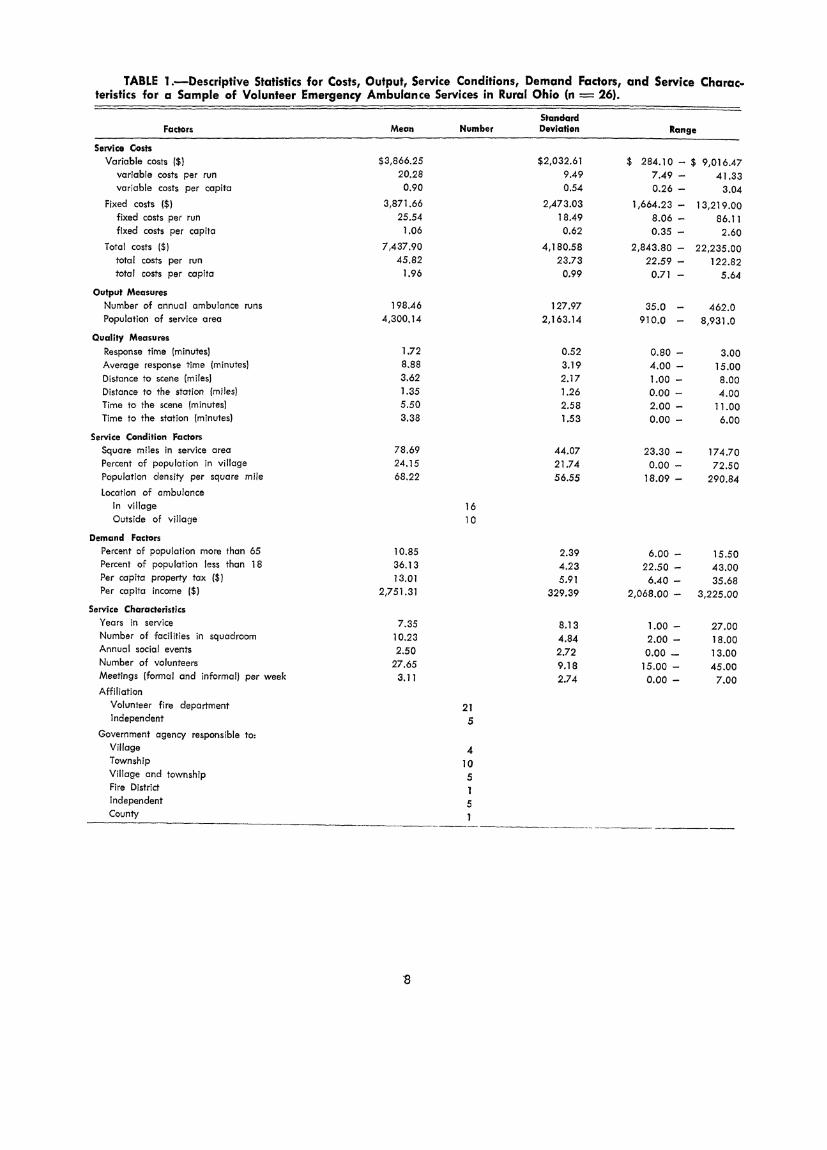
TABLE 1.-Descriptive Statistics for Costs, Output, Service Conditions, Demand Factors, and Service Characteristics for a Sample of Volunteer Emergency Ambulance Services in Rural Ohio (n = 26).
Factors
Service Costs Variable costs ($}
variable costs per run variable costs per capita
Fixed costs ($)
fixed costs per run fixed costs per capita
Total costs ($)
total costs per run total costs per capita
Output Measures Number of annual ambulance runs Population of service area
Quality Measures Response time (minutes) Average response time (minutes) Distance to scene (miles) Distance to the station (miles) Time to the scene (minutes) Time to the station (minutes)
Service Condition Foctors Square miles in service area Percent of population in village Population density per square mile
location of ambulance In village Outside of villaae
Demand Factors Percent of population more than 65 Percent of population less than 18 Per capita property tax ($)
Per capita income ($)
Service Characteristics Years in service Number of facilities in squadroom Annual social events Number of volunteers Meetings (formal and informal) per week
Affiliation Volunteer fire department Independent
Government agency responsible to: Village Township Village and township Fire District Independent County
Meon
$3,866.25 20.28 0.90
3,871.66 25.54
1.06
7,437.90 45.82
1.96
198.46 4,300.14
1.72 8.88 3.62 1.35 5.50 3.38
78.69 24.15 68.22
10.85 36.13 13.01
2,751.31
7.35 10.23 2.50
27.65 3.11
Number
16 10
21 5
4 10 5 1 5
Standard Deviation
$2,032.61 9.49 0.54
2,473.03 18.49 0.62
4,180.58 23.73
0.99
127.97 2,163.14
0.52 3.19 2.17 1.26 2.58 1.53
44.07 21.74 56.55
2.39 4.23 5.91
329.39
8.13 4.84 2.72 9.18 2.74
Range
$ 284.10 - $ 9,016.47 7.49- 41.33 0.26- 3.04
1,664.23 - 13,219.00 8.06- 86.11 0.35 2.60
2,843.80 - 22,235.00 22.59 - 122.82
0.71 5.64
35.0 462.0 910.0 8,931.0
0.80 - 3.00 4.00- 15.00 1.00 - 8.00 0.00- 4.00 2.00- 11.00 0.00- 6.00
23.30 - 174.70 0.00 - 72.50
18.09- 290.84
6.00 - 15.50 22.50 - 43.00 6.40- 35.68
2,068.00 - 3,225.00
1.00- 27.00 2.00- 18.00 0.00- 13.00
15.00 - 45.00 0.00- 7.00
----------~-----~------- ----------

CHARACTERISTICS OF SERVICES SURVEYED Table 1 pre'lents a summary of the major charac
teristics of the 26 volunteer emergency ambulance services surveyed. As mentioned earlier, to be included in the survey the volunteer emergency ambulance services had to be located in a non-SMSA Ohio county. The majority of the services surveyed ( 16) were located in rural villages. Most of the services surveyed ( 19) were either affiliated with township and/ or village governments. The remaining 7 services were either independent organizations, fire districts, or affiliated with a county government. A total of 21 of the volunteer emergency ambulance services surveyed were associated with the local volunteer fire department. Five of the services were independent organizations; i.e., volunteer organizations not affiliated with a local government.
The service areas, i.e., the area covered by the volunteer emergency ambulance services surveyed, generally followed township boundaries. The average size of the service areas was 79 square miles, with a range of 23 to 174 square miles. On average, about 24% of the population lived in the village in which the service was located. There was an average population density of 68 people per square mile, with a range of 18 to 294 people per square mile.
The average service had been in operation for 7.4 years, with a range of 1 year to 27 years of providing emergency ambulance service. The mean number of active volunteers participating in the services surveyed was 28. Generally the volunteers met at the station, either formally or informally, three times per week. The squadrooms or lounges often contained refrigerators, drink coolers, freezers, stoves, televisions, couches, chairs, tables, etc. The facilities at the station varied from just a coffee maker to luxurious lounges. The volunteers and their families held an average of 2.5 social events per year.
Considerable variation was found to exist in the two output variables. First, the mean number of annual ambulance runs for the 26 volunteer emergency ambulance services surveyed was 198.5, with a range of 35 to 462 ambulance runs per year. The average response time for the surveyed services was 8.99 minutes, with a range of 4 minutes to 15 minutes. This includes the delay time (the elapsed time from when the call was received until the ambulance leaves the station) and the travel out time (the time it takes for the ambulance to travel from the station to the scene of the emergency). Delay time averaged 3.4 minutes for the 26 services surveyed. Travel out time averaged 5.5 minutes. The mean average distance to the scene of the emergency was 3.6 miles, with a range of 1 to 8 miles.
9
The population of the service area averaged 4,300 people and ranged from 910 to 8,900 people. The service area population more than 65 years old averaged 10.9% and ranged from 6% to 15.5%, The service area population less than 18 years old averaged 36.1% and ranged from 22.5% to 43.0%. The per capita property tax of the service areas ranged from $6.40 to $35.68 and averaged $13.01.
Large variation was found to exist in the cost measures of volunteer emergency ambulance services. The total costs of the 26 volunteer emergency ambulance services averaged $7,437.90 per year, and ranged from $2,843 to $22,235 per year. The mean values for total cost per run and total cost per capita were $45.82 and $1.96, respectively. Total cost per run ranged from $23.21 to $122.82, while total cost per capita ranged from $0.71 to $5.64. The total costs of the 26 volunteer emergency ambulance services were divided into variable and fixed costs.
Variable operating costs, on the average, made up 48.0% of the 26 volunteer emergency ambulance services' total costs. Variable costs ranged from $284.10 to $9,016.47 and averaged $3,566.25. On a per hour basis, variable costs averaged $20.28, while per capita variable costs averaged $0.90. Variable costs per run and per capita ranged from $7.40 to $41.83 and $0.26 to $3.04, respectively.
The fixed costs of the 26 volunteer emergency ambulance services averaged 52.0% of total costs. Fixed costs ranged from $2,843.80 to $13,219.00, and averaged $3,871.66 per year. The mean values for fixed costs per run and fixed costs per capita were $25.54 and $1.06, respectively. Fixed costs per run ranged from $8.06 to $86.11 per year, while fixed costs per capita ranged from $0.35 to $2.60 per year.
IMPUTED VALUES FOR VOLUNTEER EFFORT Three methods were utilized to impute values
for the volunteer effort used to provide emergency ambulance service. The first two methods estimated what it would cost to replace the volunteers with fulltime paid personnel. The third method estimated what it would cost to compensate the volunteers for the runs they actually make.
The first method utilized to impute a value for volunteer effort was based upon a ratio of the number of volunteers (three) equivalent to one full-time paid personnel. According to this method, it would cost an average of $85,785 per year to replace the volunteers with full-time paid personnel. This would result in a 13-fold average increase in total cost of providing emergency ambulance service.
The second method utilized to impute a value for volunteer effort was based upon the minimum number of full-time paid personnel (5.7) required to staff

an ambulance. According to this method, it would cost an average of $71,631 per year to replace the volunteers with full~time paid personnel. This represents an increase of almost 11 times in the mean total cost of providing emergency ambulance service.
The third method utilized to impute a value for volunteer effort determined what it would cost to compensate the volunteers for their time in making emergency ambulance runs. On the average, it would cost $2,875 per year (assuming an average of three volunteers per run) to compensate the volunteers for their time. This would be an increase of 39.0% in the average total cost of providing emergency ambulance service.
The value of volunteer effort, as determined by the third method, was divided by the tax effort of the service area to determine its potential effect upon the federal revenue sharing funds received by rural communities. On the average, the value of volunteer effort is 4.8% of the service area's tax effort; i.e., if this value was included in the tax effort com., ponent of federal revenue sharing, the allocation would increase by approximately 5%.4 This amount ranges from 0.4% to 14.7% for the emergency ambulance services surveyed.
SOURCES OF FINANCIAL SUPPORT The alternative sources of support utilized to
finance the surveyed volunteer emergency ambulance services were identified. The sources of support commonly used by the services were divided into the following categories: non-tax sources of support, tax revenues, and intergovernmental sources of revenue.
Non-tax sources of support were the primary source of revenue for the 26 volunteer emergency ambulance services surveyed. On the average, 43.0% of the total revenues came from this source. Non-tax sources of revenue were divided into: donations, fund raising activities, and user charges. !\{ore than 40.0% of the non-tax sources of revenue or 17.4% of the total revenues came from fund raising activities. Donations provided almost 40.0% of the non-tax sources of support or 17.2% of the total revenues. User charges, on the average, provided 8.7% of the total revenues or 20.1% of the non-tax sources of support.
Taxes were the second most significant source of financial support for the 26 volunteer emergency ambulance services surveyed. On the average, 35.7% of total revenues came from taxes. Property taxes were used exclusively in services surveyed.
Intergovernmental sources of revenue averaged 20.0% of the total revenues in the 26 volunteer emer-
4Additional analysis of potential federal revenue sharing formula bias is needed.
10
gency ambulance services surveyed. Most of the intergovernmental revenues, 68.7%, came from service contracts with other villages and townships. Revenues from contracts averaged 14.4% of the total revenues. The remaining 31.1 % of the intergovernmental revenues came from grants-in-aid. On the average, grants provided 6.6% of the total revenues of the 26 volunteer emergency ambulance services surveyed.
The non-tax revenues for the volunteer emergency ambulance services were divided by the tax effort of their respective service areas to estimate their potential effect upon the federal revenue sharing funds received by rural communities. 5 On the average, non-tax sources of revenue are 5.8% of each service area's tax effort; i.e., if this value was included in the tax effort of the service area, it would increase by approximately 5.8%. This amount ranged from 0 to 51.1%.
STATISTICAL MODEL AND RESULTS Most of the preceding independent variables are
incorporated into a linear regression model to estimate the relationship between per unit costs of the 26 volunteer emergency ambulance services and the variables including size hypothesized to affect service cost~. Elimination of the independent variables displaying little variation in the model, or those which were redundant, resulted in the following regression equations:
CJO; = ao- b,Ol + bz021 - b3Qi + b-1S1 ± bsS2- b6S3 + b1S+- bsX, + b9X2 + b10XJb,,xof + e
or= ao + c,ljO;- c2Q1 + c3S1 ± y$z- csS3 + c6S+ - c7X, + csX2 + c9X3 - c,oX.; + e
where:
c1 = annual variable costs C2 = annual fixed costs c3 = total annual costs, c, + c2 O, = number of annual ambulance runs Oz = population of the service area Q, = average travel out time per mile Qz = average total response time {average total
number of minutes to the scene of the emergency)
S, - square miles in the service area s2 - percent of population in village where sta
tion is located s3 = population density of service area s-~ = percent of the population less than 18
years old X, = number of years service has been in opera
tion
"Currently, non-tax {e.g., user charge) revenues are excluded from the federal revenue sharing olloccrting formulas.

x2 = number of facilities in squadroom X3 = number of annual social events X+ = number of active volunteers in organiza
tion e = error term
On the basis of a priori considerations and scatter diagrams, a negative curvilinear relationship is hypothesized to exist between unit costs and the output variables; i.e., number of runs and the population of the service area. For this reason, reciprocal and quadratic as well as linear functional forms were tested to find the best functional relationship between unit cost and output quantity. The best functional relationship is determined by the magnitude of the coefficient of multiple determination (R2 ) and its respective F-ratio. · In the case of a quadratic function, the relationship between average cost and output is as follows: when b1 is negative, b2 is positive. As output increases, average cost will at first decrease until it reaches a minimum and rise thereafter; i.e., a U-shaped curve results from a quadratic function when the linear term is negative and the quadratic term is positive. When b1 is positive and b2 is negative the opposite is true; i.e., an inverse U-shaped curve will result. All other independent variables involve a linear relationship.
When output quantity is expressed as a reciprocal, the relationship between it and the unit cost of volunteer emergency ambulance service is as follows: when c1 is positive the average cost (01/01) of a volunteer emergency ambulance service decreases with an increase in output quantity and asymptotically approaches the intercept value ( ao). When C1 is negative the opposite is true; i.e., the average cost increac;es with an increase in output quantity.
The "goodness of fit" was slightly better for the reciprocal function than the quadratic functional form. Accordingly, results for both functional forms are presented in Table 2. The discussion of size economies which follows focuses primarily upon the quadratic function to avoid the possibility of overstating the existence of size economies implied by the reciprocal function.
The best fitting cost function to explain the variation in variable cost per run (C1/01) specifies a quadratic relation between unit cost and output quantity. Three significant independent variables - the number of runs (01 and Ol), average response time ( Q 2), and the number of years the service has been in operation (X1) -explain 45% of the variation in variable cost per run.
The only functional relationship estimated for fixed costs per unit of output and output quantity is the reciprocal function. Three independent variables - the number of annual ambulance runs ( 1/
11
0 1), average response time (Q2), and the number of annual social events (X3 ) - explain almost 72.0% of the variation in fixed costs per run. Almost 75.0% of the variation in per capita fixed costs is explained by four independent variables - population of the service area ( 1/02), average total response time ( Q2), size of the service area ( 81), and the number of years the service has been in operation (X1).
In the total cost per run equation (Cs/0), where output is expressed as a reciprocal, the three significant independent variables - the number of annual ambulance runs ( 1/01), average response time ( Q2), and the number of facilities in the squadroom (X2) - explain 61.2% of the variation in the total costs per run. In the total cost per capita equation (03/02), where output is expressed as a reciprocal, 68.0% of the variation is explained by the three significant independent variables - population of the service area (1/02), average response time (Q2), and the number of years the service has been in operation (X1).
When total cost per run is in the quadratic equation form, the functional relationship results in a Ushaped curve. Holding the other variables in the equation constant and taking the first derivative of unit cost with respect to output, the unit cost reaches a minimum at a level of 344 annual ambulance runs. The linear term io;; significant at the 0.025 level and the quadratic term is significant at the 0.10 level.
When the total cost per capita equation is in the quadratic form, unit costs first decrease until it reaches a minimum and then rises thereafter. Holding the other variables in the equation constant and taking the first derivative of unit costs with respect to output shows unit costs reaching a minimum at 5,756 people. Both the linear and quadratic terms are significant at the 0.005 level.
In order to get a better picture of the size economies associated with the operation of the volunteer emergency ambulance services surveyed, total cost curves per capita and per run are plotted. These curves are derived by inserting a series of values for service output into the two equations. The values represent the full range of output levels observed in the surveyed volunteer emergency ambulance services. To account for the other independent variables in the equation, the mean values for these independent variables are incorporated into the equations. The total cost curves per run and per capita are presented in Figures 2 and 3, respectively.
The quadratic function in Figure 2 shows that total costs per run decrease as output increases. This decrease in unit costs becomes decreasingly less as output approaches the optimum level of about 344

-...,
TABLE 2.-Summary of Quasi-Cost Fundions for Volunteer Ambulance Services (n = 26).
Average Total Size of Percent Number of Number of
Output'!' Response Service Population Year in Facilities Annual Social Dependent Intercept
0~ Time Area Less Than 18 Service in Squadroom Events
Variablest ao 0; 1 1/0i Q2 sl 54 x, x2 x3 R2
C /0 ai 35.33 0.07599 -4 ** -1.804.2 ** ** ** 0.4546 -2.23 X 10 -0.2460 ** 1 1 (1.51) (3.09) (10. 76) (1.61)
c11o2aii 2.02 -2.29 x lo-4 8.0 X 10⁻⁸ ** -0.0664 ** ** ** ** ** 0.2831 (1.43) (0.97} (4.31)
a •.. c11o2 111 1.22 ** ** 755.79 -0.0642 ** ** ** ** ** 0.3284
(3.73) ( 4. 75)
c21o1aii 20.64 ** ** 2354.87 -1.2409 ** ** ** ** -1.1603 0.7173 ( 46.27) (3.45) (2.23)
a. 1.67 ** ** 1310.84 -0.0038 ** -0.0094 ** ** 0.7483 c21o2 1 -0.0759 (13.77) (11.13) (3.86) (1.22)
I a. 79.82 -0.3315 4.81 X 10⁻⁴ ** 0.5814 c3 o1 1 ** -2.4785 ** 0.7561 ** ** (6.09) (3.04) (4.09) (0.75)
ciol a;; 59.45 ** ** 2483.65 -2.8590 ** ** ** -0.7911 ** 0.6122 (22.14) (6.42) (1.15)
Cl02aii 5.19 9.21 x lo-4 8.0 X 10⁻⁸ ** -0.1249 ** ** ** ** ** 0.6255 (13.14) (9.02) {8.62)
C3/o2aii 2.38 ** ** 2473.42 -0.1294 ** ** -0.0121 ** ** 0.6799 (23.73 (10.96) (0.67)
*The F-values for the independent variables appear in parentheses, with 26 observations. The F-values for the various significant levels are as follows: a; = F (1 ,21)
.005 = 9.83
.025 = 5.83 • 10 = 2.96 .25 = 1.40 .50 = 0.471
tc11o1 = Variable costs per run C1/0z = Variable costs per capita C2/01 = Fixed costs per run
a .. = F (1,22) 11 .001 = 14.4
.005 = 7.95
.01 = 6.73
.025 = 5.79
.05 = 4.30
.10 = 2.95
.25 = 1.40
.50 = 0.47
Cz/Oz = Fixed costs per capita C3/01 = Total costs (Cl + C2) per run C3/02 = Total costs (Cl + C2) per capita
a;;; = F (1,23) .os = 4.29 .10 = 2.94
~Output quantity where o1 = number of annual ambulance runs and 02 = population of the service area. Both the reciprocal and quadratic functions were used. In some equations when one or the other provided the best fit, only the function providing the best fit is presented. When both functional forms were comparatively close, both are presented.
**variable either omitted from the equation or not significant by the F-value criterion.

$/UNIT
70.00
60.00
50.00
40.00
30.00
20.00
10.00
100 200 300 400 500 OUTPUT
FIG. 2.-Total costs per run quadratic function for a sample of volunteer emergency ambulance services (n = 26).
13

annual ambulance runs and rises thereafter. This implies that the services at the lower levels of output are able to reduce unit costs to a greater extent than services operating nearer the optimum level. For example, if a service increased output from 25 to 75 annual ambulance runs, unit costs would decrease by $14.17 or 18.4%. However, if a service operating near the optimum level increased output from 275 to 325 ambulance runs per year, unit costs would decrease by $2.16 or 7.1 %.
In Figure 3, total costs per capita show similar characteristics; i.e., decreases in unit costs become de-
$/UNIT
creasingly less as output increases. This also implies that services at the lower level of output can reduce unit costs to a greater extent by increasing output than can services nearer the optimum level of output. Unit costs per capita decrease as output increases until the optimum level of about 5,756 people is reached and rises thereafter. If population (for a relatively small service area) increased from 1,000 to 2,000, unit costs would decrease by $0.68 or 20.0%, However, if a service area operating near the optimum level increased the level of output from 4,500 to 5,500 people, unit costs would decrease by $0.13 or 8.3%.
o----~~~~~~--~----L----L--~-----L--~----4,ooo s,ooo 6,000 7,000 8,000 9,000 OUTPUT
FIG. 3.-Total costs per capita quadratic fundion for a sample of volunteer emergency ambulance services (n = 26).
14

SUMMARY AND CONCLUSIONS With the recent decline in the number of funeral
homes providing emergency ambulance service, rural communities have had to look to other alternatives for providing emergency ambulance service. One alternative of growing popularity in many rural communities is to use volunteers to operate emergency ambulance services.
A sample of 26 rural Ohio volunteer emergency ambulance services was examined to determine if size economies or diseconomies are associated with their operation. In addition, factors other than output which influence unit costs were identified. Three methods were used to estimate a value for the volunteer effort used in the operation of the emergency ambulance services surveyed. Finally, the sources of tax and non-tax revenue used to finance the surveyed services were identified.
The average volunteer emergency ambulance service costs $7,439.90 per year to operate. On a per run basis, annual total costs averaged $1.96. The mean number of annual ambulance runs was 198.6 and the service area population mean was 4,300. The average number of service area square miles was 78.8. It took an average of 8.8 minutes for the ambulance to reach the scene of the emergency. The average service had 26 volunteers and had been in operation for 7.3 years. An average of 36.1% of the population was less than 18.1 years old.
The six independent variables included in the various unit cost equations explained approximately one-half of the variation in variable unit costs, threefourths of the variation in fixed unit cost'!, and twothirds of the variation in total unit costs of the emergency ambulance services surveyed.
Average response time (Q2) has a major negative impact on volunteer emergency ambulance service unit costs. In other words, to reduce response time, unit costs would increase. The number of years a service has been in operation (X1) also has a negative impact upon the unit costs of volunteer emergency ambulance services. This implies that services which have been in operation longer would generally have lower unit costs.
Other variables having a negative impact upon unit costs were the size of the service area ( 81) , the number of facilities in the squadroom (X2), and the number of annual social events (Xs). By increasing the size of the service area, unit costs would decrease. This is more or less consistent with the fmdings that size economies may be associated with the operation of volunteer emergency ambulance services and that the majority of the services surveyed were operating at less than optimum size. Increasing the number
15
of facilities in the squadroom and/ or the number of annual social events would be expected to result in decreased unit costs as the result of increased substitution of volunteer effort for agency costs.
The total unit cost equations indicated that size economies are associated with the operation of volunteer emergency ambulance services in rural areas. In the case of the quadratic equation for total costs per run, unit costs reached a minimum at 344 annual ambulance runs. In the case of the per capita total cost quadratic equation, unit costs reached a minimum at 5, 756 people. In both the total cost per run and per capita equations, more than 80% of the sample emergency ambulance services were operating at less than optimum size.
Above the optimum level of 344 annual ambulance runs, the quadratic function causes unit costs to rise with an increase in output. However, the limited number of observations and the slightly better fit of the reciprocal function make any definite conclusions on size diseconomies difficult. This suggests that: 1) the sample did not have enough observations above the optimum size to completely reflect the diseconomies associated with the operation of volunteer emergency ambulance services, or that 2) evidence of diseconomies of size is not strong.
Normally, property taxes would be expected to be the primary source of revenue for rural government services. However, this was not the case with the 26 volunteer emergency ambulance services surveyed. Property taxes were the second most significant source of revenue, providing an average of 35.7% of the surveyed services' total revenues. The most significant source of revenue was non-tax sources of support. This source provided an average of 43.3% of the services' total revenues. This category included such activities as fund raising events, user charges, and donations. The third source of support was intergovernmental revenues which made up 21% of the total revenues for the services surveyed. The primary form of intergovernmental revenues was from service contracts with other communities. Contracts provided 69.0% of the intergovernmental revenues or 14.4% of the total revenues. Some 31% of the intergovernmental revenues or 6.6% of the total revenues came from federal and state grants.
Non-tax sources of revenue averaged 5.8% of the service areas' tax efforts. This suggests that the tax effort of the community would be approximately 5.8% higher if non-tax sources of support were included.
Three methods were used to impute a value for volunteer effort. The first method determined what

it would cost to replace the volunteers with full-time paid personnel based upon an equivalency ratio of three volunteers to one professional squadman. The second method determined what it would cost to replace the volunteers based upon the minimum number (5.7) of professionals required to staff an ambulance. The third method determined what it would cost to compensate the volunteers for their time in making ambulance runs. The average imputed values for the three methods ranged from a low of $2,875.71 per year (method 3) to a high of $85,785 per year (method 1). The most conservative value for volunteer effort averaged 4.8% of the service area tax effort. In other words, if the imputed value of volunteer effort was added to the service area tax effort, the average community tax effort would be approximately 4.8% higher.
These research results should be of interest and help to nonmetropolitan rural community leaders wishing either to improve already existing volunteer emergency ambulance services or to establish new services similar to the ones surveyed in this study. The size economies which may be associated with the operation of volunteer emergency ambulance service~ in rural areas imply that services could reduce costs by expanding. While the statistical results are somewhat tentative, they suggest that more than 80% of the services are operating at less than optimum size. The measures of output quality did not vary significantly for the services operating below the optimum level and the services operating above the optimum size. The average total response time for the services above optimum size was 9.8 minutes, while the average total response time for the services below the optimum size was 8.7 minutes.6 The important point
"Howe·•er, population density was 30% higher in the above vs. below optimum size services and this factor was not specifically incorporated into the final statistical model.
16
is that most of the services were well below the 15 minutes' maximum response time rule of thumb frequently quoted.
Two methods are available for emergency ambulance services to increase the level of output in order to take advantage of the size economies which exist. The first method is through consolidation; i.e., combining communities or units of local governments in order to provide emergency ambulance service. This would generally take the form of districts similar to the fire districts used to provide fire protection in rural areas. This study did not find this to be a popular method for providing emergency ambulance service. Only 1 of the 26 volunteer emergency ambulance services could be defined as a district. Guidelines have been established by Amended Substitute House Bill No. 1173 for communities wishing to form a service district for emergency ambulance service (see Appendix B).
The second method which volunteer emergency ambulance service can use to expand output is through the use of service contracts. This study found service contracts to be frequently used for increasing service to communities without the proper resources for providing emergency ambulance service. This most frequently involved a township or village contracting to provide emergency ambulance service to a township or village without a service of their own.
Assistance and information on financing is available from the Emergency Medical Servke Division, Ohio Dept. of Health, for communities wishing to establish an EAS service district or contractual arrangement. In addition, communities can secure help from the local Cooperative Extension Service or by contacting Mr. Philip Grover of the Ohio Cooperative Extension Service, 2120 Fyffe Road, Columbus, Ohio 43210.

LITERATURE CITED 1. Clark, Charles. 1976. Analysis of Factors In
fluencing the Response Time of Rural, Volunteer Emergency Ambulance Services. M.S. Thesis, The Ohio State Univ.
2. Doeksen, Gerald A. and Bernal Green. 1974. The Economics of Rural Ambulance Service (preliminary draft). Agri. Econ., Oklahoma State Univ., Stillwater.
3. Dunlap and Associates, Inc. 1968. Economics of Highway Emergency Ambulance Service. Prepared for the U. S. Dept. of Transportation, Highway Safety Bureau, Springfield, Va.
4. Emergency Medical Services Systems Act of 1973, Public Law 93-154, 93rd Congress, S2410, Nov. 16, 1973, 11 pages.
5. Hanitzsch, Erik and William Hall. Cost-Effectiveness Analysis for Evaluating Alternative Emergency Medical Care Recovery Systems. EMA-Behavioral and Planning Perspective, Chapter 14, pp. 329-343.
6. Highway Safety Act of 1966, Public Law 89-564, 89th Congress, S3052, Sept. 9, 1966.
7. Hirsch, Werner Z. 1977. Output and Costs of Local Government Services. Proc., National Conference on Nonmetropolitan Community Services Research, U. S. Government Printing Office, Washington, D. fl., pp. 307-319.
17
8. Indiana State Board of Health, Emergency Medical Service. July 1971. Emergency Ambulance Service Planning Guidelines.
9. Lafferty, Michael B. July 1975. Rural Emergency Service an Improving Product. Buckeye Farm News
10. Manz, William L. 1977. The Cost and Financing of Volunteer Emergency Ambulance Services in Rural Ohio. M.S. Thesis, The Ohio State Univ.
11. Ohio Department of Health, Emergency Medical Service. Unpublished surveys of all emergency ambulance services operating in Ohio conducted between 1970 and 1972, and 1976 and 1977.
12. Sargent, Charles A. 1974. A Study of Emergency Services in Indiana. Agri. Econ., Coop. Ext. Serv., Purdue Univ., Sta. Bull. 54.
13. Waller, Julian A. 1973. Rural Emergency Care-Problems and Prospects. Amer. J. Public Health, 63 ( 7) .
14. Waller, Julian A., Robert Curran, and Frank Noyes. 1964. Traffic Deaths: A Preliminary Study of Urban and Rural Facilities in California. California Medicine, 101 (4) :272-276.
15. Waller, Julian A. 1973. Urban Oriented Methods: Failure to Solve Rural Emergency Care Problems. J. Amer. Med. Assoc., 226 (12) :1441-1446.

APPENDIX A
QUESTIONNAIRE FOR COST STUDY OF EMERGENCY AMBULANCE SERVICES FOR CALENDAR YEAR 1975
In order to minimize the amount of time required to complete this questionnaire and to prevent any repetition on your part, I have filled in the information we presently have from you. In the cases where the information is incomplete, please provide us with the missing information. In the cases where we do not have any information, could you please provide us with the information requested? The information obtained in this questionnaire will be treated as confidential and for statistical purposes only. No names will be revealed in reporting the results obtained from this survey. After the necessary statistics have been compiled, survey forms and tabulation sheets will be destroyed. Your cooperation will be greatly appreciated.
A. Vehicles 1. What are the types, costs, and years of purchase of the ambulances used by your squad?
Ambulance
Ambulance 2
Ambulance 3
Ambulance 4
Ambulance 5
Purchase Price of Vehicle
Price or Value of
Equipmentb Total Value
Year Purchased
aThe general terms which may describe the type of ambulance are the following: Limousine, Van. High-Top Van, Panel Truck, and Modular.
bThis column refers to instances where the vehicle was purchased and then equipped either by the volunteers or a commercial company. If the ambulance was purchased equipped, please provide the amount of the purchase price that was for the equipment.
2. Do you have a vehicle that accompanies the ambulance on emergencies involving an accident? Yes 0 No 0
If yes, what is The year of purchase?------The approximate value? ____ _
Any costs incurred in remodeling or equipping the vehicle ------
A brief description of the vehicle -----------------------
3. What was the total mileage each ambulance and the accompanying vehicle traveled in 1975?
Ambulance 1 Ambulance 4 ------
Ambulance 2 -----
Ambulance 3 ------
Ambulance 5 -----
Accompanying Vehicle ------
4. What were the license fees and cost of insurance for each of the vehicles in 1975?
License
Ambulance 1
Ambulance 2 -----
Ambulance 3 -----
Ambulance 4 -----
Ambulance 5 -----Accompanying
Vehicle
Insurance
18

5. What were the operating costs for each vehicle during 1975. (This question is broken into three alternatives. Please answer the one most suitable to the information which you have available.)
Alternative 1
Ambulance 1
Ambulance 2
Ambulance 3
Ambulance 4
Ambulance 5
Accompanying Vehicle
Alternative 2
Gas Oil Lube
Tune-ups and Other
Minor Repairs Tires
Other Parts and
Repairs
How often are each of the following things done, changed, or replaced, either by mileage or months?
Oil Change
Lubrication
Tune-ups
Tires
Were there any major repairs in 1975? Yes D NoD
Miles Months
If yes, what were the total costs of these repairs? ----
How many miles to the gallon do each of the vehicles get?
Ambulance 1 Ambulance 4 ------
Ambulance 2 Ambulance 5 ------
Ambulance 3 Accompanying Vehicle
Alternative 3 Describe and give the costs involved for all operating costs of the vehicles?
B. Communication Equipment
Pagers
Monitors
Other Radio Equipment
Total No.
No. of Volunteers on Fire Bar ---
C. Buildings and Property
Av. Age Av. Value
1. When was the building constructed? ------
2. What were the original construction costs? ------
19
No. Purchased by
Members Dept. No.
Donated

3. Was volunteer labor used in the construction of the building? Yes 0 No 0 If yes, please describe to what extent it was used.
4. What is the present market value of the building
insured? -------
------- or for what value is the building
5. What is the value of the land on which the buildings are located?-------
6. What is the value of other buildings (if any) located on the land owned by the organization?----
7. What were the costs of building repairs in 1975? -------
8. What were the costs of cleaning and the miscella ncous supplies used for the normal upkeep of the build
ing in 1975? -------
9. What is the annual cost on land and buildings for each of the following?
insurance -------
rent (if any) ------
telephone ------
electricity ------
gas-------
water and sewage -------
10. Are there any loans or notes on the building? Yes 0 NoD If yes, what are the annual interest charges ----- and premium payments? -----
11. Are there any taxes on the buildings and land? Yes D NoD If yes, what were they for 1975? -----
12. Contents of Squadroom and Office
Drink Coolers
Refrigerator
Freezer
Stove
Television
Pool Table
Chairs
Tables
Couches
Desk and Chair
Files
Typewriter
Adding Machine
Supplies
Other
Number Value Av. Age
20
Donated
Members
D D 0 0 0 0 D D D D D D D 0 0
by Purchased by Others Dept.
0 D 0 D 0 0 0 D 0 D 0 0 0 D 0 D 0 D 0 0 0 D D D 0 D 0 D 0 0

Av. Age Members Others
0 0 0 0 0 0 0 0 0 0 0 0 0 0 0 0 0 0 0 0 0 0 0 0 0 0 0 0 0 0
What is an approximate value for miscellaneous tools and equipment that have not been included in A-1,
A-2 or in D? This may include minor tools and equipment that are of little individual value. ------
E. Training
Type of Training
1. No formal training in medical care
2. Standard first aid, medical self-help, or equivalent but less than advanced first aid
3. Advanced first aid
4. Red Cross instructor or training beyond advanced first aid but less than Emergency Medical Technician
5. Emergency Medical Technician
6. Medical or allied medical background
Refresher courses
Other training (specify)
No. of volunteers by highest level of training
attained
21
Instruction fees,
materials, and other
costs
Location normally
trained at each level
No. and length of training sessions

F. How many annual social events are held by the organization for the squad members and their families?--
G. How many fire calls did the department have in 1975, if the ambulance service is directly associated with
a fire department?-----
H. What were the total number of ambulance runs made in 1975? ----
How many were accidents? -----
How many were other emergencies? ----
How many were transfers? -----
1. Of the total number of ambulance runs, how many required transportation to the hospital? -----
The hospital transported to most frequently is ----------------------located at _______________ and is approximately ---- miles from the station.
J. Were patients transported to any other hospitals? Yes 0 No 0 If yes, please provide the following information:
Hospital Location
K. Revenue in 1975
Distance No. of Trips
Made in 1975
1. list the 1975 tax revenues generated for the Emergency Ambulance Service from each of the following sources:
Property taxes ------Personal property taxes -----
Income taxes ------General Fund------
2. If there were user charges, what was the total revenue generated from them in 1975? ------
3. What was the total revenue generated from membership fees requested from users in 1975? ____ _
4. Have any funds or assistance been received by your organization since 1970 from any government agency or program offering assistance to volunteer ambulance services? Yes 0 No 0 If yes, please provide the amount received, the agency from which it was received, when it was received, and for what it was used.
5. Were there any transfers of funds made since 1970 from any other sources of revenue within the community where the ambulance is located? Yes 0 No 0 If yes, how much was transferred? -----
6. Are there any contracts with other townships or villages for provision of ambulance service? Yes 0 No 0 If yes, please list the township and/or village and the annual amount of the contract.
Township/Village
22
Amount of Contract

7. How much money was received by your organization from donations in 1975? ------
8. Please describe any gifts, other than money, received by your organization in 1975.
How much money was earned from each of the following fund-raising activities that were held by your organization in 1975?
Carnivals -----
Festivals-----
Banquets -----
Bake Sales
Other Sales
Description
Pop, candy, chip and beer money [profit)
Water hauls
Pumping jobs -----
Other
Description
l. Characteristics of Volunteers
Amount
Amount
Please complete the information, on the following page, the best you can for each member in your organization.
a< HS This column represents anything less than a high school education.
b>HS This column represents any form of education beyond a high school education but less than a college degree.
o For descriptions of the six levels of training, refer to question E, page 21.
23

Marital Owns or Buying Level of
Sex Status No. of
Education Level Home Farm Business Training
-- Children (1, 2, 3, 4, Age M F s M at Home Occupation <HSa HS >HSb Col. Yes No Yes No Yes No 5, 6)C
0 0 0 0 0 0 0 0 0 0 0 0 0 0 0 0 0 0 0 0 0 0 0 0 0 0 0 0 0 0 0 0 0 0 0 0 0 0 0 0 0 0 0 0 0 0 0 0 0 0 0 0 0 0 D D D 0 0 0 0 0 0 0 D D D 0 0 0 0 0 0 D D D D 0 D D 0 0 0 0 0 0 0 D D 0 D 0 0 0 0 D 0 D 0 0 0 0 0 0 0 0 0 0 D 0 0 0
1\.) 0 D .!».
D 0 0 D 0 D D 0 D 0 D 0 0 0 0 0 0 0 0 0 0 0 0 0 0 0 0 0 0 0 D 0 0 0 0 0 0 0 0 0 0 D 0 D 0 D D D 0 0 0 0 D 0 0 D 0 D 0 D 0 0 0 0 0 0 D 0 0 0 0 0 0 D 0 0 0 0 0 0 D D 0 D D D D D 0 0 D D D 0 D D D 0 D D D D D D D 0 D 0 D 0 0 D 0 0 D D 0 0 D D D D D D D D D D D D D 0 D 0 D D D 0 0 D D D D D D D D 0 D D D D D 0 D D D D D D D 0 0 D D D D D D D D D D D D D D D D D

APPENDIX B
AM. SUB. H. B. 1173
(As reported by the S. Trans. & Local Govt. Comm.)
Reps. Boggs, Riffe, Cox, Deering, Camera, Carney, Roberto, Netzley, Hadley, Kieffer, Pope, Swanbeck, Fiocca, Malott, Mueller, Maier, Speck, Pease, Wargo, Weyandt, Orlett, Hiestand and Scott
Sens. Johnson, Secrest and Carts
• Permits townships and municipalities to establish joint ambulance districts with borrowing and taxing authority and specific authority to contract for ambulance services.
• Authorizes political subdivisions to propose special purpose property tax levies to finance ambulance and emergency medical services.
PURPOSE
Some townships and municipalities have contracted for ambulance service without statutory authorization, according to the State Auditor's Office, and it is the stated purpose of this bill to provide authority for that service and creation of joint ambulance districts in the event local governments wish to combine for the purpose of providing ambulance service.
CONTENT AND OPERATION Contracting Authority
A State Auditor's Office opinion stated that an ambulance service cannot contract with a municipality for a fixed amount per month or year and also charge the recipient of that service. To obtain ambulance services, or additional service in emergencies, this bill authorizes a joint ambulance district (see below) to contract for ambulance service and to furnish to or receive services from, or interchange services with one or more townships, municipalities, joint fire districts, other governmental units that provide ambulance service, or private ambulance services, regardless of whether such private or government owners of the service are located within or without Ohio. Contracts could not exceed three years and would have to be authorized by all boards of trustees and legislative authorities concerned.
The contract may be based on a fixed annual charge, a charge per call, a charge based on elapsed time, or any combination of the foregoing. The bill states specifically that ambulance service expenditures are lawful regardless of whether the district or the contractor charges additional user fees.
Joint Ambulance District Two or more townships, two or more municipalities, or a combination of municipalities and townships
could join together to establish a joint ambulance district under provisions of the bill. Joint ambulance districts would be formed by majority approval of a resolution by the board of township trustees and the legislative authority of the municipalities working to form the district.
Districts would have authority under the Uniform Bond Law and the Uniform Tax Levy Law to submit bond issue and property tax levy questions to the voters, provide or contract for ambulance services, furnish ambulance service to governmental units, and to employ, fix the compensation of, and initiate removal proceedings of personnel. A district would be governed by a board of trustees, comprised of a representative appointed by the board of trustees of each township and a representative appointed by the legislative authority of each municipality in the district.
Trustees would be empowered to employ a clerk, who would be required to submit a performance bond, to serve the board of trustees. Trustees would be paid up to $20 per meeting, for not more than 12 meetings per year, and reimbursed for necessary expenses.
Other townships and municipalities could by resolution request membership in a joint ambulance district subject to the district's approval; members of the distnct could withdraw. A joint ambulance district would cease to exist when there was only one township or one municipality forming the entire district. At that time, assets of the district would be apportioned. If any debt of the district remained outstanding at the time of dissolution, taxes sufficient to meet those obligations would continue to be levied upon the property of the district as it was comprised at the time the indebtedness was incurred.
The bill does not permit suits to be initiated against a district to recover damages or loss to persons or property or for wrongful death. Employees would not be liable for damages, injury, or loss to persons or property, or for wrongful death arising from operation of a publicly or privately owned or leased vehicle while responding to an emergency call.
25

Tax Levies A political subdivision with taxing authority may ask the voters to approve tax levies in excess of the ten
mill levy limitation for specified purposes. This bill would add as a purpose for which a tax could be proposed, a levy to pay for the costs of providing ambulance, emergency medical service or both. The levy could be proposed to run for up to five years. In addition to joint ambulance districts, created by the bill, counties and townships have statutory authority to provide ambulance service and municipal corporations, presumably, have such authority under their home rule power and could thus propose such a levy.
ACTION Introduced Reported, H. Ways and Means Passed House Reported, S. Trans. & Local Govt.
HISTORY DATE
2-7-74 3-5-74
3-12-74 5-16-74
.26
JOURNAL ENTRY p. 1948 p. 2100 p. 2139 p. 1430

BETTER LIVING IS THE PRODUCT of research at the Ohio Agricultural Research and Development Center. All Ohioans benefit from this product.
Ohio's farm families benefit from the results of agricultural research translated into increased earnings and improved living conditions. So do the families of the thousands of workers employed in the firms making up the state's agribusiness complex.
But the greatest benefits of agricultural research flow to the millions of Ohio consumers. They enjoy the end products of agricultural science-the world's most wholesome and nutritious food, attractive lawns, beautiful ornamental plants, and hundreds of consumer products containing ingredients originating on the farm, in the greenhouse and nursery, or in the forest.
The Ohio Agricultural Experiment Station, as the Center was called for 83 years, was established at The Ohio State University, Columbus, in 1882. Ten years later, the Station was moved to its present location in Wayne County. In 1965, the Ohio General Assembly passed legislation changing the name to Ohio Agricultural Research and Development Center-a name which more accurately reflects the nature and scope of the Center's research program today.
Research at OARDC deals with the improvement of all agricultural production and marketing practices. It is concerned with the development of an agricultural product from germination of a seed or development of an embryo through to the consumer's dinner table. It is directed at improved human nutrition, family and child development, home management, and all other aspects of family life. It is geared to enhancing and preserving the quality of our environment.
Individuals and groups are welcome to visit the OARDC, to enjoy the attractive buildings, grounds, and arboretum, and to observe first hand research aimed at the goal of Better living for All Ohioans!

7~ State 14- ~ ~ ~'t A~t 1<~ ad 'Dtwet~
I I I .r-c·--___ ·· _.--·~ --- -~#~EGEThLE--
1 CROPS BRANCH I • - --
. -· NORTHWESTERN • ~- - - ··1 MAHONING CO • FARMe BRANCH - MUCK C~OPS •
-! , BRANE::! ___ _ r---~-~ l I WOOSTER
_,-1-· _ _( I CE:,.ER
...__l HEADQUARTERS
I I 1 --- J_j, ... _ ........ .-..J- ., ,
-,.. i
I I - t NORTH APPALAQiiAN EXPERJMEI'JrAL WATERSHED • 1 .I
, . .•• , •POME~ENE f\OREST - ·- ' L~OltATOTIT
I 1----!J J I I ~-- TH; ~:~a:TJ.~E EASTER~ OHIO 1REiuRCE WESTE,~N • I ~NIV£RSlTY' 1 D~ELOPMENT fENTER BRANCH -~ ~-- , • 1
--1 1 I I Ll .... -- J.~ I L,_r .rL,, .J ·-4 --
1. L ___ ., --} _j ,. r-
/ '---j f 1' -~ r-.. ·- .r - L t,l
1., ! - ,l ____ _ ,.. ....... ____ ...... r--, JACK;N• ·-j BRAN H , -- 1 I
Ohio's major soil types and climatic conditions are represented at the Research Center's 12 locations.
Research is conducted by 15 departments on more than 7000 acres at Center headquarters in Wooster, eight branches, Pomerene Forest Laboratory, North Appalachian Experimental Watershed, and The Ohio State University. Center Headquarters, Wooster, Wayne
County: 1953 acres Eastern Ohio Resource Development Cen
ter, Caldwell, Noble County: 2053 acres
Jackson Branch, Jackson, Jackson County· 502 acres
Mahoning County Farm, Canfield: 275 acres
'-rc' -'L
Muck Crops Branch, Willard, Huron County: 15 acres
North Appalachian Expenmental Watershed, Coshocton, Coshocton County: 1047 acres (Cooperative with Sc1ence and Educat1on Administration/ Agricultural Research, U. S. Dept. of Agnculture)
Northwestern Branch, Hoytville, Wood County: 247 acres
Pomerene Forest laboratory, Coshocton County· 227 acres
Southern Branch, Ripley, Brown County: 275 acres
Vegetable Crops Branch, Fremont, Sandusky County: 105 acres
Western Branch, South Charleston, Clark County: 428 acres