Embed Size (px)
Citation preview
© 2005, it - instituto de telecomunicações. Todos os direitos reservados.
Jessica Acevedo Flores
Daniel Robalo
Fernando J. Velez
Cost/Revenue Performance of
LTE Employing Spectrum
Aggregation with Multi-Band User
Allocation over Two Frequency
Bands
CREaTION - Workshop
2 | Universidade da Beira Interior
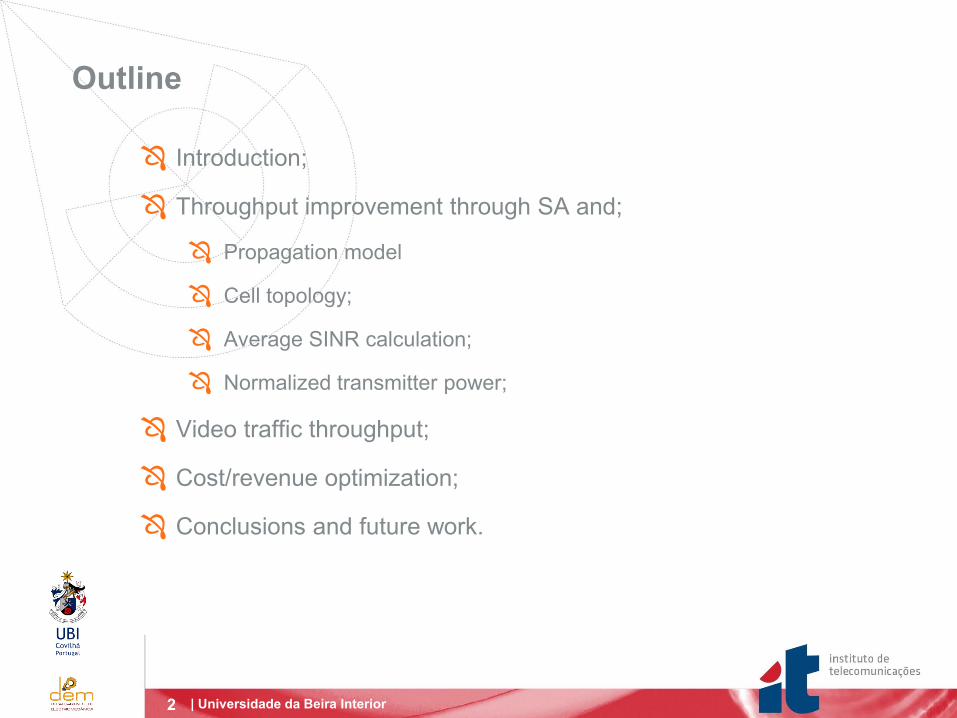
Outline
Introduction;
Throughput improvement through SA and;
Propagation model
Cell topology;
Average SINR calculation;
Normalized transmitter power;
Video traffic throughput;
Cost/revenue optimization;
Conclusions and future work.

3 | Universidade da Beira Interior
Introduction
Dynamic Spectrum Access (DSA) techniques are promising to enable
Spectrum Aggregation (SA) with intra-operator Multiband (MB)
scheduling, allowing to alleviate the spectrum scarcity problem;
Radio Resource Management (RRM) is important to guarantee
Quality of Service (QoS), since scheduling determines among packets
that are ready for transmission;
Common RRM (CRRM) is a set of functions that ensures an efficient
and coordinated use of the available radio resources in
heterogeneous networks scenarios;
Cabral et al. [1] proposed an Integrated CRRM (iCRRM) entity where
CRRM and SA functionalities are handled simultaneously. Their
resource allocation assigns the user packets to the available radio
resources to satisfy user requirements, and to ensure efficient packet
transport to maximize spectral efficiency. [1] O. Cabral, F. Meucci, A. Mihovska, F.J. Velez and N.R. Prasad. Integrated Common
Radio Resource Management with Spectrum Aggregation over Non-Contiguous
Frequency Bands. Wireless Personal Communications, Vol. 59, No. 3, Aug. 2011, pp.
499-523.
4 | Universidade da Beira Interior
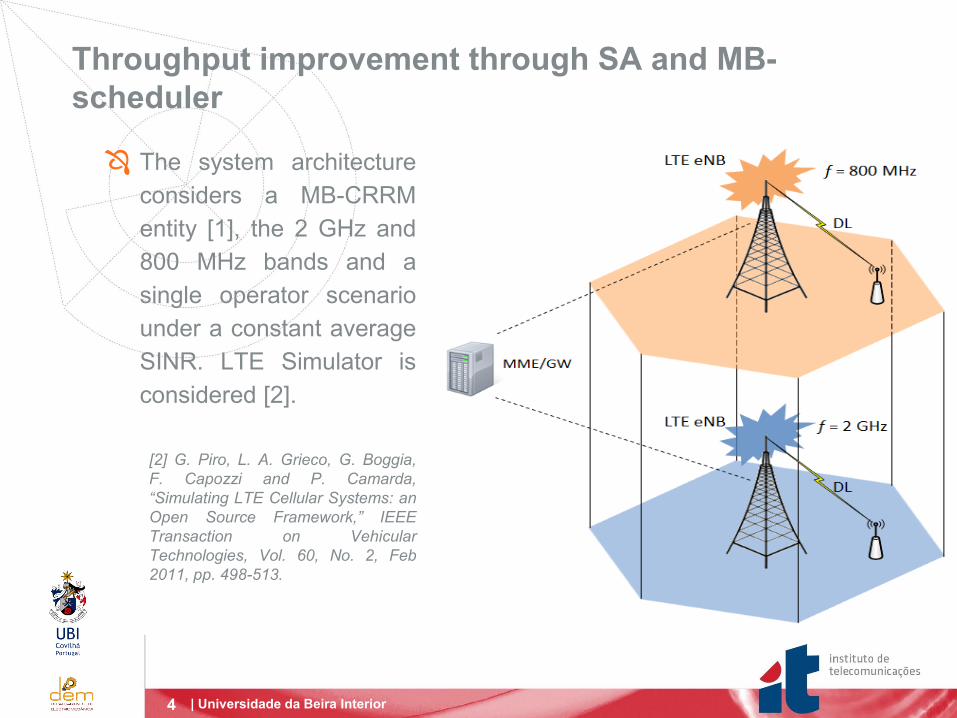
Throughput improvement through SA and MB-
scheduler
The system architecture
considers a MB-CRRM
entity [1], the 2 GHz and
800 MHz bands and a
single operator scenario
under a constant average
SINR. LTE Simulator is
considered [2].
[2] G. Piro, L. A. Grieco, G. Boggia,
F. Capozzi and P. Camarda,
“Simulating LTE Cellular Systems: an
Open Source Framework,” IEEE
Transaction on Vehicular
Technologies, Vol. 60, No. 2, Feb
2011, pp. 498-513.
5 | Universidade da Beira Interior
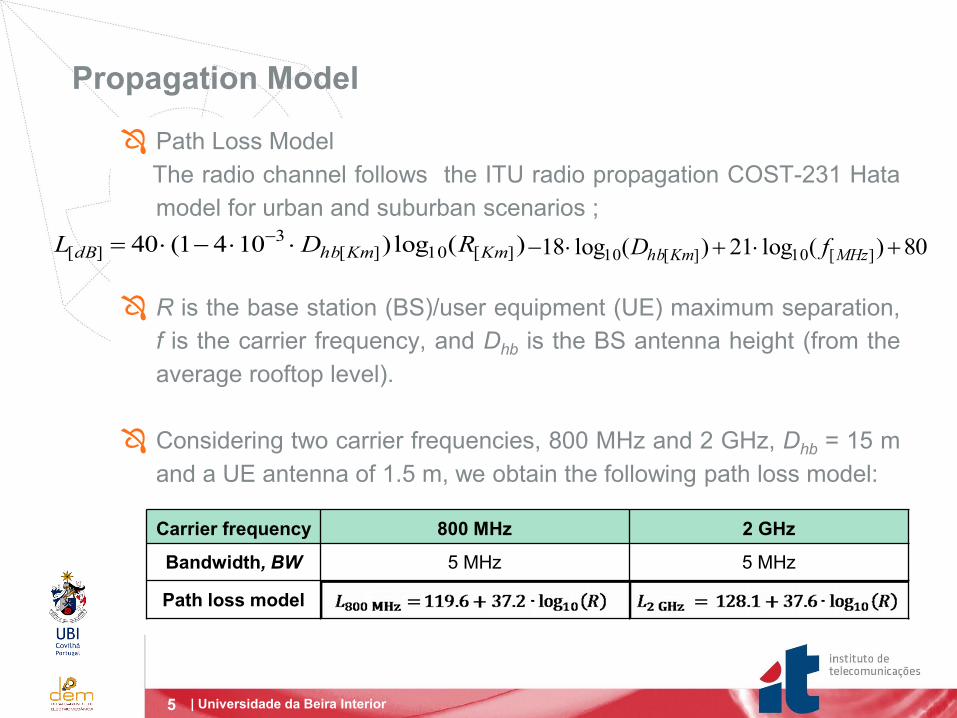
Propagation Model
Carrier frequency 800 MHz 2 GHz
Bandwidth, BW 5 MHz 5 MHz
Path loss model
Path Loss Model
The radio channel follows the ITU radio propagation COST-231 Hata
model for urban and suburban scenarios ;
R is the base station (BS)/user equipment (UE) maximum separation,
f is the carrier frequency, and Dhb is the BS antenna height (from the
average rooftop level).
Considering two carrier frequencies, 800 MHz and 2 GHz, Dhb = 15 m
and a UE antenna of 1.5 m, we obtain the following path loss model:
)(log)1041(40 ][10][3
][ KmKmhbdB RDL 80)(log21)(log18 ][10][10 MHzKmhb fD
6 | Universidade da Beira Interior
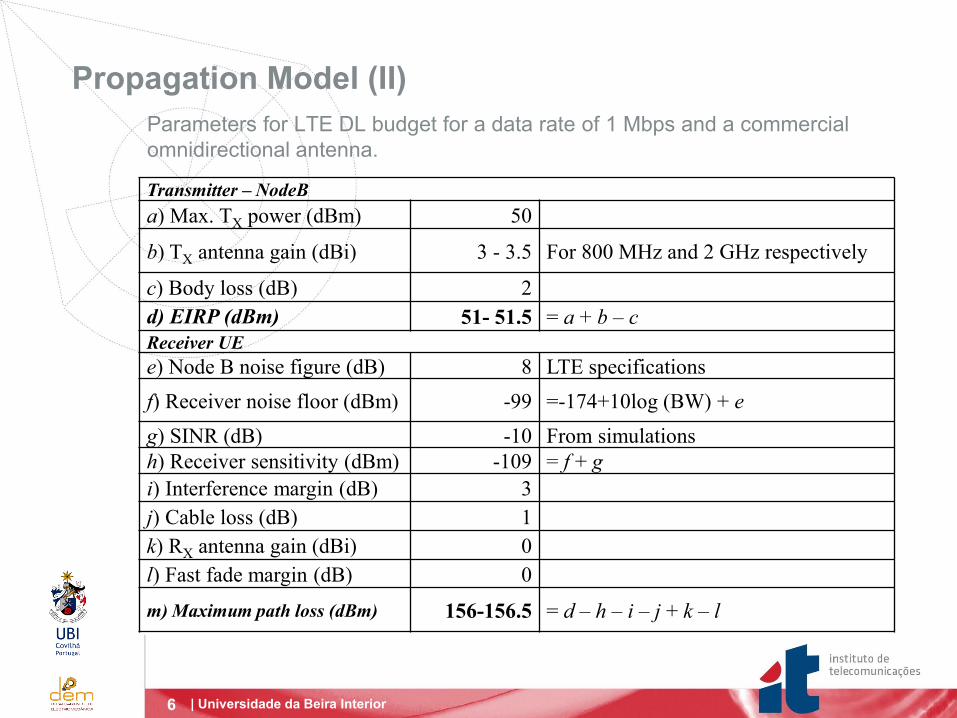
Parameters for LTE DL budget for a data rate of 1 Mbps and a commercial
omnidirectional antenna.
Propagation Model (II)
Transmitter – NodeB
a) Max. TX power (dBm) 50
b) TX antenna gain (dBi) 3 - 3.5 For 800 MHz and 2 GHz respectively
c) Body loss (dB) 2
d) EIRP (dBm) 51- 51.5 = a + b – c
Receiver UE
e) Node B noise figure (dB) 8 LTE specifications
f) Receiver noise floor (dBm) -99 =-174+10log (BW) + e
g) SINR (dB) -10 From simulations
h) Receiver sensitivity (dBm) -109 = f + g
i) Interference margin (dB) 3
j) Cable loss (dB) 1
k) RX antenna gain (dBi) 0
l) Fast fade margin (dB) 0
m) Maximum path loss (dBm) 156-156.5 = d – h – i – j + k – l
7
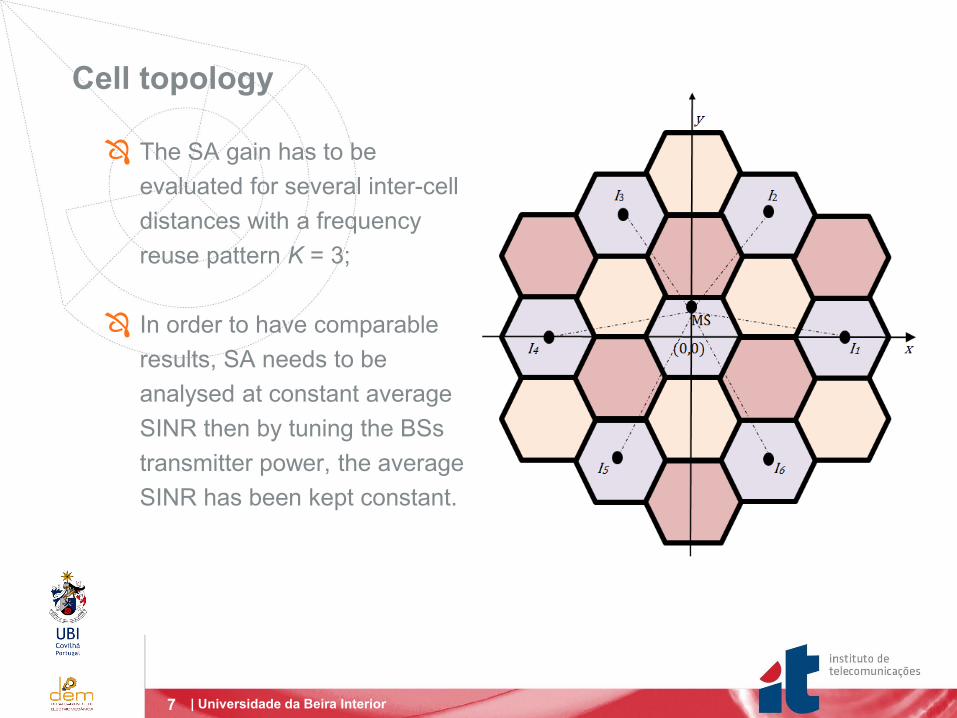
Cell topology
| Universidade da Beira Interior
The SA gain has to be
evaluated for several inter-cell
distances with a frequency
reuse pattern K = 3;
In order to have comparable
results, SA needs to be
analysed at constant average
SINR then by tuning the BSs
transmitter power, the average
SINR has been kept constant.

8
Average SINR calculation
| Universidade da Beira Interior
where:
PTx is BS transmitter power;
Pow is the power received from the own cell;
α is the orthogonality factor;
Pnh is the total amount of interfering power coming from the neighbour cells;
𝑃𝑛𝑜𝑖𝑠𝑒 is the thermal noise power, given by:
𝑃𝑛𝑜𝑖𝑠𝑒 = −174 + 10 ∙ log10 𝐵𝑊 + 𝑁𝐹 being NF = 8 dB for LTE and BW = 5
MHz.
SINR(PTx, 𝑥, 𝑦) = 𝑃 𝑜𝑤(𝑃𝑇𝑥,𝑥,𝑦)
(1−𝛼)𝑃 𝑜𝑤(𝑃𝑇𝑥,𝑥,𝑦)+𝑃 𝑛ℎ(𝑃𝑇𝑥,𝑥,𝑦)+ 𝑃𝑛𝑜𝑖𝑠𝑒
9 | Universidade da Beira Interior
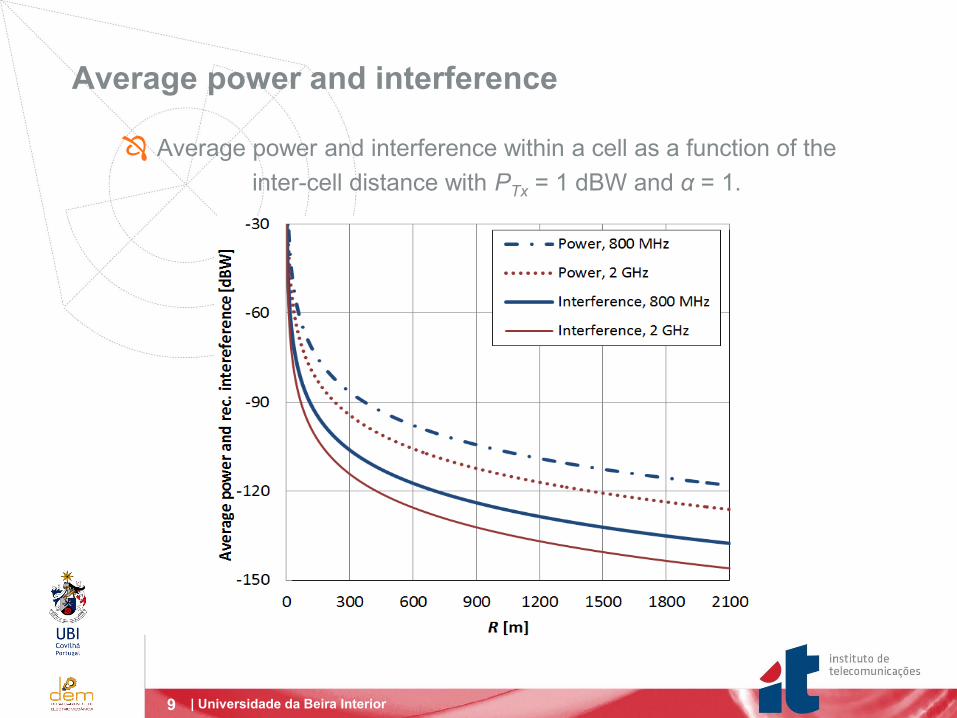
Average power and interference
Average power and interference within a cell as a function of the
inter-cell distance with PTx = 1 dBW and α = 1.

10 | Universidade da Beira Interior
Average SINR
Average SINR as a function of the cell radius (m) with three
values of PTx(-10, 1 and 13 dBW [2]) for α = 1.
11 | Universidade da Beira Interior
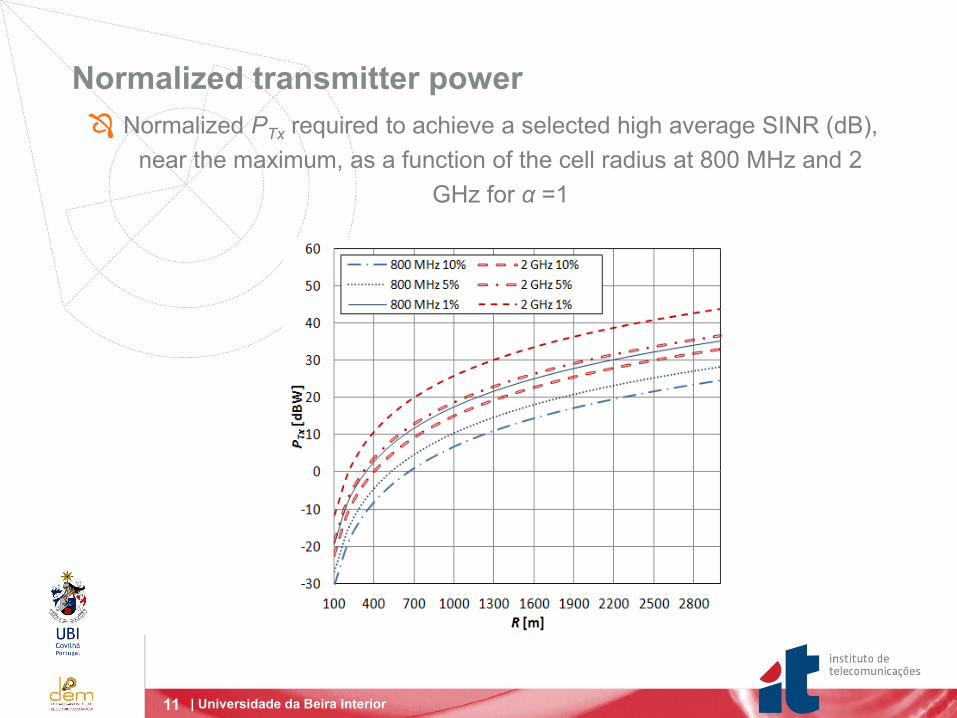
Normalized transmitter power
Normalized PTx required to achieve a selected high average SINR (dB),
near the maximum, as a function of the cell radius at 800 MHz and 2
GHz for α =1
12 | Universidade da Beira Interior
Video traffic throughput
Video traffic simulation setup:
Traced-based video sessions have been addressed for
simulations, these applications send packets based on realistic
video trace files;
We have considered a video bit rate of 128 kbps;
Modified Largest Weighted Delay First (MLWDF) scheduler.

13 | Universidade da Beira Interior
Results for video traffic throughput
Average throughput vs. number of users for different cell radii
14 | Universidade da Beira Interior
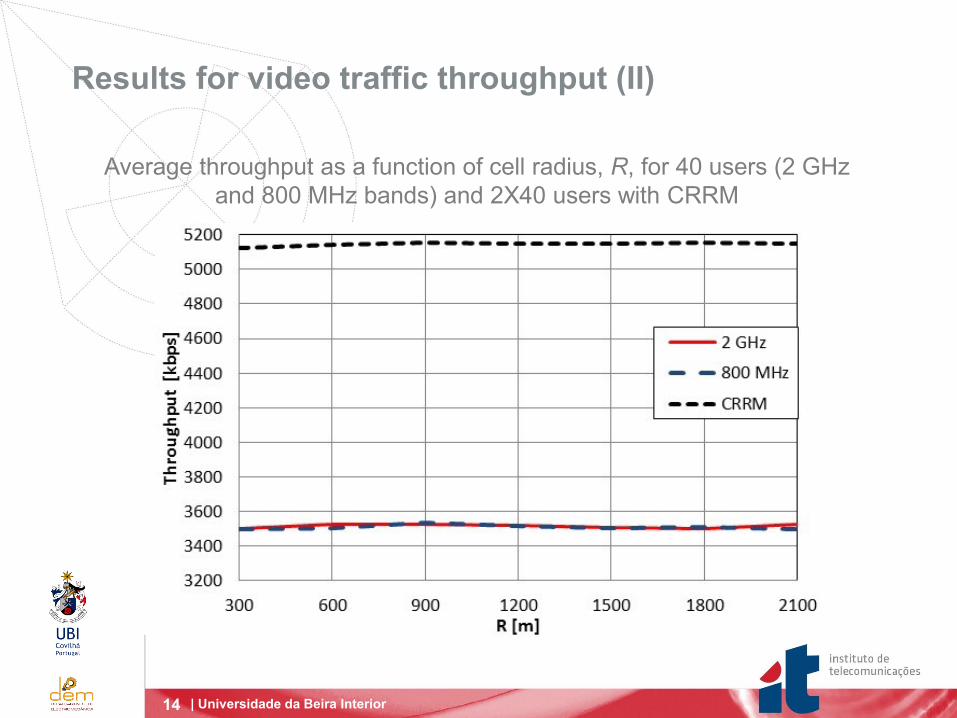
Results for video traffic throughput (II)
Average throughput as a function of cell radius, R, for 40 users (2 GHz
and 800 MHz bands) and 2X40 users with CRRM
15 | Universidade da Beira Interior
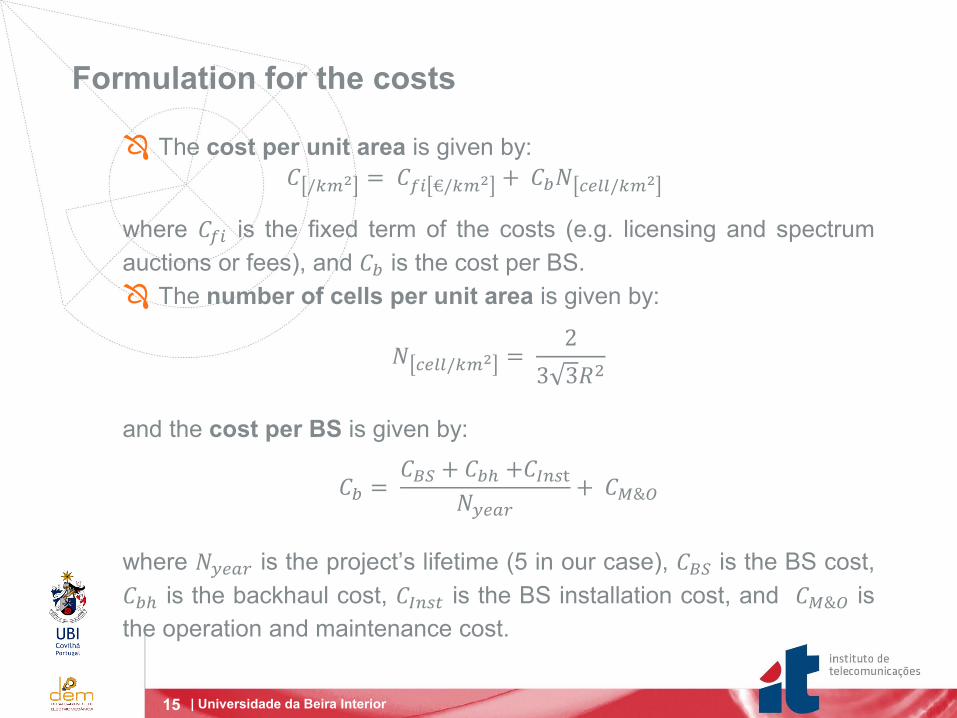
The cost per unit area is given by:
𝐶 /𝑘𝑚2 = 𝐶𝑓𝑖 €/𝑘𝑚2 + 𝐶𝑏𝑁 𝑐𝑒𝑙𝑙/𝑘𝑚2
where 𝐶𝑓𝑖 is the fixed term of the costs (e.g. licensing and spectrum
auctions or fees), and 𝐶𝑏 is the cost per BS.
The number of cells per unit area is given by:
𝑁 𝑐𝑒𝑙𝑙/𝑘𝑚2 =
2
3 3𝑅2
and the cost per BS is given by:
𝐶𝑏 =
𝐶𝐵𝑆 + 𝐶𝑏ℎ +𝐶𝐼𝑛𝑠t
𝑁𝑦𝑒𝑎𝑟+ 𝐶𝑀&𝑂
where 𝑁𝑦𝑒𝑎𝑟 is the project’s lifetime (5 in our case), 𝐶𝐵𝑆 is the BS cost,
𝐶𝑏ℎ is the backhaul cost, 𝐶𝐼𝑛𝑠𝑡 is the BS installation cost, and 𝐶𝑀&𝑂 is
the operation and maintenance cost.
Formulation for the costs

16 | Universidade da Beira Interior
𝐶𝑓𝑖 for BW of 5 MHz and K = 3;
Assuming that the annual cost of a license, for 3x5MHz, is
82.500.000 € at 800 MHz, and 45.000.000 € at 2 GHz;
Considering the total Portugal area of 91391.5 km2:
𝐶𝑓𝑖800𝑀𝐻𝑧 €/𝑘𝑚2 = 82500000
91391.5 x 5= 180.542 ≈ 180 €/km2
𝐶𝑓𝑖2𝐺𝐻𝑧 €/𝑘𝑚2 = 45000000
91391.5 x 5= 98.477 ≈ 100 €/km2
Assumptions for the costs:
Costs Omnidirectional K = 3
𝐶𝑓𝑖800𝑀𝐻𝑧 €/𝑘𝑚2
𝐶𝑓𝑖2𝐺𝐻𝑧 €/𝑘𝑚2
180.542 ≈ 180
98.477 ≈ 100
𝐶𝐵𝑆 [€] 33000
𝐶𝐼𝑛𝑠𝑡[€] 22500
𝐶𝑏ℎ[€] 5000
𝐶𝑀&𝑂 €/𝑦𝑒𝑎𝑟 1500
17 | Universidade da Beira Interior
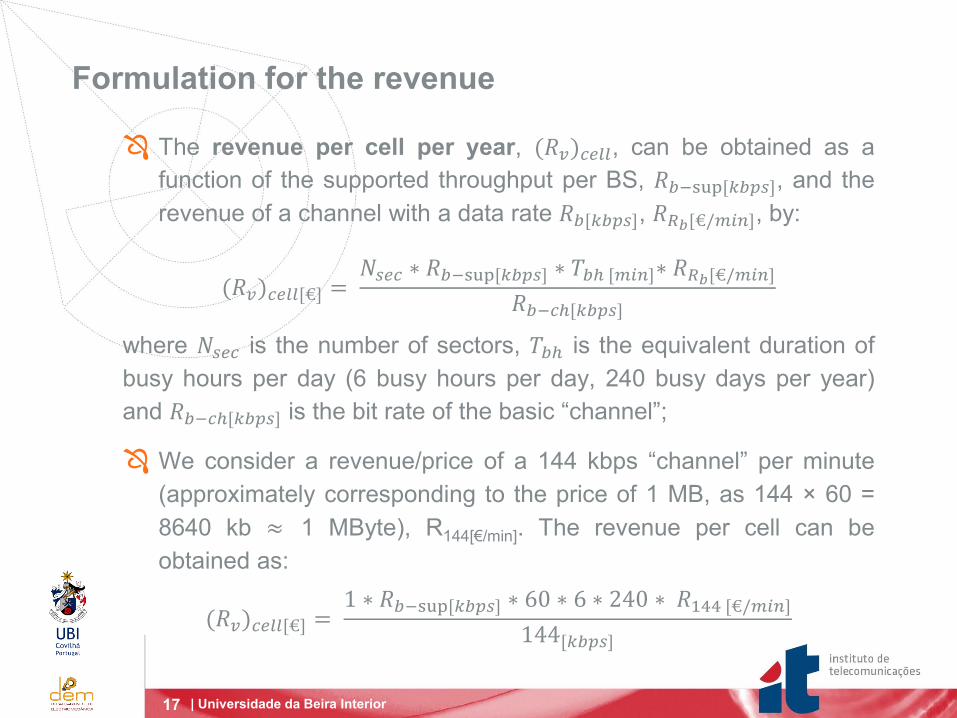
The revenue per cell per year, (𝑅𝑣)𝑐𝑒𝑙𝑙, can be obtained as a
function of the supported throughput per BS, 𝑅𝑏−sup[𝑘𝑏𝑝𝑠], and the
revenue of a channel with a data rate 𝑅𝑏[𝑘𝑏𝑝𝑠], 𝑅𝑅𝑏[€/𝑚𝑖𝑛], by:
(𝑅𝑣)𝑐𝑒𝑙𝑙[€] =
𝑁𝑠𝑒𝑐 ∗ 𝑅𝑏−sup[𝑘𝑏𝑝𝑠] ∗ 𝑇𝑏ℎ [𝑚𝑖𝑛]∗ 𝑅𝑅𝑏[€/𝑚𝑖𝑛]
𝑅𝑏−𝑐ℎ[𝑘𝑏𝑝𝑠]
where 𝑁𝑠𝑒𝑐 is the number of sectors, 𝑇𝑏ℎ is the equivalent duration of
busy hours per day (6 busy hours per day, 240 busy days per year)
and 𝑅𝑏−𝑐ℎ[𝑘𝑏𝑝𝑠] is the bit rate of the basic “channel”;
We consider a revenue/price of a 144 kbps “channel” per minute
(approximately corresponding to the price of 1 MB, as 144 × 60 =
8640 kb ≈ 1 MByte), R144[€/min]. The revenue per cell can be
obtained as:
(𝑅𝑣)𝑐𝑒𝑙𝑙[€] =
1 ∗ 𝑅𝑏−sup[𝑘𝑏𝑝𝑠] ∗ 60 ∗ 6 ∗ 240 ∗ 𝑅144 [€/𝑚𝑖𝑛]
144[𝑘𝑏𝑝𝑠]
Formulation for the revenue
18 | Universidade da Beira Interior
The (absolute) profit is given by:
𝑃 €/𝑘𝑚2 = 𝑅𝑣 + 𝐶
from which, the profit in percentage terms is given by:
𝑃 % = 𝑅𝑣−𝐶
𝐶× 100
Profit and profit in percentage
19 | Universidade da Beira Interior
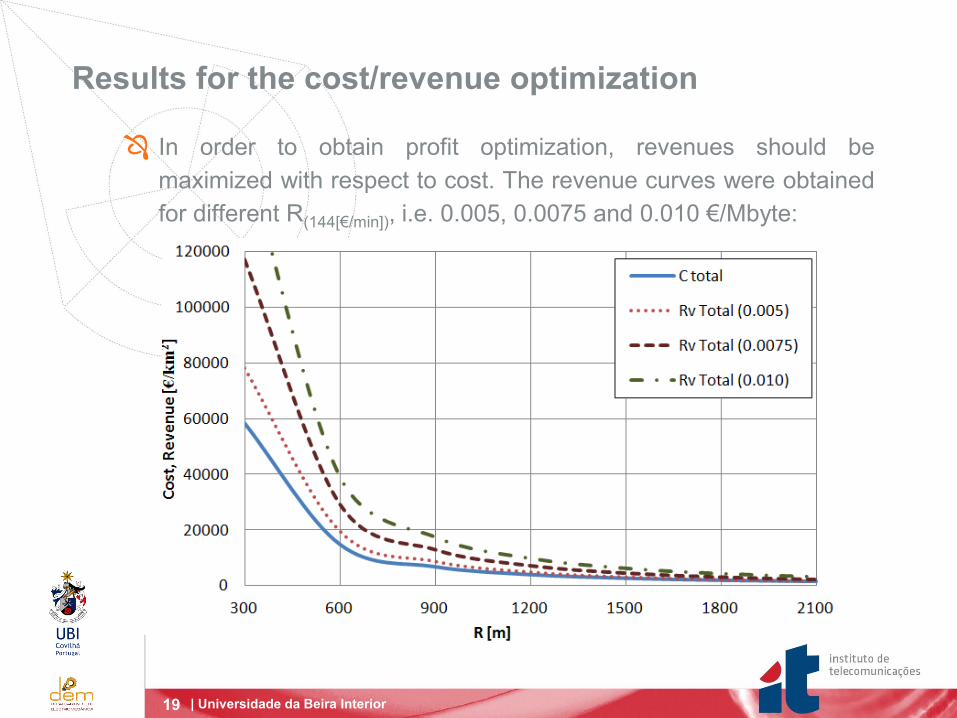
In order to obtain profit optimization, revenues should be
maximized with respect to cost. The revenue curves were obtained
for different R(144[€/min]), i.e. 0.005, 0.0075 and 0.010 €/Mbyte:
Results for the cost/revenue optimization
20 | Universidade da Beira Interior
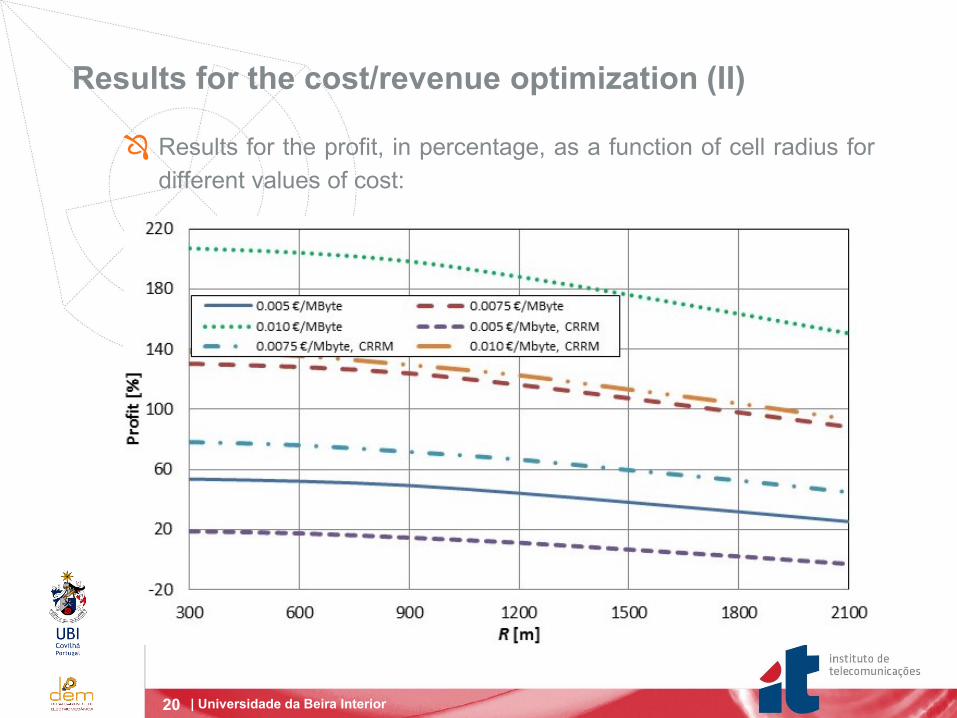
Results for the profit, in percentage, as a function of cell radius for
different values of cost:
Results for the cost/revenue optimization (II)
21 | Universidade da Beira Interior
We propose an innovative formulation in the context of SA for
computing the transmission power required in LTE systems which
comprise an CRRM entity and schedules the users between the
two LTE systems operating at 800 MHz and 2 GHz;
We considered a topology with K = 3 and the COST-231 Hata
model for the path loss, and obtained the average SINR in the cell;
We have evaluated the impact of the normalized PTx required to
achieve a selected high average SINR (dB), near the maximum for
different cell radii.
Conclusions and future work
22 | Universidade da Beira Interior
As expected, increasing the price per MByte, increases the
revenue. The total cost is fixed and lower than the revenues;
When 𝑅144[€/𝑚𝑖𝑛] = 0.010 €/Mbyte , a maximum profit of about
167% is achieved; whilst maximum profits of 33% and 100% were
obtained for 𝑅144[€/𝑚𝑖𝑛] =0.005 and 0.0075 €/Mbyte, respectively;
Future work includes improving the CRRM entity and include the
iCRRM with integer programming for throughput optimization.
Conclusions and future work (II)
23 | Universidade da Beira Interior
Thank You!
Q & S


![Wi+i WALKER USB STICK for DATA] 4G LTE Wi-Fi ......4G 4G USB STICK 4G LTE HWD12SKA 75 9.2Mbps Wi-Fi WALKER Wi-Fi WALKER HWDIISKA 75 Mbps 800MHz 36 25 Mbps Mbps 5.5 Mbps 75Mbps 40M](https://img.dokumen.tips/doc/110x75/5f224653e987250f7a57e412/wii-walker-usb-stick-for-data-4g-lte-wi-fi-4g-4g-usb-stick-4g-lte-hwd12ska.jpg)