Embed Size (px)
Citation preview

© 2016 QPR CostControl B.V.
CostPerform Do-It-YourselfTraining

CostPerform Do-It-Yourself Training2
© 2016 QPR CostControl B.V.
Table of Contents
1 Introduction 3
................................................................................................................................... 31.1 Design of the meta model
................................................................................................................................... 41.2 Create the meta model
......................................................................................................................................................... 51.2.1 Insert layers
......................................................................................................................................................... 61.2.2 Insert user attributes
................................................................................................................................... 71.3 Publish the meta model
2 Create cost model 9
................................................................................................................................... 92.1 Create the cost model
................................................................................................................................... 92.2 Set your own view per layer
................................................................................................................................... 102.3 Insert object and attribute values
................................................................................................................................... 142.4 Insert allocations
................................................................................................................................... 152.5 Calculate and verify the model
3 Use the model for analysis 17
................................................................................................................................... 173.1 Navigate through the model
................................................................................................................................... 183.2 Create a Browse Model view
................................................................................................................................... 193.3 Create a Whiteboard
................................................................................................................................... 213.4 Create a rollup and drilldown analysis
................................................................................................................................... 233.5 Create a report
4 Automate your work 26
................................................................................................................................... 264.1 Eport data
................................................................................................................................... 294.2 Import data
5 Conclusion 33

3Introduction
© 2016 QPR CostControl B.V.
1 Introduction
No matter what kind of costing methodology you use, CostPerform can handle it. Our uniquelyflexible structure allows you to adapt an existing method, mix methods, or create your own costingmethod. Exactly as you want it.
The idea behind this flexible, adaptive approach goes back to when our directors all worked as costmanagement consultants. In many cases they encountered costing tools with fixed methodsalthough their clients had other ideas on how to do proper costing. The need for flexibility wasrealized in the unique, simple but brilliant design of the CostPerform tool.
With our growing list of customers across widely varied industries, we have proved thatCostPerform’s design copes with any method for any costing purpose in any industry. Frommanufacturing to healthcare, from city councils to federal government, from universities to telecomcompanies, you name it, we're there.
This course is designed as “do it yourself” training. You should be able to finish this course within aworking day. If you encounter problems finishing this course, don’t hesitate to contact our helpdesk with yourquestions. If you have the impression the text of the course is unclear or needs more detail, pleaserelay your remarks to our customer care team.
Before you start, make sure your CostPerform Software is up and running. If not, start the ControlCenter from the start menu: Start…Programs.. CostPerform…Control Center.
From the Control Center click on Standalone Client and login as admin with password admin. Youcan proceed if CostPerform has opened
Let's start wit the course and have fun!
1.1 Design of the meta model
When you buy CostPerform, you can use one of the standard meta models as a basis for your costmodels. In most cases however, you want to build a model based on your own ideas, creativity andrequirements. CostPerform allows you to create exactly the model you want. It means that you cancreate as many layers and user attributes as you want. In our terminology, we call the set of layersand user attributes a Meta model. Each cost model is based on one meta model, but more costmodels can be based on one meta model.
Before you’re going to create a meta model you have to understand some definitions:A Meta model contains Layers, system attributes and user attributes.A Cost model is based on a Meta model.A Cost model contains Objects, Attribute values and Allocations.
4 CostPerform Do-It-Yourself Training
© 2016 QPR CostControl B.V.
A Layer represents a group of Objects that have the same purpose in your cost modelAn Object is something in your business environment that is part of the cost model, like anaccount 41111, resource “Junior staff” and product “Widget”. Allocations take care of the allocation of costs and volume between Objects of differentLayers.Each allocation has a Source and a Destination object.The order of the layers defines the flow of the costs.Volume is calculated starting from the last layer up to the first.Costs are calculated starting from the first layer down to the last.
The meta model we would like you to build is a simple one. The money comes in from the Generalledger on the Cost items layer. Then, allocations make sure the money is allocated to a Resourcelayer (contains several resources), an Activity layer and a Product layer. This meta model alsoallows for allocations from Cost items straight to activities and products and resources straight toproducts.
1.2 Create the meta model
Before inserting the layers, you have to create an empty meta model.
Step 1 : From the meta-model explorer click on Create a New meta model.
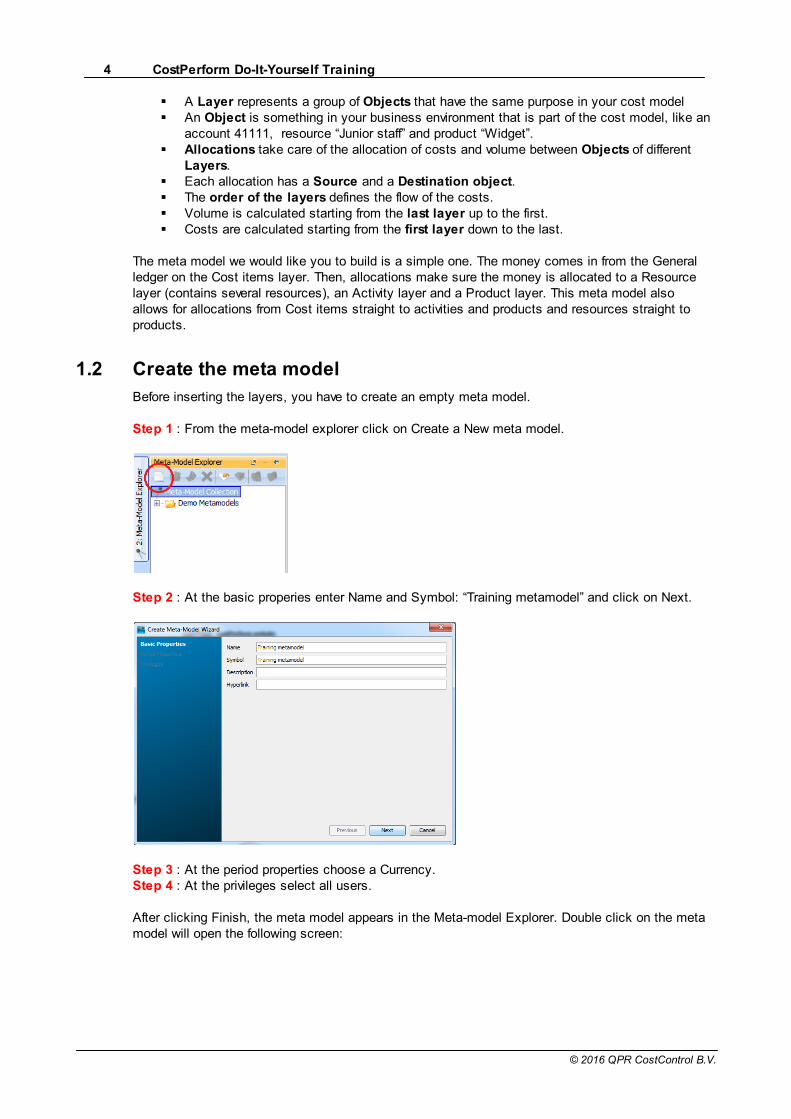
Step 2 : At the basic properies enter Name and Symbol: “Training metamodel” and click on Next.
Step 3 : At the period properties choose a Currency.Step 4 : At the privileges select all users.
After clicking Finish, the meta model appears in the Meta-model Explorer. Double click on the metamodel will open the following screen:

5Introduction
© 2016 QPR CostControl B.V.
1.2.1 Insert layers
Step 1 : Insert Layer Cost Items
The first layer in the meta model will contain the cost items of our model. As you can see a newmeta model does not contain any layers. In order to create a layer:
Select, the folder “Meta-Model Layers” and use the Icon (or right menu option Add newLayer) and enter Name = Cost Items, Symbol = 10
Select an icon to display if an object can allocate (enabled)
Select an icon to display if an object does not allocate (disabled) Select Background color (this color shows in the model browser function and the objectnavigator)Click next.
You can use any icon you want to attach to a layer. Make sure to use an icon to reflect thepurpose of the layer. Select a colored icon for allocating objects and a grayed object for nonallocating objects.
Step 2 : Insert the other layers
Symbol Name Icon enable Icon Disable Background color
40 Product Blue
30 Activity Yellow
20 Resource Green
After this step the window should look like this:
Step 3 : Set the right order of layers
The order of layers determines the flow of the volume and costs. Since you’ve inserted the layers inthe wrong order, the next step is to order the layers:

6 CostPerform Do-It-Yourself Training
© 2016 QPR CostControl B.V.
Select layer 20. Drag the layer just below layer 10 and drop the layer. Select layer 30, press CTRL and arrow up to move this layer before 40 and after 20.
After this step, the window should look like this:
Dragging and dropping the layer or using CTRL arrow up / down are two ways of moving thelayers.
1.2.2 Insert user attributes
CostPerform contains over 50 so called System attributes. These attributes allow you to store bothinput and result data. In most cases the set of user attributes is not enough. In this training modelwe need some extra attributes. The first attribute we need is the number of FTE (#FTE) to store thenumber of FTE’s per resource.
Step 1: Insert user attributes on Resource layer
Select layer Resource.Select right mouse menu, option Add new attribute.Select Numeric and click NextInsert Name = #FTE, tab and Next.On attributes details, set Aggregation behavior to ” After Cost Calculation”.Click Finish.Insert on the same layer the Numeric attribute named: Salary midpoint per FTE.
Step 2: Insert user attributes on Cost Item layer
The Cost type attribute is a list of values to express the type of costs. This attribute is created foranalysis purposes. To create the attribute:
Select Layer Cost Items.Select right mouse menu, option Add new attribute.Select “Listed” Attribute.Insert Name = CostType, tab and Next.Tick, on the Attribute details screen, the check box “Let Listed items track attribute value”.Select “Input cost” from the pull down list.

7Introduction
© 2016 QPR CostControl B.V.
Then, click on New and enter Name = Unknown, tab and finish. As you can see the item isadded to the list.Click New again and enter Name = Personnel Costs, Symbol = PCosts and finish.Click New again, enter name = Overhead Costs, Symbol = OCosts and finish.Click New again, enter name = Material Costs, Symbol = MCosts and finish.Click Finish.
Because we want to use a rate per unit for the materials we need to insert this rate attribute as well.Select Layer Cost Items.Select right mouse menu, option Add new attribute.Select numeric attribute.Insert Name = Rate, same symbol, click next.Select tick box: currency.Click Finish.
Step 3: Insert attribute on activity layer
On this layer we need the setup time and the run time as attributes. To create these attributes:
Select layer Activity.Select right mouse menu, option Add new attributeSelect Numeric attribute Insert Name= Equipment time, same symbol, click next and finish
The meta model should look like this:
Because you ticked “Let Listed items track attribute value” CostPerform created for each listentry an attribute of type Formula and shadow. It means that each of the costs of cost item that ismarked with one of the three choices is set to one of the three attributes and follow the flow of costs.The nice thing is that you can see the costs being split in these three categories throughout thewhole model.
1.3 Publish the meta model
You’re finished now, just close the Meta Model designer. Don’t worry about saving, all changes aresaved on the fly.
The meta model is saved as work in progress. If you need to edit or create a cost model, you

8 CostPerform Do-It-Yourself Training
© 2016 QPR CostControl B.V.
must move the meta model to “Published” (use right mouse menu “Move to published Meta-Models”). If you need to edit the meta model, you must first make sure all cost models for this metamodel are closed and then you must move the meta model to “Work in progress” (use right mousemenu “Move to work in progress Meta-Models” or double click on the meta model and answer yes tothe question). Once you’re ready and closed the meta model, you must Publish it again (again useright mouse menu option “Move to published Meta-Models” or answer yes to the question whileclosing the meta model). Now you can start working on your cost models or create a new one.
Congratulations, you've finished this part. Let's resume what you've learned so far.
You've learned how to construct a meta model. You've added layers to enable users to insert costitems, resources etc. For some layers you've inserted user attributes to allow the user to enterspecific information and to use this information in calculations.

9Create cost model
© 2016 QPR CostControl B.V.
2 Create cost model
A cost model is based on a meta model.
2.1 Create the cost model
Since you’ve created a meta model, you now can create a cost model based on this meta model.Please follow these steps to create your cost model:
Step 1 : From the cost model explorer click on Create Cost model.
Step 2 : Select Meta-Model: Training metamodel.
Step 3 : Enter Name= My first cost model, same symbol, Next.Step 4 : Enter Period name= 2016, same symbol.Step 5 : Select Base Currency = €, Finish.
The cost model is created and can be opened by double clicking on the cost model and the period inthe Cost model explorer. The model opens and shows calculation results (All layers show zero).
2.2 Set your own view per layer
The opened model shows the object list on the right. This list shows several columns representingsome of the attributes. To enable you to enter data via the object list, you need to change thecolumns to show.
To change the columns:
Step 1 : Click on My first cost model in the object tree. Select from the icon bar (or use rightmouse menu option “Personalization”).

10 CostPerform Do-It-Yourself Training
© 2016 QPR CostControl B.V.
Step 2 : Then select the following attributes (and deselect the ones you don’t need): Symbol, Name,Object Allocates, Capacity, Unit, Driver, Object Distributes, Input Volume, Costs per unit output,Costs per unit of capacity, Input Cost, Total Incoming cost, Total Costs, Total Usage (volume), TotalOutgoing Cost.
Step 3 : Click on Set as default to set the visible attributes for all layers, click Ok.
As you can see the visibility of columns have changed.
You can change the column visibility any time. Each layer can have its specific set of columnsvisible. It is also possible to change the columns right from the object grid. Columns can be draggedto reorder them, and by right-clicking on the column header, various options appear to add/removecolumns and manage Pareto analyses.
2.3 Insert object and attribute values
The model is ready to be populated by your objects.
Step 1 : Let’s first insert the objects for the Cost Item Layer.
To insert object: Click on layer Cost items in the object tree on the left.Select the tab Object View.Insert Symbol = 41Insert Name= Wages.Select object allocates = True.Leave other attributes blank.

11Create cost model
© 2016 QPR CostControl B.V.
Enter. The object is created. Insert object 46 (symbol) Fixed Costs (name) and 48 (symbol) Material Costs (name), both withobject allocates = False.
Allocation level false indicates that the object is not allowed to allocate. In this case the objectserves as a placeholder for objects that do allocate. In our model 41 Wages receives the money from its children. By setting 41 Wages to objectallocates = True, you allow this object to allocate.
Step 2 : Insert the other objects on layer Cost items.
In stead of using the object list to insert object, you can insert an object by:Click on 41 Wages, then right mouse menu option “Create New Object”.Enter Symbol = 41111, Name = Direct Wages.Set object allocates to False.Click OK.
As you can see the 41111 object is placed in the object tree as child of 41 Wages.
Insert the following objects in the same way:
Select Parent Symbol Name Object allocates
41 41112 Social costs False
46 46111 Depreciation True
46 46112 Other overhead True
48 48111 Steel frame True
48 48112 Alu frame True
48 48113 Steel w heel True
48 48114 Alu w heel True
Step 3 : Insert other information for this layer
The objects on this layer behave differently. Where object 41 Wages allocates all incoming costsusing the distribution method, both Depreciation and Overhead will push their costs. The materialobjects are using a specific rate and the volume of bikes to allocate the money.
To set the right object behavior, set the following attribute values using the object list. UsePersonalization in Section 2.2 to create a view for your objects which reflects the following table:
For
object
Driver Object
Distribute
s
Condition
al driver
Conditional
driver value *
Calculation rule Rate
attribute
symbol
Input
Cost
Rate Cost Type

12 CostPerform Do-It-Yourself Training
© 2016 QPR CostControl B.V.
41 #FTE *
Salary
midpoint
per FTE
True 2 - Full Costing Personnel
costs
41111 2 - Full Costing 500,000
41112 2 - Full Costing 150,000
46111 2 - Full Costing 500,000 Overhead
costs
46112 2 - Full Costing 200,000 Overhead
costs
48111 Total
Usage
(volume)
True Description ~Steel 3 - Use rate
attribute
Rate 100 Material costs
48112 Total
Usage
(volume)
True Description ~Alu 3 - Use rate
attribute
Rate 250 Material costs
48113 Total
Usage
(volume)
True Name City bike 3 - Use rate
attribute
Rate 25 Material costs
48114 Total
Usage
(volume)
True Name Race bike 3 - Use rate
attribute
Rate 40 Material costs
* Please make sure that the conditional driver value for conditional driver Description contains "~"such as "~Steel" in order to make it work.
A Driver means that the value on the allocation will be multiplied by the Driver value of thedestination object(s). If you want the Driver to distribute you have to select Object distributes = trueand it only works if you allocate to a non allocating parent. For example for object 41 it means thatthe value on the allocation will be multiplied by the sum of (#FTE * Salary midpoint per FTE). Theallocated value will be distributed to the children of the destination object depending on the #FTEmultiplied by Salary midpoint per FTE. The Conditional driver defines to what destination object thisobject should allocate. So for example for object 48111 the object will only allocate to objects thatcontain Steel in the description.
Step 4 : Insert the objects for other layers.
By now you have learned how to insert objects. To complete the model with the other objects, try toenter the object on the other layers using the same functionality. Use both object view and Createnew object function.
On layer Parent * Symbol Name Object
Allocates
Driver Object
Distribut
es
Calculation
Rule
(empty is rule
2)
Input
Volume
Resources MAN Man capacity False
Resources MAC Machine capacity False
Resources SUP Support capacity False
Resources MAN R01 Production staff True SA_33 *
Equipment
time
True
Resources MAN R02 Packing staff True SA_33 FalseResources MAC R03 Production line 1 True SA_33 *
Equipment
time
True
Resources SUP R04 Managers True SA_33 True
Resources SUP R05 Overhead True 4 - Overhead

13Create cost model
© 2016 QPR CostControl B.V.
surcharge
Activity PRE Prepare production False
Activity RUN Run production False
Activity PRE A01 Setup a batch True
Activity RUN A02 Run a City bike
batch
True
Activity RUN A03 Run a Race bike
batch
True
Activity RUN A04 Pack bikes True SA_33 True
Product EPR End products False
Product EPR P01 City bike True 10,000
Product EPR P02 Race bike True 1,000
* To create a parent for an object you can drag the object to the parent or you can choose theCreate new object function when selecting the parent.SA_33 = Total Usage (Volume)
Step 5 : Insert # FTE and Salary midpoint per FTE
The costs of wages are distributed to the man-resources by #FTE times Salary midpoint per FTE.By using these drivers, the actual wages are divided over the man resource by the theoretical wages(#FTE * Salary midpoint).In order to make this happen, you need to enter these values.
On Layer Symbol #FTE Salary midpoint per FTE
Resources R01 5 30,000
Resources R02 3 25,000
Resources R04 3 90,000
Step 6 : Insert Equipment time for some activities
The driver for Production line is total equipment time. The time to enter is the number of hours ittakes to perform the activity once.
On Layer Symbol Equipment time
Activity A01 5
Activity A02 250
Activity A03 150
In this example the A04 Pack bikes does not use the production line.
Step 7 : Insert Description for the products.
The Description of the products is used in the conditional driver of object 48111 and 48112. Fill in thedescription for these objects.
On Layer Symbol Description
Product P01 Steel frame
Product P02 Alu frame
Ok, you are now able to insert objects.
You've learned that every object is inserted on a layer. Each object has a parent object, each layeracts as a parent for those objects where you did not enter a parent. You've seen how to set the mostimportant attributes like Driver and Calculation rule. next step is to link the objects using allocations

14 CostPerform Do-It-Yourself Training
© 2016 QPR CostControl B.V.
and distributions.
2.4 Insert allocations
Allocations connect source objects to destination objects. With each allocation you decide to whichdestination object(s) the costs on the source object should go to. You also decide how much unitsin total or per unit of (destination) object driver must be used to split costs from one source to manydestinations.
Step 1 : Let’s first insert the allocations that depart from the Cost Item layer.
Click on this icon (you can find this icon in the toolbar of CostPerform)Expand both trees in a way you can see all Cost item objects in the vertical tree andResources and Products in the horizontal tree.
The matrix should look like this:
Now you can enter values on each blank cell. When you enter a value you will insert an allocation.
Enter value 1 from object 41 to object 20 (Resource)Enter value 100 from 46111 to R03 Enter value 100 from 46112 to R05Enter value 1 from 48111 to 40 (Products)Enter value 1 from 48112 to 40 (Products)Enter value 2 from 48113 to 40 (Products)Enter value 2 from 48114 to 40 (Products)
After this the matrix should look like this:

15Create cost model
© 2016 QPR CostControl B.V.
Step 2 : Insert the other allocations
By expanding both horizontal en vertical tree, you open cells to enter allocation values. To completethis step, insert the following allocations:
Source object Destination object Value in cell Explanation
R01 PRE 2 Man per setup
R01 RUN 5 Man per run
R02 A04 0.1 1 bike = 0.1 hour
R03 30 (Activity) 1 as a yes
R04 40 (Product) 1 as a yes
R05 P01 1 as a yes
R05 P02 1 as a yes
A01 P01 20 Batches per year
A01 P02 10 Batches per year
A02 P01 20 Batches per year
A03 P02 10 Batches per year
A04 EPR 1
Ok, the model is ready to be calculated. You' ve linked the objects in a way the money can flowfrom the start objects (in the first layer) to the last layer. You' ve used sometimes a 1 as a switchand sometimes values like 5 man per run, 2 wheels per bike etc, representing " Productionstandards" in the model.
Together with the Cost driver and distribution settings this model will use these drivers to calculatethe Total Usage (volume) and uses the usage to calculate unit rates.
2.5 Calculate and verify the model
It is time to calculate and verify the model. You can see if the model needs calculation by the two **in the title bar, or in the status bar below.

16 CostPerform Do-It-Yourself Training
© 2016 QPR CostControl B.V.
Step 1: To calculate the model, click on this icon. As a result the Calculation summary screenappears. As you can see, the cost per layer differ. Total incoming costs is 1,350K where costs onthe last layer is 3,180K.
Let’s check what happened in the model.
Step 2: Verify the model
In order to find out where the differences occur, you can use the following icon As a result thefollowing screen appears:
This screen shows all objects where incoming costs are not equal to the outgoing costs. As you cansee all Materials show a difference. This is because we used Rule 3 with the Rate as rate attribute.You did not put any input costs on these objects, but because of the rates and the distribution driverbeing Total Usage, the tool calculates how much money is needed for materials to produce 10,000city bikes and 1,000 race bikes. You also see that P01 and P02 appear in the list. Since they do notallocate anymore, they have no outgoing costs, only incoming. You can hide these objects from thelist by de-selecting the layer Products.
Altrough the check shows differences for the material objects, the model is technically correct. Wewanted to use rates instead of input costs because we wanted to forecast material costs. If themodel is technically correct, it's time to explore and analyze to see if the model makes sense at all.

17Use the model for analysis
© 2016 QPR CostControl B.V.
3 Use the model for analysis
You can analyse by navigating through the model, create a browse model, create a whiteboard, do arollup/drilldown report or create a report.
3.1 Navigate through the model
The first function to use to explore the model is called the object navigator. This navigator appearsautomatically if you click on an object on the lowest level (the so called leave objects). Let’s have alook at the navigator. Please open the Products layer, expand the tree so you select P01 City bike.On the right side you see the selected object in the center. As you can see, all incoming allocationsto P01 and the related costs involved show in the navigator.
Because the source objects are sorted by highest cost first, you can check these costs againstexpectations.
If you expect that the costs of activities are higher than the costs of frame in a bike, you can seethat your expectations are not met. If you click on A02, this object is now the center object. Thenavigator shows incoming and outgoing objects. Again you can check your model by looking at thenumbers.
If your model contains allocations that do not allocate (show costs=0) but you expect money to flow,the following tables can help to fix the problem:
Problem 1: The costs do not flow at all
Check Solution
The source object does not have incoming costs Check the incoming allocations for this object
Object has incoming cost and a cost driver Check the Cost driver, since the source object has a Cost driver,
this object is looking for the corresponding value on the destination.
If this value is zero, nothing happens.
Object uses rule 3, rate attribute = Cost per unit of With rule 3 you w ant to use a specif ic rate to value the volume

18 CostPerform Do-It-Yourself Training
© 2016 QPR CostControl B.V.
capacity output to the destination objects. Since the default rate attribute
= Cost per unit of capacity, you might have missed to enter value
in the capacity attribute.
Object uses rule 3, rate attribute = Rate (or any
other rate attribute)
If no costs f low , the value in rate might be 0.
Object has also no incoming distributed costs It can be that you expect the object to receive money via the
distribution mechanism (like object Wages in your model). The
source object defines the Cost- and Distribution driver to allocate
costs trough the hierarchy. If an object does not get costs, either
the Cost driver and/or Distribution driver value is zero.
Object has incoming allocations from source objects
that have costs
Check value to use on the allocation. If that value = 0, set it to
another value.
Problem 2: The costs do flow but nog all or too much costs are allocated.
Check Solution
Object uses rule 1 Rule 1 uses no rate. The value on the allocation is money. If the
outgoing costs are more than the incoming costs, the values on the
allocations do not add up to the incoming costs.
Object uses rule 3 With rule 3 the rate is set by the rate attribute. Rate times volume
makes total outgoing costs. If incoming costs differ, the object
over
or under allocates.
3.2 Create a Browse Model view
In most cases you want to explain how the costs flow through the model. Of course you’re thespecialist now but your colleagues are still unaware of the fine work you did. The function you’reabout to try is an excellent candidate to communicate with your users. To create a flow of the cost,please follow the following steps:
Step 1 : Click on this icon.
Step 2 : Drag from the Cost Item layer the object 41 Wages to the empty canvas on the right anddrop it somewhere. As you can see, a box appears.
By clicking on these buttons: you can draw your flow model.
Step 3 : Click on (Automatically Add outgoing allocations). It draws the allocation to object 20

19Use the model for analysis
© 2016 QPR CostControl B.V.
and the virtual allocations to the children of object 20. Click again and you’ll see that the outgoingallocations of 20 are drawn. Now click a couple of times to draw the complete allocation pathwaysfrom 41 Wages to the Product.
If you want you can move the boxes around and make the flow look nice. Use the mouse and thealignment functions in the toolbar. The result could be something like this:
3.3 Create a Whiteboard
Where the previous function did the drawing for you, CostPerform contains a function where you canmake your own drawings and connect the objects you draw to objects and attribute values in yourcost model. You can use the whiteboard function not only to design your meta model but also to usethe design as management report. Let’s create a whiteboard that shows the design of the metamodel and explains how the costs flow through the model, on a high level.
Step 1: Click on this icon.
Step 2: Select a box from the palette. Double click your left mouse button. The box appears on thecanvas. After that, type Cost Items. As you can see, the moment you start typing a new windowappears that allows you to not only set the title but also to link this box to objects and attributevalues from your model.
You can set this window as follows:

20 CostPerform Do-It-Yourself Training
© 2016 QPR CostControl B.V.
Tick Display attribute value.Select Total Costs from the pull down list.Set the number of decimals to zero.Select Numeric format Thousands(K).Select from the object list layer 10 and click arrow right button. The interface asks you if you wantto add the children or only the allocating objects. Answer No, to only add object 10.Click OK.
As you can see, the box contains a title and the total costs of the selected object.
Step 3 : Please draw the other layers and attach per layer the right object-attribute combination.After this step, your whiteboard should look like this:
Step 4 : Now give the boxes some color. Use these buttons to set a color. Selectyellow and click ok. If you select Cost Items and Products (use shift click to select both), and thenclick on the color buttons, the two selected objects are yellow now. Draw the Resource green andthe Activity orange.
It's also possible to change f.e. the font type and size/color, or change the line color. Takesome time to explore the other tools in this function.
Step 5 : You can also draw lines between the boxes and link the line to allocations.
Select the line tool and click Cost Items. Keep the left mouse button pressed, move the mouse toResources and release the left mouse button. After this, a line is drawn and attached to both boxes.Select the arrow tool and double click on the line. Enter no fixed text. Select attribute value: Cost,set zero decimals and in Thousands. Then, form the object list, select object 10 and answer Yes onthe question that follows. Click OK to save changes. The window looks like this:

21Use the model for analysis
© 2016 QPR CostControl B.V.
As a result the total costs of all selected allocation show as label to the line. Try the other tools tomodify the graphical appearance of the line.
If you need to bend the line, select a point on the line and Shift Click on it. An extra bendingpoint appears and you can move that point. To remove a bending point, Shift click on it. You cancreate groups of boxes and lines. A group becomes a box as well. You can open and close a groupfor better overview and interactive usage.
Step 6 : Save the whiteboard for later usage. Click on this icon to save the whiteboard.
The whiteboard you've experienced is not just a replacement for a drawing tool. It combines freestyle drawing with the option to link cost model data to the picture. You can use any whiteboard forany model and any period. If you are using linked objects or allocations and attribute to show, thewhiteboard links the objects based on their symbols. If they mach, they link, if not, the picture isshown without the numbers.
3.4 Create a rollup and drilldown analysis
After this graphical reporting, it’s time to analyze the rollup and drilldown. If you want to know howcosts flow into a single product you use Rollup. If you want to see where certain costs flow to, youuse Drilldown. In both cases, the report shows all allocation paths from the “start object” all the wayto its “end objects”. Let’s create a Rollup report.
Step 1: Click on this icon.
Step 2: Don’t change the configuration on the opened window. Select the Object selection tab andfrom there select object 40 from the list and click on arrow right. Answer “Only allocating objects” tothe question that follows. Select the Visible layers / OLAP tab and click on add all layers. ThenClick on Run and the rollup report appears.
If you click on the + icons, the trees open and show the allocation pathways that start from P1 Citybike. As you can see the steel frame takes 38.3% of the total cost. A02 Run a City Bike batchtakes 20.1% of the costs. This 20.1% comes from R03 for 71.5% and from R01 for 28.5%. Thecolumn Global % shows the % from R01 in relation to the costs of the “start object” P01 and is5.8%. This means that 5.8% of the costs of P01 consists of R01 costs. The columns Cost/unitoutput shows the costs of R01 per unit of P01. €15 out of €261 per bike consists of R01.

22 CostPerform Do-It-Yourself Training
© 2016 QPR CostControl B.V.
Step 3: This function allows you to group objects based on a group criterion. Every attribute can actas grouping criterion. Let’s rollup the bikes and then group the end objects (Cost items) on Parent
symbol. Select and select from the Group by pull down list Parent symbol. Please note thatthe layer of the group criterion remains Cost Items (because we want to group the cost items onparent symbol). Click Run.
The report shows P01 detailed rollup but not all steps like above. It shows group 48 (parent of 48111and 48113) first. It shows that 57.5% of the costs is material. 21.6% is wages and 21% is othercosts. You can open each group to see the content of the group.
Step 4 : Where the rollup starts at layer 40 (Products) and explores the incoming allocations, the
drilldown report starts at layer 10 to explore OUTGOING allocations. Select the icon again andchange on the Configuration tab Type from Rollup to Drilldown. Set the group attribute to blank. Clickon the object selection, remove P01 and P02 from the right list (arrow left button) and add object 10(arrow right button). Answer “Only allocating objects” (7 objects appear in the list). Click Run.
The result might look the same, it shows WHERE the costs are going. It shows that 54.5% ofwages is going to R04 Managers and 90.9% that costs to P01. The Global % shows that 49.6 % ofwages from managers is allocated to P01.

23Use the model for analysis
© 2016 QPR CostControl B.V.
You can use the grouping function in the same way as you did in the rollup. Make sure youselect the right layer where the grouping criterion must be applied.
Step 5: You can save this report to HTML by clicking on or save the view to a image by
clicking on this icon.
The rollup and drill down function allows you to analyse the flow of costs detailed as you need it.Remember you can group on any attribute. If you are grouping on numeric attributes, you can enterthe numeric classes to use. Each setting you make can be saved for later use. A setting stores theinformation you set on the configuration, object, additional attributes and visible layers / OLAP tab.
In this example we used the first layer (layer 10) and the last (layer 4) to start - stop the rollup. Try tostart on layer 30 or 20 and stop rolling up and drilling down at layer 20 or 30. You can even tell therollup to only rollup 1 or 2 steps, regardless of the layer structure.
3.5 Create a report
One of the nice features is that this report function can be used without having to open the model.
Step 1 : Click on this tab. Click on this icon to create a new report. Enter symboland name and click on next.
Step 2 : Select the Cost model and period My first cost model Period 2016 and click on next.
Step 3 : Set the dimensions. For this report you want the objects appear in the rows and theattribute values in the columns. In case of more periods, you want complete blocks of periods nextto each other. Select the right “dimension” in the right position until your screen looks like this:
Click Next.
Step 4 : Select the attributes. From the Select attributes window you can pick the attributes youwant on your reports. Try to find the following attributes, move them to the right list (arrow rightbutton) and set the order of the attributes right (arrow up/down button). Your result should look likethis:

24 CostPerform Do-It-Yourself Training
© 2016 QPR CostControl B.V.
Click next.
Step 5 : Select the objects for your report. Select object 10 and click Arrow right button. AnswerOnly allocating objects and click next.
Step 6 : Set sorting and subtotaling. For each selected attribute, you can set the sort order in thereport, subtotals and Pareto options. Set Sort order of Total Cost to 1 and Descending and alsoselect to use pareto (The Pareto option w ill color all Total costs values that make 80% of the Total costs green) byselecting the values from the pull down list on the right cell. Tick Show grand total column. Yourresult should look like this:

25Use the model for analysis
© 2016 QPR CostControl B.V.
Step 7 : Select users. Skip this step by clicking next.
Step 8 : Enter Header and footer and set Header fore- and background color (use Style buttons) andclick on finish.
Your report will be added to the report list.
Step 9 : Execute the report. Select the report and click on the icon. The report looks like this:
Step 10 : Export and Print report. You can export the report to several file types. The Icon on the left allows you to export the report to a csv file (tab of ; separated). The next iconexports the report to an HTML file. The next icon exports the report to a xls file and the icon on theright exports the report to PDF. For each options you have to enter a valid filename.

26 CostPerform Do-It-Yourself Training
© 2016 QPR CostControl B.V.
4 Automate your work
Most CostPerform users do not enter models by hand like you did in this training. CostPerformcontains an easy to use and very intuitive function to export and import complete models. Thisfunction allows you to automate the routine of actualizing data in your cost models.
4.1 Eport data
With this function you can export all attribute values for all the objects/allocations. The results arestored in a flat ASCII file, waiting to be picked up by other applications like Excel, data warehousesand GL systems. First you have to create a custom format to define what attribute should be in whatcolumn, and then you create a tasklist and a task that takes care of the export.
Step 1 : To go to the Data Transfer function, click on this icon.
Then click on the icon in the Custom Format window on the right. The Custom format editorwindow allows you to map the attributes of your models to columns in the file.
Step 2 : Now we are going to map fields. Select the Multilayer format option. A message shows,click ok. The first layer is now reserved for the layer symbol. From the attribute list, select Symboland drag this to column B. You cannot drop the symbol on the header, just drop it somewhere underthe B column. Select Name and drag it to column C. Open folder Result set Attributes, thenIncoming Cost Set and select Total Costs. Drag it and drop it under column D. Open folder Outgoingvolume set and select Total usage. Drag and drop it under column E.
The custom format window should look like this:
Click ok and name it "My first export format" to save it for later use. The format is added to the list offormats.
Step 3 : On the left select tasklist collections and click on the icon to create a new Tasklist.Enter " My first export tasklist" as name and symbol and click on the ok button, the tasklist iscreated.

27Automate your work
© 2016 QPR CostControl B.V.
Step 4 : Select "My first tasklist" from the list and click on this icon to create a Transfer filetask.
Step 5 : Set the task to export, tick export and click on next.
Step 6 : Enter the path and name of the file that you want to create and populate with the exporteddata and tick Export result values. After that click on next.
Step 7 : Select the custom format that you' ve just made and click on next.
Step 8 : Select all the layers and click on next.

28 CostPerform Do-It-Yourself Training
© 2016 QPR CostControl B.V.
Step 9 : Name the task " My first export task" and click on the finish button. The task is added tothe tasklist.
Step 10 : To execute the task click on the icon. When the task execution is completed thefollowing message is shown:
The export file should look like this (opened in Excel):

29Automate your work
© 2016 QPR CostControl B.V.
4.2 Import data
Importing data in CostPerform is as easy as exporting, you’re using the same logics. The onlydifference is that you cannot use all attributes. Only input attributes are allowed to import.
Step 1 : Before we can import the file we need to create one. Use notepad or Excel (save as Tabdelimited) to create the following file:
If you use notepad, use tabs between the values.
Step 2 : Then we create a custom format. Click on this icon to go to the Data transfer function.
Then click on the icon in the Custom Format window on the right. The Custom format editor

30 CostPerform Do-It-Yourself Training
© 2016 QPR CostControl B.V.
window allows you to map the attributes of your models to columns in the file.
Step 3 : Now we are going to map fields. Select the Single layer format option, and tick layer Costitems in the MetaModel. Drag Symbol to column A, Name to column B and input costs to columnC.
The custom format window should look like this:
Click ok and name it "My first import format" to save it for later use. The format is added to the list offormats.
Step 4 : On the left select tasklist collections and select "My first tasklist" from the list and click on
this icon to create a Transfer file task.
Step 5 : Set the task to import, tick export and click on next.

31Automate your work
© 2016 QPR CostControl B.V.
Step 6 : Either enter the complete path or browse a file via the file manager. For this exercise, useyour documents folder (usually: C:\Users\<<username>>\Documents) and enter filenamemyfirstimport.txt (C:\Users\<<username>>\Documents\myfirstimport.txt) and click next.
Step 7 : Set the Start import from line to 2 since the file contains a header. Also add a filter thatonly imports rows where the Text “IMPORT_ME” is found (a so called positive filter) and click onNext.
Step 8 : Select My first import format from the list and click on Next.
Step 9 : Name the task: ”My first import task” and click on the Finish button. The task is added tothe task list.
Step 10 : To execute the task select "My first import task" and click on the icon. When thetask execution is completed the following message is shown:

32 CostPerform Do-It-Yourself Training
© 2016 QPR CostControl B.V.
If you open the log, you can check the results. The file contains 7 lines, but 1 line was not flaggedwith IMPORT_ME. 4 of 6 objects already existed, so only the input costs are updated. 2 new objectwere added. Click on Show results and close the Data transfer function. The result of the importshows if you open layer 10 from the object tree. For the material objects, the input costs are set now(where 0) Both objects 49111 and 49112 are added to the layer.
You might have noticed that the import function is easy to understand and quite similar to theexport. Remember that you can import any object and any input attribute as well as any allocationand allocation attributes.
The log after execution of the tasks shows errors during importing. These errors show what and whythe import data was not accepted.

33Conclusion
© 2016 QPR CostControl B.V.
5 Conclusion
Congratulations with finishing this training course. The model you’ve build might be small but itcontains a lot of “constructions” that current CostPerform users use in their actual models today.Once you have experienced all options you can apply your knowledge in practice and you might findthat working with your colleagues or customer on this domain becomes more effective. As developers of the CostPerform methodology and software we hope we can transfer our drive andenthusiasm to you and your colleagues or customers. Modeling Cost via CostPerform is fun andadds value to your existing instruments to help you business or your customers business performbetter.
Feedback request.
Since this course was designed as a “do it yourself” training, we are interested in your feedback.Your feedback on how you experienced this course helps us to improve our process of transferringknowledge on CostPerform. We would like to get some answers from you on the followingquestions:
Q1: Did you manage to build the model? If not, what happened, were did you loose it? Q2: How much time did you need to finish the course? Q3: What part of the course was hard to follow? Q4: What part in the CostPerform software was hard to understand or hard to work on? Q5: How comfortable do you feel about to apply CostPerfom on a real situation? Q6: Can you give us some tips to improve this course? Q7: Can you give us some tips to improve the software?
You can mail the answers to [email protected]


![Volltext (PDF) - Krause und Pachernegg - kup.at · PDF filePAT1 qpr, uPAqpr, MMP1 qpr, [16] bFGF qpr, FGFR qpr, TIMP1 q, ... Medium komponiert [54]. Ein wesentli-cher Unterschied zum](https://img.dokumen.tips/doc/110x75/5a7a1af77f8b9adf228d4b97/volltext-pdf-krause-und-pachernegg-kupat-qpr-upaqpr-mmp1-qpr-16-bfgf.jpg)