Embed Size (px)
Citation preview

Buffalo/Niagara Falls Office Market
M i d - Y e a r 2 0 1 5
The CoStarOffice Report

Buffalo/Niagara Falls Office Market
©2015 CoStar Group, Inc. The CoStar Office Report A
Mid-Year 2015 – Buffalo/Niagara Falls
Table of ContentsTable of Contents . . . . . . . . . . . . . . . . . . . . . . . . . . . . . . . . . . . . . . . . . . . . . . . . . . . . . . . . . . . . . . . . . AMethodology . . . . . . . . . . . . . . . . . . . . . . . . . . . . . . . . . . . . . . . . . . . . . . . . . . . . . . . . . . . . . . . . . . . . . . BTerms & Definitions. . . . . . . . . . . . . . . . . . . . . . . . . . . . . . . . . . . . . . . . . . . . . . . . . . . . . . . . . . . . . . . . CMarket Highlights & Overview . . . . . . . . . . . . . . . . . . . . . . . . . . . . . . . . . . . . . . . . . . . . . . . . . . . . . . . . 1CoStar Markets . . . . . . . . . . . . . . . . . . . . . . . . . . . . . . . . . . . . . . . . . . . . . . . . . . . . . . . . . . . . . . . . . . . . 4Inventory & Development Analysis. . . . . . . . . . . . . . . . . . . . . . . . . . . . . . . . . . . . . . . . . . . . . . . . . . . . . 5
Inventory & Development AnalysisSelect Top Under Construction PropertiesSelect Top Deliveries
Figures at a Glance. . . . . . . . . . . . . . . . . . . . . . . . . . . . . . . . . . . . . . . . . . . . . . . . . . . . . . . . . . . . . . . . . 8Figures at a Glance by Class & MarketHistorical Figures at a Glance
Leasing Activity Analysis. . . . . . . . . . . . . . . . . . . . . . . . . . . . . . . . . . . . . . . . . . . . . . . . . . . . . . . . . . . . 10Select Top Lease Transactions
Analysis of Individual CoStar Submarket Clusters . . . . . . . . . . . . . . . . . . . . . . . . . . . . . . . . . . . . . . . . 12Buffalo CBD MarketEast MarketGreater Buffalo MarketNiagara Falls MarketNorth MarketSouth Market

Buffalo/Niagara Falls Office Market
B The CoStar Office Report ©2015 CoStar Group, Inc.
Buffalo/Niagara Falls – Mid-Year 2015
Buffalo/Niagara Falls Office Market
©2015 CoStar Group, Inc. The CoStar Office Report C
Mid-Year 2015 – Buffalo/Niagara Falls
MethodologyThe CoStar Office Report, unless specifically stated otherwise, calculates office statistics using CoStar Group’s entire database of existing and under construction office buildings in each metropolitan area. Included are office, office condominium, office loft, office medical, all classes and all sizes, and both multi-tenant and single-tenant buildings, including owner-occupied buildings. CoStar Group's national database includes approximately 80.7 billion square feet of coverage in 3.5 million properties. All rental rates reported in the CoStar Office Report have been converted to a Full Service equivalent rental rate.
© Copyright 2015 CoStar Group, Inc. All Rights Reserved. Although CoStar makes efforts to ensure the accuracy and reliability of the information contained herein, CoStar makes no guarantee, representation or warranty regarding the quality, accuracy, timeliness or completeness of the information. The publication is provided ‘as is’ and CoStar expressly disclaims any guarantees, representations or warranties of any kind, including those of MERCHANTABILITY AND FITNESS FOR A PARTICULAR PURPOSE.
CoStar Group, Inc.
1331 L ST NW • Washington, DC 20005• (800) 204-5960 • www.costar.com • NASDAQ: CSGP
For information on subscribing to CoStar’s other products and services, please contact us at 1-877-7COSTAR, or visit our web site at www.costar.com

Buffalo/Niagara Falls Office Market
B The CoStar Office Report ©2015 CoStar Group, Inc.
Buffalo/Niagara Falls – Mid-Year 2015
Buffalo/Niagara Falls Office Market
©2015 CoStar Group, Inc. The CoStar Office Report C
Mid-Year 2015 – Buffalo/Niagara Falls
Terms & DefinitionsAvailability Rate: The ratio of available space to total rentable space, calculated by dividing the total available square feet by the total rentable square feet.Available Space: The total amount of space that is currently being marketed as available for lease in a given time period. It includes any space that is available, regardless of whether the space is vacant, occupied, available for sublease, or available at a future date. Build-to-Suit: A term describing a particular property, developed specifically for a certain tenant to occupy, with structural features, systems, or improvement work designed specifically for the needs of that tenant. A build-to-suit can be leased or owned by the tenant. In a leased build-to-suit, a tenant will usually have a long term lease on the space.Buyer: The individual, group, company, or entity that has purchased a commercial real estate asset.Cap Rate: Short for capitalization rate. The Cap Rate is a calculation that reflects the relationship between one year’s net operating income and the current market value of a particular property. The Cap Rate is calculated by dividing the annual net operating income by the sales price (or asking sales price).CBD: Abbreviation for Central Business District. (See also: Central Business District)Central Business District: The designations of Central Business District (CBD) and Suburban refer to a particular geographic area within a metropolitan statistical area (MSA) describing the level of real estate development found there. The CBD is characterized by a high density, well organized core within the largest city of a given MSA.Class A: A classification used to describe buildings that generally qualify as extremely desirable investment-grade properties and com-mand the highest rents or sale prices compared to other buildings in the same market. Such buildings are well located and provide efficient tenant layouts as well as high quality, and in some buildings, one-of-a-kind floor plans. They can be an architectural or historical landmark designed by prominent architects. These buildings contain a modern mechanical system, and have above-average maintenance and management as well as the best quality materials and workmanship in their trim and interior fittings. They are generally the most attractive and eagerly sought by investors willing to pay a premium for quality.Class B: A classification used to describe buildings that generally qualify as a more speculative investment, and as such, command lower rents or sale prices compared to Class A properties. Such buildings offer utilitarian space without special attractions, and have ordinary design, if new or fairly new; good to excellent design if an older non-landmark building. These buildings typically have average to good maintenance, management and tenants. They are less appealing to tenants than Class A properties, and may be deficient in a number of respects including floor plans, condition and facilities. They lack prestige and must depend chiefly on a lower price to attract tenants and investors.Class C: A classification used to describe buildings that generally qualify as no-frills, older buildings that offer basic space and command lower rents or sale prices compared to other buildings in the same market. Such buildings typically have below-average maintenance and management, and could have mixed or low tenant prestige, inferior elevators, and/or mechanical/electrical systems. These build-ings lack prestige and must depend chiefly on a lower price to attract tenants and investors.Construction Starts: Buildings that began construction during a specific period of time. (See also: Deliveries)Contiguous Blocks of Space: Space within a building that is, or is able to be joined together into a single contiguous space.Deliveries: Buildings that complete construction during a specified period of time. In order for space to be considered delivered, a certifi-
cate of occupancy must have been issued for the property.Delivery Date: The date a building completes construction and receives a certificate of occupancy.Developer: The company, entity or individual that transforms raw land to improved property by use of labor, capital and entrepreneurial efforts. Direct Space: Space that is being offered for lease directly from the landlord or owner of a building, as opposed to space being offered in a building by another tenant (or broker of a tenant) trying to sublet a space that has already been leased.Existing Inventory: The square footage of buildings that have received a certificate of occupancy and are able to be occupied by tenants. It does not include space in buildings that are either planned, under construction or under renovation.Flex Building: A type of building designed to be versatile, which may be used in combination with office (corporate headquarters), research and development, quasi-retail sales, and including but not limited to industrial, warehouse, and distribution uses. A typical flex building will be one or two stories with at least half of the rentable area being used as office space, have ceiling heights of 16 feet or less, and have some type of drive-in door, even though the door may be glassed in or sealed off.Full Service Rental Rate: Rental rates that include all operating expenses such as utilities, electricity, janitorial services, taxes and insur-ance.Gross Absorption: The total change in occupied space over a given period of time, counting space that is occupied but not space that is vacated by tenants. Gross absorption differs from leasing Activity, which is the sum of all space leased over a certain period of time. Unless otherwise noted Gross Absorption includes direct and sublease space.Growth in Inventory: The change in size of the existing square footage in a given area over a given period of time, generally due to the construction of new buildings.Industrial Building: A type of building adapted for such uses as the assemblage, processing, and/or manufacturing of products from raw materials or fabricated parts. Additional uses include warehous-ing, distribution, and maintenance facilities. The primary purpose of the space is for storing, producing, assembling, or distributing product.Landlord Rep: (Landlord Representative) In a typical lease transaction between an owner/landlord and tenant, the broker that represents the interests of the owner/landlord is referred to as the Landlord Rep.Leased Space: All the space that has a financial lease obligation. It includes all leased space, regardless of whether the space is currently occupied by a tenant. Leased space also includes space being offered for sublease.Leasing Activity: The volume of square footage that is commit-ted to and signed under a lease obligation for a specific building or market in a given period of time. It includes direct leases, subleases and renewals of existing leases. It also includes any pre-leasing activity in planned, under construction, or under renovation buildings.Market: Geographic boundaries that serve to delineate core areas that are competitive with each other and constitute a generally accepted primary competitive set of areas. Markets are building-type specific, and are non-overlapping contiguous geographic designations having a cumulative sum that matches the boundaries of the entire Region (See also: Region). Markets can be further subdivided into Submarkets. (See also: Submarkets)Multi-Tenant: Buildings that house more than one tenant at a given time. Usually, multi-tenant buildings were designed and built to accommodate many different floor plans and designs for different

Buffalo/Niagara Falls Office Market
D The CoStar Office Report ©2015 CoStar Group, Inc.
Buffalo/Niagara Falls – Mid-Year 2015 Mid-Year 2015 – Buffalo/Niagara Falls
Buffalo/Niagara Falls Office Market
©2015 CoStar Group, Inc. The CoStar Office Report 1
tenant needs. (See also: Tenancy).Net Absorption: The net change in occupied space over a given period of time. Unless otherwise noted Net Absorption includes direct and sublease space.Net Rental Rate: A rental rate that excludes certain expenses that a tenant could incur in occupying office space. Such expenses are expected to be paid directly by the tenant and may include janitorial costs, electricity, utilities, taxes, insurance and other related costs.New Space: Sometimes called first generation space, refers to space that has never been occupied and/or leased by a tenant.Occupied Space: Space that is physically occupied by a tenant. It does not include leased space that is not currently occupied by a tenant.Office Building: A type of commercial building used exclusively or primarily for office use (business), as opposed to manufacturing, warehousing, or other uses. Office buildings may sometimes have other associated uses within part of the building, i.e., retail sales, finan-cial, or restaurant, usually on the ground floor.Owner: The company, entity, or individual that holds title on a given building or property.Planned/Proposed: The status of a building that has been announced for future development but not yet started construction.Preleased Space: The amount of space in a building that has been leased prior to its construction completion date, or certificate of occupancy date.Price/SF: Calculated by dividing the price of a building (either sales price or asking sales price) by the Rentable Building Area (RBA).Property Manager: The company and/or person responsible for the day-to-day operations of a building, such as cleaning, trash removal, etc. The property manager also makes sure that the various systems within the building, such as the elevators, HVAC, and electrical systems, are functioning properly.Quoted Rental Rate: The asking rate per square foot for a par-ticular building or unit of space by a broker or property owner. Quoted rental rates may differ from the actual rates paid by tenants following the negotiation of all terms and conditions in a specific lease. RBA: Abbreviation for Rentable Building Area. (See also: Rentable Building Area)Region: Core areas containing a large population nucleus, that together with adjacent communities have a high degree of economic and social integration. Regions are further divided into market areas, called Markets. (See also: Markets)Relet Space: Sometimes called second generation or direct space, refers to existing space that has previously been occupied by another tenant.Rentable Building Area: (RBA) The total square footage of a building that can be occupied by, or assigned to a tenant for the purpose of determining a tenant’s rental obligation. Generally RBA includes a percentage of common areas including all hallways, main lobbies, bathrooms, and telephone closets.Rental Rates: The annual costs of occupancy for a particular space quoted on a per square foot basis.Sales Price: The total dollar amount paid for a particular property at a particular point in time.Sales Volume: The sum of sales prices for a given group of buildings in a given time period.Seller: The individual, group, company, or entity that sells a particular commercial real estate asset.SF: Abbreviation for Square Feet.Single-Tenant: Buildings that are occupied, or intended to be occupied by a single tenant. (See also: Build-to-suit and Tenancy)
Sublease Space: Space that has been leased by a tenant and is being offered for lease back to the market by the tenant with the lease obligation. Sublease space is sometimes referred to as sublet space.Submarkets: Specific geographic boundaries that serve to delin-eate a core group of buildings that are competitive with each other and constitute a generally accepted primary competitive set, or peer group. Submarkets are building type specific (office, industrial, retail, etc.), with distinct boundaries dependent on different factors relevant to each building type. Submarkets are non-overlapping, contiguous geographic designations having a cumulative sum that matches the boundaries of the Market they are located within (See also: Market).Suburban: The Suburban and Central Business District (CBD) des-ignations refer to a particular geographic area within a metropolitan statistical area (MSA). Suburban is defined as including all office inven-tory not located in the CBD. (See also: CBD)Tenancy: A term used to indicate whether or not a building is occu-pied by multiple tenants (See also: Multi-tenant) or a single tenant. (See also: Single-tenant)Tenant Rep: Tenant Rep stands for Tenant Representative. In a typical lease transaction between an owner/landlord and tenant, the broker that represents the interests of the tenant is referred to as a Tenant Rep.Time On Market: A measure of how long a currently available space has been marketed for lease, regardless of whether it is vacant or occupied.Under Construction: Buildings in a state of construction, up until they receive their certificate of occupancy. In order for CoStar to consider a building under construction, the site must have a concrete foundation in place. Abbreviated UC.Vacancy Rate: A measurement expressed as a percentage of the total amount of physically vacant space divided by the total amount of existing inventory. Under construction space generally is not included in vacancy calculations.Vacant Space: Space that is not currently occupied by a tenant, regardless of any lease obligation that may be on the space. Vacant space could be space that is either available or not available. For example, sublease space that is currently being paid for by a tenant but not occupied by that tenant, would be considered vacant space. Likewise, space that has been leased but not yet occupied because of finish work being done, would also be considered vacant space. Weighted Average Rental Rate: Rental rates that are cal-culated by factoring in, or weighting, the square footage associated with each particular rental rate. This has the effect of causing rental rates on larger spaces to affect the average more than that of smaller spaces. The weighted average rental rate is calculated by taking the ratio of the square footage associated with the rental rate on each individual available space to the square footage associated with rental rates on all available spaces, multiplying the rental rate by that ratio, and then adding together all the resulting numbers. Unless specifically specified otherwise, rental rate averages include both Direct and Sublet available spaces.Year Built: The year in which a building completed construction and was issued a certificate of occupancy.YTD: Abbreviation for Year-to-Date. Describes statistics that are cumulative from the beginning of a calendar year through whatever time period is being studied.

Buffalo/Niagara Falls Office Market
D The CoStar Office Report ©2015 CoStar Group, Inc.
Buffalo/Niagara Falls – Mid-Year 2015 Mid-Year 2015 – Buffalo/Niagara Falls
Buffalo/Niagara Falls Office Market
©2015 CoStar Group, Inc. The CoStar Office Report 1
Overview
Buffalo/Niagara Falls’s Vacancy Decreases to 9.8% Net Absorption Positive 290,132 SF in the Quarter
The Buffalo/Niagara Falls Office market ended the second quarter 2015 with a vacancy rate of 9.8%. The vacancy rate was down over the previous quarter, with
net absorption totaling positive 290,132 square feet in the sec-ond quarter. Vacant sublease space increased in the quarter, ending the quarter at 84,003 square feet. Rental rates ended the second quarter at $14.89, a decrease over the previous quarter. One building delivered to the market in the quarter totaling 335,000 square feet, with 536,650 square feet still under construction at the end of the quarter.
AbsorptionNet absorption for the overall Buffalo/Niagara Falls office
market was positive 290,132 square feet in the second quarter 2015. That compares to negative (8,456) square feet in the first quarter 2015, negative (27,405) square feet in the fourth quar-ter 2014, and positive 169,988 square feet in the third quarter 2014.
Tenants moving out of large blocks of space in 2015 include: Wendel Duschscherer moving out of 31,806 square feet at 140 John James Audubon Pky; and TDCC Development moving out of 15,682 square feet at 424 Main St.
Tenants moving into large blocks of space in 2015 include: Albany Molecular Research Inc moving into 46,000 square feet at 1001 Main St; Wendel Duschscherer moving into 31,806 square feet at 375 Essjay Rd; and Capstone Financial Group, Inc. moving into 17,335 square feet at 8600 Transit Rd.
The Class-A office market recorded net absorption of pos-itive 280,428 square feet in the second quarter 2015, compared to positive 21,799 square feet in the first quarter 2015, negative
(6,711) in the fourth quarter 2014, and positive 138,686 in the third quarter 2014.
The Class-B office market recorded net absorption of pos-itive 5,415 square feet in the second quarter 2015, compared to negative (10,933) square feet in the first quarter 2015, negative (4,233) in the fourth quarter 2014, and positive 42,952 in the third quarter 2014.
The Class-C office market recorded net absorption of positive 4,289 square feet in the second quarter 2015 com-pared to negative (19,322) square feet in the first quarter 2015, negative (16,461) in the fourth quarter 2014, and negative (11,650) in the third quarter 2014.
VacancyThe office vacancy rate in the Buffalo/Niagara Falls mar-
ket area decreased to 9.8% at the end of the second quarter 2015. The vacancy rate was 9.9% at the end of the first quarter 2015, and 10.0% at the end of the third and fourth quarters of 2014.
Class-A projects reported a vacancy rate of 13.5% at the end of the second quarter 2015, 13.4% at the end of the first quarter 2015, and 13.6% at the end of the third and fourth quarters of 2014.
Class-B projects reported a vacancy rate of 8.1% at the end of the second quarter 2015, and 8.4% at the end of the third quarter 2014 through the end of the first quarter 2015.
Class-C projects reported a vacancy rate of 9.2% at the end of the second quarter 2015, 9.5% at the end of first quarter 2015, 9.2% at the end of the fourth quarter 2014, and 9.7% at the end of the third quarter 2014.
Vacancy Rates by Class 2007-2015
Source: CoStar Property®
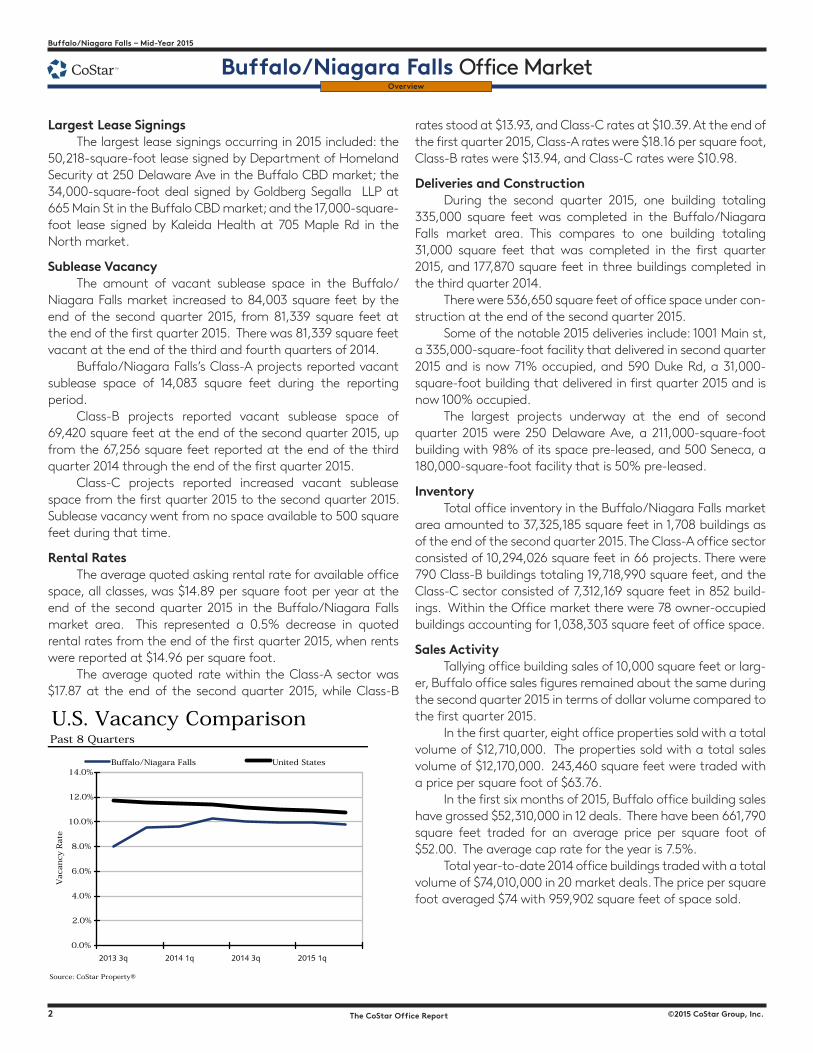
Absorption & Deliveries U.S. Vacancy ComparisonPast 8 Quarters Past 8 Quarters
Source: CoStar Property® Source: CoStar Property®
0%
2%
4%
6%
8%
10%
12%
14%
16%
2007 1q 2008 1q 2009 1q 2010 1q 2011 1q 2012 1q 2013 1q 2014 1q 2015 1q
Vaca
ncy
Rate
A B C Total Market
(0.01)
(0.56)
(0.02)
(0.09)
0.17
(0.03) (0.01)
0.29
0.00 0.00 0.01
0.16 0.18
0.000.03
0.34
(0.7)
(0.6)
(0.5)
(0.4)
(0.3)
(0.2)
(0.1)
0.0
0.1
0.2
0.3
0.4
2013 3q 2014 1q 2014 3q 2015 1q
Millions
SF
Net Absorption Deliveries
0.0%
2.0%
4.0%
6.0%
8.0%
10.0%
12.0%
14.0%
2013 3q 2014 1q 2014 3q 2015 1q
Vaca
ncy
Rate
Buffalo/Niagara Falls United States
2 The CoStar Office Report ©2015 CoStar Group, Inc.
Buffalo/Niagara Falls � Mid-Year 2015
Buffalo/Niagara Falls Office MarketMid-Year 2015 – Buffalo/Niagara Falls
Buffalo/Niagara Falls Office Market
©2015 CoStar Group, Inc. The CoStar Office Report 3
Overview
Largest Lease SigningsThe largest lease signings occurring in 2015 included: the
50,218-square-foot lease signed by Department of Homeland Security at 250 Delaware Ave in the Buffalo CBD market; the 34,000-square-foot deal signed by Goldberg Segalla LLP at 665 Main St in the Buffalo CBD market; and the 17,000-square-foot lease signed by Kaleida Health at 705 Maple Rd in the North market.
Sublease VacancyThe amount of vacant sublease space in the Buffalo/
Niagara Falls market increased to 84,003 square feet by the end of the second quarter 2015, from 81,339 square feet at the end of the first quarter 2015. There was 81,339 square feet vacant at the end of the third and fourth quarters of 2014.
Buffalo/Niagara Falls’s Class-A projects reported vacant sublease space of 14,083 square feet during the reporting period.
Class-B projects reported vacant sublease space of 69,420 square feet at the end of the second quarter 2015, up from the 67,256 square feet reported at the end of the third quarter 2014 through the end of the first quarter 2015.
Class-C projects reported increased vacant sublease space from the first quarter 2015 to the second quarter 2015. Sublease vacancy went from no space available to 500 square feet during that time.
Rental RatesThe average quoted asking rental rate for available office
space, all classes, was $14.89 per square foot per year at the end of the second quarter 2015 in the Buffalo/Niagara Falls market area. This represented a 0.5% decrease in quoted rental rates from the end of the first quarter 2015, when rents were reported at $14.96 per square foot.
The average quoted rate within the Class-A sector was $17.87 at the end of the second quarter 2015, while Class-B
rates stood at $13.93, and Class-C rates at $10.39. At the end of the first quarter 2015, Class-A rates were $18.16 per square foot, Class-B rates were $13.94, and Class-C rates were $10.98.
Deliveries and ConstructionDuring the second quarter 2015, one building totaling
335,000 square feet was completed in the Buffalo/Niagara Falls market area. This compares to one building totaling 31,000 square feet that was completed in the first quarter 2015, and 177,870 square feet in three buildings completed in the third quarter 2014.
There were 536,650 square feet of office space under con-struction at the end of the second quarter 2015.
Some of the notable 2015 deliveries include: 1001 Main st, a 335,000-square-foot facility that delivered in second quarter 2015 and is now 71% occupied, and 590 Duke Rd, a 31,000-square-foot building that delivered in first quarter 2015 and is now 100% occupied.
The largest projects underway at the end of second quarter 2015 were 250 Delaware Ave, a 211,000-square-foot building with 98% of its space pre-leased, and 500 Seneca, a 180,000-square-foot facility that is 50% pre-leased.
InventoryTotal office inventory in the Buffalo/Niagara Falls market
area amounted to 37,325,185 square feet in 1,708 buildings as of the end of the second quarter 2015. The Class-A office sector consisted of 10,294,026 square feet in 66 projects. There were 790 Class-B buildings totaling 19,718,990 square feet, and the Class-C sector consisted of 7,312,169 square feet in 852 build-ings. Within the Office market there were 78 owner-occupied buildings accounting for 1,038,303 square feet of office space.
Sales ActivityTallying office building sales of 10,000 square feet or larg-
er, Buffalo office sales figures remained about the same during the second quarter 2015 in terms of dollar volume compared to the first quarter 2015.
In the first quarter, eight office properties sold with a total volume of $12,710,000. The properties sold with a total sales volume of $12,170,000. 243,460 square feet were traded with a price per square foot of $63.76.
In the first six months of 2015, Buffalo office building sales have grossed $52,310,000 in 12 deals. There have been 661,790 square feet traded for an average price per square foot of $52.00. The average cap rate for the year is 7.5%.
Total year-to-date 2014 office buildings traded with a total volume of $74,010,000 in 20 market deals. The price per square foot averaged $74 with 959,902 square feet of space sold.
Vacancy Rates by Class 2007-2015
Source: CoStar Property®
Absorption & Deliveries U.S. Vacancy ComparisonPast 8 Quarters Past 8 Quarters
Source: CoStar Property® Source: CoStar Property®
0%
2%
4%
6%
8%
10%
12%
14%
16%
2007 1q 2008 1q 2009 1q 2010 1q 2011 1q 2012 1q 2013 1q 2014 1q 2015 1q
Vaca
ncy
Rate
A B C Total Market
(0.01)
(0.56)
(0.02)
(0.09)
0.17
(0.03) (0.01)
0.29
0.00 0.00 0.01
0.16 0.18
0.000.03
0.34
(0.7)
(0.6)
(0.5)
(0.4)
(0.3)
(0.2)
(0.1)
0.0
0.1
0.2
0.3
0.4
2013 3q 2014 1q 2014 3q 2015 1q
Millions
SF
Net Absorption Deliveries
0.0%
2.0%
4.0%
6.0%
8.0%
10.0%
12.0%
14.0%
2013 3q 2014 1q 2014 3q 2015 1q
Vaca
ncy
Rate
Buffalo/Niagara Falls United States

2 The CoStar Office Report ©2015 CoStar Group, Inc.
Buffalo/Niagara Falls � Mid-Year 2015
Buffalo/Niagara Falls Office MarketMid-Year 2015 – Buffalo/Niagara Falls
Buffalo/Niagara Falls Office Market
©2015 CoStar Group, Inc. The CoStar Office Report 3
Overview
The largest confirmed transactions of 2015 include: 1001 Main St in Buffalo, the 47,000 square foot condo that sold for $9,325,924 or $198.42 per square foot on 1/28/2015; 20-40 East Ave. 50 Main St and 111 Main St in Lockport, a 133,358 square foot portfolio that sold on 4/20/2015 for $3,780,000 or $28.34 per square foot; and 891 Delaware Ave, a 19,794 square foot property in Buffalo that traded for $1,325,000 or $66.94 per square foot on 1/27/2015.
Reports compiled by: Jeannine Dudzinski
Vacancy Rates by Class 2007-2015
Source: CoStar Property®
Absorption & Deliveries U.S. Vacancy ComparisonPast 8 Quarters Past 8 Quarters
Source: CoStar Property® Source: CoStar Property®
0%
2%
4%
6%
8%
10%
12%
14%
16%
2007 1q 2008 1q 2009 1q 2010 1q 2011 1q 2012 1q 2013 1q 2014 1q 2015 1q
Vaca
ncy
Rate
A B C Total Market
(0.01)
(0.56)
(0.02)
(0.09)
0.17
(0.03) (0.01)
0.29
0.00 0.00 0.01
0.16 0.18
0.000.03
0.34
(0.7)
(0.6)
(0.5)
(0.4)
(0.3)
(0.2)
(0.1)
0.0
0.1
0.2
0.3
0.4
2013 3q 2014 1q 2014 3q 2015 1q
Millions
SF
Net Absorption Deliveries
0.0%
2.0%
4.0%
6.0%
8.0%
10.0%
12.0%
14.0%
2013 3q 2014 1q 2014 3q 2015 1q
Vaca
ncy
Rate
Buffalo/Niagara Falls United States

4 The CoStar Office Report ©2015 CoStar Group, Inc.
Buffalo/Niagara Falls � Mid-Year 2015
Buffalo/Niagara Falls Office MarketMid-Year 2015 – Buffalo/Niagara Falls
Buffalo/Niagara Falls Office Market
©2015 CoStar Group, Inc. The CoStar Office Report 5
CoStar SubmarketsIn analyzing metropolitan areas, CoStar has developed geographic designations to help group properties together, called Markets, Submarket Clusters and Submarkets. Markets are the equivalent of metropolitan areas, or areas containing a large population nucleus, that together with adjacent communities have a high degree of economic and social integration. Markets are then divided into Submarket Clusters, which are core areas within a metropolitan area that are known to be competitive with each other in terms of attracting and keeping tenants. Markets are then further subdivided into smaller units called Submarkets, which serve to delineate a core group of buildings that are competitive with each other and constitute a generally accepted competitive set, or peer group.
Markets
Submarket Clusters
Buffalo CBD
East
Greater Buffalo
Niagara Falls
North
South

4 The CoStar Office Report ©2015 CoStar Group, Inc.
Buffalo/Niagara Falls � Mid-Year 2015
Buffalo/Niagara Falls Office MarketMid-Year 2015 – Buffalo/Niagara Falls
Buffalo/Niagara Falls Office Market
©2015 CoStar Group, Inc. The CoStar Office Report 5
Historical Deliveries 1982 - 2015
Source: CoStar Property® * Future deliveries based on current under construction buildings.
Construction Activity Markets Ranked by Under Construction Square Footage
# Bldgs Preleased SF Preleased % All Existing U/C
Buffalo CBD 1 206,780 98.0% 45,358 211,000
Greater Buffalo 1 90,000 50.0% 25,623 180,000
East 1 97,000 100.0% 16,494 97,000
North 1 36,650 100.0% 16,246 36,650
Niagara Falls 1 22,000 100.0% 18,669 22,000
South 0 0 0.0% 10,607 0
Totals 5 452,430 82.8% 21,853 109,330
Source: CoStar Property®
Recent Deliveries Future Deliveries Leased & Un-Leased SF in Deliveries Since 2011 Preleased & Un-Leased SF in Properties Scheduled to Deliver
Source: CoStar Property® Source: CoStar Property®
546,650
Market
Under Construction Inventory Average Bldg Size
Total RBA
211,000
180,000
97,000
36,650
22,000
0
0.1
0.6
0.4
0.3
0.4
0.7
1.0
0.8
1.3
0.30.3
0.6
0.1
0.2
0.4 0.4
0.60.5
0.1
0.5
0.8
0.2
0.40.4
0.3 0.3
0.8
0.2
0.0 0.0 0.0 0.0
0.4
0.9
0.0
0.2
0.4
0.6
0.8
1.0
1.2
1.4
1982 1986 1990 1994 1998 2002 2006 2010 2014
Millions
of
SF
Deliveries Average Delivered SF
0.0
0.1
0.1
0.2
0.2
0.3
0.3
0.4
0.4
2011 2013 2015
Millions
of
SF
Leased Un-Leased
0
50
100
150
200
250
300
2015 3q
T
Tho
usa
nds
of
SF
Preleased Un-Leased
Inventory & development

6 The CoStar Office Report ©2015 CoStar Group, Inc.
Buffalo/Niagara Falls � Mid-Year 2015
Buffalo/Niagara Falls Office MarketMid-Year 2015 – Buffalo/Niagara Falls
Buffalo/Niagara Falls Office Market
©2015 CoStar Group, Inc. The CoStar Office Report 7
Historical Construction Starts & DeliveriesSquare Footage Per Quarter Starting and Completing Construction
Source: CoStar Property®
Recent Deliveries by Project Size Breakdown of Year-to-Date Development Based on RBA of Project
Building Size # Bldgs RBA SF Leased % Leased Avg Rate Single-Tenant Multi-Tenant
< 50,000 SF 1 31,000 31,000 100.0% $0.00 31,000 0
50,000 SF - 99,999 SF 0 0 0 0.0% $0.00 0 0
100,000 SF - 249,999 SF 0 0 0 0.0% $0.00 0 0
250,000 SF - 499,999 SF 1 335,000 237,850 71.0% $0.00 0 335,000
>= 500,000 SF 0 0 0 0.0% $0.00 0 0
Source: CoStar Property®
Recent Development by Tenancy Existing Inventory ComparisonBased on RBA Developed for Single & Multi Tenant Use Based on Total RBA
2015 Deliveries
Source: CoStar Property® Source: CoStar Property®
Currently Under Construction By Class By Space Type
0.00 0.00 0.00
0.14
0.49
0.010.05
0.12
0.18
0.24
0.000.02
0.00
0.040.030.00 0.00 0.00 0.00
0.020.00 0.00 0.01
0.160.18
0.000.03
0.34
0.0
0.1
0.2
0.3
0.4
0.5
0.6
2012 1q 2013 1q 2014 1q 2015 1q
Millions
of
SF
Construction Starts Deliveries
78%
22%
Multi Single
92%
8%
Multi Single
20%
28%
52%
Class A Class B Class C
22%
78%
Multi Single
Inventory & development

6 The CoStar Office Report ©2015 CoStar Group, Inc.
Buffalo/Niagara Falls � Mid-Year 2015
Buffalo/Niagara Falls Office MarketMid-Year 2015 – Buffalo/Niagara Falls
Buffalo/Niagara Falls Office Market
©2015 CoStar Group, Inc. The CoStar Office Report 7
������������������������������ �������������������������������
������������������������
���� ����������������������� ���������������� ����������������� �������� ����������� ���������������� ������������������������� ������������������������������ ������������������������������� ���������������������������
��������������� ����������������������
���������������������� ����
���� ���������������������� ��������� ���������������� �������� ����������� ����������������� ������������������ ������������������������������� ������������������������������ �������������� ������������������������������������ ����
Inventory & development
���������������������������������������� �������������������������������
������������������������
���� ��������������������������� ���������������� ����������������� ��������� ������������ ���������������� ������������������������� ������������������������������� ������������������������������� ���������������������������������� ���������������������������������� ������������������
�����������
���� ��������������������� �������������������� ����������������� �������� ������������ ���������������� ��������������������� ������������������������������ ������������������������������ ����������������������������� ����������������������������� ����������������������������
����
���� ������������������������� ��������� ���������������� �������� ������������ ����������������� ������������������ ������������������������������� ������������������������������ ������������������������������������ ������������������������������������ ����
���� ����������������������� ���������� ���������������� �������� ������������ ����������������� ������������������ ������������������������������� ������������������������������� ����������������������
����������������������� ����������������������
����������������������� ����
���� ������������������������� ������������������ ���������������� �������� ������������ ����������������� ������������������ ������������������������������� ������������������������������� ������������������������������������� ������������������ ����

8 The CoStar Office Report ©2015 CoStar Group, Inc.
Buffalo/Niagara Falls � Mid-Year 2015
Buffalo/Niagara Falls Office MarketMid-Year 2015 – Buffalo/Niagara Falls
Buffalo/Niagara Falls Office Market
©2015 CoStar Group, Inc. The CoStar Office Report 9
Class A Market Statistics Mid-Year 2015
YTD Net YTD Under Quoted
Market # Blds Total RBA Direct SF Total SF Vac % Absorption Deliveries Const SF Rates
Buffalo CBD 26 6,057,393 1,189,448 1,192,626 19.7% 245,855 335,000 211,000 $17.80
East 21 1,902,392 61,556 61,556 3.2% 37,000 0 97,000 $20.90
Greater Buffalo 4 1,045,402 41,128 52,033 5.0% 19,372 0 180,000 $16.73
Niagara Falls 1 94,300 6,458 6,458 6.8% 0 0 22,000 $15.00
North 11 1,027,847 48,013 48,013 4.7% 0 0 36,650 $15.35
South 3 166,692 28,291 28,291 17.0% 0 0 0 $16.76
Totals 66 10,294,026 1,374,894 1,388,977 13.5% 302,227 335,000 546,650 $17.87
Source: CoStar Property®
Class B Market Statistics Mid-Year 2015
YTD Net YTD Under Quoted
Market # Blds Total RBA Direct SF Total SF Vac % Absorption Deliveries Const SF Rates
Buffalo CBD 171 6,857,357 470,666 476,905 7.0% (89,366) 0 0 $14.62
East 197 3,889,632 184,696 186,860 4.8% 68,389 31,000 0 $13.36
Greater Buffalo 59 1,807,107 164,573 164,573 9.1% 42,000 0 0 $9.47
Niagara Falls 24 925,797 96,394 96,394 10.4% 0 0 0 $14.47
North 227 4,570,527 469,481 521,998 11.4% 4,675 0 0 $14.37
South 112 1,668,570 134,081 142,581 8.5% (31,216) 0 0 $15.33
Totals 790 19,718,990 1,519,891 1,589,311 8.1% (5,518) 31,000 0 $13.93
Source: CoStar Property®
Class C Market Statistics Mid-Year 2015
YTD Net YTD Under Quoted
Market # Blds Total RBA Direct SF Total SF Vac % Absorption Deliveries Const SF Rates
Buffalo CBD 125 1,690,594 213,676 213,676 12.6% (21,850) 0 0 $13.13
East 239 1,745,666 74,711 75,211 4.3% 3,941 0 0 $11.19
Greater Buffalo 76 709,026 125,060 125,060 17.6% 905 0 0 $9.23
Niagara Falls 56 492,066 97,721 97,721 19.9% 11,933 0 0 $3.35
North 221 1,858,452 102,725 102,725 5.5% (3,938) 0 0 $11.63
South 135 816,365 55,421 55,421 6.8% (6,024) 0 0 $12.80
Totals 852 7,312,169 669,314 669,814 9.2% (15,033) 0 0 $10.39
Source: CoStar Property®
Total Office Market Statistics Mid-Year 2015
YTD Net YTD Under Quoted
Market # Blds Total RBA Direct SF Total SF Vac % Absorption Deliveries Const SF Rates
Buffalo CBD 322 14,605,344 1,873,790 1,883,207 12.9% 134,639 335,000 211,000 $16.72
East 457 7,537,690 320,963 323,627 4.3% 109,330 31,000 97,000 $14.43
Greater Buffalo 139 3,561,535 330,761 341,666 9.6% 62,277 0 180,000 $11.50
Niagara Falls 81 1,512,163 200,573 200,573 13.3% 11,933 0 22,000 $12.55
North 459 7,456,826 620,219 672,736 9.0% 737 0 36,650 $14.10
South 250 2,651,627 217,793 226,293 8.5% (37,240) 0 0 $14.57
Totals 1,708 37,325,185 3,564,099 3,648,102 9.8% 281,676 366,000 546,650 $14.89
Source: CoStar Property®
Vacancy
Existing Inventory Vacancy
Existing Inventory Vacancy
Existing Inventory
Existing Inventory Vacancy
Figures at a Glance

8 The CoStar Office Report ©2015 CoStar Group, Inc.
Buffalo/Niagara Falls � Mid-Year 2015
Buffalo/Niagara Falls Office MarketMid-Year 2015 – Buffalo/Niagara Falls
Buffalo/Niagara Falls Office Market
©2015 CoStar Group, Inc. The CoStar Office Report 9
Figures at a Glance
������������������������� ���������������� ������
������ ������ ��������� ��������� �������� ����� ���������� ������ ��������� ������ ��������� ������������ ��� ����������� ���������� ���������� ������ ��������� �� �������� �� �������� ���������������� ��� ���������� ���������� ���������� ������ �������� �� �� �� �������� ���������������� ��� ���������� ���������� ���������� ������ ��������� �� �� �� �������� ���������������� ��� ���������� ���������� ���������� ������ ��������� �� �������� �� �������� ���������������� ��� ���������� ���������� ���������� ������ ���������� �� �� �� �������� ���������������� ��� ���������� ���������� ���������� ������ ���������� �� �� �� �������� ���������������� ��� ���������� ���������� ���������� ������ ����������� �� �� �� �������� ���������������� ��� ���������� �������� �������� ����� �������� �� �� �� �������� ���������������� ��� ���������� �������� �������� ����� ������� �� �� �� �������� ���������������� ��� ���������� �������� �������� ����� ������� �� �� �� �������� ������������� ��� ���������� �������� �������� ����� �������� �� �� �� �������� ������������� ��� ���������� �������� �������� ����� �������� �� �� �� �� ������������� ��� ���������� �������� �������� ����� ���������� �� �� �� �� ������������� ��� ���������� �������� �������� ����� �������� �� ������� �� �� ������������� ��� ���������� �������� �������� ����� ��������� �� �������� �� ������� ������������� ��� ���������� �������� �������� ����� ����������� �� �������� �� �������� ���������
������������������������
������������������������� ���������������� ������
������ ������ ��������� ��������� �������� ����� ���������� ������ ��������� ������ ��������� ������������ ���� ����������� ���������� ���������� ����� ������� �� �� �� �� ���������������� ���� ����������� ���������� ���������� ����� ���������� �� ������� �� �� ���������������� ���� ����������� ���������� ���������� ����� ��������� �� �� �� ������� ���������������� ���� ����������� ���������� ���������� ����� �������� �� ������� �� ������� ���������������� ���� ����������� ���������� ���������� ����� �������� �� �������� �� ������� ���������������� ���� ����������� ���������� ���������� ����� �������� �� ������� �� �������� ���������������� ���� ����������� ���������� ���������� ����� ��������� �� �� �� �������� ���������������� ���� ����������� ���������� ���������� ����� �������� �� �� �� �������� ���������������� ���� ����������� ���������� ���������� ����� ���������� �� ������� �� �������� ���������������� ���� ����������� ���������� ���������� ����� ���������� �� �� �� �������� ������������� ���� ����������� ���������� ���������� ����� ��������� �� ������� �� �� ������������� ���� ����������� ���������� ���������� ����� ��������� �� ������� �� ������� ������������� ���� ����������� ���������� ���������� ������ ���������� �� ������� �� ������� ������������� ���� ����������� ���������� ���������� ������ ��������� �� �������� �� ������� ������������� ���� ����������� ���������� ���������� ������ ��������� �� �������� �� �������� ������������� ���� ����������� ���������� ���������� ������ ��������� �� �������� �� �������� ���������
������������������������
������������������������������ ���������������� ������
������ ������ ��������� ��������� �������� ����� ���������� ������ ��������� ������ ��������� ������������ ������ ����������� ���������� ���������� ����� ��������� �� �������� �� �������� ���������������� ������ ����������� ���������� ���������� ����� ��������� �� ������� �� �������� ���������������� ������ ����������� ���������� ���������� ������ ���������� �� �� �� �������� ���������������� ������ ����������� ���������� ���������� ������ ��������� �� �������� �� �������� ���������������� ������ ����������� ���������� ���������� ������ ���������� �� �������� �� ���������� ���������������� ������ ����������� ���������� ���������� ����� ���������� �� ������� �� �������� ���������������� ������ ����������� ���������� ���������� ����� ����������� �� �� �� �������� ���������������� ������ ����������� ���������� ���������� ����� ��������� �� �� �� �������� ���������������� ������ ����������� ���������� ���������� ����� ����� �� ������� �� �������� ���������������� ������ ����������� ���������� ���������� ����� ���������� �� �� �� �������� ������������� ������ ����������� ���������� ���������� ����� ��������� �� ������� �� �������� ������������� ������ ����������� ���������� ���������� ����� ��������� �� ������� �� ������� ������������� ������ ����������� ���������� ���������� ����� ���������� �� ������� �� ������� ������������� ������ ����������� ���������� ���������� ����� ��������� �� �������� �� ������� ������������� ������ ����������� ���������� ���������� ����� ��������� ��� �������� �� �������� ������������� ������ ����������� ���������� ���������� ����� ��������� ��� �������� ��� �������� ���������
������������������������
������������������ ������� ���������� ������������
������������������ ������� ���������� ������������
������������������ ������� ���������� ������������

10 The CoStar Office Report ©2015 CoStar Group, Inc.
Buffalo/Niagara Falls � Mid-Year 2015
Buffalo/Niagara Falls Office MarketMid-Year 2015 – Buffalo/Niagara Falls
Buffalo/Niagara Falls Office Market
©2015 CoStar Group, Inc. The CoStar Office Report 11
Historical Rental RatesBased on Full-Service Equivalent Rental Rates
Source: CoStar Property®
Vacancy by Available Space Type Vacancy by ClassPercent of All Vacant Space in Direct vs. Sublet Percent of All Vacant Space by Class
Source: CoStar Property® Source: CoStar Property®
U.S. Rental Rate Comparison Future Space AvailableBased on Full-Service Equivalent Rental Rates Space Scheduled to be Available for Occupancy*
Source: CoStar Property® * Includes Under Construction Spaces Source: CoStar Property®
Buffalo/Niagara Falls United States Buffalo/Niagara Falls United States
$0.00
$5.00
$10.00
$15.00
$20.00
$25.00
2007
1q
2008
1q
2009
1q
2010
1q
2011
1q
2012
1q
2013 1q
2014 1q
2015 1q
A B C Total Market
$0.00
$5.00
$10.00
$15.00
$20.00
$25.00
2013 3q 2014 3q
Buffalo/Niagara Falls United States
98%
2%
Direct Sublet
96%
4%
Direct Sublet
38%44%
18%
Class A Class B Class C
0.28
0.00
0.04
0.00 0.00 0.000.0
0.1
0.1
0.2
0.2
0.3
0.3
2015 3q 2016 1q 2016 3q
16%
49% 35%
Class A Class B Class C
Leasing Activity

10 The CoStar Office Report ©2015 CoStar Group, Inc.
Buffalo/Niagara Falls � Mid-Year 2015
Buffalo/Niagara Falls Office MarketMid-Year 2015 – Buffalo/Niagara Falls
Buffalo/Niagara Falls Office Market
©2015 CoStar Group, Inc. The CoStar Office Report 11
Leasing Activity
Source: CoStar Property®
* Renewal
Building Submarket SF Qtr Tenant Name Tenant Rep Company Landlord Rep Company
1 250 Delaware Ave Bu�alo CBD 50,218 1st Department of Homeland Security N/A Uniland Development Co.
2 665 Main St* Bu�alo CBD 34,000 2nd Goldberg Segalla LLP N/A McGuire Development Company
3 705 Maple Rd North 17,000 1st Kaleida Health N/A Benderson Dev Co, LLC
4 500 Seneca Greater Bu�alo 13,000 2nd Liberty Mutual Corp. N/A Savarino Companies
5 250 Delaware Ave Bu�alo CBD 12,000 1st KeyBank N/A Uniland Development Co.
6 5214 Main St North 10,000 1st N/A N/A CBRE Bu�alo
7 369 Washington St Bu�alo CBD 7,000 2nd M&T Bank N/A IS Lofts
8 90 Bryant Woods S North 3,900 1st Software Solutions Group Inc N/A RealtyUSA
9 2805 Wehrle Dr East 2,604 1st Lisa J Allen PLLC N/A North Forest O�ce Providers
10 2821 Wehrle Dr East 2,604 1st N/A N/A North Forest O�ce Providers
11 2390 N Forest Rd North 2,556 1st Kanoodle.com, Inc. N/A North Forest O�ce Providers
12 6779 Main St East 2,500 1st N/A N/A Coldwell Banker Comm Meridian
13 168-170 Franklin St Bu�alo CBD 2,400 1st N/A N/A Ellicott Development
14 500 Bu�alo Rd South 2,300 2nd Awakenings N/A N/A
15 250 Delaware Ave Bu�alo CBD 2,000 2nd The Cullen Foundation N/A Uniland Development Co.
16 2805 Wehrle Dr East 1,953 1st Bu�alo Computer Help N/A North Forest O�ce Providers
17 601 Division St North 1,880 2nd Andrzejewski Agency, Inc. N/A Coldwell Banker Comm Meridian
18 437 Franklin St Bu�alo CBD 1,750 1st N/A N/A Sinatra and Company
19 3457 Clinton St South 1,722 2nd N/A N/A Pyramid Brokerage Company
20 5762 Main St East 1,500 2nd Partners N/A Giammusso Development, Inc.
Select Top O�ce Leases Based on Leased Square Footage For Deals Signed in 2015

12 The CoStar Office Report ©2015 CoStar Group, Inc.
Buffalo/Niagara Falls – Mid-Year 2015
Buffalo/Niagara Falls Office MarketMarket Highlights – Class “A, B & C”
©2015 CoStar Group, Inc. The CoStar Office Report 13
Mid-Year 2015 – Buffalo/Niagara Falls
Buffalo/Niagara Falls Office MarketMarket Highlights – Class “A, B & C”
B u f f a l o C B D M a r k e t
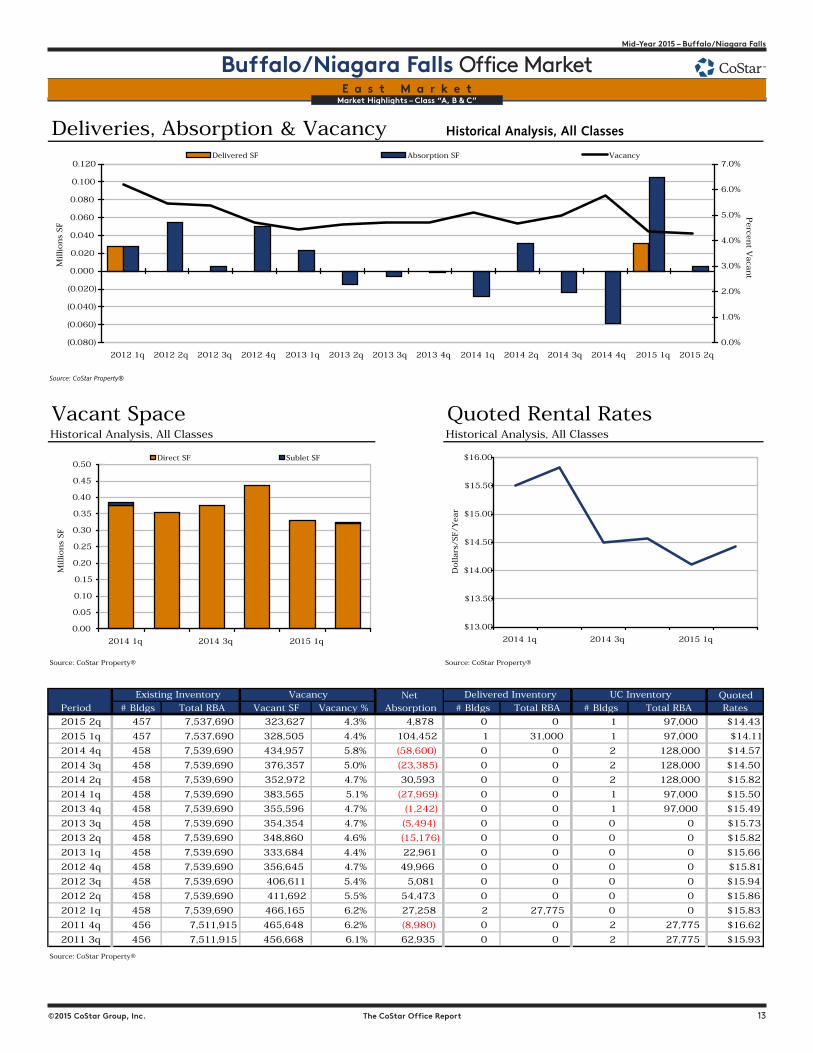
Deliveries, Absorption & Vacancy Historical Analysis, All Classes
Source: CoStar Property®
Vacant Space Quoted Rental RatesHistorical Analysis, All Classes Historical Analysis, All Classes
Source: CoStar Property® Source: CoStar Property®
Net QuotedPeriod # Bldgs Total RBA Vacant SF Vacancy % Absorption # Bldgs Total RBA # Bldgs Total RBA Rates
2015 2q 322 14,605,344 1,883,207 12.9% 253,409 1 335,000 1 211,000 $16.72
2015 1q 323 14,348,671 1,879,943 13.1% (118,770) 0 0 2 546,000 $17.03
2014 4q 324 14,365,771 1,778,273 12.4% (11,061) 0 0 2 546,000 $16.81
2014 3q 326 14,425,771 1,827,212 12.7% 141,039 1 139,000 2 546,000 $16.52
2014 2q 325 14,286,771 1,829,251 12.8% (20,002) 1 28,500 3 685,000 $16.53
2014 1q 324 14,258,271 1,780,749 12.5% (5,270) 0 0 3 502,500 $16.94
2013 4q 324 14,258,271 1,775,479 12.5% (770,182) 0 0 3 502,500 $16.18
2013 3q 324 14,258,271 1,005,297 7.1% (41,701) 0 0 3 502,500 $16.44
2013 2q 324 14,258,271 963,596 6.8% (456) 0 0 2 474,000 $16.47
2013 1q 324 14,258,271 963,140 6.8% (3,140) 0 0 2 474,000 $16.81
2012 4q 324 14,258,271 960,000 6.7% 42,961 0 0 1 139,000 $16.15
2012 3q 324 14,258,271 1,002,961 7.0% 37,560 0 0 0 0 $16.53
2012 2q 324 14,258,271 1,040,521 7.3% 19,985 0 0 0 0 $16.63
2012 1q 324 14,258,271 1,060,506 7.4% (53,547) 0 0 0 0 $17.23
2011 4q 324 14,258,271 1,006,959 7.1% 16,419 0 0 0 0 $15.80
2011 3q 324 14,258,271 1,023,378 7.2% 4,555 0 0 0 0 $16.40
Source: CoStar Property®
UC InventoryDelivered InventoryExisting Inventory Vacancy
(1.000)
(0.800)
(0.600)
(0.400)
(0.200)
0.000
0.200
0.400
2012 1q 2012 2q 2012 3q 2012 4q 2013 1q 2013 2q 2013 3q 2013 4q 2014 1q 2014 2q 2014 3q 2014 4q 2015 1q 2015 2q
Millions
SF
0.0%
2.0%
4.0%
6.0%
8.0%
10.0%
12.0%
14.0%
Perce
nt V
aca
nt
Delivered SF Absorption SF Vacancy
$16.20
$16.30
$16.40
$16.50
$16.60
$16.70
$16.80
$16.90
$17.00
$17.10
2014 1q 2014 3q 2015 1q
Dollars
/SF/Y
ear
1.70
1.72
1.74
1.76
1.78
1.80
1.82
1.84
1.86
1.88
1.90
2014 1q 2014 3q 2015 1q
Millions
SF
Direct SF Sublet SF
12 The CoStar Office Report ©2015 CoStar Group, Inc.
Buffalo/Niagara Falls – Mid-Year 2015
Buffalo/Niagara Falls Office MarketMarket Highlights – Class “A, B & C”
©2015 CoStar Group, Inc. The CoStar Office Report 13
Mid-Year 2015 – Buffalo/Niagara Falls
Buffalo/Niagara Falls Office MarketMarket Highlights – Class “A, B & C”E a s t M a r k e t
Deliveries, Absorption & Vacancy Historical Analysis, All Classes
Source: CoStar Property®
Vacant Space Quoted Rental RatesHistorical Analysis, All Classes Historical Analysis, All Classes
Source: CoStar Property® Source: CoStar Property®
Net QuotedPeriod # Bldgs Total RBA Vacant SF Vacancy % Absorption # Bldgs Total RBA # Bldgs Total RBA Rates
2015 2q 457 7,537,690 323,627 4.3% 4,878 0 0 1 97,000 $14.43
2015 1q 457 7,537,690 328,505 4.4% 104,452 1 31,000 1 97,000 $14.11
2014 4q 458 7,539,690 434,957 5.8% (58,600) 0 0 2 128,000 $14.57
2014 3q 458 7,539,690 376,357 5.0% (23,385) 0 0 2 128,000 $14.50
2014 2q 458 7,539,690 352,972 4.7% 30,593 0 0 2 128,000 $15.82
2014 1q 458 7,539,690 383,565 5.1% (27,969) 0 0 1 97,000 $15.50
2013 4q 458 7,539,690 355,596 4.7% (1,242) 0 0 1 97,000 $15.49
2013 3q 458 7,539,690 354,354 4.7% (5,494) 0 0 0 0 $15.73
2013 2q 458 7,539,690 348,860 4.6% (15,176) 0 0 0 0 $15.82
2013 1q 458 7,539,690 333,684 4.4% 22,961 0 0 0 0 $15.66
2012 4q 458 7,539,690 356,645 4.7% 49,966 0 0 0 0 $15.81
2012 3q 458 7,539,690 406,611 5.4% 5,081 0 0 0 0 $15.94
2012 2q 458 7,539,690 411,692 5.5% 54,473 0 0 0 0 $15.86
2012 1q 458 7,539,690 466,165 6.2% 27,258 2 27,775 0 0 $15.83
2011 4q 456 7,511,915 465,648 6.2% (8,980) 0 0 2 27,775 $16.62
2011 3q 456 7,511,915 456,668 6.1% 62,935 0 0 2 27,775 $15.93
Source: CoStar Property®
UC InventoryDelivered InventoryExisting Inventory Vacancy
(0.080)
(0.060)
(0.040)
(0.020)
0.000
0.020
0.040
0.060
0.080
0.100
0.120
2012 1q 2012 2q 2012 3q 2012 4q 2013 1q 2013 2q 2013 3q 2013 4q 2014 1q 2014 2q 2014 3q 2014 4q 2015 1q 2015 2q
Millions
SF
0.0%
1.0%
2.0%
3.0%
4.0%
5.0%
6.0%
7.0%
Perce
nt V
aca
nt
Delivered SF Absorption SF Vacancy
$13.00
$13.50
$14.00
$14.50
$15.00
$15.50
$16.00
2014 1q 2014 3q 2015 1q
Dollars
/SF/Y
ear
0.00
0.05
0.10
0.15
0.20
0.25
0.30
0.35
0.40
0.45
0.50
2014 1q 2014 3q 2015 1q
Millions
SF
Direct SF Sublet SF

14 The CoStar Office Report ©2015 CoStar Group, Inc.
Buffalo/Niagara Falls – Mid-Year 2015
Buffalo/Niagara Falls Office MarketMarket Highlights – Class “A, B & C”
©2015 CoStar Group, Inc. The CoStar Office Report 15
Mid-Year 2015 – Buffalo/Niagara Falls
Buffalo/Niagara Falls Office MarketMarket Highlights – Class “A, B & C”
G r e a t e r B u f f a l o M a r k e t
Deliveries, Absorption & Vacancy Historical Analysis, All Classes
Source: CoStar Property®
Vacant Space Quoted Rental RatesHistorical Analysis, All Classes Historical Analysis, All Classes
Source: CoStar Property® Source: CoStar Property®
Net QuotedPeriod # Bldgs Total RBA Vacant SF Vacancy % Absorption # Bldgs Total RBA # Bldgs Total RBA Rates
2015 2q 139 3,561,535 341,666 9.6% 55,777 0 0 1 180,000 $11.50
2015 1q 139 3,561,535 397,443 11.2% 6,500 0 0 1 180,000 $9.18
2014 4q 139 3,561,535 403,943 11.3% (5,610) 0 0 1 180,000 $9.57
2014 3q 139 3,561,535 398,333 11.2% (18,937) 0 0 1 180,000 $9.12
2014 2q 140 3,628,115 445,976 12.3% (115,571) 1 135,000 1 180,000 $8.63
2014 1q 139 3,493,115 195,405 5.6% 5,222 0 0 2 315,000 $8.52
2013 4q 139 3,493,115 200,627 5.7% 167,333 0 0 1 135,000 $8.25
2013 3q 139 3,493,115 367,960 10.5% (18,420) 0 0 1 135,000 $8.43
2013 2q 139 3,493,115 349,540 10.0% 7,728 0 0 1 135,000 $8.86
2013 1q 139 3,493,115 357,268 10.2% (1,964) 0 0 1 135,000 $8.79
2012 4q 139 3,493,115 355,304 10.2% 183 0 0 0 0 $8.87
2012 3q 139 3,493,115 355,487 10.2% (1,451) 0 0 0 0 $8.48
2012 2q 139 3,493,115 354,036 10.1% 46,476 0 0 0 0 $8.79
2012 1q 139 3,493,115 400,512 11.5% 4,069 0 0 0 0 $8.88
2011 4q 139 3,493,115 404,581 11.6% (6,400) 0 0 0 0 $9.19
2011 3q 139 3,493,115 398,181 11.4% 41,700 0 0 0 0 $9.22
Source: CoStar Property®
UC InventoryDelivered InventoryExisting Inventory Vacancy
(0.150)
(0.100)
(0.050)
0.000
0.050
0.100
0.150
0.200
2012 1q 2012 2q 2012 3q 2012 4q 2013 1q 2013 2q 2013 3q 2013 4q 2014 1q 2014 2q 2014 3q 2014 4q 2015 1q 2015 2q
Millions
SF
0.0%
2.0%
4.0%
6.0%
8.0%
10.0%
12.0%
14.0%
Perce
nt V
aca
nt
Delivered SF Absorption SF Vacancy
$0.00
$2.00
$4.00
$6.00
$8.00
$10.00
$12.00
$14.00
2014 1q 2014 3q 2015 1q
Dollars
/SF/Y
ear
0.00
0.05
0.10
0.15
0.20
0.25
0.30
0.35
0.40
0.45
0.50
2014 1q 2014 3q 2015 1q
Millions
SF
Direct SF Sublet SF

14 The CoStar Office Report ©2015 CoStar Group, Inc.
Buffalo/Niagara Falls – Mid-Year 2015
Buffalo/Niagara Falls Office MarketMarket Highlights – Class “A, B & C”
©2015 CoStar Group, Inc. The CoStar Office Report 15
Mid-Year 2015 – Buffalo/Niagara Falls
Buffalo/Niagara Falls Office MarketMarket Highlights – Class “A, B & C”
N i a g a r a F a l l s M a r k e t
Deliveries, Absorption & Vacancy Historical Analysis, All Classes
Source: CoStar Property®
Vacant Space Quoted Rental RatesHistorical Analysis, All Classes Historical Analysis, All Classes
Source: CoStar Property® Source: CoStar Property®
Net QuotedPeriod # Bldgs Total RBA Vacant SF Vacancy % Absorption # Bldgs Total RBA # Bldgs Total RBA Rates
2015 2q 81 1,512,163 200,573 13.3% 7,100 0 0 1 22,000 $12.55
2015 1q 81 1,512,163 207,673 13.7% 4,833 0 0 1 22,000 $13.66
2014 4q 81 1,512,163 212,506 14.1% 0 0 0 1 22,000 $12.26
2014 3q 81 1,512,163 212,506 14.1% (33,873) 0 0 0 0 $12.26
2014 2q 81 1,512,163 178,633 11.8% (3,580) 0 0 0 0 $12.56
2014 1q 81 1,512,163 175,053 11.6% (20,000) 0 0 0 0 $13.68
2013 4q 81 1,512,163 155,053 10.3% 1,000 0 0 0 0 $13.70
2013 3q 81 1,512,163 156,053 10.3% 600 0 0 0 0 $13.73
2013 2q 81 1,512,163 156,653 10.4% (7,747) 0 0 0 0 $11.83
2013 1q 81 1,512,163 148,906 9.8% (12,830) 0 0 0 0 $10.65
2012 4q 81 1,512,163 136,076 9.0% 3,304 0 0 0 0 $10.72
2012 3q 81 1,512,163 139,380 9.2% (15,932) 0 0 0 0 $10.30
2012 2q 81 1,512,163 123,448 8.2% (10,410) 0 0 0 0 $10.79
2012 1q 81 1,512,163 113,038 7.5% 9,232 0 0 0 0 $10.64
2011 4q 81 1,512,163 122,270 8.1% (11,298) 0 0 0 0 $10.56
2011 3q 81 1,512,163 110,972 7.3% 15,700 0 0 0 0 $10.23
Source: CoStar Property®
UC InventoryDelivered InventoryExisting Inventory Vacancy
(0.040)
(0.035)
(0.030)
(0.025)
(0.020)
(0.015)
(0.010)
(0.005)
0.000
0.005
0.010
0.015
2012 1q 2012 2q 2012 3q 2012 4q 2013 1q 2013 2q 2013 3q 2013 4q 2014 1q 2014 2q 2014 3q 2014 4q 2015 1q 2015 2q
Millions
SF
0.0%
2.0%
4.0%
6.0%
8.0%
10.0%
12.0%
14.0%
16.0%
Perce
nt V
aca
nt
Delivered SF Absorption SF Vacancy
$11.50
$12.00
$12.50
$13.00
$13.50
$14.00
2014 1q 2014 3q 2015 1q
Dollars
/SF/Y
ear
0.00
0.05
0.10
0.15
0.20
0.25
2014 1q 2014 3q 2015 1q
Millions
SF
Direct SF Sublet SF

16 The CoStar Office Report ©2015 CoStar Group, Inc.
Buffalo/Niagara Falls – Mid-Year 2015
Buffalo/Niagara Falls Office MarketMarket Highlights – Class “A, B & C”
©2015 CoStar Group, Inc. The CoStar Office Report 17
Mid-Year 2015 – Buffalo/Niagara Falls
Buffalo/Niagara Falls Office MarketMarket Highlights – Class “A, B & C”
N o r t h M a r k e t
Deliveries, Absorption & Vacancy Historical Analysis, All Classes
Source: CoStar Property®
Vacant Space Quoted Rental RatesHistorical Analysis, All Classes Historical Analysis, All Classes
Source: CoStar Property® Source: CoStar Property®
Net QuotedPeriod # Bldgs Total RBA Vacant SF Vacancy % Absorption # Bldgs Total RBA # Bldgs Total RBA Rates
2015 2q 459 7,456,826 672,736 9.0% 6,940 0 0 1 36,650 $14.10
2015 1q 459 7,456,826 679,676 9.1% (6,203) 0 0 0 0 $14.20
2014 4q 459 7,456,826 673,473 9.0% 48,362 0 0 0 0 $14.26
2014 3q 459 7,456,826 721,835 9.7% 51,017 2 38,870 0 0 $15.41
2014 2q 457 7,417,956 733,982 9.9% 15,478 0 0 2 38,870 $14.53
2014 1q 458 7,419,246 750,750 10.1% 29,904 0 0 2 38,870 $14.59
2013 4q 458 7,419,246 780,654 10.5% 41,965 0 0 2 38,870 $14.54
2013 3q 458 7,419,246 822,619 11.1% 66,028 0 0 1 18,870 $15.67
2013 2q 458 7,419,246 888,647 12.0% (14,902) 1 20,000 0 0 $14.75
2013 1q 457 7,399,246 853,745 11.5% (76,973) 0 0 1 20,000 $14.92
2012 4q 457 7,399,246 776,772 10.5% (17,281) 0 0 0 0 $14.91
2012 3q 457 7,399,246 759,491 10.3% (5,554) 0 0 0 0 $15.36
2012 2q 457 7,399,246 753,937 10.2% 7,485 0 0 0 0 $14.60
2012 1q 457 7,399,246 761,422 10.3% 12,392 0 0 0 0 $14.68
2011 4q 457 7,399,246 773,814 10.5% (37,605) 0 0 0 0 $14.27
2011 3q 457 7,399,246 736,209 9.9% 109,074 0 0 0 0 $14.71
Source: CoStar Property®
UC InventoryDelivered InventoryExisting Inventory Vacancy
(0.100)
(0.080)
(0.060)
(0.040)
(0.020)
0.000
0.020
0.040
0.060
0.080
2012 1q 2012 2q 2012 3q 2012 4q 2013 1q 2013 2q 2013 3q 2013 4q 2014 1q 2014 2q 2014 3q 2014 4q 2015 1q 2015 2q
Millions
SF
0.0%
2.0%
4.0%
6.0%
8.0%
10.0%
12.0%
14.0%
Perce
nt V
aca
nt
Delivered SF Absorption SF Vacancy
$13.00
$13.50
$14.00
$14.50
$15.00
$15.50
$16.00
2014 1q 2014 3q 2015 1q
Dollars
/SF/Y
ear
0.00
0.10
0.20
0.30
0.40
0.50
0.60
0.70
0.80
2014 1q 2014 3q 2015 1q
Millions
SF
Direct SF Sublet SF

16 The CoStar Office Report ©2015 CoStar Group, Inc.
Buffalo/Niagara Falls – Mid-Year 2015
Buffalo/Niagara Falls Office MarketMarket Highlights – Class “A, B & C”
©2015 CoStar Group, Inc. The CoStar Office Report 17
Mid-Year 2015 – Buffalo/Niagara Falls
Buffalo/Niagara Falls Office MarketMarket Highlights – Class “A, B & C”S o u t h M a r k e t
Deliveries, Absorption & Vacancy Historical Analysis, All Classes
Source: CoStar Property®
Vacant Space Quoted Rental RatesHistorical Analysis, All Classes Historical Analysis, All Classes
Source: CoStar Property® Source: CoStar Property®
Net QuotedPeriod # Bldgs Total RBA Vacant SF Vacancy % Absorption # Bldgs Total RBA # Bldgs Total RBA Rates
2015 2q 250 2,651,627 226,293 8.5% (37,972) 0 0 0 0 $14.57
2015 1q 250 2,651,627 188,321 7.1% 732 0 0 0 0 $14.34
2014 4q 251 2,657,627 195,053 7.3% (496) 0 0 0 0 $15.10
2014 3q 251 2,657,627 194,557 7.3% 54,127 0 0 0 0 $13.97
2014 2q 251 2,657,627 248,684 9.4% 2,890 0 0 0 0 $13.64
2014 1q 251 2,657,627 251,574 9.5% 2,865 1 13,020 0 0 $13.42
2013 4q 250 2,644,607 241,419 9.1% (885) 0 0 1 13,020 $15.08
2013 3q 250 2,644,607 240,534 9.1% (8,142) 0 0 1 13,020 $14.19
2013 2q 250 2,644,607 232,392 8.8% 30,693 0 0 1 13,020 $13.72
2013 1q 250 2,644,607 263,085 9.9% 30,796 0 0 0 0 $13.72
2012 4q 250 2,644,607 293,881 11.1% (5,740) 0 0 0 0 $14.49
2012 3q 250 2,644,607 288,141 10.9% 2,267 0 0 0 0 $14.89
2012 2q 250 2,644,607 290,408 11.0% 8,975 0 0 0 0 $14.74
2012 1q 250 2,644,607 299,383 11.3% 9,710 0 0 0 0 $15.83
2011 4q 250 2,644,607 309,093 11.7% 17,177 0 0 0 0 $16.92
2011 3q 250 2,644,607 326,270 12.3% (13,684) 0 0 0 0 $15.16
Source: CoStar Property®
UC InventoryDelivered InventoryExisting Inventory Vacancy
(0.060)
(0.040)
(0.020)
0.000
0.020
0.040
0.060
2012 1q 2012 2q 2012 3q 2012 4q 2013 1q 2013 2q 2013 3q 2013 4q 2014 1q 2014 2q 2014 3q 2014 4q 2015 1q 2015 2q
Millions
SF
0.0%
2.0%
4.0%
6.0%
8.0%
10.0%
12.0%
Perce
nt V
aca
nt
Delivered SF Absorption SF Vacancy
$12.50
$13.00
$13.50
$14.00
$14.50
$15.00
$15.50
2014 1q 2014 3q 2015 1q
Dollars
/SF/Y
ear
0.00
0.05
0.10
0.15
0.20
0.25
0.30
2014 1q 2014 3q 2015 1q
Millions
SF
Direct SF Sublet SF