Embed Size (px)
Citation preview
Cost versus Control: Understanding Ownership
Through Outsourcing in Hospitals.
Christina Marsh Dalton∗ Patrick L. Warren†
January 25, 2016
Abstract
For-profit hospitals in California contract out services much more intensely than either
private nonprofit or public hospitals. To explain why, we build a model in which the
outsourcing decision is a trade-off between cost and control. Since nonprofit firms
are more restricted in how they consume net revenues, they experience more rapidly
diminishing value of a dollar saved, and they are less attracted to a low-cost but low-
control outsourcing opportunity than a for-profit firm is. This difference is exaggerated
in services where the benefits of controlling the details of production are particularly
important but minimized when a fixed-cost shock raises the marginal value of a dollar
of cost savings. We test these predictions in a panel of California hospitals, finding
evidence for each and that the set of services that private non-profits are particularly
interested in controlling (physician-intensive services) is very different from those than
public hospitals are particularly interested in (labor-intensive services). These results
suggest that a model of public or nonprofit make-or-buy decisions should be more than
a simple relabeling of a model derived in the for-profit context.
JEL Classification: I11, L24, L33
Keywords: Hospitals, Make-or-Buy, Public versus Private, Nonprofit Firm Behavior
∗Wake Forest University, 204B Kirby Hall, Winston-Salem, NC 27109. Email:[email protected]†John E. Walker Department of Economics, Clemson University, 222 Sirrine Hall, Clemson, SC 29634.
E-mail: [email protected]. We have received very useful feedback from Tom Chang, MireilleJacobson, Richard Lindrooth, Jens Prufer, Michael Vlassopoulos and seminar participants at AppalachianState University, the Department of Justice, Clemson IO Workshop, UNC Chapel Hill, University of SouthCarolina, SEA2012, ISNIE/ESNIE 2012, and ASSA 2013.
1

If you want a thing done well, do it yourself. - Napoleon Bonaparte
1 Introduction
An important decision faced by any organization is which activities it will engage in itself and
which it will outsource. While for-profit firms’ outsourcing decisions are (relatively) well-
understood (Lafontaine and Slade 2007), little is known about how nonprofit and public firms
make these decisions. The outsourcing decision provides insight into the nonprofit sector,
in particular, because the nonprofit may be ceding control to a firm less likely to share its
mission. Research on hospital ownership often treats all service provision as within the firm,
but rising costs make outsourcing attractive in the health care industry. In this paper, we
analyze the make-or-buy decisions of public, nonprofit, and for-profit California hospitals,
demonstrate robust differences among ownership types, and provide both a theoretically-
grounded explanation for these ownership differences and tests of the proposed mechanism.
For-profit, nonprofit, and public hospitals in California vary significantly in the extent
to which they outsource service provision. During 1996-2008, for-profit short-term general-
care hospitals in California outsourced 25.7 percent of the non-physician costs of an average
service to outside providers.1 Nonprofits outsourced much less, 18.9 percent of the non-
physician costs of an average service, across a range of both medical and administrative
services. Balakrishnan, Eldenburg, Krishnan and Soderstrom (2010) show that these dif-
ferences in average outsourcing rates are robust to a number of controls for hospital and
market characteristics. Given the size of the hospital industry and continued health expen-
diture growth, these outsourcing levels are also economically important.
To analyze the differences in outsourcing among ownership types, we extend the model of
nonprofit entrepreneurship by Glaeser and Shleifer (2001) to include an outsourcing decision.
We assume that managers not only place value on net income (profits) but also place some
value on controlling the exact manner in which a service is performed, either for their own
intrinsic reasons, organizational incentives, or due to influence from some interest group
(e.g. elite workers). When outsourcing is cheaper, control must be balanced against cost-
minimization. Does a manager want more control or lower costs? In our model, managers
in nonprofit firms have more rapidly diminishing marginal value of cost savings, because
they are restricted in how they can use excess income (spending must be consistent with the
hospital’s nonprofit justification), and this restriction induces them to put different weights
1The outsourcing rate is roughly defined as the percent of the total direct costs of a service which arefrom contracts with outside service providers. This is fully defined in Section 3.
2

on these two characteristics than for-profit managers do. Coupled with an assumption that
the outside producer has a comparative advantage in low-cost and low-control production,
the assumption that the marginal unrestricted dollar of excess income has higher value than
a restricted dollar implies that outsourcing is more attractive to managers of for-profit firms
than similarly-situated nonprofit firms. These outsourcing differences are amplified when
control over the manner of production is particularly important and dampened when a
fixed-cost shock lowers net incomes.
We test these predictions on data from California hospitals with service-specific outsourc-
ing measures and market characteristics over the period 1996-2008. For-profits outsource
consistently more than private nonprofits, and public hospitals outsource even less than pri-
vate nonprofits. These results are robust to the inclusion of controls for hospital size and
scope, service-specific output, presence of a residency program, market characteristics, as
well as service, year, and county fixed effects.
To investigate the importance of control, we divide hospital services into classes of dif-
ferential managerial concern. For example, if elite workers are influential, controlling the
manner of production in physician-intensive services like cardiology or emergency services
may be more important, as compared to services that have little or no physician labor,
like groundskeeping or parking. We also highlight labor-intensive services, since control of
these services may be salient for public managers. We classify services as labor/physician
intense by measuring the share of physician or labor costs as a percent of total direct costs
within that service. Our prediction is that outsourcing differences should be most marked
for services where control is particularly important to the manager. In line with this pre-
diction, outsourcing differences between private nonprofits and for-profits are much bigger
for physician-intensive services, while there is no significant difference for non-physician-
intensive services. Public hospitals, by contrast, consistently outsource less than for-profits
across both of these service classes. The pattern for labor-intensive services, however, is quite
different. Labor intensity has no relationship with the private nonprofit outsourcing rates,
but public hospitals outsource labor-intensive services much less than similarly-situated for-
profits (or private nonprofits). Control of labor-intensive services is particularly important
to public managers, but not to private nonprofit managers, which is exactly what our model
predicts.
The model’s third prediction is that a fixed-cost shock should cause nonprofits to look
more like for-profits in their outsourcing decisions. We test this prediction by taking ad-
vantage of California’s seismic retrofitting requirements, which hit different hospitals with
very different retrofitting cost shocks depending on their local geography. Nonprofit and
public hospitals that experience greater fixed-cost shocks outsource at rates which converge
3
to that of for-profits. Nonprofit and public hospitals persist in outsourcing less compared
with for-profits only if they experience relatively small fixed-cost shocks. This prediction is
also complementary with the importance of control, in that the convergence of nonprofit and
for-profit outsourcing rates for big fixed-cost shocks is most evident in physician-intensive
and labor-intensive services.
This paper contributes to two literatures. There is a burgeoning literature on the
“boundary of the organization” and how public entities provide services (Hart, Shleifer and
Vishny 1997, Lopez de Silanes, Shleifer and Vishny 1997, Nelson 1997, Brown and Potoski
2003, Martimort and Pouyet 2008, David and Chiang 2009, Levin and Tadelis 2010, Iossa
and Martimort 2012), but nearly every empirical investigation has focused on one ownership
type. These studies cannot address what is essentially “public” or “nonprofit” about choices
because they lack a control group of profit maximizers. Instead, they are comparative static
in nature, analyzing how organizations adjust to changes in the economic or political envi-
ronment. An important contribution of our work is that we can, first, identify divergence in
outsourcing decisions among ownership types, and second, compare these differences across
services and see how these differences respond to comparative static changes. Hospitals are a
particularly apt organization to investigate, because the organizational forms span for-profit,
private nonprofit, and various sorts of publicly-operated institutions. A handful of papers
have taken advantage of this diversity. Coles and Hesterly (1998) touch on nonprofit and
for-profit differences, but focus on how transaction costs influence which hospital services
are outsourced. Balakrishnan et al. (2010) describe outsourcing differentials at the level of
the hospital. We take their correlations as motivation, show that the large differences by
ownership type are robust within services, and show that those differences are consistent
with a model in which nonprofits are induced by nondistribution constraints to trade-off
costs versus control at a different rate than for-profit firms do.
Second, there is a significant literature on the effects of nonprofit status on the behavior
of firms, in general, and hospitals, in particular.2 Sloan (2000) summarizes the particular
effects present in the hospital context due to moral hazard and the consumer’s asymmetric
information. This literature is particularly concerned with the effect of ownership on the
provision of service quality (Sloan et al. 2001, Picone et al. 2002, Eggleston et al. 2008),
but also on the role of competition (Duggan 2002), managerial compensation (Ballou and
Weisbrod 2003), and these characteristics combined with the question of what drives non-
profit behavior, more generally (Deneffe and Masson 2002, Horwitz and Nichols 2009, Chang
and Jacobson 2011, McClellan and Staiger 2000). The paper most related to ours, both in
2For a nice synthetic summary of the general issue of nonprofit behavior, see Malani, Philipson and David(2003).
4

context and approach, is Chang and Jacobson (2011), which looks at hospitals in California
and also uses seismic retrofitting as an exogenous cost shock. While they are concerned with
the broader question of what nonprofits “maximize,” we have a much more specific goal
of looking at one aspect of the production decision, outsourcing, to highlight an important
difference in the way nonprofit firms conduct their affairs. We focus on outsourcing as a
component of total production, but this is particularly relevant for answering the question
of how mission and production decisions are made differently by ownership type. Outsourc-
ing can have real effects on mission if there are significant elements of the service that are
difficult to fully specify in the contract. We see our work as complementary to the liter-
ature, where (to use their terminology) we identify an additional dimension along which
“perquisite-maximizing” nonprofits differ from their “profit-maximizing” kin.
2 A Model of Outsourcing
2.1 Firm’s Problem
Consider a model of nonprofit behavior patterned on Glaeser and Shleifer (2001) that adds
an outsourcing decision. We use this model to generate empirical predictions. Firms are
controlled by a unitary actor, the manager. The manager values net income from production,
I, and production bias, b. Net income is a function, f , of production bias. The manager
values biasing production away from the net-income maximizing level, and ρ parameterizes
his preference for production bias. Net income cannot be less than fixed costs, F , a shut-down
constraint.
The difference between for-profit and nonprofit firms comes in different returns to net
income. Nonprofits have more restrictions on how they can spend net income (profits).
Both nonprofits and for-profits may spend net income on items such as uncompensated
care, an improved physical working environment of the manager or employees, or more
generous benefits. However, nonprofits are barred from certain goods that are available
to the for-profit, such as taking this excess income home as profits or distributing it to
shareholders. This restriction induces more rapidly diminishing marginal returns to income
for the nonprofit. We model this restriction by assuming that the nonprofits’ return to
income is an increasing but concave function, v(I), with v′(0) = 1. A for-profit, by contrast,
5

is assumed to have a constant marginal value of income of 1. 34
Formally, each firm’s manager solves,
maxI,b
u(I, b|ρ) = I − F + ρb, for a for-profit firm
maxI,b
u(I, b|ρ) = v(I − F ) + ρb, for a nonprofit firm
subject to F ≤ I ≤f(b).
The manager faces a trade-off between net income and production bias, represented by
the production function, f(b). As a normalization, let b = 0 represent the profit-maximizing
level of production bias, so any b > 0 means income has been traded for bias. Assume that
f(b) is concave and decreasing in b.
Production bias, b, can be interpreted to reflect a diversity of missions beyond profit
maximization. It represents any aspect of production (either input or output) about which
the manager has preferences over and above this aspect’s impact on net revenues. The ρ
term may capture the manager’s own intrinsic value, whereby an altruistic manager actually
gets psychic benefit from providing excellent quality care or care to particular groups (such
as the poor). The ρ term also captures any value to the manager induced by the historical
orientation of the organization and the influence of interest groups, such as elite workers,
governing boards, or those in a position of political power over the manager.5
Organized groups, such as elite workers, can capture or influence a manager to place
extra weight on some aspects of service delivery (Glaeser 2003). Consider, for example,
a service with the potential for quality improvement, where workers benefit from being
associated with high-quality production. In the hospital context, physicians have significant
informational advantages and decision influence and might benefit in this way. The manager
3This constant return is for notational simplicity, all that is really required is that the marginal valueof an additional dollar decreases more quickly when the scope of spending is restricted. An alternativeinterpretation for the decreasing marginal value of net income for a nonprofit could be that the cost ofdisguising spending to appear that it satisfies nonprofit restrictions increases in the spending so disguised.
4We also don’t need to assume that v(I) < I for all values of I, just that as I increases, there is some I∗
such that v(I) < I for all I ≥ I∗. The model above simply requires that nonprofit restrictions on spendingare eventually onerous compared to unrestricted income.
5A more detailed version of this model could include interest group effort to exert influence over themanager with some cost to the interest group. This model would be similar to Glaeser (2003). In the modelabove we do not assume differential pressure or effort on the part of workers in nonprofit versus for-profitfirms. If we did include this elite worker effort, nonprofit elite workers would have a greater incentive to exerteffort because of the diminishing marginal returns to income in the nonprofit firm would make the nonprofitmanager more responsive to influence. The direction of the behavioral differences between nonprofit andfor-profit managers would remain the same, but the differences would be larger. We present only the basiccase above, and let the empirical section reveal the size of the differences.
6

might be influenced to increase b in services dominated by physicians. High-quality service
might produce better patient outcomes (influencing revenues) but be costly to implement
(influencing costs), and these effects appear in net income f(b). But the private benefits
appear in the ρb term. As a second example, political pressures to over-employ labor could
induce the manager to value labor-intensive service provision. In that case, the manager
might alter the mix of inputs away from the net-revenue-maximizing mix in favor of excessive
labor usage.
The model does not imply that the for-profit manager will choose b = 0. Agency problems
within the firm could easily result in a for-profit manager facing a ρ > 0, and thus potentially
choosing some production bias. Furthermore, production bias can be either good or bad from
an overall efficiency standpoint. Deviation from net-income-maximizing or profit-maximizing
choices may not reduce social welfare in a second-best world, as is often the case in health
care markets with asymmetric information. Our model is strictly positive.
2.2 Outsourcing
Assume now that the firm could outsource production and access a different set of net
income and production bias pairs than the firm could produce in-house. Denote this new
outsourced production function as f o(b). In our context, there are several reasons to assume
that outsourcing is the low-cost option for low levels of bias, that is f o(b) > f(b) for low b.6
First, in addition to the payment to the contractor, f o(b) also accounts for all the costs
of composing and managing a (potentially quite complex) contractual relationship. Duties
and contingencies have to be clearly specified and appropriately anticipated. Unanticipated
contingencies may result in costly renegotiations. Performance must be monitored, and a
breach on either side can lead to costly legal proceedings (Bajari and Tadelis 2001, Levin
and Tadelis 2010). The provision of high-quality service, for example, is notoriously difficult
to measure in a contractible way, and a contractor has strong incentives to try to shade on
quality to the extent that it lowers his costs. Similarly, a contractor has strong incentives
to try to game a contract that requires a “biased” production mix (say favoring labor over
capital), since returning to the optimal mix would reduce costs. In both cases, the desire
to game the contract increases when a contract specifies greater divergence from the profit-
6In an earlier version, we presented a more detailed and general version of this modeling framework, wherewe solved the model’s predictions for all possibilities of outsourcing’s mix of income and bias. If outsourcingis low-cost but low-bias, we should see for-profit firms outsource more than nonprofit. If outsourcing ishigh-cost and high-bias, we should see nonprofit firms outsourcing more than for-profit. If outsourcing islower cost at all bias levels, everyone will outsource, and if it is higher cost for all bias levels, no one will.Because the first case is the most likely, and also borne out in the empirical results, we present only thelow-cost/low-bias case in detail.
7

maximizing production method. At some point, the costs of contractually guaranteeing very
high levels of control over specific details of production would be prohibitive relative to
in-house monitoring.
Second, the cost of controlling production may also increase with outsourcing in this
industry, in particular, because of the structure of health-care services. Hospitals are orga-
nized to provide tertiary care, the most specialized consultative care for patients. Patients
are referred to hospitals from primary or secondary care, which are organized to provide more
general care. Thus, hospitals’ patients may already require the most specialized services in
the local market, so a full specification of appropriate performance is particularly difficult.
A hospital gets the least standard cases, by design, so a standardized contractual solution
may be particularly ineffectual.
If we couple the f o(b) > f(b) for low b assumption with those laid out in section 2.1, we
can derive the following predictions.
2.3 Empirical Predictions
1. Nonprofit hospitals outsource less, on average. Because the value of extra
income to a nonprofit decreases more quickly than it does for a corresponding for-
profit firm, and outsourcing has a comparative advantage in the low-bias/high-income
region, the model predicts outsourcing choices will differ between nonprofits and for-
profits. When the choice boils down to one between a low-cost/low-bias outsourced
option and a high-cost/high-bias in-house choice, the extra income available from the
outsourced choice is less valuable to the nonprofit, all else equal.
2. Differences in outsourcing between nonprofits and for-profits will be more
pronounced for services where bias is more important. As control over pro-
duction becomes more important, a larger income-related utility increase is required
to induce firms to outsource to a low-bias outside producer. Since nonprofits value
a given increase in income less, they would require an even larger cost savings from
outsourcing than a for-profit would to continue to find outsourcing attractive. This
comparative static also implies that if nonprofits have consistently higher ρs for (some
subset of) services, they will outsource (that subset of) services less, ceteris-paribus.
The subset of services with higher ρs may differ by the nonprofit mission. We are able
to test this in our application to hospitals, since these are necessarily multi-product
firms with a variety of services of different expected bias levels.
3. Differences in outsourcing behavior between nonprofits and for-profits de-
8

crease as budgets tighten. A difference between our model and a purely preference-
based explanation for outsourcing differences is how choices respond to fixed-cost
shocks. A shock to fixed costs (F increasing) is a shift in net income for all levels of
bias and differentially affects the two firm types. For profit-maximizing firms, changes
in fixed costs have no effect on outsourcing behavior since the income-bias trade-off has
not been affected. (Assuming they have sufficient profits to continue operating.) By
contrast, higher fixed costs immediately affect the nonprofit’s income-bias trade-off. If
F rises, the marginal benefit of income rises, so the opportunity to outsource to a low-
cost/low-bias producer becomes more attractive to a nonprofit firm. This comparative
static would not obtain in a model where the only difference between nonprofits and
for-profits is a difference in the importance of control over production bias.
4. As budgets tighten, outsourcing differences decrease more for those services
where bias is more important. Since the divergence of the nonprofit from the for-
profit is larger for larger ρ, there is a cross-partial prediction, where the effects of a
fixed-cost shock will be larger for services where control over production bias is more
important. Examining this cross-partial prediction lends further robustness to the first
three predictions.
3 Data and Institutional Setting
We examine our predictions using an unbalanced panel of 433 short-term care general hos-
pitals in California hospitals, 1996-2008, from the Annual Financial Data series from the
California Office of Statewide Health Planning and Development (OSHPD). For each hospi-
tal, we know a wide variety of financial and operating characteristics, including ownership
type, discharges, patient mix, and location.
Our hospitals are of four ownership types: for-profit, nonprofit, local, and district.7 For-
profit hospitals have a private residual claimant on profits, Nonprofits are 501(c)(3) registered
charitable organizations, and no part of the organization’s net earnings accrue to the benefit
of any private shareholder or individual.8 Local hospitals are publicly operated as part of
the budget of the local city or county and overseen by a board appointed by the elected
local government. District hospitals are controlled by a directly-elected board for each of
California’s 85 health districts. These hospitals are funded by taxes at the district level,
7Veterans Affairs (VA) hospitals are not included in this analysis.8Separating out church-affiliated hospitals from non-affiliated nonprofits reveals a similar pattern for both
groups, although church-affiliated nonprofits have lower overall outsourcing levels.
9

patient receipts, and intergovernmental transfers.9
3.1 Measuring Outsourcing
The annual financial data includes a measure of total operating expenses for every service pro-
vided by the hospital, from medical services to administrative tasks. However, the OSHPD
makes all hospitals also report operating expenses net of any physician expenses, either from
direct employment or through outsourcing. This is because most California hospitals are
legally prohibited from directly employing physicians. This facilitates cross-hospital com-
parisons with the select few exceptions to this prohibition.10 This separation is helpful in our
case, since the make-or-buy “decision” in physician employment is not a choice, but instead
dictated by law. We can thus isolate the costs where a meaningful outsourcing decision
is taking place. Reported total operating expenses are divided into two categories: Total
Direct Costs and Physicians’ Professional Component. Total direct costs are the operating
expenses net of physician costs. We use total direct costs in our analysis in order to exclude
physician fees and include only the remaining components of operations which are salient to
the make-or-buy decision.11
Within each service, the hospital reports the total costs divided into broad component
categories such as Salaries and Wages, Benefits, or Supplies. Costs attributed to outsourced
sources are recorded in two categories. The first, Professional Fees, is essentially all out-
sourced labor costs. Professional Fees include (non-physician) medical personnel not on the
payroll, such as registered nurses or physical therapists. It also includes legal or management
consulting fees, audit personnel, or temporary contractors such as file clerks. The second
category of outsourced costs is Purchased Services. This category includes the costs of out-
sourced medical services such as a contracted laboratory or CT scan. It can also include
services such as repairs and maintenance, management services, linen services, or credit and
collection that were provided by an outside contractor.
We define a cost-based measure of service-specific outsourcing using the sum of the two
9In fact, the situation is slightly more nuanced, because certain Districts license nonprofit or for-profitproviders to operate hospitals for them. We code these as for-profit or nonprofit, since the licensees are resid-ual claimants on profits and have managerial discretion in structuring operations. For more detail about thegovernance structures employed by California public hospitals, see http://www.chcf.org/publications/
2009/05/governance-models-among-california-public-hospitals10A few exceptions to directly employing physicians include county hospitals, HMOs licensed under the
Knox-Keene Act (such as Kaiser), and teaching hospitals. See “Physician-Hospital Integration 2012: HowHealth Care Reform is reshaping California’s Delivery System.” for The California HealthCare Foundationby the Camden Group. April 2012.
11Total direct costs also excludes the reporting category of “Unassigned Costs,” which is expenses such asInsurance, Depreciation, or Interest, since these costs cannot be outsourced.
10

outsourced cost categories as a percentage of Total Direct Costs in that service. Formally,
for service s in hospital h in year t we define:
PctOuthst ≡PurchasedServiceshst + ProfFeeshst
TotalDirectCosthst× 100.
Hospitals differ most in the extent of outsourcing of a given service, rather than the
decision to outsource at all. Because of this, we will defer the extensive margin to another
paper, and focus here on the intensive margin of the degree of outsourcing, which we will
measure as log(PctOuthst).
3.2 Services
Hospitals in our sample offer a subset of 85 unique services. Table 1 lists the six major
categories of services with examples and the average outsourcing levels across all hospitals.
We see broad trends arise already in Table 1 across service types. The category with the
least amount of outsourcing overall is Daily Hospital Services, with mean outsourcing levels
of 7.1 percent and a standard deviation of approximately 11 percent. Daily Hospital Services
includes inpatient care such as surgeries and coronary care. Fiscal Services have the highest
rates of outsourcing at 28.5 percent on average, with services such as general accounting and
credit and collection. General Services also has high levels of outsourcing, on average 24
percent, for services such as laundry and linens and groundskeeping. The median hospital
offers 56 unique services, while the mean hospital offers 53.7.12
Table 1: Service Categories Description
Service Category Examples Mean Pct. Std.Outsourced Dev.
Daily Hospital Services Medical/Surgical Intensive Care, Coronary Care 7.1 11.0Ambulatory Services Medical Transportation, Home Health Services 11.2 18.9Ancillary Services Anesthesiology, Medical Equipment 21.2 32.8General Services Laundry and Linens, Groundskeeping 24.2 33.5Fiscal Services General Accounting, Credit and Collection 28.5 35.5Administrative Services Hospital Administration, Public Relations 19.9 26.5
12These main 85 unique services exclude three categories. 1. Several broad catch-all categories. (such as“Other Daily Hospital Services”, the composition of which may vary across hospitals) 2. Services offered veryrarely (less than 300 hospital/year combinations, out of about 4500) 3. All medical research and educationservices. The results are robust to including/excluding the rare services, and we explicitly report the resultswhen we limit the sample even further to only very common services.
11

3.3 Services and Bias
Prediction 2 states that the difference between nonprofit and for-profit outsourcing behavior
should increase in the importance of production bias to the manager. The literature on
nonprofit hospital behavior focuses on physicians, in particular, as likely candidates for elite
workers with influence on the manager. Glaeser (2003) states, “the modern hospital is an
outcome of the increasing power of doctors, who shaped the hospital toward their own inter-
ests.” At the extreme, Pauly and Redisch (1973) model the hospital directly as a physicians’
cooperative. We need not go that far, however, and merely require that physicians have some
substantial influence on the induced preferences of the manager, especially in domains where
they have informational advantages and strong incentives to influence decisions. To identify
services where these elite workers are more important, we categorize a subset of services as
“physician-intensive.” As described in Section 3.1, each service’s physician costs are reported
separately from total direct costs because of the prohibition on direct employment. We can
use these costs to create an index of services that rely heavily on physician inputs. We
rank each service by the average fraction of total direct costs attributable to physician ser-
vices. Those services in the top quintile of all services are designated as “physician-intensive
services.”13
Public hospitals may induce a different preference for bias in managers than private
nonprofits or for-profits. Services that are particularly labor-intensive could be salient to
political overseers and regulators, either by satisfying their mission or through furthering
political support. Local hospitals are run within the city or county government, and political
principals may have a desire to disguise redistribution as public employment (Alesina, Baqir
and Easterly 2000, Clark and Milcent 2011). Other mechanisms for bias may be “Keynesian”
employment policy or even capture by organized labor. We identify labor-intensive services
using a similar method to that described for physician-intensive services. For each service
in each hospital-year, we calculate the fraction of direct costs represented by the categories
of Salaries and Wages and Employee Benefits. However, since some outsourcing may also
13We used an alternative proxy in a prior version of this paper, where we followed the OSHPD division ofservices into revenue-generating and non-revenue-generating subsets. Revenue-generating services are thosefor which the hospital bills insurance and patients, thus these services are generally medical services, wherephysicians may have a greater impact on management policy. Non-revenue generating services are serviceswhich the hospital must provide for its operations, like groundskeeping, parking, and accounting, but forwhich the hospital does not generally charge. The results are quite similar for this proxy of physician-intensity.These results broadly square with some results broadly contrasting clinical and non-clinical costs at the hos-pital level (Balakrishnan et al. 2010). Physician-intensive services are pediatric intensive care, neonatalintensive care, adult psychiatric acute care, physical rehabilitation care, emergency services, clinic services,satellite clinic services, psychiatric partial hospitalization, anesthesiology, pathological lab services, cardi-ology services, electromyography, electroencephalography, pulmonary function services, psychiatric therapy,and medical staff administration.
12

reflect labor costs, which would not be reported in direct salaries because it was outsourced,
this measure is a minimum estimate for the true share of labor in that service. We construct
two additional measures of labor intensity: the share of non-outsourced direct costs and the
share of total direct expenses of wages, benefits and contracts with outside providers. The
latter of these is an upper bound on the true labor intensity, while the former will lie between
the other measures. We define a service as “labor-intensive” if it is among the top third of
services for all three metrics.14 15
3.4 Hospital Characteristics
For hospital covariates we have measures of size, scope, mission, and market. The number
of discharges is a time-varying measure of size. For scope, we have the number of services
offered. Since residency programs may lend an extra incentive to produce in-house for train-
ing purposes, we include an indicator for this aspect of mission. We also include the fraction
of patient-days that are from Medicare and MediCal patients, since different patient mixes
may lead to different activities. We also have an indicator for whether the state of California
considers the hospital to be “rural,” since the opportunities to outsource may be less in a
less-developed market.16 To control for market characteristics, we match Census and Amer-
ican Community Survey data for 1996-2006 onto the Hospital Service Areas (HSAs) of each
hospital. HSAs capture local health care markets for hospital care as a collection of zipcodes
whose residents receive most of their hospitalizations from hospitals in that area. Market
characteristics include population, median household income, educational attainment, and
race percentages within the total population. The average unemployment rate for the year
in the hospital’s county is from the Bureau of Labor Statistics. County fixed-effects control
for the general market in which the hospitals find themselves, and we also include year and
service fixed-effects to remove common economic shocks and maintain comparisons to within
a service.
14If all labor-intensity metrics were the same, this procedure would identify 28 services, but since theranking differs to some degree among the metrics, only 14 services meet all three criteria. Expanding thedefinition to include all services that meet two of the three criteria does not substantially alter our results.
15Labor-Intensive Services are medical/surgical intensive care, coronary care, definitive observation, acutecare, psychiatric acute-adult, alternate birthing center, physical rehabilitation, sub-acute care, skilled nursingcare, observation care, social work services, outpatient registration, nursing float personnel, and utilizationmanagement.
16A subset of about 20 of California’s hospitals qualify for the Medicare “Critical Access Hospi-tal” program for rural hospitals. These hospitals may face different incentives to provide services,and to provide them in-house. We have included them in the sample, but we repeated the en-tire analysis removing these hospitals, with no substantive effects on the results. For details onthis program, see http://www.cms.gov/Outreach-and-Education/Medicare-Learning-Network-MLN/
MLNProducts/downloads/CritAccessHospfctsht.pdf.
13

Finally, to control for service-specific returns to scale, we have service-specific measures
of output. The specific measure reported by the OSHPD varies considerably by service.
For example, the measure of output for all daily hospital services is “patient-days,” and for
most ambulatory services it is “visits,” but for ancillary services it is very service-specific:
deliveries, operating minutes, tests, or sessions. For the non-medical services, printing and
duplicating services is measured in “reams of paper,” while that for social work services is
“number of personal contacts.”17 Since these measures are not commensurable, we will also
allow the coefficient on output in any regression that includes them to vary by service, with
the levels given in logs.
3.5 Summary Statistics and Preliminary Differences
Table 2 summarizes overall outsourcing, hospital characteristics, and market characteristics
by hospital ownership type.18 In the summary statistics, all hospital-level variables are
weighted by the number of services, since regressions are naturally weighted in that way.
Recall the first prediction of our model is that nonprofit hospitals should outsource less
overall than for-profit hospitals. Preliminary differences in overall outsourcing behavior
are evident in Table 2. For-profit hospitals outsource on average 25.7 percent of costs,
compared to only 19 percent for private nonprofit hospitals. Public hospitals, district and
local, also outsource less on average than for-profit hospitals. The fraction of services which
are completely outsourced varies in a similar way. The ownership types are much more similar
along the extensive margin, however, averaging about 87 percent of services outsourced to
some degree.
The remaining variables in Table 2 give a picture of each hospital ownership type. Private
for-profits are mostly small urban hospitals, averaging 6,146 discharges per facility and with
only 5 percent of hospitals located in rural areas. Accordingly, for-profit hospital markets
have the highest HSA populations, the highest median household income, and the second
highest percent black. For-profits also offer a high percentage of “common” services, defined
as a service offered by at least 3,000 hospital-years in the sample.
Nonprofit hospitals tend to be large medical complexes in relatively well-off areas. Non-
profit hospitals average 11,145 discharges, second only to local hospitals, and 58 services.
They also have the smallest percentage of MediCal patients, at 20 percent, and the highest
17A complete list of services and output measures available at http://www.oshpd.ca.gov/HID/Products/Hospitals/AnnFinanData/Manuals/index.html.
18We present results for all 85 services, but in the Appendix we replicate our results by limiting the analysisto the 36 most common services, which are offered by at least 3000 hospital/year combinations. They areconsistent with the full-sample results.
14

percentage of Medicare patients, at 45 percent. Only 76 percent of the services offered by
nonprofit hospitals are “common” services. This is the lowest percentage among the owner-
ship types, indicating that nonprofit hospitals are offering the broadest scope of services.
District hospitals are small, traditionally rural hospitals. They have the smallest number
of average discharges, 5,770, and offer the lowest number of services, 52. District hospitals
are the second largest provider for MediCal patients, behind local hospitals. Over 57 percent
of district hospitals are classified as rural, almost five times the rate of the other ownership
types. Accordingly, district hospitals have the lowest average population in the HSA, the
lowest median income, and the lowest percent black.
Local hospitals are commonly very large teaching hospitals. These hospitals have the
largest average number of discharges, at 12,751. These hospitals serve the greatest percentage
of MediCal patients, at over 52 percent, and the least number of Medicare patients. The
mix of services offered is slightly less diverse than nonprofits but broader than the other two
ownership types. Local hospitals are by far the most likely to offer a residency program,
with 74 percent of the local hospital observations doing so.
In the next section, we detail our econometric approach to address outsourcing differences
while accounting for these differences in observables.
4 Econometric Specification and Results
4.1 Econometric Specification
Conditional on the decision to outsource the service to any degree, we model the determi-
nation of outsourcing intensity as
(1) log(PctOuthst) =∑j
βjOwnjht + γ1s + γ2sOutputhst + ΓXht + εhst,
where the dependent variable is the natural log of the percent of costs due to outside con-
tracts, Ownjht is a dummy taking a value of 1 if hospital h is of ownership type j in year t, the
γs are service-specific intercepts and output slopes, and Xht is the set of controls described
in section 3.4, as well as county-specific and year-specific intercepts.
The sample statistics suggest that the intensity of outsourcing is the primary margin
of difference among ownership types. However, we observe the choice of intensive margin
only in the cases where the hospital decides to outsource at all, a selected sample of the
population. Naively dropping those observations and ignoring the sample selection can lead
15

Table 2: Summary Statistics by Ownership Type, Weighted by Number of Services.
For-Profit Private NP District Local
Percent Outsourced 25.72 19.02 20.71 18.12(33.93) (28.68) (30.55) (27.82)
Service Completely Out 0.0561 0.0294 0.0455 0.0232(0.230) (0.169) (0.208) (0.150)
Service Any Out 0.863 0.865 0.867 0.876(0.344) (0.342) (0.340) (0.330)
Discharges 6146.8 11145.4 5770.0 12750.5(4518.5) (7677.4) (6560.5) (10530.7)
Services Offered 53.09 57.72 51.98 55.93(8.637) (9.807) (10.39) (7.993)
Pct. MediCal 27.60 20.19 38.42 52.92(21.34) (15.88) (25.62) (13.84)
Pct. Medicare 44.28 45.25 37.05 16.40(16.98) (13.85) (19.43) (11.01)
Common Service 0.829 0.760 0.812 0.785(0.377) (0.427) (0.391) (0.411)
Residency Program 0.164 0.249 0.0237 0.736(0.370) (0.432) (0.152) (0.441)
Rural 0.0532 0.119 0.576 0.123(0.224) (0.324) (0.494) (0.329)
Peak Acceleration 0.496 0.475 0.465 0.525(0.141) (0.227) (0.256) (0.225)
Pop. in HSA 502004.0 342956.8 131289.8 429471.6(640210.0) (428365.0) (170351.8) (497746.1)
Pct. Black in HSA 6.845 5.237 3.237 7.771(7.921) (6.299) (4.234) (9.852)
Pct. Poor in HSA 14.39 13.19 14.68 14.92(6.892) (6.067) (6.232) (6.393)
med. HH Earn in HSA 45884.2 45793.7 38025.6 42543.1(15285.5) (14549.9) (11250.8) (13140.0)
HS Grad in HSA 21.25 21.69 25.07 21.93(5.042) (5.791) (5.685) (5.410)
Some Col. in HSA 25.66 26.61 27.44 25.63(8.450) (9.000) (9.402) (9.353)
Pct Bach. in HSA 15.99 16.76 12.29 14.44(6.641) (7.443) (5.633) (7.337)
Pct Grad/Prof in HSA 7.962 8.607 5.798 7.302(4.816) (6.031) (3.384) (4.344)
County Unemp. 5.873 6.295 7.882 7.450(1.874) (2.335) (3.869) (4.099)
N 57k 128k 27k 15k
Sample means and standard deviations in parentheses at the service x hospital x year level.
16
to biased estimates, so we need to model the extensive margin, whether to outsource at all,
even if our primary interest is in outsourcing intensity. Let ysht represent the payoff to firm
h in year t from outsourcing service s at the profit-maximizing intensity level, relative to
the zero-normalized payoff of producing that service entirely in-house. The true payoff is
unobservable, but our empirical model for this outsourcing payoff is
(2) yhst =∑j
βjOwnjht + γ1s + γ2sOutputhst + ΓXht + εhst,
where the independent variables are identical to those in (1). Under joint normality, the
bias of our intensity estimate can be corrected by jointly estimating equations (2) and (1)
using a maximum likelihood estimator (Heckman 1979). In fact, as we will see below, the
evidence is that this bias is not significant, and the naive estimates are extremely close to
the corrected estimates.
Finally, there is a question of which covariates are appropriate to include as control vari-
ables. On one hand, we know that for-profit hospitals and the various types of nonprofits are
dissimilarly situated, on average, in terms of economic environment, patient mix, and even
scale and scope of operations. These differences are quite apparent in the sample means, and
these factors may be correlated with the attractiveness of outsourcing for reasons unrelated
to the ownership form of the hospital. Thus, we may want to control for these factors in
order to contrast the various nonprofit forms to a hypothetical similarly-situated for-profit
hospital. Failing to do so may result in biased estimates, since outsourcing differentials may
result from these third factors that are correlated with ownership.
On the other hand, the dissimilar situations did not arrive by happenstance. Instead, they
often result from hospitals of different ownership types making different business decisions.
To take one example, consider the hospital’s decision to operate in an urban market. We
know that, on average, for-profit hospitals are more likely to operate in urban markets than,
especially, their district hospital counterparts. If part of the reason they do this is because
for-profit hospitals want to avail themselves of the thicker markets for outsourcing services in
urban areas, then the decision to locate in an urban area is an intermediate outcome to the
decision to outsource at higher rates. If this is the case, urban location is an inappropriate
control and including it will introduce bias. Put another way, if for-profit hospitals have some
unmodelled reason to prefer locating in urban locations, then those for-profit hospitals that
choose to operate in rural areas have some unusual (unobserved) characteristic. Thus, rural
for-profits are not actually similarly situated to rural district hospitals, which do not need this
unusual characteristic to choose a rural setting. This induced difference becomes a problem
whenever that unobserved characteristic also influences the attractiveness of outsourcing.
17
We believe that the omitted variable problem induced by having too few controls is more
severe than the intermediate-outcome problem, and we will, therefore, present regression
estimates including the full set of controls outlined. We also perform our estimates for
a smaller set of controls that are plausibly beyond the control of the firm, omitting the
controls for patient mix, residency, number of discharges, number of services, and service-
specific output. These estimates are less likely to suffer from the intermediate-outcome
problem and consistently result in larger differences.19 The sample means, of course, reflect
the uncontrolled differences.
4.2 Prediction 1: Differences in Overall Outsourcing Levels
The first prediction of the model is that nonprofit hospitals will outsource less overall, across
all services. Table 7 shows the results of the full estimation of the Heckman selection model
and from a fixed-effects OLS estimate of outsourcing intensity. The coefficients report
marginal effects, calculated at the mean of the covariates. The first thing to note is the
similarity of the OLS and Heckman results. They are essentially indistinguishable, suggest-
ing that the naive approach, where we limit our attention to services that are outsourced
at all, is not leading to major biases. This result is not too surprising, given that about
87 percent of service-hospital-year observations are outsourced to some extent and we are
already controlling for many of the factors that might guide that decision. Given the high
level of similarity, for the rest of the analysis we will ignore selection and simply present OLS
results for brevity.
The overall outsourcing results are generally in accord with the first prediction of the
model about outsourcing differences. Table 7 reports the coefficients on each of the ownership
types as compared to the omitted category of for-profits. Nonprofit hospitals outsource
8 percent less than similarly-situated for-profits. District hospitals are similar to private
nonprofits, outsourcing about 13 percent less intensely than their for-profit counterparts.
Local hospitals are the least intense outsourcers of all, outsourcing nearly 39 percent less
intensely than similarly-situated for-profit hospitals.
The hospital-level control variables relate to outsourcing in the ways we might expect.
Larger hospitals, either in terms of number of services or discharges, outsource less intensely
on average. Neither patient mix nor having a residency program is associated with out-
sourcing intensity. Demographic variables are only rarely significant in the either of these
regressions, likely because most important differences are already controlled for with county
fixed effects. Since this will be generally true throughout, we will not always report these
19Results available on request.
18

Table 3: Outsourcing and Ownership Type
(1) (2)OLS Heckman
Non-Profit −0.079∗ −0.079∗
(0.046) (0.046)District −0.126∗ −0.126∗
(0.067) (0.067)Local −0.386∗∗∗ −0.386∗∗∗
(0.089) (0.089)Log Discharges −0.125∗∗∗ −0.126∗∗∗
(0.027) (0.027)Log (Services) −0.064 −0.054
(0.155) (0.153)Rural −0.016 −0.016
(0.069) (0.069)Pct. MediCal 0.001 0.001
(0.001) (0.001)Pct. Medicare 0.000 0.000
(0.001) (0.001)Pop. in HSA −0.000 −0.000
(0.000) (0.000)Pct. Black in HSA 0.003 0.003
(0.003) (0.003)County Unemp. −0.006 −0.006
(0.009) (0.009)Pct. Poor in HSA −0.006 −0.006
(0.005) (0.005)HS Grad in HSA −0.003 −0.003
(0.004) (0.004)Some Col. in HSA −0.005∗ −0.005∗
(0.003) (0.003)med. HH Earn in HSA 0.000 0.000
(0.000) (0.000)Residency Program 0.025 0.025
(0.037) (0.037)county FE yes yesservice FE yes yesservice-specific output yes yesObservations 196k 227k
OLS and Heckman models with dependent variable of natural log of the percent of costs that are expended onoutside contracts. All regressions include county fixed-effects, service fixed-effects. Standard errors, clusteredby hospital, in parentheses. ∗∗∗ p < 0.01, ∗∗ p < 0.05, ∗ p < 0.10. Dependent variable excludes all physicianservices costs, regardless of contracting type.
19

coefficients.
4.3 Prediction 2: Outsourcing and Bias-Intensive Services
Our model of outsourcing behavior implies that differences between nonprofits and for-profits
will be more pronounced in services where control over the services is particularly important
to the manager. We use the services described in Section 3.3, where physicians are the elite
workers in the hospital setting. We also investigate labor-intensive services which may have
particular importance to elected officials, regulators, or unions (Alesina et al. 2000, Clark
and Milcent 2011).
Table 8 presents the results on Prediction 2 for variants of Equation (1), where ownership
type is interacted with an indicator for whether the service is physician-intensive (in column
(1)) or labor-intensive (in column (2)). The coefficients on the non-interacted ownership
dummies represent the relationship between ownership and outsourcing for non-intensive
services, while the sum of the coefficients on the interacted and non-interacted dummies
represent the relationship for intensive services. The second prediction of our model states
that if physician-intensity is a good proxy for the importance of control to elite workers (pace
labor intensity), we should see bigger differences in outsourcing for the physician-intensive
services.
Consider, first, the results for physician-intensity in Column (1). There are no statistically-
significant differences in outsourcing of non-physician-intensive services between private non-
profits and their for-profit counterparts. District hospitals outsource slightly less in these
services. The local hospitals, by contrast, outsource even non-physician-intensive services
at much lower rates than all other ownership types. For physician-intensive services, by
contrast, all three types of nonprofits outsource much less intensely than their for-profit
counterparts, and the differences range from about 22 percent for the private nonprofits
and district hospitals, to over 60 percent for the local public hospitals. The differences
are statistically significant and large. As our model predicts, the difference in outsourc-
ing intensity between nonprofits, both public and private, and for-profits is much larger
for physician-intensive services than it is for non-physician-intensive services. The gap in
outsourcing intensity is between 9 and 25 percentage points larger for physician-intensive
services, although the result is not statistically significant for district hospitals.
The second column of Table 8 shows the results for labor intensity. The literature suggests
that labor-intensity may be the bias of interest for hospitals in the public sector, where
political considerations may factor into managerial decisions. The pattern of outsourcing
differences in the non-labor-intensive services is similar to that for non-physician-intensive
20

Table 4: Outsourcing Differential by Physician- and Labor-Intensity
(1) (2)Physician Labor
Non-Profit −0.058 −0.070(0.045) (0.045)
District −0.115∗ −0.098(0.070) (0.068)
Local −0.350∗∗∗ −0.343∗∗∗
(0.087) (0.084)Non-Profit x Physician Intensive −0.162∗∗∗
(0.061)District x Physician Intensive −0.085
(0.094)Local x Physician Intensive −0.253∗
(0.136)Non-Profit x Labor Intensive −0.082
(0.065)District x Labor Intensive −0.255∗∗
(0.099)Local x Labor Intensive −0.391∗∗
(0.181)Hospital Controls yes yesHSA Controls yes yescounty FE yes yesservice FE yes yesservice-specific output yes yesObservations 196k 196k
Dependent variable is the natural log of the percent of costs that are outside contracts. (d) indicates adummy variable. Standard errors, clustered by hospital, in parentheses. ∗ ∗ ∗ p < 0.01, ∗∗ p < 0.05, ∗p < 0.10. Dependent variable excludes all physician services costs, regardless of contracting type.
21
services, with small differentials for the private nonprofits and district hospitals but large
differentials for the local hospitals. The pattern for labor-intensive services, however, is quite
different from what we observed for physician-intensive services. For private nonprofits,
outsourcing patterns are not different between non-labor-intensive services versus labor-
intensive services, given by the small and insignificant interacted coefficient. Both types of
public hospitals, by contrast, outsource labor-intensive services at a much lower intensity.
The magnitudes of the differential in labor-intensity are quite large, between 26 (district)
and 40 (local) percent, and strongly statistically significant.
To sum, the pattern of outsourcing intensity by service-type suggests that, in addition
to having different mean levels of outsourcing intensity, the managers of public and private
nonprofits are particularly interested in maintaining control of different subsets of services.
If we think of outsourcing as a cost-control trade-off, private nonprofits are maintaining
control of services that are physician-intensive, though act quite similar to for-profits for non-
physician-intensive services. Public hospitals also maintain increased control of physician-
intensive services, but they continue to outsource even non-physician-intensive services less
intensely than for-profits do. The pattern for labor-intensive services is quite different,
with only the public hospital especially interested in maintaining control of labor-intensive
services. To take a simple example, all three nonprofit firm types maintain (relatively) tighter
control of neo-natal intensive care than they do of groundskeeping, but public hospitals also
keep a tighter hold on social-work services and skilled nursing care, while private nonprofits
do not.
Taken together, these results illustrate three points. First, nonprofit and for-profit re-
sponses to physician-intensity and labor-intensity are distinct. Note how this contrast differs
from a comparative static exercise of comparing outsourcing rates across services within an
ownership types, as Coles and Hesterly (1998), Lopez de Silanes et al. (1997), or Levin and
Tadelis (2010) do. We can say not only that nonprofits respond to physician- and labor-
intensity, but also that they respond for reasons distinct from profit motivation.
Second, private nonprofit and public responses to non-physician-intensity are also dis-
tinct. Whatever is driving the difference between public and for-profit outsourcing rates, it
does not seem to be the same thing that is driving the difference between private nonprofit
and for-profit rates, or at least it is not the only thing. In our model, the services for which
control is important may be different for public hospitals than for private nonprofits, and
how public hospitals bias production is not entirely captured by physician intensity. In fact,
public hospitals outsource considerably less than private nonprofits for both service-bias
types, so another factor must be at work.
22

Finally, nonprofit and public responses to labor-intensity are distinct. Public hospitals are
distinctly interested in controlling labor-intensive services, while private nonprofits exhibit
no such pattern. Thus, this is not simply a result of a nonprofits’ lack of residual claimancy,
a feature both types share. There is some evidence that public hospitals are particularly
sensitive to labor. Clark and Milcent (2011) find, for example, that public hospitals in
France react to rising local unemployment rates by increasing employment, while private
nonprofit hospitals show no similar pattern. This is also support for Andrei Shleifer (1994),
where unorganized voters mean public firms are more prone to capture by organized labor
and political patronage. We document another effect of public hospitals apparent interest
in control of labor–it can lead them to draw the boundaries of the firm in a way that differs
from both for-profit firms and private nonprofits.
4.4 Predictions 3 and 4: Outsourcing After a Fixed-Cost Shock
The third prediction of the model is that the decisions of nonprofit and for-profit firms should
become more similar as budgets tighten. This prediction arises directly from the concavity
of the nonprofit’s utility from net income. If there is a large fixed cost shock, the amount
available to spend is relatively low, and the marginal value to the nonprofit firm of an extra
dollar is high, approaching that of the for-profit.
We use a change in regulatory requirements enacted in California in 1994 to capture a
fixed-cost shock. This regulation (SB 1953) required short-term general care hospitals in
earthquake zones to meet relatively strict engineering standards. The regulation went into
effect in 1998, and the first deadline for meeting the loosest standard (no SPC-1, extremely
vulnerable, buildings) was January 2008. A stricter standard (no SPC-2, vulnerable, build-
ings) was mandated for January 2030. For many hospitals, meeting this requirement involved
very extensive retrofitting of existing buildings, and most have preferred to construct new
buildings, at costs of tens to hundreds of millions of dollars (Meade and Hillestand 2007).
The hospitals should, thus, have been aware of existence of the shock throughout our sample
period, although they may have learned over time about their exact cost.
The actual costs incurred to retrofit or construct new buildings that meet the mandate
will be endogenously determined by the firm, but we proxy for the underlying exogenous
cost shock by the peak ground acceleration in the location– a measure of earthquake risk
(Meade, Kulick and Hillestand 2002). Peak ground acceleration is the maximum fraction of
the acceleration of gravity that will occur with a 10-percent probability over the next 50 years;
a higher value is more costly. See Chang and Jacobson (2011) for an extensive discussion
of the implementation of the mandate, and an overview of the relationship between peak
23

ground acceleration and costs.20 The peak ground acceleration of hospitals in our dataset
ranges from 0.05 to 1.15. The distribution is centered around the mode of 0.45 and falls
off evenly to either side, with a standard deviation of 0.21. The four ownership types have
similar peak ground acceleration average values, about 0.50.
Table 9 presents the results a variant of Equation (1) in which we interact ownership
type with the peak ground acceleration experienced by the hospital. The prediction is
that the difference between nonprofit and for-profit hospitals should be most marked when
acceleration is small (and the cost shock is least severe). Column (1) presents the results on
the full sample of services, while the remaining columns break the services into sub-samples
with respect to physician- and labor- intensity.
If differences in outsourcing indeed shrink as budgets tighten, we would expect the great-
est difference in outsourcing to occur when there is no cost shock to the hospital’s budget.
The non-interacted ownership indicators of Table 9 are the predicted difference in outsourc-
ing intensity between the indicated ownership type and a for-profit for a hypothetical hospital
that experienced no earthquake risk. In the full sample, regression (1), low-shock private
nonprofits outsource between 21 percent less intensely and local hospitals 55 percent less in-
tensely than low-shock for-profit hospitals. To understand the effects of tightening budgets,
the interacted coefficients of ownership and acceleration show the direction of change from
initial differences as fixed costs increase. The interacted variables all have large positive
coefficients, which indicates that the expected outsourcing differential shrinks as the cost
shock grows, although none of the interactions are statistically significant in the full sample.
The relationship between Table 9’s cost shocks and outsourcing differentials is more
clearly seen in figures. Figure 1 shows the predicted outsourcing difference between hospitals
of the indicated ownership type and a similarly situated for-profit hospital as a function of
the size of the fixed cost shock. The solid line shows the expected difference, and the dotted
lines are 95-percent confidence intervals. A negative number along the vertical axis means
that hospitals of the indicated type outsource less intensely than similarly-situated for-profits
do. As peak ground acceleration grows, the predicted difference approaches zero for all three
ownership types. At the mean peak ground acceleration (0.5), we can strongly reject the null
of no difference for the local hospitals, and marginally so for private nonprofits and district
hospitals. However, by the time we reach the maximum peak ground acceleration in our
sample (1.15), only local hospitals show predicted outsourcing less than for-profit hospitals.
Turning to the service-type subsamples, the final prediction of the model is that, as
budgets tighten, outsourcing differences should change the most in bias-sensitive services.
20Chang and Jacobson provided us with this acceleration measure, for which we are very grateful.
24

Table 5: Outsourcing and Seismic Cost Shocks
Physician Labor
(1) (2) (3) (4) (5)Full Sample Intensive Not Intensive Not
Non-Profit −0.213∗ −0.480∗∗ −0.173 −0.204 −0.209∗
(0.113) (0.224) (0.117) (0.227) (0.116)District −0.255∗ −0.175 −0.263∗ −0.365 −0.241
(0.145) (0.254) (0.153) (0.238) (0.154)Local −0.550∗∗ −0.974∗∗ −0.470∗ −1.487∗∗∗ −0.415
(0.262) (0.431) (0.259) (0.567) (0.262)Non-Profit x Acc 0.256 0.759∗ 0.182 0.238 0.252
(0.214) (0.442) (0.216) (0.433) (0.218)District x Acc 0.248 −0.048 0.286 0.210 0.255
(0.284) (0.462) (0.296) (0.474) (0.291)Local x Acc 0.326 0.699 0.257 1.461 0.159
(0.437) (0.712) (0.434) (0.896) (0.433)Peak Acceleration −0.142 −0.604 −0.068 −0.373 −0.107
(0.226) (0.436) (0.230) (0.432) (0.234)Hospital controls yes yes yes yes yesHSA controls yes yes yes yes yescounty FE yes yes yes yes yesservice FE yes yes yes yes yesservice-specific output yes yes yes yes yesn 194k 26k 168k 22k 172k
Dependent variable is the natural log of the percent of costs that are outside contracts, and includes onlythose observations with positive outsourcing. HSA controls include population, percent black, percent poor,median household earnings, and four educational mix variables. (d) indicates a dummy variable. Standarderrors, clustered by hospital, in parentheses. ∗ ∗ ∗ p < 0.01, ∗∗ p < 0.05, ∗ p < 0.10. Dependent variableexcludes all physician services costs, regardless of contracting type.
25
Columns (2)-(5) show regressions with interacted ownership type and fixed cost shocks,
separating out those services designated “intensive” from the “non-intensive” services for
both physician- and labor-intensity. In the physician columns, the two sets of non-interacted
coefficients predict behavior in the absence of cost-shocks. We again see support of Prediction
2, that private nonprofits are much less likely to outsource services with high physician-
intensity, and local hospitals are less likely to outsource any service. As the cost shock grows,
however, private nonprofits start to outsource these physician-intensive services, as shown by
the large positive coefficient (0.8) on the interacted variable in column (2). Non-physician-
intense services do not see such a change with increasing fixed costs, as evidenced by the
small (0.2) and statistically insignificant interacted coefficient in column (3). We present
these results graphically in Figure 2. Each row of paired figures shows the outsourcing
differences for that ownership type and a for-profit as the fixed cost shock increases over the
horizontal axis. The left figures show the differences in high bias services, the right show
differences in low bias services. Notice that private nonprofits and local hospitals, in high
bias services, both show a clear upward slope that crosses or approaches zero, indicating
that as fixed costs grow, the differences shrink. In contrast, the right-hand figures show the
relationship between outsourcing for non-physician intense services, where the slopes begin
closer to zero and remain fairly flat.
For labor-intensive services, columns (4) and (5) show that, again, local hospitals differen-
tially keep control of most services. However, low-shock local hospitals especially keep control
of labor-intensive services (column (4)). Private nonprofits are not differentially responsive
to cost shocks for labor intensive services, with similar coefficients in both column (4) and
column (5). The interacted coefficients on labor-intensity and peak ground acceleration are
positive, suggesting that nonprofits begin to act more like for-profits as fixed costs increase.
These coefficients are not significant for the average level of peak ground acceleration. To
see the relationship for the range of acceleration values, we present these results graphically
in Figure 3. Note local hospitals’ steep gradient of the relationship between fixed costs and
outsourcing for labor-intensive services, significantly different from zero at low fixed costs.
However, the non-labor-intensive service relationship remains flat.
The final point to note is that the seismic cost shocks do not seem to be strongly cor-
related with the outsourcing intensity of the for-profit firms, as the uninteracted effect of
peak acceleration is never significant (although in the case of labor- and physician-intensive
services, it is quite large). This is consistent with a simple model of the (null) effect of
fixed-cost on profit maximization.
26

(a) Nonprofit
(b) District
(c) Local
Figure 1: Intensive Margin Ownership Effects as Function of Cost Shocks
27

(a) Nonprofit, Physician-Intense (b) Nonprofit, Non-Physician-Intense
(c) District, Physician-Intense (d) District, Non-Physician-Intense
(e) Local, Physician-Intense (f) Local, Non-Physician-Intense
Figure 2: Ownership Effects as Function of Cost Shocks and Physician-Intensity
28
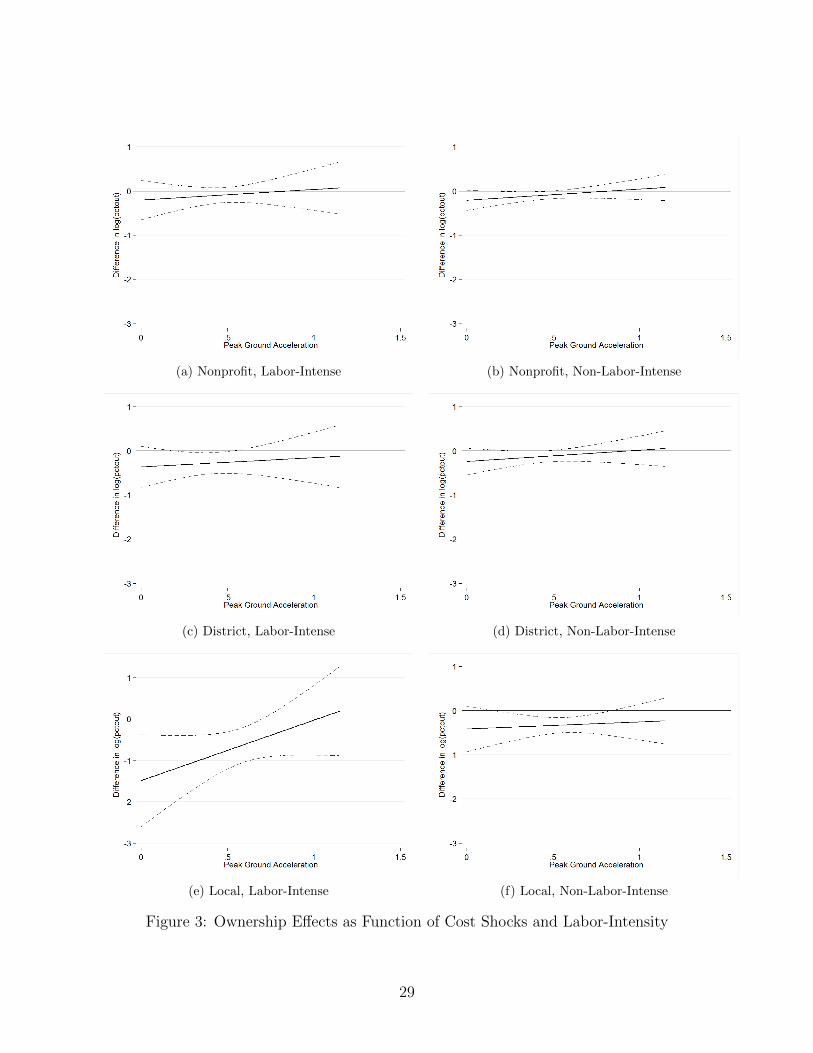
(a) Nonprofit, Labor-Intense (b) Nonprofit, Non-Labor-Intense
(c) District, Labor-Intense (d) District, Non-Labor-Intense
(e) Local, Labor-Intense (f) Local, Non-Labor-Intense
Figure 3: Ownership Effects as Function of Cost Shocks and Labor-Intensity
29

5 Alternative Explanations
Although we believe that the difference in trade-off between net income and production
bias induced by restrictions on nonprofit income is the best explanation of the outsourcing
pattern that we observe, we recognize that alternative explanations exist. In this section we
consider several leading candidates.
Nonprofits may simply have a bigger in-house production possibility frontier. Maybe
the employees of nonprofits are more intrinsically motivated and donate labor, because they
agree with the mission, which lowers the cost of performing services in-house. Maybe the
tax advantages lower the real cost of in-house production. But if this story is driving the
observed patterns, why do nonprofits’ outsourcing decisions conform more with for-profits
when times are tough? If it is simply a difference in production constraints, and not a
difference in the marginal willingness-to-substitute between cost and production bias, we
should see for-profit and nonprofit firms respond similarly to fixed-cost shocks, but they do
not.
Alternatively, outsourcing could involve a non-monetary management effort. The firm
uses costly time and expertise to go out and cultivate a good relationship with a service
provider. Since money is less valuable than time or effort to nonprofits, relative to the
for-profit (on the margin), nonprofits are less likely to want to make this investment in
provider relationships. This story could be captured in our model, where the production bias
here is simply managerial effort slack. This alternative explanation could emerge from the
exemption of teaching hospitals from the prohibition of directly employing physician labor. If
teaching hospitals are more likely to be nonprofit, this may lead to less contracting experience
disproportionately for nonprofits. This interpretation of management effort is inconsistent
with the data, however, at least for private nonprofits, because this inexperience/managerial
slack would have to manifest itself only in selective portions of the hospital’s contracting of
services outside of physician employment. In the data, nonprofits seem just as willing as
for-profits to put in the managerial effort to outsource non-physician-intensive services, like
grounds and maintenance or accounting services.
One other difference between nonprofits and for-profits that we have not explored is the
firm’s ability to access credit markets. Since nonprofits are not able to issue equity, they
have a restricted set of instruments available to generate cash. If nonprofits have a hard time
getting trade credit from suppliers, they may prefer the constant, certain cost of employment
over the fluctuating costs of contracting. This explanation, however, is inconsistent with the
attractiveness of outsourcing increasing as the budget gets tighter and free cash, presumably,
declines. If doing services in-house minimizes cash demands, nonprofits should bring even
30

more services in-house when a cost shock makes cash even more valuable. We observe the
opposite.
A related concern is that nonprofits garner a significant fraction of their capital from
endowments, financed by donors. Maybe donors like to buy capital goods, rather than fund
contracts to outside providers. Once the capital is in place, the benefit of outsourcing the
labor, alone, is small. However, this explanation is inconsistent with the pattern we see in the
outsourcing of labor-intensive services. For public hospitals, we know that labor-intensive
services are relatively less intensively outsourced, but for private nonprofits there seems to be
no difference in relative outsourcing between labor-intensive and non-labor intensive services.
These patterns suggest that the labor/capital mix has little to do with outsourcing decisions
(in the private nonprofit case) or goes the “wrong way” (in the public case).
Finally, there could be a sample selection story. Maybe some services are profitable
for a small hospital to offer only if outsourcing opportunities exist. Nonprofits offer these
services whether the services are profitable or not, while for-profits only offer them if they
are profitable (Horwitz 2007). If this were the case, we would see these particular services
being differentially done in-house by nonprofits, even though if all hospitals offered them,
outsourcing rates would be similar. To check this, we limit our investigation to a subsample
of services that are offered by nearly all hospitals, yet the size/significance of the relationships
we identify are quite similar. If the outsourcing patterns were mostly a selection story, we
should see these differences get much smaller in the non-selected sample.
6 Conclusion
We find that private nonprofit, public, and for-profit hospitals consistently and significantly
differ in the extent to which they outsource services. Controlling for a variety of potential
confounders, nonprofit and district hospitals outsource less than for-profits, and local hos-
pitals outsource least of all. The difference between nonprofits and for-profits seems to be
driven by services for which control of the manner of production is particularly important.
The sort of services for which control is important seems to differ between public and private
nonprofits, however. Finally, all types of nonprofit hospitals come to look more like for-
profits if they are hit with a large fixed-cost shock, such as an expensive seismic retrofitting
requirement. For the private nonprofits, all of these results are consistent with a model in
which restrictions on nonprofit income lead nonprofits to trade off between costs and control
at a different rate than for-profits do. The private nonprofit differential seems to be driven
primarily by physician-intensive services, suggesting that elite workers may be influencing
31
managers to keep control of the services that are important to them, but that does not seem
to be the complete story for local public hospitals. Instead, it looks like public hospitals
also prefer to conduct labor-intensive services in-house, suggesting the public managers (are
induced to) value control over labor per-se.
These findings shed new light on two literatures: the determinants of the make-or-buy
decision in organizations other than traditional profit-maximizing firms and the differential
behavior of nonprofit versus for-profit versus public firms.
We provide the first empirical demonstration that there is an economically significant
divergence between the way for-profit firms draw their firm boundaries and the way that
similarly-situated nonprofit and public firms do. This difference occurs both in terms of
levels and in terms of how the boundaries move in response to cost shocks. Furthermore,
it is not simply a difference between nonprofit and for-profit firms, because the difference
between public nonprofits and private nonprofits is just as big as the difference between
private for-profits and private nonprofits. In brief, if we think about outsourcing as a trade-
off between cost and control over the manner of production, nonprofits seem to value cost
relatively less and control relatively more, at least as long as the nonprofit is not too close to
its shut-down constraint. One way of putting the public hospitals into this story is that they
value control over production much more than they value costs, especially for tasks that are
labor-heavy.
The extent to which models of outsourcing behavior derived in the for-profit context can
be directly applied to the decisions of public and nonprofit organizations depends on the
economic circumstances in which these organizations find themselves. When firms’ budgets
are relatively tight, nonprofit firms seem to make outsourcing decisions in much the same
way as for-profit firms do. But when nonprofit firms are far from their shut-down constraint
they seem to deviate more strongly from for-profits.
Finally, we provide new evidence about other dimensions of production differences across
ownership types. Nonprofits not only provide a broader range of services (Horwitz 2007),
they perform a larger fraction of those services themselves. Finally, consistent with much of
the literature (Chang and Jacobson 2011, Duggan 2002), we find that the three ownership
types react very differently to economic shocks. In particular, nonprofits and for-profits react
quite similarly along the extensive margin (much like they do along the shut-down margin
(Chang and Jacobson 2011)), but react very differently along the intensive margin. This
is more evidence that nonprofits act very much like budget-limited consumers, and not like
unconstrained profit maximizers.
32

References
Alesina, Alberto, Reza Baqir, and William Easterly, “Redistributive Public Employ-
ment,” Journal of Urban Economics, 2000, 48, 219–241.
Bajari, Patrick and Steven Tadelis, “Incentives Versus Transaction Costs: A Theory of
Procurement Contracts,” RAND Journal of Economics, 2001, 32, 387–407.
Balakrishnan, Ramji, Leslie Eldenburg, Ranjani Krishnan, and Naomi Soder-
strom, “The Influence of Instituional Constraints on Outsourcing,” Journal of Ac-
counting Research, 2010, 48, 767–794.
Ballou, Jeffrey P. and Burton A. Weisbrod, “Managerial Rewards and the behavior
of for-profit, governmental, and nonprofit organizations: Evidence from the hospital
industry,” Journal of Public Economics, 2003, 87, 1895–1920.
Brown, Trevor and Matthew Potoski, “Transaction Costs and Institutional Explana-
tions for Government Service Production Decisions,” Journal of Public Administration
Research and Theory, 2003, 13, 441–68.
Chang, Tom and Mireille Jacobson, “What do Nonprofit Hospitals Maximize? Evidence
from California’s Seismic Retrofit Mandate,” 2011. Working Paper, 2011.
Clark, Andrew E. and Carine Milcent, “Public Employment and Political Pressure:
The Case of French Hospitals,” Journal of Health Economics, 2011, 30, 1103–12.
Coles, Jerilyn W. and William S. Hesterly, “The impact of firm-specific assets and
the interaction of uncertainty: an examination of make or buy decisions in public and
private hospitals,” Journal of Economic Behavior and Organization, 1998, 36, 383–409.
David, Guy and Arthur J. Chiang, “The determinants of public versus private provision
of Emergency Medical Services,” International Journal of Industrial Organization, 2009,
27, 312–19.
Deneffe, Daniel and Robert T. Masson, “What do nonprofit hospitals maximize?,”
International Journal of Industrial Organization, 2002, 20, 461–92.
Duggan, Mark, “Hospital market structure and the behavior of not-for-profit hospitals,”
The RAND Journal of Economics, 2002, 33, 433–46.
33

Eggleston, Karen, Yu-Chu Shen, Joseph Lau, Christopher Schmid, and Jia Chan,
“Hospital Ownership and Quality of Care: What explains the different results in the
literature?,” Health Economics, 2008, 17, 1345–1362.
Glaeser, Edward, “Introduction,” in Edward L. Glaeser, ed., The Governance of Not-For-
Profit Organizations, NBER, 2003, chapter 1.
Glaeser, Edward L. and Andrei Shleifer, “Not-for-profit Entrepreneurs,” Journal of
Public Economics, 2001, 81, 99–115.
Hart, Oliver, Andrei Shleifer, and Robert Vishny, “The Proper Scope of Government:
Theory and an Application to Prisons,” Quarterly Journal of Economics, 1997, 112,
1127–61.
Heckman, James J., “Sample Selection Bias as a Specficiation Error,” Econometrica, 1979,
47, 153–61.
Horwitz, Jill R., “Does Nonprofit Ownership Matter,” Yale Journal of Regulation, 2007,
24, 139–204.
and Austin Nichols, “Hospital ownership and medical services: Market mix, spillover
effects, and nonprofit objectives,” Journal of Health Economics, 2009, 28, 924–37.
Iossa, Elisabetta and David Martimort, “Risk Allocation and the costs and benefits of
public-private partnerships,” The RAND Journal of Economics, 2012, 43, 442–74.
Lafontaine, Francine and Margaret Slade, “Vertical Integration and Firm Boundaries:
The Evidence,” Journal of Economic Literature, 2007, 45, 629–85.
Levin, Jonathan and Steven Tadelis, “Contracting for Government Services: Theory
and Evidence from U.S. Cities,” The Journal of Industrial Economics, 2010, 53, 507–
541.
Lopez de Silanes, Florencio, Andrei Shleifer, and Robert Vishny, “Privatization in
the United States,” The RAND Journal of Economics, 1997, 28, 447–71.
Malani, Anup, Tomas Philipson, and Guy David, “Theories of firm behavior in the
nonprofit sector: A synthesis and empirical evaluation,” in Edward L. Glaeser, ed., The
Governance of Not-For-Profit Organizations, Chicago: University of Chicago Press,
2003.
34

Martimort, David and Jerome Pouyet, “To Build or Not to Build: Normative and
Positive Theories of Public-Private Partnerships,” International Journal of Industrial
Organization, 2008, 26, 393–411.
McClellan, Mark B. and Douglas O. Staiger, “Comparing Hospital Quality at For-
Profit and Not- for-Profit Hospitals,” in David M. Cutler, ed., The Changing Hospital
Industry, Chicago: University of Chicago Press, 2000.
Meade, Charles and Richard Hillestand, “SB1953 and the Challenge of Hospital Seismic
Safety in California,” Technical Report, California HealthCare Foundation January
2007.
, Jonathan Kulick, and Richard Hillestand, “Esimating the Compliance Costs for
California SB1953,” Technical Report, California HealthCare Foundation April 2002.
Nelson, Michael A., “Municipal Government Approaches to Service Delivery: An Analysis
from a Transaction Cost Perspective,” Economic Inquiry, 1997, 35, 82–96.
Pauly, M. and M. Redisch, “The not-for-profit hospital as a physician’s cooperative,”
American Economic Review, 1973, 63, 87–99.
Picone, Gabriel, Shin-Yi Chou, and Frank Sloan, “Are for-profit hospital conversions
harmful to patients and to Medicare?,” The RAND Journal of Economics, 2002, 33,
507–523.
Shleifer, Robert W. Vishny Andrei, “Politicians and Firms,” The Quarterly Journal of
Economics, 1994, 109 (4), 995–1025.
Sloan, Frank, “Nonprofit Ownership and Hospital Behavior,” in A. J. Culyer and J.P.
Newhouse, eds., Handbook of Health Economics, Volume 1, Elsevier Science, 2000, chap-
ter 21, pp. 1141–1174.
Sloan, Frank A., Gabriel Picone, Donald H. Taylor Jr., and Shin-Yi Chou, “Hos-
pital ownership and cost and quality of care: Is there a dime’s worth of difference,”
Journal of Health Economics, 2001, 20, 1–21.
35

Appendix: Empirical Results with Common Services Only
Table 6: Summary Statistics by Ownership Type, Weighted by Number of Services. (Com-mon Services)
For-Profit Private NP District Local
Percent Outsourced 25.46 19.69 20.31 18.90(33.62) (29.09) (29.84) (27.92)
Service Completely Out 0.0516 0.0305 0.0421 0.0193(0.221) (0.172) (0.201) (0.138)
Service Any Out 0.864 0.859 0.870 0.884(0.343) (0.349) (0.336) (0.320)
Discharges 5890.7 10714.3 5288.7 12235.5(4398.8) (7557.6) (6265.4) (10258.6)
Services Offered 52.44 56.93 51.14 55.37(8.765) (10.04) (10.45) (8.139)
Pct. MediCal 28.05 20.17 39.57 53.23(21.63) (16.09) (26.06) (14.29)
Pct. Medicare 44.08 45.41 36.35 16.52(17.27) (14.05) (19.68) (11.17)
Common Services 43.24 43.06 41.19 43.27(4.811) (5.157) (5.758) (3.842)
Residency Program 0.162 0.238 0.0229 0.723(0.369) (0.426) (0.149) (0.447)
Rural 0.0573 0.132 0.608 0.134(0.232) (0.339) (0.488) (0.340)
Peak Acceleration 0.494 0.472 0.461 0.524(0.142) (0.227) (0.251) (0.227)
Pop. in HSA 503228.0 333263.2 127878.9 409001(642057.6) (420209.8) (171968.6) (480735.9)
Pct. Black in HSA 6.810 5.122 3.234 7.441(7.764) (6.181) (4.218) (9.644)
Pct. Poor in HSA 14.47 13.18 14.79 14.69(6.915) (6.042) (6.256) (6.292)
med. HH Earn in HSA 45696.3 45610.1 37753.8 42611.5(15218.3) (14543.9) (11109.6) (13264.4)
HS Grad in HSA 21.32 21.83 25.15 22.04(5.078) (5.827) (5.765) (5.562)
Some Col. in HSA 25.61 26.66 27.42 25.76(8.451) (9.040) (9.438) (9.421)
Pct Bach. in HSA 15.88 16.66 12.19 14.50(6.636) (7.434) (5.614) (7.407)
Pct Grad/Prof in HSA 7.910 8.504 5.765 7.293(4.872) (5.984) (3.398) (4.375)
County Unemp. 5.889 6.324 7.931 7.437(1.887) (2.362) (3.846) (4.088)
N 51k 108k 22k 12k
Sample means and standard deviations in parentheses at the service x hospital x year level.
36
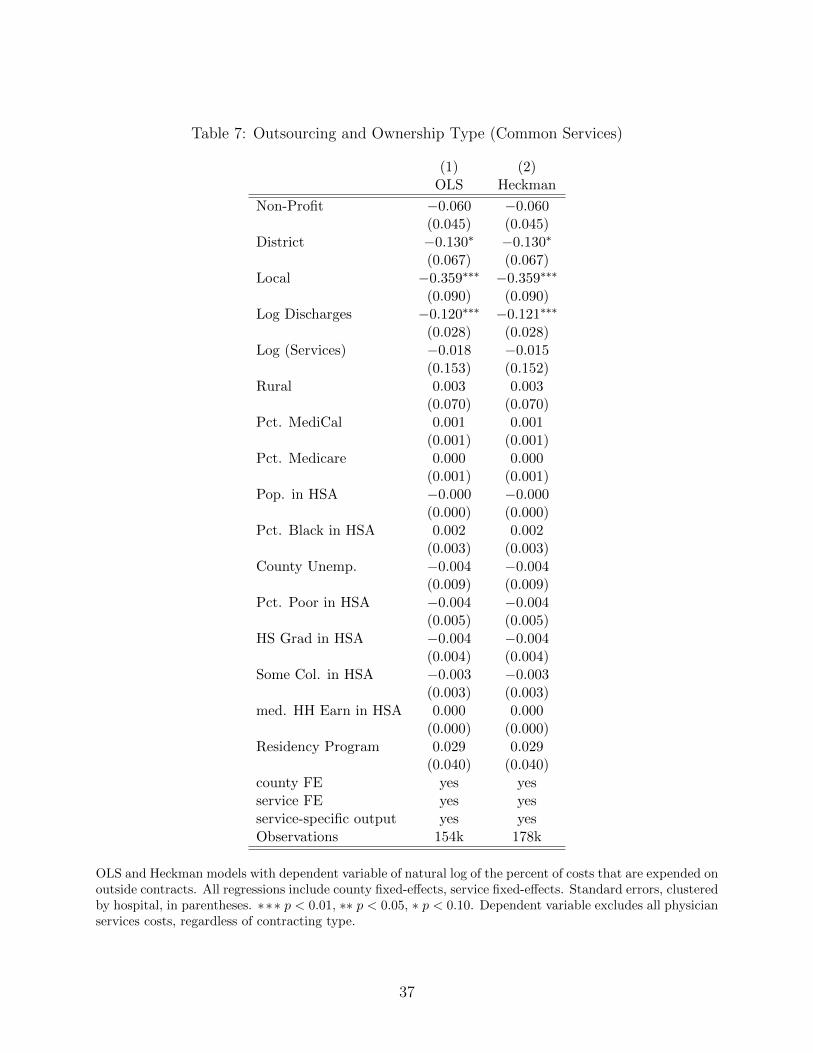
Table 7: Outsourcing and Ownership Type (Common Services)
(1) (2)OLS Heckman
Non-Profit −0.060 −0.060(0.045) (0.045)
District −0.130∗ −0.130∗
(0.067) (0.067)Local −0.359∗∗∗ −0.359∗∗∗
(0.090) (0.090)Log Discharges −0.120∗∗∗ −0.121∗∗∗
(0.028) (0.028)Log (Services) −0.018 −0.015
(0.153) (0.152)Rural 0.003 0.003
(0.070) (0.070)Pct. MediCal 0.001 0.001
(0.001) (0.001)Pct. Medicare 0.000 0.000
(0.001) (0.001)Pop. in HSA −0.000 −0.000
(0.000) (0.000)Pct. Black in HSA 0.002 0.002
(0.003) (0.003)County Unemp. −0.004 −0.004
(0.009) (0.009)Pct. Poor in HSA −0.004 −0.004
(0.005) (0.005)HS Grad in HSA −0.004 −0.004
(0.004) (0.004)Some Col. in HSA −0.003 −0.003
(0.003) (0.003)med. HH Earn in HSA 0.000 0.000
(0.000) (0.000)Residency Program 0.029 0.029
(0.040) (0.040)county FE yes yesservice FE yes yesservice-specific output yes yesObservations 154k 178k
OLS and Heckman models with dependent variable of natural log of the percent of costs that are expended onoutside contracts. All regressions include county fixed-effects, service fixed-effects. Standard errors, clusteredby hospital, in parentheses. ∗∗∗ p < 0.01, ∗∗ p < 0.05, ∗ p < 0.10. Dependent variable excludes all physicianservices costs, regardless of contracting type.
37

Table 8: Outsourcing Differential by Physician- and Labor-Intensity (Common Services)
(1) (2)Physician Labor
Non-Profit −0.043 −0.058(0.045) (0.045)
District −0.126∗ −0.114∗
(0.069) (0.069)Local −0.352∗∗∗ −0.335∗∗∗
(0.090) (0.089)Non-Profit x Physician Intensive −0.201∗∗∗
(0.070)District x Physician Intensive −0.046
(0.106)Local x Physician Intensive −0.085
(0.173)Non-Profit x Labor Intensive −0.022
(0.075)District x Labor Intensive −0.194
(0.128)Local x Labor Intensive −0.282
(0.218)Hospital Controls yes yesHSA Controls yes yescounty FE yes yesservice FE yes yesservice-specific output yes yesObservations 154k 154k
Dependent variable is the natural log of the percent of costs that are outside contracts. (d) indicates adummy variable. Standard errors, clustered by hospital, in parentheses. ∗ ∗ ∗ p < 0.01, ∗∗ p < 0.05, ∗p < 0.10. Dependent variable excludes all physician services costs, regardless of contracting type.
38

Table 9: Outsourcing and Seismic Cost Shocks (Common Services)
Physician Labor
(1) (2) (3) (4) (5)Full Sample Intensive Not Intensive Not
Non-Profit −0.178 −0.571∗∗ −0.145 −0.371 −0.159(0.114) (0.234) (0.116) (0.271) (0.119)
District −0.238 −0.418 −0.227 −0.588∗ −0.209(0.160) (0.294) (0.165) (0.301) (0.171)
Local −0.465∗ −1.135∗∗∗ −0.401 −1.861∗∗∗ −0.330(0.269) (0.392) (0.272) (0.616) (0.272)
Non-Profit x Acc 0.224 0.779∗ 0.180 0.613 0.187(0.211) (0.471) (0.212) (0.499) (0.219)
District x Acc 0.206 0.245 0.210 0.817 0.158(0.307) (0.528) (0.312) (0.574) (0.318)
Local x Acc 0.226 0.950 0.157 2.322∗∗ 0.023(0.451) (0.746) (0.452) (0.919) (0.457)
Peak Acceleration −0.076 −0.527 −0.041 −0.699 −0.019(0.228) (0.479) (0.229) (0.493) (0.237)
Hospital controls yes yes yes yes yesHSA controls yes yes yes yes yescounty FE yes yes yes yes yesservice FE yes yes yes yes yesservice-specific output yes yes yes yes yesn 152k 12.5k 139.5k 13.2k 138.8k
Dependent variable is the natural log of the percent of costs that are outside contracts, and includes onlythose observations with positive outsourcing. HSA controls include population, percent black, percent poor,median household earnings, and four educational mix variables. (d) indicates a dummy variable. Standarderrors, clustered by hospital, in parentheses. ∗ ∗ ∗ p < 0.01, ∗∗ p < 0.05, ∗ p < 0.10. Dependent variableexcludes all physician services costs, regardless of contracting type.
39