Embed Size (px)
DESCRIPTION
Cost Repositioning – an Institutional C ase S tudy. Kandice Kottke -Marchant, MD, PhD Chair, Robert J. Tomsich Pathology & Laboratory Medicine Institute Cleveland Clinic. Cleveland Clinic’s Cost Repositioning Approach. Cost Repositioning Objectives. - PowerPoint PPT Presentation
Citation preview

Cost Repositioning – an Institutional Case StudyCost Repositioning – an Institutional Case Study
Kandice Kottke-Marchant, MD, PhD
Chair, Robert J. Tomsich Pathology & Laboratory Medicine Institute
Cleveland Clinic

Cleveland Clinic’s Cost Repositioning ApproachCleveland Clinic’s Cost Repositioning Approach

Cost Repositioning Objectives
Cost Repositioning Objectives
• Provide value and ensure affordable care for patients
• Leading innovation in changing industry
• Transformational cost structure changes
• Balancing the shift: volume to value

Cost Repositioning2014 - 2016 Goals
* Implemented Savings(in millions)
$0
$200
$400
$600
$800
$1,000
100
270
200
75
35 10 10
140TBD
560
Clinical
Programs & Assets
Indirect
Non-Staff
Staff
Stewardship
Research
Education
Value Based Care
20% Overla
pTotal

Org ChartOrg ChartExecutive Check In
CEO, Chief of Staff, Chief Strategy Officer
Task ForcePhysician-Led with Members Representing:
• Physician Leadership• Administration• Nursing• Marketing & Human Resources
Workstreams
Project Management
OfficeFinance Human
ResourcesMarketing /
Communications

Structure
Full engagement & sponsorship
of CEO / Chief of StaffExecutive Leadership
Physician-Led Task Force
Workstreams
Cross-functional physician, nursing and administrative leadership team
Intentionally not aligned with org. structure to encourage transformative change

Workstreams• Clinical
• Indirect
• Non-Staff
• Staff
• Stewardship
• Research
• Education
• Value Based Care

Project PipelineProject PipelineIdea /
In-Process Approval Implemented
Clinical 35 17 4
Education 4 0 5
Indirect 23 teams* 18 0
Non-Staff 10 5 4
Research 33 1 0
Staff 2 0 2
Stewardship 27 18 8
VBC TBD 0 0
Total 134* 59 22
*Each Indirect team will present numerous ideas As of 4/15/14

Specific Pathology and Laboratory Medicine Drivers
for Cost Reduction
Specific Pathology and Laboratory Medicine Drivers
for Cost Reduction

LabCorp Quest Aetna Anthem Cigna MMO UHC
100% Medicare
45-80% of CMS
45-80% of CMS
200% of CMS
406% of CMS
147% of CMS
285% of CMS
452% of CMS*
* Reflects new lab pricing; UHC’s current price is 537% of CMS
Transparency and Decreased ReimbursementPathology & Lab Med
Cleveland Clinic

Additional DriversAdditional Drivers
• Devaluation- Biopsy codes- Cytopathology codes
• Revaluation- IHC codes
• Other changes - Molecular diagnostic billing codes

Robert J. Tomsich Pathology & Laboratory
Medicine Institute Approach
Robert J. Tomsich Pathology & Laboratory
Medicine Institute Approach

RT-PLM Cost Repositioning Summary
RT-PLM Cost Repositioning Summary
• Reduce cost per test by 30%• How?
- Assess current operations- Develop enterprise-wide transformational
strategies: optimize laboratory resources- Implement
201412%*
201510%
20168%
*2.6% from 2014 budget + 9.4% new in 2014

Major Projects Major Projects
• Department Reorganization • Administrative Reorganization • Lab consolidation • Pathology sub specialty consolidation• Allogen: transplant lab reorganization• Preanalytics optimization

Big Picture: How We Are Saving Big Picture: How We Are Saving Restructuring
16%
Test Consol-idation
13%
Allogen 11%
Sendouts12%
PathologySubspecialty
Consolidation14%
CCL 5%
Attrition 9%
Preanalytics 11%
IT 3%
Other 6%

Department and Administrative Reorganization
Department and Administrative Reorganization
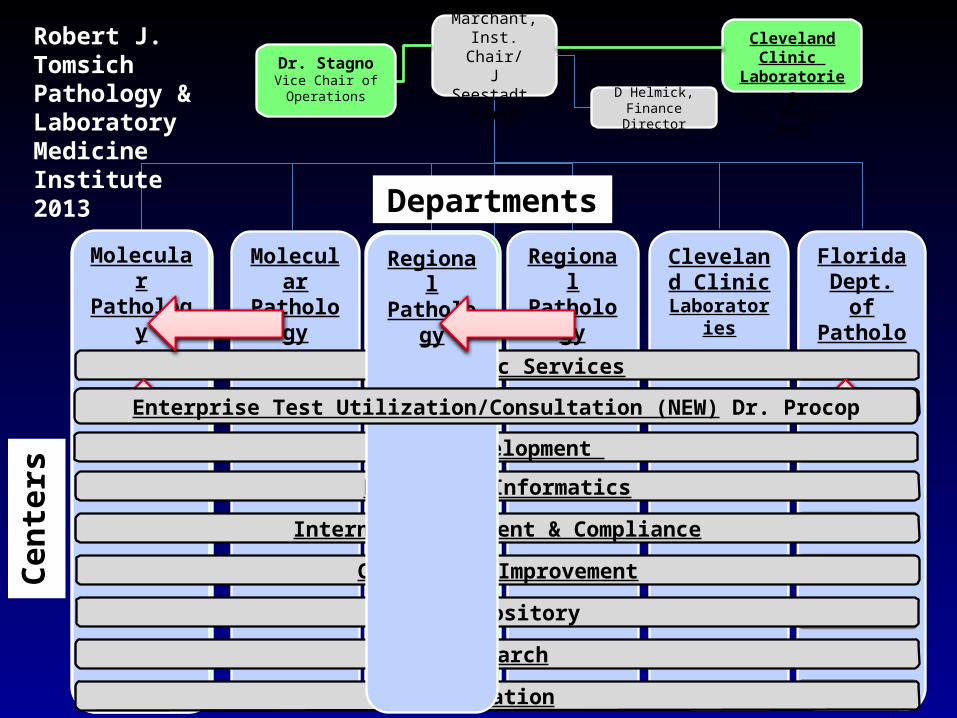
Clinical Pathology
Dr. Hsi
Anatomic PathologyDr. Goldblum
MolecularPathology
Regional Pathology
Cleveland Clinic
Laboratories
Florida Dept. of
Pathology
Departments
Cen
ters
Robert J. Tomsich Pathology & Laboratory Medicine Institute 2013
Dr. Marchant, Inst. Chair/J Seestadt,
AdminD Helmick,
Finance Director
Laboratory Medicine
Dr. Hsi
MolecularPathology
PathologyDr. Goldblum
Preanalytic Services
Family Health Centers
Pathology Informatics
Biorepository
Research
Education
Internal Assessment & Compliance
Continuous Improvement
Test Development
Regional Pathology
Cleveland Clinic LaboratoriesDr. Bosler, Head
Dr. StagnoVice Chair of Operations
Enterprise Test Utilization/Consultation (NEW) Dr. Procop

Administrative RestructuringAdministrative Restructuring
1
1st Tier: Clinical
Operations
FORMER: 41 FTEREVISED: 23 FTE*
REDUCTIONS: 13 FTE
2nd Tier: Lab Med and
Preanalytics
FORMER: 45 FTEREVISED: 34 FTE
REDUCTIONS: 12 FTE
• Align management (regional hospitals)• Accountability• Supervisor + team
leader/coordinator
Non-Clinical Operations
FORMER: 25 FTEREVISED: 23 FTE
REDUCTIONS: 2 FTE
CP
AP
MP
RP
FHC
PreA
Lab Med
PreA
Path
• Lab Admin• Quality• Informatics• Finance• Education

Lab Consolidation Lab Consolidation

Lab Medicine Consolidation – Why?
• Increased efficiency and decreased cost/test• Enterprise subspecialty lab oversight • Standardize enterprise quality and
compliance • Enterprise-wide oversight of laboratory
operations and preanalytics• Consolidated pre-analytics will improve
quality and decrease errors

HHFairview Hospital
Lakewood Hospital
HH
Lutheran Hospital
HH
Ashtabula CMC
HH
Euclid Hospital
HH
Hillcrest Hospital
HH
South PointeHospital
HH
Marymount Hospital
HH
ClevelandClinic
HHMedina Hospital
Following the completion of lab and pathology consolidation, main campus will ultimately see about a
32% increase in billable tests.

Lab Consolidation Process Highlights
Lab Consolidation Process Highlights
• Enterprise Optimization Committee- Members from across the enterprise –
• Hospital presidents/COO• pathology and laboratory medicine (SME)• Nursing• IT, logistics, preanalytics, finance, quality
- Defining required service levels between main campus and regional hospitals.
- Scope: Daily draw times, standardization, TAT, couriers (q2hr), billing, communication

Lab Test Consolidation PlanLab Test Consolidation Plan
Chem/Heme Routine IPChem/Heme Daily DrawsBlood bank OP / Routine IP
FTEs Absorbed Savings
Sep 2013 - May 2014 46 $2.8M
Consolidation Plan Reductions 60 $3.6M
Total 106 $6.4M
Hospitals Stage 1 Stage 2 Stage 3 Stage 4 Stage 5 Stage 6
Marymount
Lutheran
Euclid
Medina
Lakewood
South Pointe
Hillcrest
Fairview*Marymount includes Marymount South facility for chemistry
FTEs (Sep 2013) - 375
FTEs (May 2014) - 328 313 292 274 268
Stage savings (in millions) 0.9$ 1.3$ 1.1$ 0.3$
Operational Stages
PILOT
NON
PILOT
BUSIEST
AFB / Mycology / Parasit (IP/OP)Chemistry OPHematology OPMicro OP / IP (Non-stat)

Pathology Consolidation - Why?
• All enterprise pathology specimens with subspecialty signout
• Improve histology and cytopathology processing efficiency: decrease cost/test
• Pathologist RVUs 80th percentile target• Standardize frozen section & cytology
rapid reads - ePathology

Pathology ConsolidationPathology Consolidation• Professional Subspecialty Service Model
- Frozen Section Coverage- Surgical Pathology & Cytopathology subspecialty plan - Credentialing
• Consolidate Technical Operations - Accessioning, specimen tracking, courier deliveries,
histology, cytology, billing, etc.
• Facility & Equipment Prerequisites- Main campus office space- Biopsy cell - Digital scanners and web cams- Scheduling system

AP Consolidation (Regional to Main)2013 Workload by Subspecialty
AP Consolidation (Regional to Main)2013 Workload by Subspecialty
• Subspec. Wt. FTE Need^• GYN 2.82• GI 2.06• Breast 1.06• SFT 0.92• Ortho 0.90• GU 0.77• HPB 0.66• ENT 0.44 • Derm 0.30• PUL 0.27• 10.20
• Cyto 2.15
• BM/Lymph 1.25 (EH)
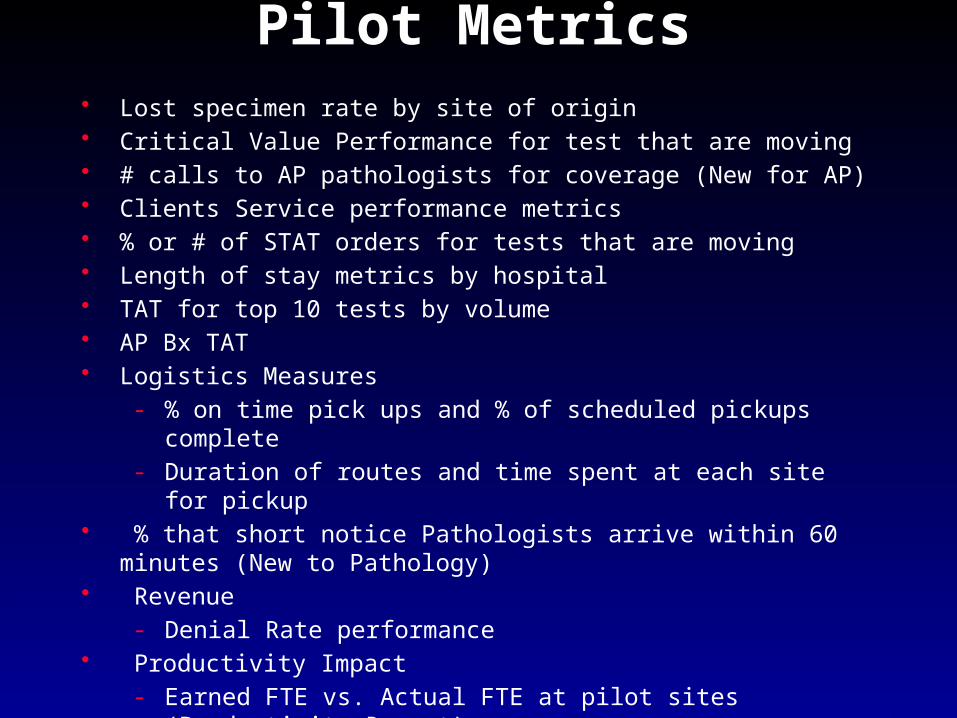
Pilot Metrics• Lost specimen rate by site of origin • Critical Value Performance for test that are moving• # calls to AP pathologists for coverage (New for AP)• Clients Service performance metrics• % or # of STAT orders for tests that are moving• Length of stay metrics by hospital• TAT for top 10 tests by volume• AP Bx TAT • Logistics Measures
- % on time pick ups and % of scheduled pickups complete- Duration of routes and time spent at each site for pickup
• % that short notice Pathologists arrive within 60 minutes (New to Pathology)
• Revenue - Denial Rate performance
• Productivity Impact- Earned FTE vs. Actual FTE at pilot sites (Productivity Report)

RT-PLMI Cost Repositioning 2014 Timeline
Au
gu
st
May
Jun
e
July
Approvals granted
Dept + AdminRestructure First Pilot
Meetings with
Lutheran and
Marymount
First RT-PLMI Ent.
Opt. Meeting
Sep
tem
ber
Oct
ob
er
New Managers
Hired
2nd Tier Reorg
Pilots Begin
Dec
emb
er
PathologyConsoli-dation

Percentage of Savings = 9.4%Percentage of Savings = 9.4%
Education
Finance
Internal Audit & Control
Test Development
Informatics
CCL
Allogen
Pathology
PreAnalytics
Lab Medicine
0.00% 0.50% 1.00% 1.50% 2.00% 2.50% 3.00% 3.50% 4.00% 4.50%
0.04%
0.07%
0.11%
0.31%
0.34%
0.70%
1.01%
1.44%
1.46%
3.88%
Percentage of OpEx Savings by Area
Total 2014: 9.4% new in 2014 + 2.6% from 2014 budget

Challenges• Long-term, multi-year transformation
• Change throughout organization
• Aligning annual planning timeline / process
• Organizational engagement
• Communication to all stakeholders
• Setting service level expectations

“….the pathway to improving quality and safety is the same pathway to lowering cost, and that involves relentlessly taking waste and unnecessary variability out of our processes.”

Questions? Questions?