Embed Size (px)
Citation preview
Cost Reduction Potentials of Offshore Wind Power in GermanyShort Version

Prognos AG:Jens HobohmLeonard KrampeFrank Peter
The Fichtner Group:Andree GerkenPeter HeinrichMaik Richter
Cost Reduction Potentials of Offshore Wind Power in GermanyShort Version
3
Contents
Preface of The German Offshore Wind Energy Foundation 5
Overview of Results 7
Introduction and methods
1 Background and Task 8
2 Approach 9
3 Defining Scenarios and Distinguishing Cases 11
Cost Structure and Cost Reduction Potential
4 Investment Costs 13
5 Operating Costs 15
6 Cost of Capital 16
7 Energy Generation 17
8 Development and Structure of Levelised Costs of Energy 18
9 Cost Reduction Potentials 20
Conclusions
10 How to Exploit the Potentials 22
List of Interview Partners 24
Appendix 26

4
List of Commissioning Entities Stiftung OFFSHORE-WINDENERGIE (“The German Offshore Wind Energy Foundation”) Oldenburger Str. 65, D-26316 Varel Offshore Forum Windenergie Kaiser-Wilhelm-Str. 93, D-20355 Hamburg Verband Deutscher Maschinen- und Anlagenbau e.V., Fachverband Power Systems Lyoner Straße 18, D-60528 Frankfurt/Main Windenergie-Agentur WAB e.V. Barkhausenstraße 2, D-27568 Bremerhaven AREVA Wind GmbH Am Lunedeich 156, D-27572 Bremerhaven BARD Engineering GmbH Am Freihafen 1, D-26725 Emden DONG Energy Renewables Germany GmbH Van-der-Smissen-Straße 9, D-22767 Hamburg EnBW Erneuerbare und Konventionelle Erzeugung AG Schelmenwasenstraße 15, D-70567 Stuttgart E.ON Climate & Renewables Central Europe GmbH Steindamm 98, D-20099 Hamburg EWE VERTRIEB GmbH Donnerschweer Str. 22-26, D-26123 Oldenburg IBERDROLA Renovables Offshore Deutschland Zwei GmbH Charlottenstr. 63, D-10117 Berlin RWE Innogy GmbH Überseering 40, D-22297 Hamburg Siemens AG, Wind Power Division Lindenplatz 2, D-20099 Hamburg SWM Stadtwerke München GmbH Emmy-Noether-Straße 2, D-80287 München Trianel Windkraftwerk Borkum GmbH & Co. KG Lombardenstraße 28, D-52070 Aachen Vattenfall Europe Windkraft GmbH Überseering 12, D-22297 Hamburg WindMW GmbH Barkhausenstraße 4, D-27568 Bremerhaven wpd Offshore GmbH Kurfürstenallee 23a, D-28211 Bremen

5
Preface of The German Offshore Wind Energy Foundation
In August 2013, an offshore wind power capacity of almost 400 MW produces electricity in Germany, another seven offshore wind farms with a total capacity of about 2,000 MW are under construction. Substantial investments into expert staff and the construction of production facilities have been made. In 2012, the sector employed 18,000 people in Germany. This way, the necessary prerequisites for another approved 6,000 to 8,000 MW of capacity and for other wind farms that are in the planning stage have been created.
The framework conditions for investment decisions taken so far have been substantially improved by the introduction of the acceleration model. The Offshore-Windenergie program of the Kreditanstalt für Wiederaufbau (KfW) has provided further impetus. The Energiewirtschaftsgesetz was amended in order to meet challenges regarding warranty and network planning. All interested parties have an increased awareness of the specific planning schedules of capital-intensive offshore wind farm projects as well as of the interaction of grid connection issues and compensation.
At the same time, the discussion about the costs related to moving our energy supply towards renewable energies has been intensified since last autumn. The public opinion considers the competitiveness of offshore wind power increasingly important. In the context of this discussion, there is a risk that the development of offshore wind power is interrupted before this technology has reached its full potential through benefitting from learning effects.
Against this background, we have together with our partners in the offshore wind power industry commissioned Prognos AG and the Fichtner Group to analyse the potentials of decreasing levelised costs of energy of offshore wind power in Germany over the next ten years. The present study shows the necessary prerequisites and the areas where the largest cost reductions of the offshore wind power industry can be achieved.
We hope that the results of this study are being taken into consideration as an active contribution to the current political decision-making processes.
My thanks go out to those who have made this study possible by their commitment and support.
Jörg Kuhbier
Chairman of the Executive Board
The German Offshore Wind Energy Foundation

6

7
Overview of Results
In Germany, offshore wind power is at the beginning of its growth path. In the North and Baltic Sea, there are about 400 MW in operation. In the North Sea alone, there are currently seven wind farms under construction, with a total capacity of about 2,000 MW. Wind farms with an additional capacity of over 4,000 MW have been already approved. There are another 1,200 MW approved in the Baltic Sea. In Germany, the installed offshore wind power capacity is expected to reach between 6,000 and 10,000 MW by the year 2020.
For the currently operational offshore wind farms, the levelised costs of energy, i.e. the average cost for generating electricity over an operational time of 20 years, amounts to 12.8 to 14.2 Cent2012/kWh in real terms. According to scenario 1 and depending on the actual site, these costs can be gradually reduced by up to 32 %, and in the optimum market conditions of scenario 2 by up to 39 % over the next ten years. The main driver for the cost reduction is a continuous technological development across the entire added-value chain of the offshore wind power industry. It may bring about substantial savings regarding investment, operation and financing.
14 percentage points of the cost reduction in scenario 1 and 21 percentage points in scenario 2 are due to investment costs. Short-term, an improved logistics infrastructure for installing wind power plants will bring down the costs. In the long run, the trend towards larger turbines and more efficient production processes regarding the support structure will determine the development. In scenario 2, an intensified competition and economies of scales due to larger turbines and production volumes will lead to large cost reductions.
In scenario 1 and 2, respectively, 5 or 8 percentage points of the cost reduction result from bringing down operating and maintenance costs. This reduction is also triggered by an improved logistics infrastructure and faster ships. In the long run, particularly in scenario 2 inter-operator maintenance concepts further decrease costs.
In scenario 1, the reduction of the cost of capital and reduced contingency provisions for project risks account for another 12 percentage points of the cost reduction potential. As investment costs decrease at a lower rate, in scenario 1 this issue is more important than in scenario 2 where it amounts to 9 percentage points. As the growing experience with the technology results in reduced risk premia as part of the financing concepts this cost reduction potential is only indirectly a technological one. In both scenarios, reduced decommissioning costs account for about 1 percentage point.
The cost reduction potentials can be only realized if industry, politics and administration jointly create the necessary conditions. Stable legal and political framework conditions are essential in this context.
Already in the short term, an efficiency increase in the industry provides a substantial cost reduction potential. Technical standards for plant components and grid connections are an important prerequisite for serial production. Approval and certification criteria need to be simplified and standardised. Joint installation and maintenance concepts for adjacent wind farm locations increase installation and operating efficiency.
Technological innovation is a long-term field of action. More efficient turbines, optimised support structures and installation logistics offer a large potential for improvement. Here it is important to maintain a balance of innovation and risk minimisation.

8
1 Background and Task
Reducing green-house gases by at least 80 % by the year 2050 in relation to 1990, increasing the share of renewables to at least 80 % of the German gross electricity consumption and exiting nuclear energy are essential goals of the energy turnaround (“Energiewende”). Society faces increasing challenges when this is put into practice. Against this background, in January 2013 Prognos AG and the Fichtner Group were commissioned by The German Offshore Wind Energy Foundation and 15 of its partners and companies to analyse the cost reduction potentials of offshore wind power in Germany. This is the first study to include industry contributions and analyse for Germany the current status as well as describe in detail a perspective of how the costs for offshore wind power will develop in the future.
During the time of writing of this study, in Germany the first offshore wind farms with a total capacity of about 400 MW are operational. A total of 30 projects has been approved, with seven of them being under construction and another four preparing for construction after financing has been approved. Thus the offshore wind power sector is at the beginning of its industrial growth path. Capacities in planning, approval and certification, production, port infrastructure and logistics have been built up and now should be put into productive use.
This study analyses the development of the period between 2013 and 2023. This period coincides with the specific planning horizons of the industry and authorities. After the year 2023, if the market develops dynamically, there might be further cost-reducing developments in technology and framework conditions. However, from a current perspective, it is not possible to reliably quantify them.
As of June 2013, there is a total of over 6 Gigawatt of offshore wind power capacity connected to the grid in ten European countries. Companies that are active on the German market are often also represented on other European markets which shows the internationality of the offshore wind power industry. In 2012, the first authoritative study on cost degression potentials was published by The Crown Estate (TCE) in the UK. It arrives at the conclusion that for all investment decisions taken before 2020 the leveraged costs of energy (“LCOE”) of British offshore wind farms could be reduced by 30 % as compared to 2011.
The design of the present study follows the approach of the TCE study. This makes the results internationally comparable. However, the framework conditions of German offshore wind power are partially very different from those in the UK regarding water depth, distance to port, grid connection and financing. In addition, there have been further developments regarding technologies of and approaches to, among others, substructures, plant configuration, logistics and energy yield since the TCE study has been presented. Therefore, this study is based on independent data and calculations that have been verified for the German market along its entire value-added chain.
9
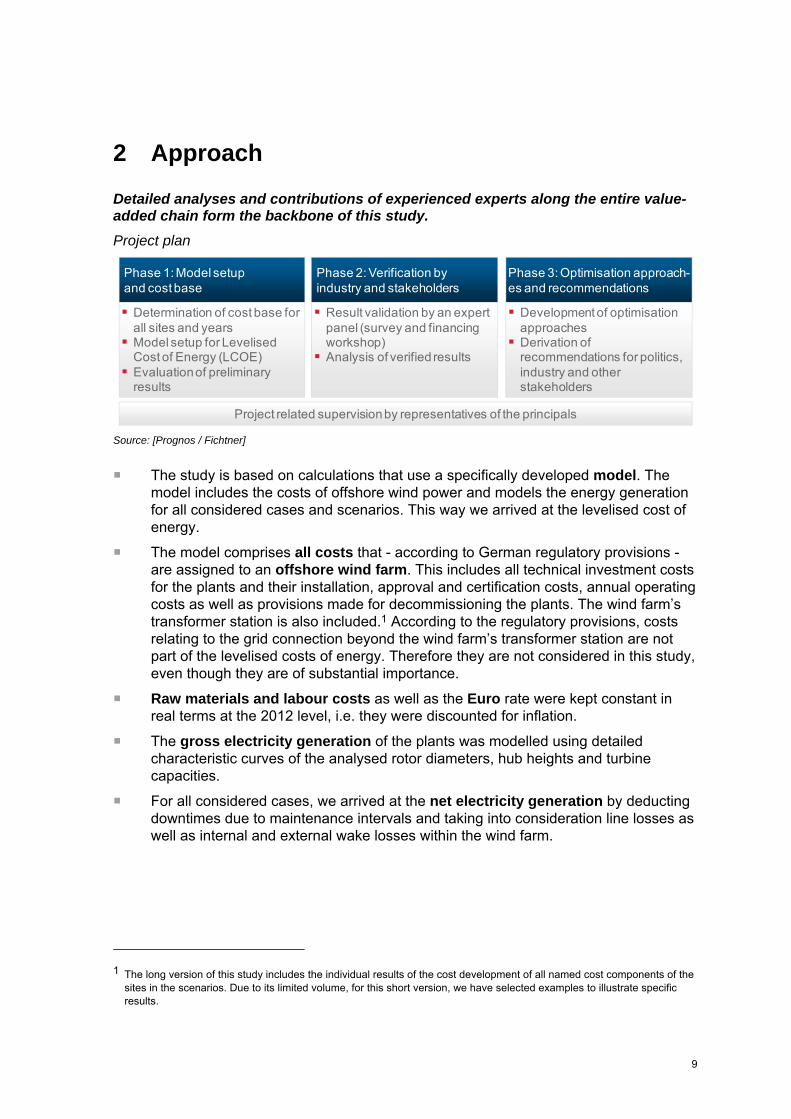
2 Approach
Detailed analyses and contributions of experienced experts along the entire value-added chain form the backbone of this study. Project plan
Source: [Prognos / Fichtner]
The study is based on calculations that use a specifically developed model. The model includes the costs of offshore wind power and models the energy generation for all considered cases and scenarios. This way we arrived at the levelised cost of energy.
The model comprises all costs that - according to German regulatory provisions - are assigned to an offshore wind farm. This includes all technical investment costs for the plants and their installation, approval and certification costs, annual operating costs as well as provisions made for decommissioning the plants. The wind farm’s transformer station is also included.1 According to the regulatory provisions, costs relating to the grid connection beyond the wind farm’s transformer station are not part of the levelised costs of energy. Therefore they are not considered in this study, even though they are of substantial importance.
Raw materials and labour costs as well as the Euro rate were kept constant in real terms at the 2012 level, i.e. they were discounted for inflation.
The gross electricity generation of the plants was modelled using detailed characteristic curves of the analysed rotor diameters, hub heights and turbine capacities.
For all considered cases, we arrived at the net electricity generation by deducting downtimes due to maintenance intervals and taking into consideration line losses as well as internal and external wake losses within the wind farm.
1 The long version of this study includes the individual results of the cost development of all named cost components of the
sites in the scenarios. Due to its limited volume, for this short version, we have selected examples to illustrate specific results.
Phase 2: Verification by industry and stakeholders
Result validation by an expert panel (survey and financing workshop)Analysis of verified results
Phase 1: Model setup and cost base
Determination of cost base for all sites and yearsModel setup for Levelised Cost of Energy (LCOE)Evaluation of preliminary results
Phase 3: Optimisation approach-es and recommendations
Development of optimisation approachesDerivation of recommendations for politics, industry and other stakeholders
Project related supervision by representatives of the principals
10
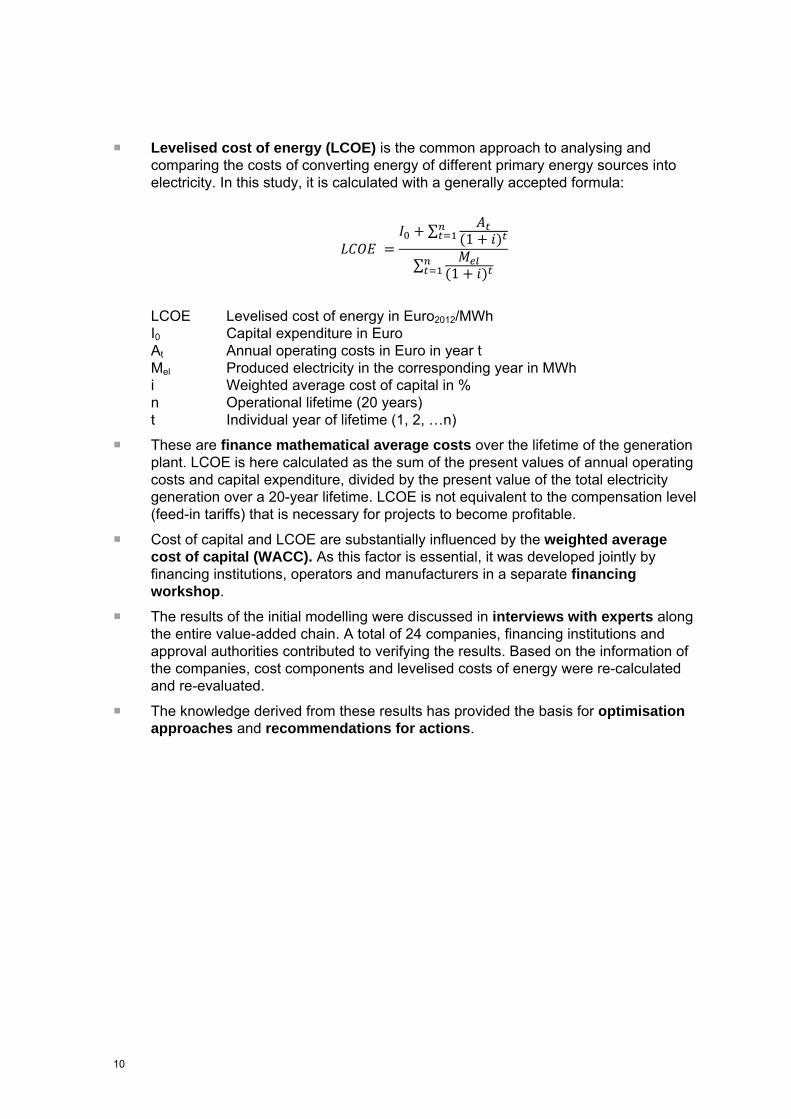
Levelised cost of energy (LCOE) is the common approach to analysing and comparing the costs of converting energy of different primary energy sources into electricity. In this study, it is calculated with a generally accepted formula:
∑ 1
∑ 1
LCOE Levelised cost of energy in Euro2012/MWh I0 Capital expenditure in Euro At Annual operating costs in Euro in year t Mel Produced electricity in the corresponding year in MWh i Weighted average cost of capital in % n Operational lifetime (20 years) t Individual year of lifetime (1, 2, …n)
These are finance mathematical average costs over the lifetime of the generation plant. LCOE is here calculated as the sum of the present values of annual operating costs and capital expenditure, divided by the present value of the total electricity generation over a 20-year lifetime. LCOE is not equivalent to the compensation level (feed-in tariffs) that is necessary for projects to become profitable.
Cost of capital and LCOE are substantially influenced by the weighted average cost of capital (WACC). As this factor is essential, it was developed jointly by financing institutions, operators and manufacturers in a separate financing workshop.
The results of the initial modelling were discussed in interviews with experts along the entire value-added chain. A total of 24 companies, financing institutions and approval authorities contributed to verifying the results. Based on the information of the companies, cost components and levelised costs of energy were re-calculated and re-evaluated.
The knowledge derived from these results has provided the basis for optimisation approaches and recommendations for actions.

11
3 Defining Scenarios and Distinguishing Cases
The results refer to two scenarios and three sites with three different types of plants. Defining the scenarios
Source: [Prognos / Fichtner]; * expected installed capacity by the end of 2013
The study uses two development scenarios and three sites to analyse the cost reduction potentials of offshore wind power in Germany until 2023.
Scenario 1 describes a moderate development path with at least 9 GW of accumulated installed capacity in Germany, and with a total of over 20 GW in Europe by the year 2023. It is characterised by a long-term stable market environment.
Scenario 2 calculates with at least 14 GW of installed capacity in Germany, and with a total of over 40 GW in the whole of Europe by the year 2023. This corresponds to the current political goals set for Germany and the EU. This ambitious development path assumes that all technical cost reduction potentials have been realized and an optimum regulatory and competitive market environment has been created. This includes an extended European common market that allows for a faster development of new and larger turbines and foundation structures.
For the two scenarios, we have analysed three sites in the North Sea that are typical for German projects, with four different dates of them becoming operational. The sites are different regarding average water depth, distance to port and average wind speed.
The site characteristics of close-to-shore wind farm A coincide with about 70 percent of today’s approved projects. Between 2017 and 2020, the development will be dominated by the construction of further-from-shore wind farms at site B. From 2020 onwards, there will materialise an increasing number of projects at far-from-
GER: ≥ 9 GWEU: > 20 GW
GER: ≥ 14 GWEU: > 40 GW
Site BWater depth 40 mDistance to port 80 kmWind speed 10 m/s
2013 2017 2020 2023
Germany: 0,6 GW*Europe: 6 GW
Germany: 0,6 GW*Europe: 6 GW
Site AWater depth 30 mDistance to port 40 kmWind speed 9,9 m/s
B
C
A B
C
A B
C
A
BC
AB
C
A
B
C
A
B
C
A
Site CWater depth 50 mDistance to port 120 kmWind speed 10,1 m/s
Installedcapacity
Scen. 1
Scen. 2
Initial operation:
Scenario 2
Scenario 1
Scenario definitionGER: 3,2 GWEU: 13 GW
GER: 5-6 GWEU: 25 GW
GER: 6 GWEU: 20 GW
GER: 10 GWEU: 40 GW

12
shore deep-sea sites C. This means that for interpreting the results, the short-term focus must be on site A, medium-term on site B and long-term on site C. Due to its large importance over the considered period, site B will be used - unless otherwise stated - as the exemplary site for the following presentation of the results.
The different market developments in the two scenarios result in a different pace regarding the technological development and the configuration of the wind farms. The used plants vary in turbine capacity, rotor diameter, hub height, substructure, support structure as well as operating and maintenance concept.
Plant and wind farm configuration in the two scenarios
Source: [Prognos / Fichtner]; WTG = Wind Turbine Generator
The different turbine capacities of today’s and future commercial offshore wind turbine generators constitute a challenge when modelling the costs of offshore wind farms. Different manufactures currently produce turbines with a capacity of between 2.3 MW and 6 MW. In the future, there will be commercial turbines with a capacity of up to 10 MW. In order to be able to provide a representative picture of the offshore market, this study calculates with average turbine capacities of 4 MW, 6 MW and 8 MW.
It is not possible to exactly estimate the time of market introduction of new turbine generations. For the different times of market introduction, we have therefore used different assumptions regarding average turbine capacity, rotor diameter, and hub heights in order to calculate the two development scenarios.
Starting with an installed total capacity per wind farm of 320 MW (80 turbines with a capacity of 4 MW each), for both scenarios the capacity of wind farms put into operation from 2017 onwards increases to 450 MW and then remains at this level until 2023. The turbine size of 4 MW is assumed to be the average value of currently installed plants. Today the maximum number of plants approved per wind farm is 80. The assumption of a future wind farm size of 450 MW includes - in addition to an increased turbine capacity of 6 MW (scenario 1) or 8 MW (scenario 2), accordingly - the 900 MW of planned HVDC2 platform capacity for transmitting the electricity to shore. Two wind farms with a capacity of 450 MW each can be connected to one HVDC platform. Each wind farm comprises 75 (scenario 1) or 56 (scenario 2) plants, respectively.
2 HVDC = high-voltage, direct current
Initial operationNumber
WTGCapacity
WTG
Size wind farm
Hub height
Rotor diameter
Number WTG
Capacity WTG
Size wind farm Hub height
Rotor diameter
2013 80 4 MW 320 MW 90 m 120 m 80 4 MW 320 MW 90 m 120 m2017 75 6 MW 450 MW 100 m 145 m 75 6 MW 450 MW 100 m 145 m2020 75 6 MW 450 MW 100 m 154 m 56 8 MW 450 MW 110 m 164 m2023 75 6 MW 450 MW 105 m 164 m 56 8 MW 450 MW 115 m 178 m
Scenario 1 Scenario 2

13
4 Investment Costs
Over the next ten years, increasing turbine capacity and improved logistics concepts can substantially decrease specific investment costs. Development of specific investment costs for the example of wind farm B
Source: [Prognos / Fichtner]
In scenario 1, specific investment costs at site B3 decrease by about 17 % over the next ten years. Due to more competition and an increased plant capacity of 8 MW, possible savings might even go up to about 27 % in scenario 2.
With 29 % (2013), the specific investment costs of the turbine constitute the major cost item. Due to substantially increasing requirements on technology and performance, in the long run they only offer a limited saving potential. The main factor for the increase in scenario 1 is an average increase of the rotor diameter from 120 m to 164 m in 2023. This results in a higher electricity yield of the plant. For the development pace in scenario 1, however, development and material costs for rotor blades of this size prevent a palpable cost degression. The situation is different for the faster development in scenario 2: In spite of that the rotor diameter increases from 120 m to 178 m and that the capacity is doubled from 4 MW to 8 MW the specific turbine costs decrease. New players enter the market and the larger demand will result in a steeper learning curve and larger cost reductions. The
3 All results for wind farm sites A and C are presented in the long version of the study. The results of site B are used here
as an example to illustrate the correlations and interdependences.
1,201 1,337 1,251 1,093
1,028 851 713 678
90 79 69 69
235 165155 141
684 545479 417
387397
345307
544506
452352
4,1693,880
3,4643,057
20134 MW
20176 MW
20208 MW
20238 MW
Turbine Support structure Cabel Transformer station Installation Certification/Approval Contingency
Entwicklung der spez. Investitionskosten am Standort B - Szenario 2 in Tsd. Euro2012/MW
-27%-17%-7%
1,201 1,350 1,300 1,260
1,028 871 787 764
90 79 75 73235 165 160 155
684 548 533 513
387 397 372 362
544 512 420 313
4,169 3,922 3,647 3,440
20134 MW
20176 MW
20206 MW
20236 MW
Entwicklung der spez. Investitionskosten am Standort B - Szenario 1 in Tsd. Euro2012/MW
-17%-13%-6%
Specific investment costs at site B - Scenario 1 given in thousends of Euro2012/MW
Specific investment costs at site B - Scenario 2 given in thousends of Euro2012/MW

14
development of new turbines is also driven by the goal to reduce costs of transportation, installation, operation and maintenance. This way, in spite of its own limited cost reduction potential, the turbine affects to a large degree the cost reduction in other areas of the value-added chain.
In addition, the specific costs of all other named plant components are usually substantially reduced by the turbine’s capacity increase. This is mainly due to the fact that in the calculations the specific costs always relate to the turbine capacity (MW). Doubling average turbine capacity from 4 MW to 8 MW often results in increased absolute costs for other components, but not in doubled costs. When moving towards larger turbines, this effect brings about lower specific costs for other cost items along the entire value-added chain.
Continuous production and optimised manufacturing processes regarding the support structures reduce downtimes at the manufacturers’ and thus decreases costs, especially for the foundations. This trend is further enhanced by increasing turbine capacity from 4 MW to up to 8 MW.
The decrease of the specific investment costs for the internal wind farm transformer stations is mainly due to increasing wind farm size from 320 MW to 450 MW. The introduction of general standards for the platform design as well as regarding electro-technical issues results for scenario 2 in a larger cost reduction for the period 2020 to 2023 in comparison to scenario 1.
In the future, the specific installation costs for turbine, support structure, internal wind farm transformer station as well as cable laying will decrease, mainly due to improved logistics concepts, increased competition from new market entrants and larger turbine capacity. Faster ships with larger transport capacity will reduce the required time as well as the number of transports.
Regarding certification and approval, the steady development of offshore wind power results in learning curve effects. The introduction of uniform standards reduces certification costs and improves the corresponding processes.
Contingency provisions are made to cover risks during project realisation (installation and weather risks, delivery delays and delayed grid connection). They are correlated to the total sum of the investment costs. On the one hand, these costs decrease due to the general reduction of specific investment costs (absolute provisions). On the other hand, due to the learning curve effects resulting from a steady development of offshore wind power until the year 2023, investors can assume lower risks regarding the construction of wind farms (relative provisions).

15
5 Operating Costs
Inter-operator maintenance and logistics concepts offer substantial cost-saving potentials. Development of specific annual operating costs for the example of wind farm B
Source: [Prognos / Fichtner]
In scenario 1, the specific annual operating costs for site B decrease by about one fifth over the next ten years. In scenario 2 with inter-operator maintenance concepts being applied to a larger extent and turbine capacity increasing to 8 MW, specific operating costs even go down by one third.
Specific operating and maintenance costs (O&M) mainly depend on the wind farm’s distance to port. For wind farms that are 50 km or more off the port, sea-based maintenance concepts become more efficient than land-based maintenance.
The introduction of joint, inter-operator maintenance and logistics concepts is essential for the large decrease of the annual operating costs. Using joint fleet and logistics infrastructure (landing and fuelling facilities for helicopters, ships, material storage, joint rescue and safety concepts) can substantially reduce absolute annual operating costs.
Additionally in 2017, when moving from 4 MW to 6 MW turbines the effect of the increased capacity substantially decreases specific investment costs as described above. In scenario 2, this effect is repeated when in 2020 turbine capacity increases from 6 MW to 8 MW.
Based on the interview results, from 2017 onwards insurance premia are assumed to be constant in real terms.
116 90 88 86
1822 22 22
134112 110 108
20134 MW
20176 MW
20206 MW
20236 MW
Versicherung O&M
Entwicklung der jährlichen spez. Betriebskosten am Standort B - Szenario 1 in Tsd. Euro2012/MW-19%-18%-16%
116 88 75 68
1822 22 22
134110 97 90
20134 MW
20176 MW
20208 MW
20238 MW
Versicherung O&M
Entwicklung der jährlichen spez. Betriebskosten am Standort B - Szenario 2 in Tsd. Euro2012/MW
-33%-28%-18%
Specific O&M costs at site B - Scenario 1 given in thousends of Euro2012/MW
Specific O&M costs at site B - Scenario 2 given in thousends of Euro2012/MW
Insurance
Insurance

16
6 Cost of Capital
Increasing project experience reduces risk premia and, in the long run, results in lower cost of capital for offshore wind power. Key assumptions regarding cost of capital
Source: [Prognos / Fichtner]; assumption of average inflation rate: 2 %
Particularly for capital-intensive technologies such as offshore wind power, the cost of capital strongly affects the levelised cost of energy. The cost of capital over project duration is calculated taking into account the relative weight of return on equity (RoE) and cost of debt (CoD) with different risk profiles.
share*CoDreturn RoEshare*RoEreturn
During a financing workshop with operators, investors and the finance industry, we jointly arrived at the weighted average cost of capital (WACC) that is used for the calculations of offshore projects. As a result, the following developments are assumed:
Over the time period considered in this study, the cost of capital will decrease by more than 2 percentage points for plants becoming operational in 2023.
The reduction of risk profiles is a key driver for a reduced cost of capital and compensates for the increasing interest rate levels due to the recovery of the capital market following the European debt crisis.
Firstly, the share of equity that debt suppliers demand decreases from 35 % to 25 %. Simultaneously, this will increase the share of debt from 65 % to 75 % and result in the leverage effect. As debt usually carries lower return requirements than equity, a lower equity share results in a reduced weighted average cost of capital. However, debt providers are only willing to accept a lower equity share if project risks decrease.
Secondly, market margins for debt financing substantially decrease due to the more favourable risk evaluation of offshore projects.
Thirdly, lower project-specific risks result in reduced risk premia regarding equity financing.
We will not distinguish between the cost of capital for the different scenarios. For scenario 2, we assume – in spite of higher capital demand due to a faster market growth - that a flourishing market results in a competition of debt providers that bring down bank margins and thus keeps the cost of debt constant. Regarding equity, no cash flow bottlenecks are assumed. Consequently, the cost of capital for both scenarios remains at the same level.
Initial operation 2013 2017 2020 2023WACC, nominal (Pre-tax) 9,85% 9,19% 8,67% 7,68%WACC, real (Pre-tax) 7,85% 7,19% 6,67% 5,68%Debt (share) 65% 65% 70% 75%Equity (share) 35% 35% 30% 25%
17
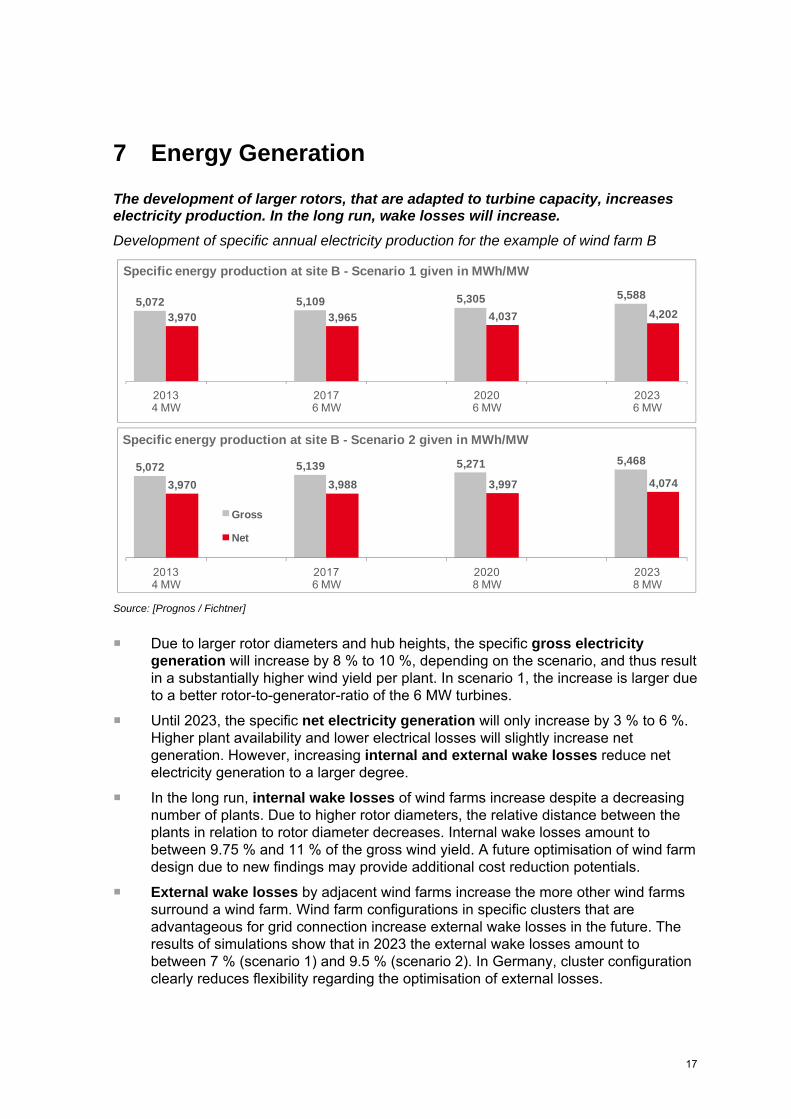
7 Energy Generation
The development of larger rotors, that are adapted to turbine capacity, increases electricity production. In the long run, wake losses will increase. Development of specific annual electricity production for the example of wind farm B
Source: [Prognos / Fichtner]
Due to larger rotor diameters and hub heights, the specific gross electricity generation will increase by 8 % to 10 %, depending on the scenario, and thus result in a substantially higher wind yield per plant. In scenario 1, the increase is larger due to a better rotor-to-generator-ratio of the 6 MW turbines.
Until 2023, the specific net electricity generation will only increase by 3 % to 6 %. Higher plant availability and lower electrical losses will slightly increase net generation. However, increasing internal and external wake losses reduce net electricity generation to a larger degree.
In the long run, internal wake losses of wind farms increase despite a decreasing number of plants. Due to higher rotor diameters, the relative distance between the plants in relation to rotor diameter decreases. Internal wake losses amount to between 9.75 % and 11 % of the gross wind yield. A future optimisation of wind farm design due to new findings may provide additional cost reduction potentials.
External wake losses by adjacent wind farms increase the more other wind farms surround a wind farm. Wind farm configurations in specific clusters that are advantageous for grid connection increase external wake losses in the future. The results of simulations show that in 2023 the external wake losses amount to between 7 % (scenario 1) and 9.5 % (scenario 2). In Germany, cluster configuration clearly reduces flexibility regarding the optimisation of external losses.
5,072 5,109 5,305 5,588
3,970 3,965 4,037 4,202
20134 MW
20176 MW
20206 MW
20236 MW
Entwicklung der spezifischen Stromproduktion am Standort B - Szenario 1 in MWh/MW
5,072 5,139 5,271 5,468
3,970 3,988 3,997 4,074
20134 MW
20176 MW
20208 MW
20238 MW
Brutto
Netto
Entwicklung der spezifischen Stromproduktion am Standort B - Szenario 2 in MWh/MW
Specific energy production at site B - Scenario 1 given in MWh/MW
Specific energy production at site B - Scenario 2 given in MWh/MW
Gross
Net

18
8 Development and Structure of the Levelised Cost of Energy
By 2023, levelised costs of energy of offshore wind farms can be reduced to below 10 Cent/kWh. Comparison of the scenario results
Quelle: [Prognos / Fichtner]; WD= Water depth; DtP = Distance to port
For the reference year, the costs of offshore wind power at site A are 12.8 Cent2012/kWh. Due to deeper waters and larger distances to port at the other sites, costs amount to 14 Cent2012/kWh. For the year 2013, levelised costs of energy at sites B and C are rather theoretical as there are no wind farms with these parameters that will become operational by the end of 2013.
In scenario 1, the cost of offshore wind power decreases on average by about 30 % at all sites by 2023. Short-term, this cost reduction is caused by savings in the areas of logistics, installation as well as maintenance and operations. Medium-term, the optimisation of existing plant types will largely contribute to cost degression. Long-term, new technologies resulting in larger turbines will dominate the cost development.
In scenario 2 assuming optimum conditions, cost reductions of 39 % are achieved. In addition to a faster technological development, increased competition due the sustainable market entrance of a large number of companies is the main driver for the additional cost reduction. The differentiation of the scenarios becomes significant only after 2017.
2013 2017 2020 2023 2013 2017 2020 2023 2013 2017 2020 2023
Windpark A Windpark B Windpark C
Szenario 1 Szenario 2 4 MW - Baseline
Übersicht der Stromgestehungskosten in Szenario 1 und 2, in Cent2012/kWh
Site A (30 m WD; 40 km DtP) Site C (50 m WT; 120 km DtP)Site B (40 m WT; 80 km DtP)
Levelised cost of energy - Scenario 1 and 2, given in Cent2012/MW
Scenario 1 Scenario 2
11.7
10.2
9.1
12.5
10.9
9.7
12.811.2
10.011.512.3 12.6
9.7
8.2
10.2
8.7
10.5
9.0
12.8
14.214.8
19
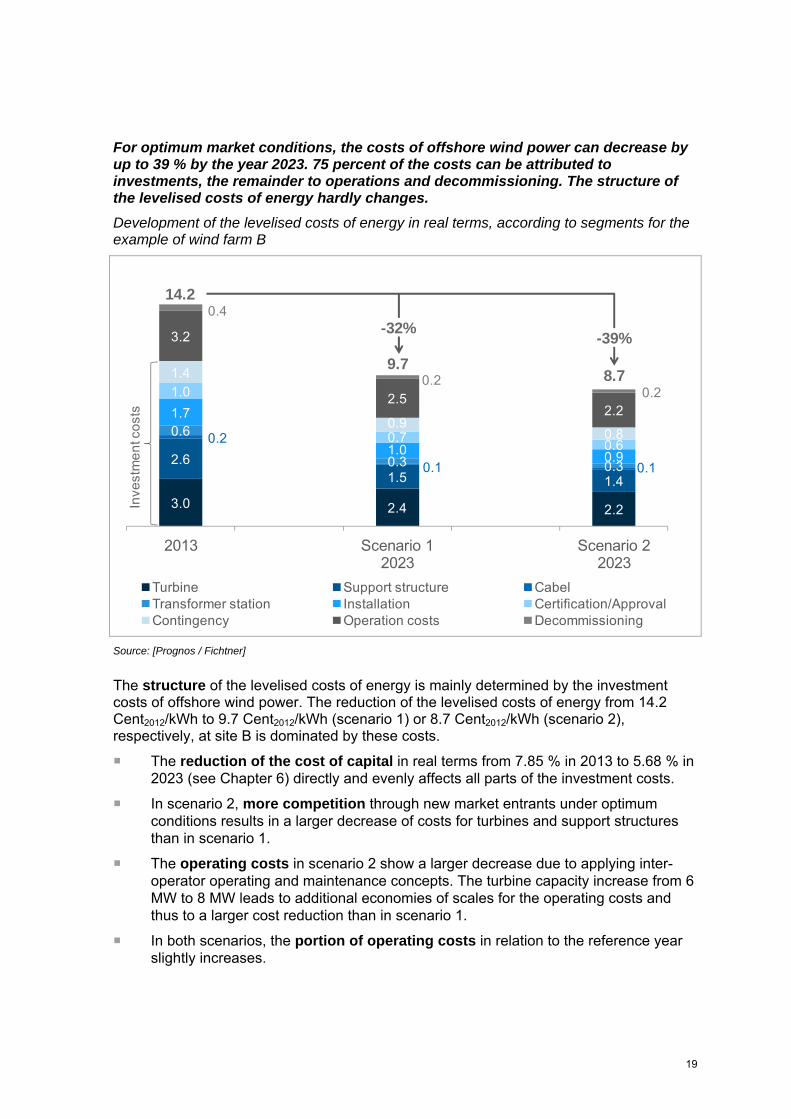
For optimum market conditions, the costs of offshore wind power can decrease by up to 39 % by the year 2023. 75 percent of the costs can be attributed to investments, the remainder to operations and decommissioning. The structure of the levelised costs of energy hardly changes. Development of the levelised costs of energy in real terms, according to segments for the example of wind farm B
Source: [Prognos / Fichtner]
The structure of the levelised costs of energy is mainly determined by the investment costs of offshore wind power. The reduction of the levelised costs of energy from 14.2 Cent2012/kWh to 9.7 Cent2012/kWh (scenario 1) or 8.7 Cent2012/kWh (scenario 2), respectively, at site B is dominated by these costs.
The reduction of the cost of capital in real terms from 7.85 % in 2013 to 5.68 % in 2023 (see Chapter 6) directly and evenly affects all parts of the investment costs.
In scenario 2, more competition through new market entrants under optimum conditions results in a larger decrease of costs for turbines and support structures than in scenario 1.
The operating costs in scenario 2 show a larger decrease due to applying inter-operator operating and maintenance concepts. The turbine capacity increase from 6 MW to 8 MW leads to additional economies of scales for the operating costs and thus to a larger cost reduction than in scenario 1.
In both scenarios, the portion of operating costs in relation to the reference year slightly increases.
3.0 2.4 2.2
2.61.5 1.4
0.2
0.1 0.1
0.6
0.3 0.3
1.7
1.0 0.9
1.0
0.7 0.6
1.4
0.90.8
3.2
2.52.2
0.4
0.20.2
2013 Scenario 12023
Scenario 22023
Turbine Support structure CabelTransformer station Installation Certification/ApprovalContingency Operation costs Decommissioning
14.2
8.7
-39%9.7
-32%
Inve
stm
ent c
osts
20
9 Cost Reduction Potentials
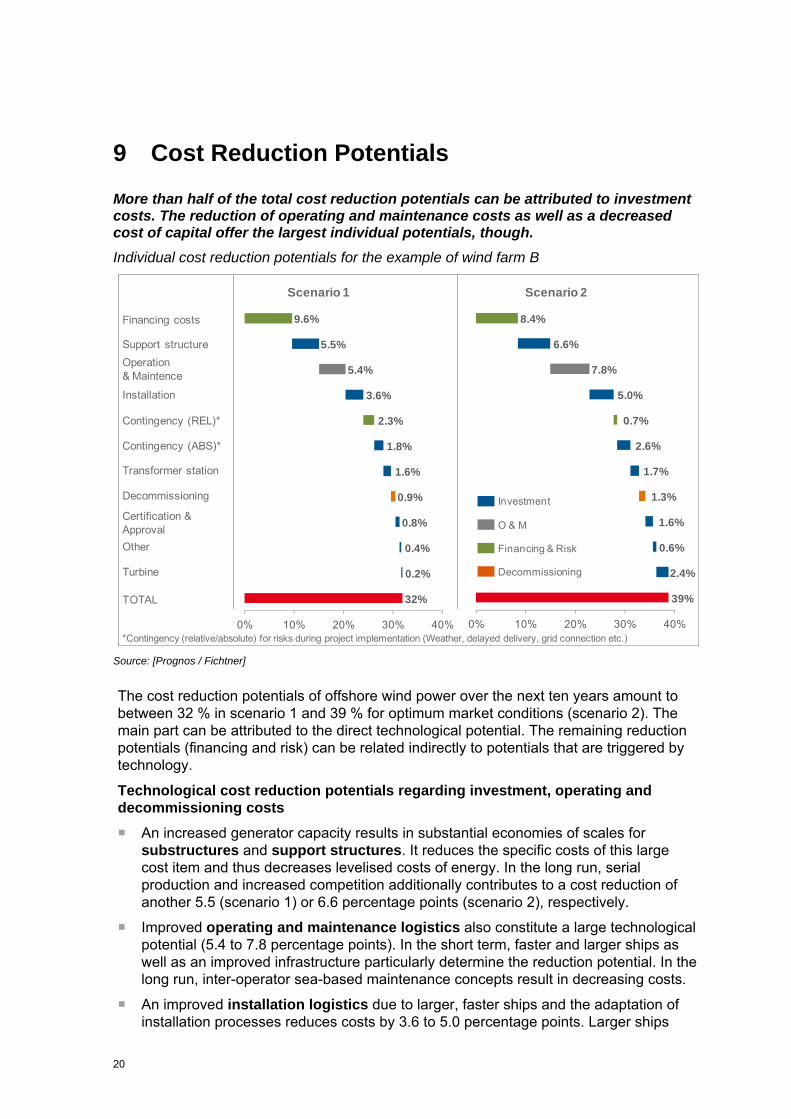
More than half of the total cost reduction potentials can be attributed to investment costs. The reduction of operating and maintenance costs as well as a decreased cost of capital offer the largest individual potentials, though. Individual cost reduction potentials for the example of wind farm B
Source: [Prognos / Fichtner]
The cost reduction potentials of offshore wind power over the next ten years amount to between 32 % in scenario 1 and 39 % for optimum market conditions (scenario 2). The main part can be attributed to the direct technological potential. The remaining reduction potentials (financing and risk) can be related indirectly to potentials that are triggered by technology.
Technological cost reduction potentials regarding investment, operating and decommissioning costs
An increased generator capacity results in substantial economies of scales for substructures and support structures. It reduces the specific costs of this large cost item and thus decreases levelised costs of energy. In the long run, serial production and increased competition additionally contributes to a cost reduction of another 5.5 (scenario 1) or 6.6 percentage points (scenario 2), respectively.
Improved operating and maintenance logistics also constitute a large technological potential (5.4 to 7.8 percentage points). In the short term, faster and larger ships as well as an improved infrastructure particularly determine the reduction potential. In the long run, inter-operator sea-based maintenance concepts result in decreasing costs.
An improved installation logistics due to larger, faster ships and the adaptation of installation processes reduces costs by 3.6 to 5.0 percentage points. Larger ships
Financing costs
Support structureOperation & Maintence
Installation
Contingency (REL)*
Contingency (ABS)*
Transformer station
Scenario 1 Scenario 2
Decommissioning
Certification & ApprovalOther
Turbine
TOTAL
*Contingency (relative/absolute) for risks during project implementation (Weather, delayed delivery, grid connection etc.)
Investment
O & M
Financing & Risk
Decommissioning
32%
0.2%
0.4%
0.8%
0.9%
1.6%
1.8%
2.3%
3.6%
5.4%
5.5%
9.6%
0% 10% 20% 30% 40%
39%
2.4%
0.6%
1.6%
1.3%
1.7%
2.6%
0.7%
5.0%
7.8%
6.6%
8.4%
0% 10% 20% 30% 40%
21
increase transport capacities and allow for utilizing favourable weather slots. In addition, larger and more powerful installation ships are required in order to be able to utilize the economies of scales of larger turbines.
The reduction of the absolute contingency provisions for installation risks decreases total investment costs and thus levelised costs of energy by 1.8 to 2.6 percentage points and is directly triggered by the technological development.
The standardisation of technical dimensions and an intensified competition regarding wind farm transformer stations account for a cost reduction potential of 1.6 to 1.7 percentage points.
As specialisation regarding the dismantling of offshore wind farms (decommissioning) increases over time, the energy generation costs can be reduced by 0.9 to 1.3 percentage points.
Uniform approval and certification standards as well as a growing experience regarding project planning contribute a cost reduction potential of 0.8 to 1.6 percentage points.
Due to increasing technical requirements for larger generators and rotor diameters, in scenario 1 the turbine provides with 0.2 percentage points only a small contribution to cost reduction, whereas in scenario 2 the contribution of 2.4 percentage points is significant. Gross electricity yields per plant and MW increase by up to 8 %. The increasing gross yield is, however, partially compensated by larger wake losses. In the long run, new market players enter the market and the increased competition contributes to cost reduction.
A more efficient cable production as well as an increased availability due to more competition result in a cost reduction of 0.4 to 0.6 percentage points.
Indirect technological cost reduction potentials regarding financing costs and contingency provisions for installation risks
In scenario 1, the substantial decrease of risk premia for financing due to increased planning, construction and operation experience and the higher reliability of the plants contributes 9.6 percentage points to cost reduction; and thus reduces costs to a larger extent than in scenario 2 (8.4). In addition, the equity share required by banks is lower. As debt usually requires less return than equity, financing costs further decrease. In total, the reduction of the cost of capital due to a changed risk profile of the technology together with more experience is one of the main drivers of cost reduction.
In addition, the relative contingency provisions made by investors in order to cover risks during project realisation decrease. The growing installation experience and the further development of installation technology will reduce both downtimes and technical risks. Altogether this contributes another 2.3 (scenario 1) or 0.7 percentage points (scenario 2), respectively, to cost reduction.

22
10 How to Exploit the Potentials
Industry, politics and administration only jointly can exploit these potentials.
Source: [Prognos / Fichtner]
It is essential that all affected parties in industry, politics and administration are actively involved in order to be able to exploit the presented cost reduction potentials of offshore wind power over the next ten years. Not only the technical areas such as investment, operating and decommissioning costs, but also the minimisation of risk premia provide significant reduction potentials. A stable regulatory framework provided by the political environment is a prerequisite for this. For the offshore industry itself, technological innovations and a more efficient use of technology are key variables.
All fields of action presented in the following affect project risks. For offshore wind power projects, the active risk management is an important part of cost reduction. An improved management of the interface between wind farm operators, manufacturers, installation companies, grid operators and authorities can further reduce the risks.
Recommendations regarding the political and regulatory environment Creating stable legal and political framework conditions
Stable framework conditions constitute the basis for a reliable investment climate. In addition to stable refinancing options stated in the EEG (Renewable Energy Act), this also refers to the exemption of already carried-out investments and investment decisions (“Bestandsschutz”). It is of particular importance to keep up the development even after the first development phase runs out in 2017. A long-term perspective regarding the regulatory environment helps the offshore industry with its long planning horizons to adapt to it.
Defining technical standards for plant components and grid connections The introduction of technology standards for components and grid connections can substantially decrease the costs for installation and maintenance. It would be useful to develop these standards in close cooperation with the industry and throughout Europe in order to further minimise the costs of offshore wind power in all Europe.
Simplifying certification and approval criteria The joint review of certification and approval standards by the industry, operators, certifying entities and the Federal Maritime and Hydrographic Agency can optimise processes and standards. Uniform certification standards simplify the complex
Politics & Administration
Industry
Cost reduction potential
Creating stable
framework conditions
Technological innovation
Increased efficiency

23
situation and reduce the current cost levels. It is recommended to use the experience gained from certification processes in the power station and plant construction industry as well as other industries outside the classical offshore segment.
Recommendations to the industry regarding technological innovation
Optimising plant technology in order to maximise utilisation and wind yield Depending on the site, both optimising plant technology in order to reach a high utilisation and maximising the wind yield offer potentials for decreasing levelised costs of energy. For close-to-shore sites, a higher plant utilisation through larger rotors will be advantageous. The higher the installation and maintenance costs due to larger distances to port, the more reasonable it becomes to maximise wind yield by economies of scales that larger turbine capacities contribute.
Optimising existing support structures and developing new ones Optimising the foundation design provides an opportunity for standardisation. Particularly jacket fabrication can become more efficient with higher volumes. In the short to medium term, processes for installing support structures can be optimised by drilling or vibration, for instance. In the long run, new substructure concepts such as gravity or floating substructures can lead to further improvements.
Improving installation logistics Installation logistics should be improved by more powerful ships and ports as well as the adjustment of processes. The larger transport capacities that are achieved this way allow for a better utilization of favourable weather slots. This is a prerequisite for utilising the economies of scales of larger turbines.
Intensifying research and development Development, testing and market introduction of innovative plant concepts and support structures should be intensified. Supported by the political environment, the creation of test fields and use of demonstration facilities could be useful in this context.
Recommendations to the industry regarding an increased efficiency
Developing inter-operator maintenance and installation concepts In the medium term, substantial cost benefits could be achieved by joint concepts for the operation and maintenance of wind farms. The goal should be to jointly use fleet and logistics infrastructures (landing and fuelling facilities for helicopters, ships, material storage, joint rescue and safety concepts). Offshore logistics centre where replacement components of various manufacturers are stored would reduce downtimes of wind farms. In the long run, operators of adjacent wind farms using the same type of plant could develop joint concepts and thus achieve cost benefits also during the installation phase.
Accelerating serial production Regarding turbine and support structure technology as well as grid-connection components, serial production offers substantial cost reduction potentials. The further development of serial production will, however, only be successful if there is a dynamic market development and a far-reaching implementation of technology standards.
24
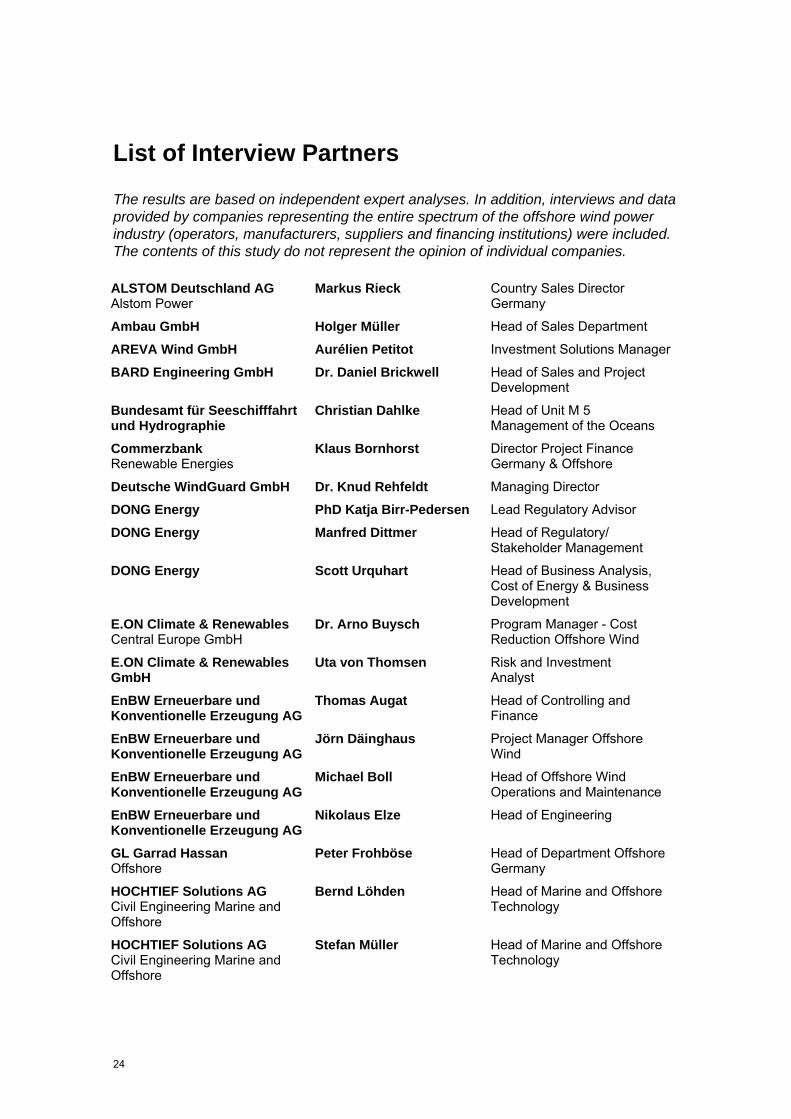
List of Interview Partners
The results are based on independent expert analyses. In addition, interviews and data provided by companies representing the entire spectrum of the offshore wind power industry (operators, manufacturers, suppliers and financing institutions) were included. The contents of this study do not represent the opinion of individual companies.
ALSTOM Deutschland AG Alstom Power
Markus Rieck Country Sales Director Germany
Ambau GmbH Holger Müller Head of Sales Department
AREVA Wind GmbH Aurélien Petitot Investment Solutions Manager
BARD Engineering GmbH Dr. Daniel Brickwell Head of Sales and Project Development
Bundesamt für Seeschifffahrt und Hydrographie
Christian Dahlke Head of Unit M 5 Management of the Oceans
Commerzbank Renewable Energies
Klaus Bornhorst Director Project Finance Germany & Offshore
Deutsche WindGuard GmbH Dr. Knud Rehfeldt Managing Director
DONG Energy PhD Katja Birr-Pedersen Lead Regulatory Advisor
DONG Energy Manfred Dittmer Head of Regulatory/ Stakeholder Management
DONG Energy Scott Urquhart Head of Business Analysis, Cost of Energy & Business Development
E.ON Climate & Renewables Central Europe GmbH
Dr. Arno Buysch Program Manager - Cost Reduction Offshore Wind
E.ON Climate & Renewables GmbH
Uta von Thomsen Risk and Investment Analyst
EnBW Erneuerbare und Konventionelle Erzeugung AG
Thomas Augat Head of Controlling and Finance
EnBW Erneuerbare und Konventionelle Erzeugung AG
Jörn Däinghaus Project Manager Offshore Wind
EnBW Erneuerbare und Konventionelle Erzeugung AG
Michael Boll Head of Offshore Wind Operations and Maintenance
EnBW Erneuerbare und Konventionelle Erzeugung AG
Nikolaus Elze Head of Engineering
GL Garrad Hassan Offshore
Peter Frohböse Head of Department Offshore Germany
HOCHTIEF Solutions AG Civil Engineering Marine and Offshore
Bernd Löhden Head of Marine and Offshore Technology
HOCHTIEF Solutions AG Civil Engineering Marine and Offshore
Stefan Müller Head of Marine and Offshore Technology

25
KfW Carlos Christian Sobotta Department Director KfW Program Offshore Wind energy
Marguerite Adviser S.A. Bruno Erbel Vice President
MEAG MUNICH ERGO AssetManagement GmbH
Stefan Schweikart Investment Manager Renewable Energy and New Technologies
Mitsubishi Power Systems Europe, Ltd.
Jörg Kubitza Business Development Director
NORD/LB Norddeutsche Landesbank Girozentrale
Ulrich Winkelmann Director
Nordwest Assekuranzmakler GmbH & Co. KG
Thomas Haukje Managing Director
REpower Systems SE Norbert Giese Vice President Offshore Development
RWE Innogy GmbH Holger Gassner Head of Markets and Political Affairs
RWE Innogy GmbH Udo Reher Head of Procurement
RWE Innogy GmbH Tobias Schneider Valuation / Risk Controlling
Siemens AG Energy, Wind Division
Matthias Bausenwein Head of Business Development, Offshore Germany
Siemens AG Energy, Wind Division
Peter Gregersen Head of Sales Offshore
Siemens AG Energy, Wind Division
Horst Hakelberg Head of Sales Service Off-shore Germany
Siemens AG Energy, Service Division
Christian Leffringhausen Service Proposal Manager Offshore
Siemens Financial Services GmbH
Christian Grenz Senior Advisor, Financial Advisory & Structuring, Energy Finance EMEA
Siemens Financial Services GmbH
Marcus Turnwald Senior Advisor, Financial Advisory & Structuring, Energy Finance EMEA
Siemens Wind Power A/S Morton Vindbjerg Head of Operational Marketing
UniCredit Bank AG Brad McAboy Director
Vattenfall Europe Windkraft GmbH
Dr. Johannes Kammer Program Manager LEC Reduction
Vattenfall Europe Windkraft GmbH
Bastian Scheele Risk Manager
WeserWind GmbH Offshore Construction Georgsmarienhütte
Dirk Kassen Managing Director
Windkraftwerk Borkum GmbH & Co. KG
Linda Wehle Manager Project Finance
WindMW GmbH Sebastian Schmidt Chief Financial Officer

26
Appendix
Configuration of the wind farms analysed in scenario 1 and 2
Source: [Prognos / Fichtner]
Configuration of the wind farms analysed at sites A, B and C
Source: [Prognos / Fichtner]; * average wind speed at 100 m hub height
JK = Jacket MP = Monopile SB = Sea-based (accommodation vessel or platform) Land = Land-based O&M O&M = Operation & Maintenance
Initial operationNumber
WTGCapacity
WTGSize
wind farmHub
heightRotor
diameter
TOTAL Internal External Surrounded area
2013 80 4 MW 320 MW 90 m 120 m 13.50% 9.75% 3.75% 1.252017 75 6 MW 450 MW 100 m 145 m 14.50% 9.75% 4.75% 1.502020 75 6 MW 450 MW 100 m 154 m 16.50% 10.25% 6.25% 2.002023 75 6 MW 450 MW 105 m 164 m 17.75% 10.75% 7.00% 2.25
Initial operation Number WTG
Capacity WTG
Size wind farm
Hub height
Rotor diameter
TOTAL Internal External Surrounded area
2013 80 4 MW 320 MW 90 m 120 m 13.50% 9.75% 3.75% 1.252017 75 6 MW 450 MW 100 m 145 m 14.50% 9.75% 4.75% 1.502020 56 8 MW 450 MW 110 m 164 m 17.25% 9.25% 8.00% 2.502023 56 8 MW 450 MW 115 m 178 m 19.50% 10.00% 9.50% 3.00
Scenario 1
WAKE-Losses
Scenario 2
WAKE-Losses
Site A
Initial operation Water depth
Port ø Wind speed*
Capacity WTG
Foundation O&Mconcept
Water depth
Port ø Wind speed*
Capacity WTG
Foundation O&Mconcept
2013 4 MW MP Land 4 MW MP Land2017 6 MW MP Land 6 MW MP Land2020 6 MW MP Land 8 MW JK Land2023 6 MW MP Land 8 MW JK Land
Site B
Initial operation Water depth
Port ø Wind speed*
Capacity WTG
Foundation O&Mconcept
Water depth
Port ø Wind speed*
Capacity WTG
Foundation O&Mconcept
2013 4 MW JK SB 4 MW JK SB2017 6 MW JK SB 6 MW JK SB2020 6 MW MP SB 8 MW JK SB2023 6 MW MP SB 8 MW JK SB
Site C
Initial operation Water depth Port ø Wind
speed*Capacity
WTG Foundation O&Mconcept
Water depth Port ø Wind
speed*Capacity
WTG Foundation O&Mconcept
2013 4 MW JK SB 4 MW JK SB2017 6 MW JK SB 6 MW JK SB2020 6 MW JK SB 8 MW JK SB2023 6 MW JK SB 8 MW JK SB
50 m 120 km 10.1 m/s 50 m 120 km 10.1 m/s
Scenario 1 Scenario 2
40 m 80 km 10 m/s 40 m 80 km 10 m/s
Scenario 1 Scenario 2
Scenario 1 Scenario 2
30 m 40 km 9.9 m/s 30 m 40 km 9.9 m/s
Since 1959 Prognos has advised decision makers in politics, business and society. Our objective analyses, substantiated projections and critical assessments help identify and evaluate options for the future.
Our experts in Basel, Berlin, Bremen, Brussels, Dusseldorf, Munich and Stuttgart equip corporations, the public sector and international organisations with a practiceoriented framework for reaching decisions and developing strategies.
Prognos AGGoethestraße 8510623 BerlinGermanyTelephone +49 (0)30 52 00 59210Fax +49 (0)30 52 00 59201EMail: [email protected]
Member of the board and CEO:Christian Böllhoff
Authors:Jens HobohmLeonard KrampeFrank Peter
Press contact:Prognos AGGoethestraße 8510623 BerlinGermanyTelephone +49 (0)30 52 00 59222EMail: [email protected]
Commissioning entity:The German Offshore Wind Energy FoundationCEO: Andreas WagnerOldenburger Str. 6526316 VarelGermanyTelephone +49 (0)4451 95 15161EMail: info@offshorestiftung.dewww.offshorestiftung.de
The Fichtner Group is a leading ownermanaged international engineering and consultancy enterprise active in the energy sector. Fichtner provides planning and consultancy services for construction and operation of energy generation plants and energy networks. Within the Fichtner Group, Fichtner Management Consulting AG is the center of excellence for management consultancy. Specifically for offshore wind energy, Fichtner together with a partner company, KED, has established a center of excellence in Hamburg.
Fichtner GmbH & Co. KGSarweystraße 370191 StuttgartGermanyTelephone: +49 (0)711 89 950Fax: +49 (0)711 89 95459Email: [email protected]
Managing Director and CEO: Georg Fichtner (Chairman)Hermann BayerleinRalf EppingMansour HamzaHans KalbRoland PrögerDr. Andreas Weidler
Authors:Andree GerkenPeter HeinrichMaik Richter
Translation: Dörte MüllerEMail: [email protected]
Titl
e pi
ctur
e: C
onst
ruct
ion
site
of t
he o
ffsh
ore
win
d fa
rm R
iffg
at
Phot
o ©
: EW
E/M
atth
ias
Ibel
er